Article

Long-Term Conservation Agriculture Influences Weed Diversity, Water Productivity, Grain Yield, and Energy Budgeting of Wheat in North-Western Indo-Gangetic Plains

1
Division of Agronomy, ICAR-Indian Agricultural Research Institute, New Delhi 110 012, India
2
Division of Agricultural Physics, ICAR-Indian Agricultural Research Institute, New Delhi 110 012, India
3
Division of Soil Science and Agricultural Chemistry, ICAR-Indian Agricultural Research Institute, New Delhi 110 012, India
4
Water Technology Centre, ICAR-Indian Agricultural Research Institute, New Delhi 110 012, India
5
ICAR-Indian Agricultural Statistics Research Institute, New Delhi 110 012, India
*
Author to whom correspondence should be addressed.
Sustainability 2023, 15(9), 7290; https://doi.org/10.3390/su15097290
Submission received: 19 December 2022 / Revised: 24 February 2023 / Accepted: 2 March 2023 / Published: 27 April 2023
(This article belongs to the Special Issue Agrifood Production and Conservation Agriculture)

Abstract

:
Wheat is grown in an area totalling 31.1 million hectares in India. The North-western Indo-Gangetic Plains (IGP) constitutes the major share of area and production of wheat in India and is known as the wheat belt of India. However, sustaining wheat production under declining/lower resource-use efficiency in the existing rice–wheat cropping system has led to considerations about diversifying this system with a pigeon pea–wheat system (PWS) in the IGP of India. However, little or no information is available on the impact of CA-based PWS on weed dynamics, productivity, profitability, and resource-use efficiencies. Therefore, we studied these aspects in wheat under a long-term (~12 years) conservation agriculture (CA)-based PWS. Treatments were conventional till flatbed (CT), ZT permanent narrow beds (PNBR & PNB), broad beds (PBBR & PBB), and flat beds (PFBR & PFB) with and without residue (R) retention and different N levels (75% and 100% of the recommended N). The results showed that the Shannon–Weiner index and the Simpson dominance index were higher under the CA system in 2021–2022 than in 2010–2011 and 2015–2016, indicating a change in weed diversity over the period. Furthermore, the Sorensen similarity index showed that there was not much difference in weed diversity for 2010–2011. However, in 2015–2016 and 2021–2022 respectively, only 89% (0.89) and 62% (0.62) of weed species were common to both CT and CA systems, indicating a shift in weed species in the long-term CA system in 2021–2022. Residue retention and N dose decreased weed density at 30 days after sowing (DAS). All the CA-based (PFBR100N, PBBR100N, PNBR100N, PFBR75N, PBBR75N, and PNBR75N) treatments reduced the weed density and dry weight compared to CT at 30 DAS. Wheat grain yield and net returns increased by 11.6–14.9% and 19.4–23.8% over CT in CA treatments, of which PFBR100N and PBBR100N were superior. The PBBR100N and PBBR75N systems had water productivity significantly higher than CT. Residue retention in ZT permanent beds reduced energy productivity in CA than CT and no residue treatments. In the 12th year, CA with 75% N (PFBR75N, PBBR75N, PNBR75N) resulted in a higher partial factor productivity of N and total NPK applied. Contrast analysis showed that 75% N was comparable with 100% N on crop, water, and energy productivities and 75% N was superior to 100% N on partial factor productivity of N and total NPK. Thus, the permanent broad bed with residue and 100% N in the initial years and 75% N in later years can be adopted in the north-western IGP for better weed suppression, higher yield, profitability, and resource-use efficiency.

1. Introduction

The rice–wheat cropping system (RWCS) is the most dominant in India, occupying around 10.5 million ha. The long-term practice of RWCS has resulted in a lower crop yield in the Indo-Gangetic Plains (IGP) [1,2]. Moreover, it has degraded soil physical properties and led to a loss of soil fertility due to the occurrence of multiple nutrient deficiencies [3,4]. The indiscriminate use of inorganic fertilizers, frequent irrigation and intensive tillage practices have caused significant soil health and environmental concerns. Consequently, policymakers and the government demand a suitable alternative cropping system to RWCS [2,5,6]. The recent development of extra-short-duration pigeon pea varieties such as ICPL 88039 (130–145), ICPL 85010 (125–130), ICPL 84031 (125–130), ICPL 87 (140–150), AL 201 (130–140), Pusa 855 (135–140), and Pusa Arhar 16 (120) have paved the way for the inclusion of pigeon pea as an alternative crop to rice in RWCS [2,7]. In addition, the inclusion of a legume (pigeon pea) would address the issues related to the decreased water table, low water-use efficiency (WUE), increased cost of rice cultivation, low nutrient efficiency, high infestation of weeds and pests, and deterioration of soil health [3,5,8,9]. Studies have reported a greater wheat crop yields under a pigeon pea–wheat cropping system (PWCS) compared to traditional RWCS in IGPs [2,7,10].
Conservation agriculture (CA) with interlinked three principles can lead to conservation of natural resources (soil, water), climate change adaptation and mitigation, and sustainable production [5,11]. Conservational agriculture is widely accepted because of its higher productivity, profitability, resource-use efficiency, and the overall health of the ecosystem. Globally, CA is adopted over an area of 205.4 million ha (M ha) in 102 countries, which corresponds to 14.7% of total cropland. In India, the area under CA increased from 1.5 M ha during 2013–2014 to 3.5 M ha in 2018–2019 [12]. The weed is one of the major constraints in both conventional till (CT) and zero till (ZT) systems, causing considerable yield and quality losses. The absence of tillage under CA system may influence the time and duration of weed emergence and pose a greater to farmers transitioning from the CT to the ZT system. Zero till conditions, due to lack of tillage practice, retain the majority of weed seeds in surface soil, but CT spreads weed seeds across soil layers through tillage. Germination of weed seeds requires light, which is restricted in the CA system [13]. The majority of weeds in the CA system are small-seeded species, so seedling recruitment is more from the top soil layer [14,15]. Furthermore, weed species shift from annual to perennial and large-seeded to small-seeded broad-leaved weeds were noticed under long-term ZT systems [16,17]. In these circumstances, the selection of suitable herbicides is essential for efficient weed management. In addition to this, the adoption of practices such as stale seedbed, proper sowing time and geometry, crop residue retention, increased seed rate, competitive crop cultivars, and crop rotation would be useful to achieve a better weed control in CA system [13]. Effective weed management strategies can thus be formulated by integrating the above practices for efficient management of weeds in CA system.
Long-term intensive tillage practices deteriorate soil structure, destroy soil macroaggregates, and oxidize soil organic carbon [5,18]. On the other hand, a lack of soil disturbance could retain soil structure and aggregates, sequester organic carbon, enhance soil fertility, and improve the overall system productivity under ZT system [19,20,21]. Zero tillage based permanent raised bed system also improves soil health and conserves resources such as water and nutrients [6,22]. Zero tillage maintains surface roughness, conserves soil structure, promotes biopores (from earthworms and dead roots), thereby improving soil hydraulic properties resulting in higher soil moisture storage [23,24]. Zero tillage-based raised-bed systems maintain better soil moisture regimes compared to those under CT and flat beds and result in better root growth and biomass accumulation [25]. Residue cover in CA helps in retaining more soil moisture [19] by reducing soil evaporation [26] and results in lower irrigation requirement [27] and improved water productivity [6,28]. Lateral water movement from furrows and also upward into beds through evaporation and capillary action is useful to avoid nutrient and water losses through deep percolation. Moreover, the bed planting system allows closer placement of the nutrients in the root zone of the crop and ultimately gives a competitive edge over weeds as well as higher nutrient-use efficiency [29]. Conservation agriculture omits the intensive land preparation operations and allows timely sowing of wheat. Due to minimal tillage operations, diesel requirement and electricity usage in tillage and irrigation are reduced substantially. Continual retention of crop residues, minimal traffic, and efficient use of water and nutrients lead to low energy and input requirements. As a result, the ZT system requires substantially less energy and cost than the CT [30,31].
However, very limited studies are available on the impact of CA practices on weed dynamics, productivity, profitability, and use efficiencies of water, energy, and nutrients in wheat under the pigeon pea–wheat system. Therefore, a study was initiated with the following hypothesis that (i) a CA-based permanent bed (narrow, broad, or flat) planting with residue retention will alter weed population dynamics more than CT, and (ii) a CA-based system with residue retention will result in higher water and nutrient-use efficiency, and higher crop productivity than CT. The objectives of this study were: (i) to evaluate the effect of tillage, crop residue retention and N application on weed interference in wheat; and (ii) to assess the crop productivity, profitability and resource-use efficiency under CA and different N management systems.

2. Material and Methods

2.1. Experimental Site and Weather Conditions

The research was conducted in an on-going long-term tillage experiment (initiated in 2010) at the ICAR-Indian Agricultural Research Institute, New Delhi, India (28°35′ N, 77°12′ E and 228.6 m above the mean sea level) during the winter (rabi) season in 2021–2022. Weed count, diversity, and crop yield of past years (2010–2011 and 2015–2016) were used to compare the weed diversity change and shift, in addition to grain yield over the period of study. The study site is located in a semi-arid and subtropical region with harsh winters (minimum temperature of 2 °C to 4 °C) and hot summers (maximum temperature of 40 °C to 45 °C). Annual mean rainfall is about 710 mm and most is monsoon based. The weekly average weather data during the wheat crop cycle (from November 2021 to April 2022) of the location (Figure 1) indicate that the rainfall was 181.5 mm, distributed mostly in December, January and February.

2.2. Soil Characteristics

To estimate the soil physical and chemical properties; the soil samples were collected using a soil auger before the sowing of the wheat crop in November 2021. Samples were randomly collected (3 per treatment) from 0–15 cm soil depth. Soil physical and chemical properties greatly varied across the treatments due to the long-term effect (~12 years) of tillage practices. Soil type of the study was a sandy clay loam (sand 48%, silt 24%, and clay 28%) with pH 8.10–8.36, electrical conductivity (EC) 0.22–0.29 dS/m, organic carbon 6.5–9.7 g/kg [32], N 253.7–291.7 kg/ha, phosphorus (P) 73–95 kg/ha and potassium (K) 436.2–599.8 kg/ha.

2.3. Treatments/Experiment Details

The experimental units were arranged in a randomized complete block design (RCBD) with 10 treatments. All experimental units were replicated three times. Treatments were conventional till flatbed (CT), ZT permanent narrow beds with and without residue/R (PNBR & PNB), broad beds with and without residue (PBBR & PBB), and flat beds with and without residue (PFBR & PFB). Further, the residue retention treatments of narrow (PNBR), broad (PBBR) and flatbed (PFBR) were supplemented with 75% and 100% of the recommended dose of N for wheat (i.e., PNBR75N, PNBR100N; PBBR75N, PBBR100N; PFBR75N, PFBR100N) during 2021–2022. The plot size was 9.0 m × 8.4 m (75.6 m2). The PNB and PBB had 12 and 6 raised beds, respectively. The size of the PNB was 40 cm wide for the bed and a 30 cm-wide furrow, accommodating three wheat rows. In total, 36 rows of wheat (wheat variety HD 3117 was sown on 23.11.2021) were used on 12 narrow beds (with spacing 14 cm between rows in each narrow bed). The size of PBB was 110 cm wide bed and 30 cm wide furrow and accommodated five wheat rows. Totally, 30 rows of wheat on 6 broad beds with 20 cm row-space in each PBB treatment. In the CT and PFB plots, 42 rows of wheat were accommodated with 20 cm row-space. A turbo seeder was used to sow wheat in PBB/PBBR, PFB/PFBR plots, a bed planter was used to sow wheat in PNB/PNBR plots, and a seed drill was used to sow wheat in CT plots. Nutrients were applied at the time of sowing through a turbo seeder (attached fertilizer applicator) and seed cum fertilizer drill. Under residue retention plots, anchored pigeon pea stalk residues of 60 cm height cut manually during harvesting for grain yield were retained. In addition, a considerable amount of leaf litter was present. In contrast, the entire pigeon pea crop residue was removed from the no-residue and CT plots.

2.4. Agronomic Management

The prescribed rate of nutrients was applied respectively to 100% and 75% N treatments (N 150: P 26: K 33 and N 113: P 26: K 33 kg ha−1). At the basal 1/3, N and full doses of P and K were applied and the remaining 2/3rd N was top-dressed (urea) in two equal splits at 30 days after sowing (DAS) and 70 DAS. A need-based application of glyphosate was made at 1.0 kg a.i. ha−1 at 7–8 days prior to sowing of wheat in CA treatments [33]. Weed management was achieved by tank-mix application of clodinafop-propargyl 0.06 kg a.i. ha−1 + metsulfuron-methyl 0.005 kg a.i. ha−1 at 30 DAS [34].

2.5. Biometric Observations Recorded

2.5.1. Weed Counts and Biomass

To evaluate the changes in weed flora under CT and CA-based systems, the data on weed count and dry biomass (i.e., species-wise, and category-wise) were collected at 30 DAS. A fixed quadrate with a size of 1 m × 1 m was randomly placed per replication and three per treatment in total. These quadrates are free from herbicide application. Periodically the counted weeds were kept in an oven for drying at 65 °C until to attain constant weight. Weed count and dry weight were used to estimate the density and biomass per unit area (m2). The data on species-wise weed density of past years (2010–2011 and 2015–2016) were collected to compare the weed diversity change and shift over the period of study.

2.5.2. Diversity Analysis of Weeds

To know the long-term impact of conservation tillage practices on the weed diversity the following indices such as weed population diversity (Shannon–Weiner index), species dominance (Simpson index), and species similarity (Sørensen similarity index) were estimated using the open-source software “PAST” and equations are (Equations (1) to (3)).
Shannon–Weiner index [35]:
    H = [ p i   ln   p i ]
where H: the species diversity index; pi: the proportion of the species; i: total number of species.
Simpson index [36]:
D = [ 1 n i ( n i 1 ) N ( N 1 ) ]
where ni: the number of individuals of species; i and N: the total number of individuals in a sample.
The Sørensen similarity coefficient (S) was calculated as [37]:
S = [ 2 C A + B ]
where A and B: the number of species in CT and CA, respectively; C: the number of species present in both CT and CA.

2.5.3. Wheat Yield and Net Returns

For estimating grain and straw yield, wheat crop from the net plot area of 5 m2 (for flatbed) and 7 m2 (for raised bed), which constituted of 10 wheat rows, was harvested manually and threshed after sun-drying for three days. Grain samples were taken from the bulk of harvested grains to calculate the moisture content (12% moisture) and then the final yield was adjusted. The budgeting of crop cultivation was conducted on the basis of current price of inputs and outputs. Net returns were calculated using the Equation (4):
Net returns (INR/ha) = (Gross returns − total cost of cultivation)

2.5.4. Water Productivity/Use Efficiency

The effective rainfall amount retained in the crop root zone was determined using the standard method given by FAO [38]. The daily rainfall data of the study site were collected from a meteorological observatory of our research station (400 m away). The digital star flow meter (estimates the water velocity/flow rate (m/s)) and wetted area (m2) of the field channel [6] were used to determine the quantity of irrigation water to be applied. Based on the irrigation water depth requirement (m3) and water channel discharge (m3/s), the timings for running the irrigation water in each treatment plot were determined during each irrigation period. Before the irrigation, a rating curve was generated to show the relationship between water flow discharge and depth in the irrigation channel. Then, an exponential equation was developed. Total water applied includes effective rainfall and irrigation water. Total water productivity (kg grain/ha/mm of water) was calculated following Equation (5) [6,27].
Total water productivity (kg/ha/mm) = [Grain yield (kg/ha)/Total water applied (mm)]

2.5.5. Energy Auditing

Energy-use indices were analysed as per [31,39,40]. Energy auditing of all the inputs was estimated based on the input energy consumed by operations such as crop residue retention, land preparation and seeding, nutrient and irrigation application, crop protection, harvesting and threshing, and other operations using their respective energy equivalences described by [31,39,40] (Table 1). Similarly, wheat grain and straw yields were converted to energy (MJ/ha) and their values were summed up to total energy output. Energy productivity, energy biomass productivity, and energy ratio/use efficiency were calculated following Equations (6)–(8).
Energy   productivity   ( kg / MJ ) = Grain   yield   ( kg / ha )   Total   input   energy   ( MJ / ha )
Energy   biomass   productivity   ( kg / MJ ) = Biomass   yield   ( kg / ha ) Total   input   energy   ( MJ / ha )  
Energy   ratio / use   efficiency   ( MJ / MJ ) =   Total   output   energy   ( MJ / ha )   Total   input   energy   ( MJ / ha )

2.5.6. Partial Factor Productivity (PFP) of Major Nutrients

The PFP of major nutrients (N, P, K, and their combination) was estimated by dividing the data on wheat grain yield (kg/ha) with the total amount of major nutrients individually applied and in total (NPK kg/ha). The PFP was subjected to contrast analysis to carry out pair-wise comparison between CT and CA, residue and no residue, and 75 N and 100 N applied in this experiment.

2.6. Statistical Analysis

All the collected data have been subjected to the analysis of variance (ANOVA) using an open-source software “OPSTAT” [41]. The normality check of all the periodical weed density and biomass data failed (Shapiro-Wilk test, p < 0.05); therefore, before the ANOVA analysis, all the weeds data were square-root ( x + 0 . 5 ) transformed [42]. The treatment significance was tested using the Fishers test (~F value) at p = 0.05. The Tukey’s HSD test was performed as a post-hoc test to see the mean difference between the treatments (p = 0.05). The contrast analysis of a few important crop variables was performed for pair-wise comparison of treatments.

3. Results

3.1. Weed Diversity and Interference

3.1.1. Weed Density and Dry Weight

Major weed flora in the experimental wheat field comprised of Phalaris minor Retz. (grassy weeds); Chenopodium album L., Coronopus didymus L., Malva parviflora L., Melilotus indicus L., Parthenium hysterophorus L., Sonchus oleraceus L., Spergula arvensis L., (broad-leaved weeds); and Cyperus esculentus L. (sedge). Weed density was significantly influenced by CA-based tillage, residue, and N (TRN) management practices at 30 DAS (Table 2). Grassy weed density was significantly lower in PFBR75N and PFBR100N but higher in PNB (without residue). Broad-leaved weeds (BLW) and sedge densities were significantly higher in CT. Hence, total weed density was significantly higher in CT and lowest in permanent flat bed and residue with 75% N (~PFBR75N) or 100% N (~PFBR100N). The PFBR75N and PFBR100N led to 89.7% and 87.3% reduction in weed density, respectively compared with CT. Conventional tillage had highest weed population, but PNB showed highest weed dry weight, which was 23.2% higher than CT. Compared with CT, PFBR75N and PFBR100N led to reduction in weed dry weight by 78.6% and 81.6%, respectively (Table 2). Dry weights of BLW and sedge were significantly higher in CT. The PNBR75N and PNBR100N resulted in the lowest sedge weed dry weight, but PFBR100N led to the lowest grassy, broad-leaved and total weed dry weight.
Species-wise mean weed density (of 2010–2011, 2015–2016, and 2021–2022) also differed significantly between CT and CA (Figure 2). Chenopodium album, C. didymus, C. esculentus, M. indicus, P. minor, S. oleraceus, and S. arvensis were found significantly higher in CT. Conservation agriculture had significantly higher densities of M. parviflora, and P. hysterophorus. Chenopodium album and S. oleraceus densities were considerably higher in 2010–2011 (Figure 3). Melilotus indicus and P. minor had comparable densities between 2010–2011 and 2015–2016. Coronopus didymus population was considerably higher in 2015–2016, whereas C. esculentus, P. hysterophorus, and M. parviflora were significantly higher in 2021–2022. Tillage × year interaction revealed that the densities of P. minor and C. album in CT were comparable between 2010–2011 and 2015–2016 and higher than in 2021–2022 (Table 3). However, in CA, their populations gradually decreased from 2010–2011 to 2021–2022. Coronopus didymus and M. indicus had significantly higher densities in 2015–2016 than 2010–2011 and 2021–2022 in CT. However, their populations were lower in CA than CT in all these years. Sonchus oleraceus had highest population in 2010–2011 in both CA and CT, but was absent in 2015–2016 and again appeared in 2021–2022. Malva parviflora and P. hysterophorus were absent in CT and CA in all three years except 2021–2022 when they were found only in CA plots. Similarly, C. esculentus was absent in 2010–2011 and 2015–2016 in both CA and CT, but appeared in 2021–2022 with a considerable density, particularly in CT.

3.1.2. Weed Species Diversity

Weed species diversity was estimated by the Shannon–Weiner index and Simpson index, while weed species similarity was determined by the Sørensen similarity index. Both the Shannon–Weiner index and Simpson index revealed similar trends in weed diversity. They indicated that the CA system had higher weed diversity than CT in 2010–2011 and 2020–2021 (Table 4), but the reverse was true in 2015–2016. The Sørensen similarity index showed that 100%, 89% and 62% of the weed species were similar between CT and CA in 2010–2011, 2015–2016, and 2021–2022, respectively. These clearly indicated that a shift in weed species through the emergence of new weed species had taken place from 2010 to 2022, more particularly in CA than CT.

3.2. Wheat Productivity and Profitability

CA-based systems led to significant improvement in the grain and straw yield of wheat and net returns. Residue retention treatments were superior to no-residue treatments in this regard (Table 5). The ZT permanent bed systems with or without residue led to an improvement in wheat grain yield by 8.1–14.9% over CT. Among them, PFBR100N and PBBRN100N had significantly higher grain yield (5.37, 5.33 t/ha), but all other ZT practices (PNBR100N, PFBR75N, PBBR75N, PNBR75N, PFB, PBB, PNB) were comparable with it. Contrast analysis of wheat grain yield showed that among ZT practices, residue retention treatments outperformed the treatments without residue; and 75 N was comparable with 100 N on wheat grain yield, indicating a saving of 25% N in wheat (Table 5).
Wheat grain yields of 2021–2022, when compared with that of 2010–2011 [2], revealed that CT gave 4.7% lower yield, but ZT treatments showed 3.8–15.2% higher yield than those in 2010–2011 (Figure 4). Furthermore, CT indicated a 2.8% yield increase in 2015–2016 than 2021–2022, whereas ZT showed a −3.8–6.0% variation in yield. Among CA practices, PNBR100N showed the highest (15.2% and 4.4%) increase in yield over that in 2010–2011 and 2015–2016, respectively. CT wheat incurred a higher cost than ZT permanent-bed systems with and without residue which, in contrast, registered 19.4–23.8% higher net returns than the CT system. CA-based practices with residue retention resulted in higher costs but were found to be superior in terms of net returns. All the ZT practices with and without residue were comparable with each other and resulted in significantly higher net returns (89.5 × 10³ –2.8 × 10³ INR/ha) than CT.

3.3. Resource-Use Efficiency

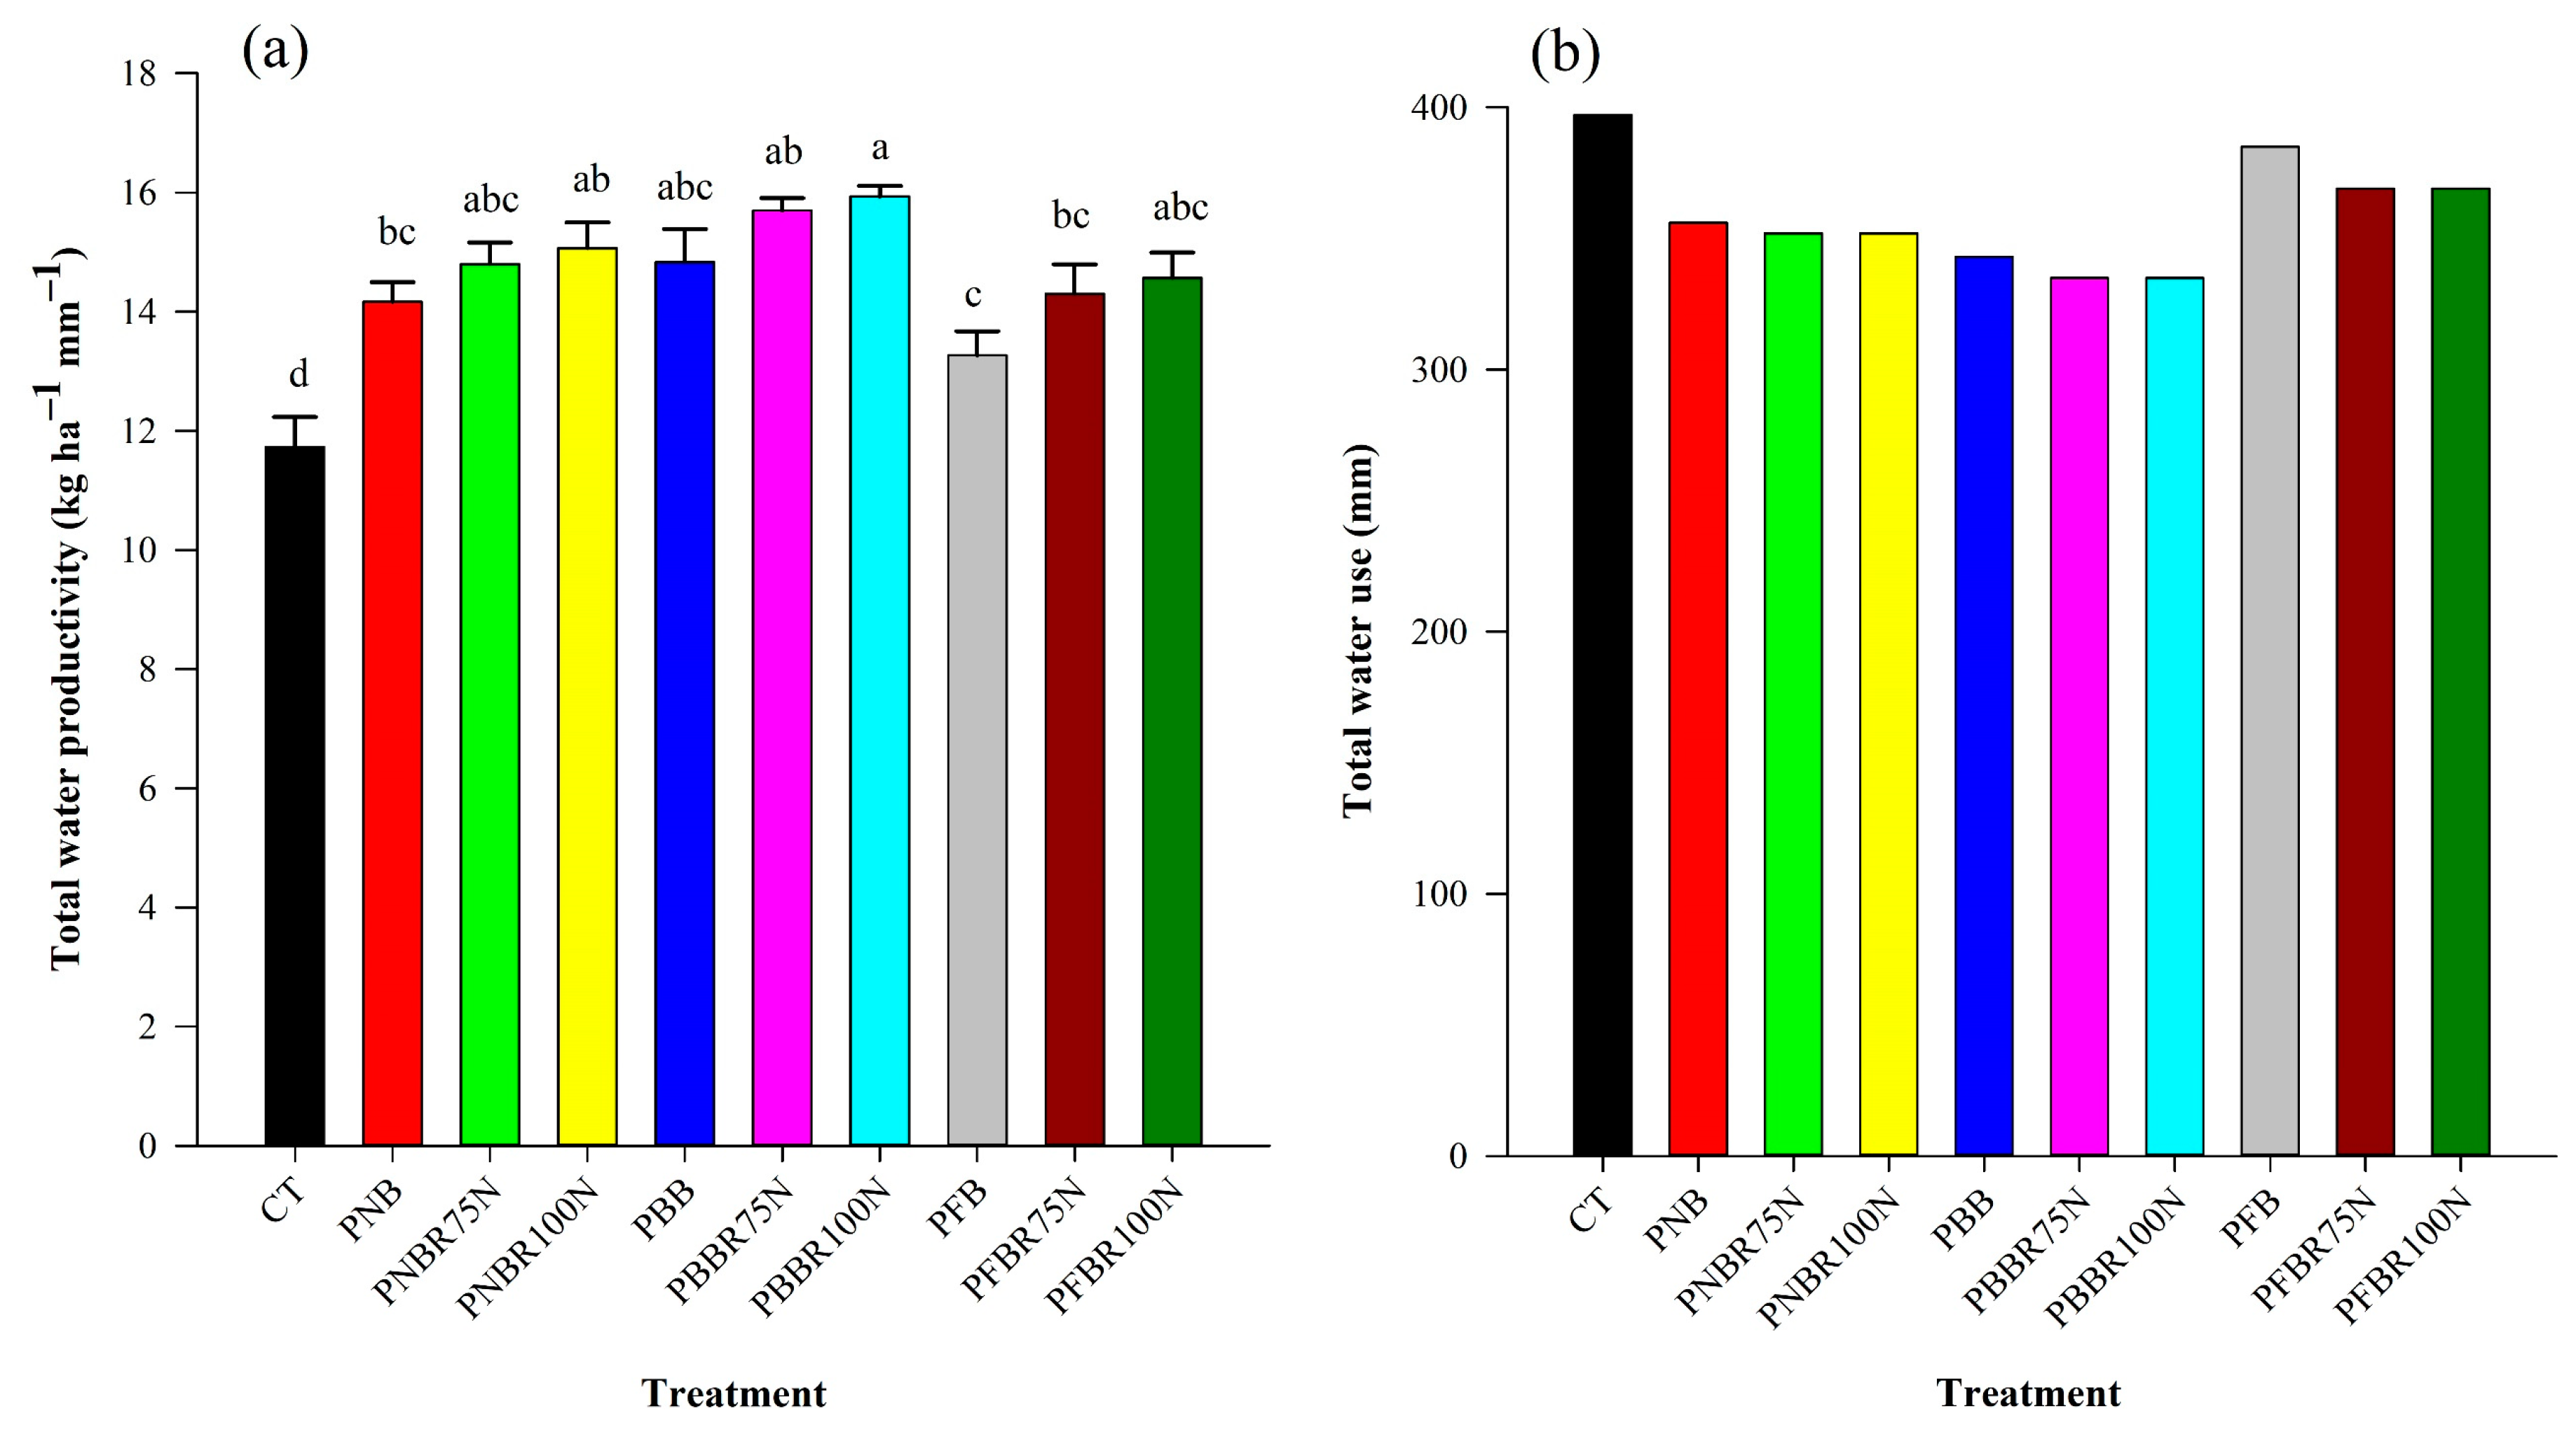
3.3.1. Water Productivity/Use Efficiency

The TRN management practices led to variation in the water productivity of wheat (Figure 5a). Among the ZT permanent-bed practices, the treatments with residue retention consumed less water than treatments with no residue. The CT practice had highest total water use (397 mm). CA-based practices with residue registered 8.0–15.6% lower total water use than CT (Figure 5b). Among them, PBBR100N registered the lowest water use (335 mm) and had 15.6% lower water use than CT. Average total water use in this treatment (335 mm) totalled 97 mm effective rainfall and 238 mm irrigation water. This treatment resulted in significantly higher total water productivity (of 35.9%) than CT, but was comparable with PBBR75N, PNBR100N PBB, PNBR75N and PFBR100N. Contrast analysis of total water productivity revealed the superiority of CA over CT; and the effect of 75 N and 100 N was comparable (p > 0.05). Furthermore, it implied that residue retention outperformed residue removal treatments, and ZT, irrespective of residue retention, was superior to CT (p < 0.001).

3.3.2. Energy Productivity/Use Efficiency

Total input and output energy for wheat cultivation varied due to different TRN management practices (Table 6). The ZT practices without residue (~PNB, PBB, PFB) had lower input energy than those with residue (~PNBR, PBBR, PFBR with 75 and 100% N) and CT. Among them, the PBB consumed the lowest input energy, which was 14.9% lower than in CT. The PFBR100N required the highest input energy. The 100% N application led to marginally higher input energy than 75% N. The CA-based practices (i.e., ZT permanent beds with residue) gave significantly higher output energy than ZT without residue and CT. PFBR100N resulted in significantly higher output energy (by 14.1%) than CT (Table 6). PBB (without residue) registered significantly higher energy productivity (0.29 kg/MJ), energy biomass productivity (0.71 kg/MJ) and energy ratio/energy-use efficiency (9.86), and was comparable with PNB and PFB. The CA-based residue retention practices led to lower energy productivity than ZT without residue and CT. Contrast analysis also showed that the effect of 75% N and 100% N on energy indices were comparable (p > 0.05).

3.3.3. Partial Factor Productivity of Nutrients

The nutrient-use efficiency (NUE) in terms of partial factor productivity (PFP) of nutrients (N, P, K and NPK) varied significantly between the treatments. Contrast analysis (Table 7) showed the superiority of CA over CT (by 28% and 25.6%), residue retention over residue removal (by 6.7% and 15.4%), and 75 N over 100 N (by 23.7% and 16.6%) for factor productivity of N, and NPK (p < 0.001), respectively. The lowest PFP of N, P, K and NPK was recorded in CT. The ZT permanent beds with and without residue led to considerably higher PFP of these nutrients than CT, and residue retention was found to be superior to residue removal. However, 75 N and 100 N application did not differ significantly with respect to the partial factor productivity of P and K (p > 0.05).

4. Discussion

4.1. Effect on Weed Interference

The CA-based ZT permanent beds, such as the permanent flat bed, permanent broad bed, and permanent narrow bed with residue retention treatments, were superior in reducing the densities of grassy, broad-leaved, sedge, and total weeds compared to their respective residue removal treatments. These practices/treatments could also effectively reduce the emergence of Cyperus esculentus in wheat, which was highly dominant and had significantly higher density under CT. Our close observation reveals that although C. esculentus is a perennial sedge like Cyperus rotundus, it differs profusely from C. rotundus. It displays growing tendency like annuals, germinates in thousands/lakhs, and can grow under very dense, over-crowded situations. Its propagating structures are small seed-like tubers having less or no dormancy, which germinate instantaneously under slight disturbance/stirring of soil. Its tuber also varies in shape, size from that of C. rotundus. In CT practice, regular tilling operations might have favoured its frequent germination and profuse tuberization. Otherwise, as usual, CT is dominated by annual weeds and CA will have more problems with perennial weeds over time. The reverse could happen here, probably, because of behavioural differences in this perennial weed C. esculentus. Furthermore, a higher transition period temperature from the rainy to the winter season, and higher soil temperature and porous surface/top soil due to frequent tillage under CT might have aggravated the emergence of C. esculentus in CT. On the contrary, the retention of crop residue in CA-based treatments might have suppressed C. esculentus resulting in its lower infestation [43]. Additionally, glyphosate application 1.0 kg a.i./ha in ZT practice over the years during the short fallow period might have suppressed/killed C. esculentus tubers. CT practice also had higher broad-leaved, sedge, and total weed densities, and grassy weed infestation in CT and ZT without residue treatments was comparable. The findings of [44,45] corroborated our results. Anchored crop residue on the soil surface restricts light and acts as a physical barrier to germination of many weed species and may arrest some physicochemical changes in soil environment for weed seed emergence [46]. In addition, ZT systems with crop residue had periodic sparse emergence of weeds, which could prolong the period of weed emergence [47]. This facilitated the crop in acquiring a competitive edge over weeds, reducing the need for weed management. As a result, category-wise and total weed densities were considerably lower in these treatments when compared to their respective residue removal treatments and CT. In contrast, tillage created more favourable conditions for weed seed germination in CT [48]. The PFBR75N and PFBR100N were superior in reducing overall weed density and dry weight of weeds because of more uniform residue cover compared to broad-bed and narrow-bed treatments. Further, ZT systems provided equal chance to all weed seeds to emerge because of unbiased weed seed deposition on the soil surface, leading to exhaustion of the seed bank in the long run. Furthermore, weed seed predation in CA aggravated this process [49]. However, reshaping practice in permanent bed treatments disturbs the furrow soil to certain extent and exposed furrow space between the beds thus allows the lower soil layer seed bank to emerge. Therefore, permanent raised bed treatments resulted in slightly higher weed infestation than permanent flat beds and ZT without residue treatments such as PNB and PBB, which, in contrast, had higher weed dry weight due to more grassy and broad-leaved weeds. Higher density of small-seeded annual weeds including Malva parviflora and Parthenium hysterophorus in ZT treatments than CT at later growth stages might due to be good seed-to-soil contact under decomposing residue and rapid recruitment of these small-seeded annuals on the soil surface through various means [15]. Refs. [50,51] demonstrated that adoption of ZT practices could alter weed population dynamics, including species diversity, richness, and weed seed bank distribution. We observed a similar phenomenon in this study. The Sørensen similarity index decreased consistently from 2010–2011 to 2021–2022, which could indicate weed flora shift in this study. Furthermore, the Shannon–Weiner index and Simpson index revealed higher weed diversity in CA than CT in 2021–2022, which might have occurred due to weed flora shift and altered weed seed bank composition [17].

4.2. Effect on Wheat Productivity and Profitability

As usual, there were variations in wheat yield over the years. The trend in the treatment performance also remained more or less similar. The prevailing environment played a role; otherwise, the agronomic management was same for all the years. The loss of moisture from soil surface through evaporation is faster in tilled soils, resulting in poor germination, uneven crop plant stands and reduced crop development and yield [52]. This study showed that six rows of narrow bed planted (PNB) wheat and five rows of broad bed planted (PBB) wheat could produce comparable yield with seven rows of flatbed planted (PFB) wheat. Wheat yields were comparable under the ZT bed planted treatments but higher than that in CT, even with a lower number of wheat rows. It could be attributed to increased photosynthesis and efficient translocation of photosynthates as well as larger sink [45], better tillering, higher grains/spike in bed planted treatments [53], reduced lodging [54] and better weed suppression. Similarly, wheat yield under 75 N and 100 N treatments was comparable, irrespective of land configuration (narrow, broad or flat beds). The surface residue retention over the years (around 110–120 t/ha residue in 11 years) led to higher organic matter accumulation and build-up of nutrients in the top soil layers compared to CT [55,56]. The inclusion of pigeon pea as a legume component in this CA-based crop diversification could augment the N reserve in soil and reduce N requirements [57]. This also indicated savings in N under CA practices without compromising yields. The CA-based practices with and without residue retention registered 19.4–23.8% higher net returns. The higher cost in CT was mainly due to expenses for tillage for land preparation. Residue retention treatments incurred higher costs due to the cost of residue. The higher cost of cultivation (by 3.1–15.8% over ZT) coupled with lower wheat yield resulted in lower net returns in CT plots, whereas CA treatments compensated for the higher cost with higher yields.

4.3. Effect on Water, Energy, and Nutrient-Use Efficiency

In CA-based PBBR100N, lower water use by 15.6% could increase water productivity by 35.9% compared to CT. Das et al. [5] reported from a similar CA-based cotton-wheat system that the CA system had 14% lower water consumption in wheat and 30% higher water-use efficiency than CT plots. Bhushan et al. [27] observed a 30–40% saving in irrigation water and 20% higher wheat yield under CA, leading to higher irrigation water use efficiency. Under PBBR, broad bed with residue retention resulted in lower evaporation from soil and improved availability of nutrients [58,59], which might play roles for higher water productivity. ZT can improve soil structure, which may facilitate water retention, improve infiltration and lower total water usage [60]. Higher root length, mass and volume density under the PBBR100N and PBBR75N treatments could efficiently extract water from the soil that reduced irrigation water use. In addition, permanent beds favoured movement of water at a faster rate and increased its uptake, resulting in savings of irrigation water [5,61]. Residue retention plots had higher water productivity than no-residue plots, mainly because of lower irrigation water use, resulting from lower evaporation and higher moisture conservation, and higher productivity [6].
Input energy consumption was highest under PFBR100N. Residue has implications for energy, and, therefore, all ZT permanent beds with residue retention incurred higher input energy than their respective no-residue plots and CT. In many developing countries, including India, crop biomass/residues are taken from the field and stored/used for daily cattle feeding, house thatching, domestic fuel, etc. Furthermore, alternate uses such as the production of bioethanol and biochar, mushroom cultivation, packaging materials for fruits and vegetables and glass & ceramic industries are also creating a huge market for crop residues wherever applicable. Therefore, crop residue energy was included in input energy here. However, crop residue retention in fields renders huge ecosystem services depending on the crop, climate, soil, and mechanization level, which should be highlighted more, and the energy perspective of the crop residue may be ignored. Then, energy indices like energy productivity, energy-use efficiency, etc. would be astoundingly higher in all CA plots with residue than their respective no-residue plots and CT. As such all ZT permanent beds with and without residue would have very low input energy as if PBB registered 14.9% lower input energy than even CT. Having a higher N dose and slightly higher residue retention, 100 N resulted in higher input energy than 75 N. Crop residue constituted 67.6–70.9% of total energy input in CA-based residue retention treatments [31]. However, the CA-based practices with residue retention outperformed CT as well as CA-based residue removal treatments in terms of output energy, which was higher due to higher crop productivity. However, the energy productivity, energy biomass productivity, and energy ratio (~energy-use efficiency) were lower in CA-based residue retention treatments due to the large quantity of energy invested through crop residues, which increased input energy. In this study, ZT reduced diesel energy use by 70.6% and saved diesel by ~36 litres/ha. Erenstein and Laxmi [62] estimated a seasonal savings of diesel for land preparation under ZT ranging from 15–60 litres/ha, or an 81% saving over CT.
CA-based practices with residue and 75 N registered significantly higher PFP of N and NPK than their respective 100 N treatments and CT. The N use reduced by 25% under 75 N, and similar yield under 100 N and 75 N treatments were responsible for higher N-use efficiency in 75 N treatment. Besides, the gradual build-up of organic matter over time [63] and reduced erosion losses [56] might reduce N fertilizer requirement under CA. Singh et al. [64] observed similar higher agronomic efficiency of N in wheat under residue retention was associated with either a lower rate of fertilizer N or increase in grain yield.

5. Conclusions

This study showed that both conventional agriculture/tillage (CT) and conservation agriculture (CA) over a period of 12 years witnessed a gradual shift in weed species, which became more prominent in the 12th year (2021–2022). Weed species diversity was higher in CA than CT after 12 years of the experiment. Wheat grain yield decreased over the years (2010–2011, 2015–2016, 2021–2022) in CT, but increased under the ZT permanent beds with residue retention. The CA-based ZT permanent narrow, broad, and flat beds with residue retention irrespective of N dose (~PFBR100N, PBBR100N, PNBR100N, PFBR75N, PBBR75N, and PNBR75N) brought about significant increase in wheat grain yield by 11.6–14.9% and net returns by 19.4–23.8% over CT through concurrent reduction in weed interference (density, dry weight). Among CA-based practices, ZT permanent flat bed with residue (PFBR100N) and broad bed with residue (PBBR100N) along with 100% N application gave comparably higher yields, but PBBR100N resulted in a higher water productivity, energy productivity, and energy-use efficiency/ratio. CA had lower energy productivity, energy-use efficiency than CT since crop residue energy constituted a considerable share in input energy. Continuous CA (PFBR, PBBR, PNBR) adoption for 12 years could build up enough N in soil, which led to reduce N application by 25% since this study showed that 75% N gave a comparable wheat yield but higher partial factor productivity of N and NPK than 100% N under CA. A build-up of N was gradually observed in the CA system with residue retention because of the immobilization of N, thus, initially 100% N dose may be recommended for achieving the acceptable crop yield, and later the dose can be reduced. Hence, ZT permanent broad bed with residue and 100% N in the initial years and 75% N later may be adopted in the IGP of India for better weed suppression, higher yield, profitability, and resource-use efficiency.

Author Contributions

Conceptualization, T.S. (Tarun Sharma), T.K.D., P.P.M., S.B. (Sunanda Biswas), S.S. (Susama Sudhishri), T.S. (Teekam Singh) and A.K.P.; Methodology, T.K.D., S.S. (Susama Sudhishri), T.S. (Tarun Sharma); Formal analysis, T.S. (Tarun Sharma); Investigation, T.S. (Tarun Sharma); Resources, T.K.D.; Data curation, T.K.D., P.G., S.S. (Suman Sen), A.R., S.B. (Subhash Babu) and N.R.; Writing—original draft, T.S. (Tarun Sharma); Writing—review & editing, T.S. (Tarun Sharma), T.K.D., P.P.M., S.B. (Sunanda Biswas), S.S. (Susama Sudhishri), P.G., R.R., S.S. (Suman Sen), T.S. (Tarun Sharma), A.K.P., A.R., S.B. (Subhash Babu) and N.R.; Supervision, T.K.D.; Project administration, T.K.D. All authors have read and agreed to the published version of the manuscript.

Funding

This research received no external funding.

Institutional Review Board Statement

Not applicable.

Informed Consent Statement

Not applicable.

Data Availability Statement

Our Organization does not allow original data to be shared due to privacy and ethical grounds.

Acknowledgments

The authors gratefully acknowledge the necessary services and supplies received from the Division of Agronomy, Division of Agricultural Physics, Division of Soil Science and Agricultural Chemistry, and Water Technology Centre, ICAR–Indian Agricultural Research Institute, New Delhi and ICAR-Indian Agricultural Statistical Research Institute, New Delhi.

Conflicts of Interest

The authors do not have any known competing interests that could influence the study reported in this manuscript.

References

  1. Jat, M.L.; Dagar, J.C.; Sapkota, T.B.; Yadvinder-Singh; Govaerts, B.; Ridaura, S.L.; Saharawat, Y.S.; Sharma, R.K.; Tetarwal, J.P.; Jat, R.K.; et al. Climate Change and Agriculture: Adaptation Strategies and Mitigation Opportunities for Food Security in South Asia and Latin America. Adv. Agron. 2016, 137, 127–235. [Google Scholar] [CrossRef]
  2. Das, T.K.; Bandyopadhyay, K.K.; Bhattacharyya, R.; Sudhishri, S.; Sharma, A.R.; Behera, U.K.; Saharawat, Y.S.; Sahoo, P.K.; Pathak, H.; Vyas, A.K.; et al. Effects of conservation agriculture on crop productivity and water-use efficiency under an irrigated pigeonpea–wheat cropping system in the western Indo-Gangetic Plains. J. Agric. Sci. 2016, 154, 1327–1342. [Google Scholar] [CrossRef]
  3. Dwivedi, B.S.; Shukla, A.K.; Singh, V.K.; Yadav, R.L. Results of participatory diagnosis of constraints and opportunities (PDCO) based trials from the state of Uttar Pradesh. In Development of Farmers’ Resource Based Integrated Plant Nutrient Supply Systems: Experience of a FAO–ICAR–IFFCO Collaborative Project and AICRP on Soil Test Crop Response Correlation; Rao, A.S., Srivastava, S., Eds.; IISS: Bhopal, India, 2001; pp. 50–75. [Google Scholar]
  4. Gathala, M.K.; Kumar, V.; Sharma, P.C.; Saharawat, Y.S.; Jat, M.S.; Singh, M.; Kumar, A.; Jat, M.L.; Humphreys, E.; Sharma, D.K.; et al. Optimizing intensive cereal-based cropping systems addressing current and future drivers of agricultural change in the northwestern Indo-Gangetic plains of India. Agric. Ecosyst. Environ. 2013, 177, 85–97. [Google Scholar] [CrossRef]
  5. Das, T.K.; Bhattacharyya, R.; Sudhishri, S.; Sharma, A.R.; Saharawat, Y.S.; Bandyopadhyay, K.K.; Sepat, S.; Bana, R.S.; Aggarwal, P.; Sharma, R.K.; et al. Conservation agriculture in an irrigated cotton–wheat system of the western Indo-Gangetic Plains: Crop and water productivity and economic profitability. Field Crops Res. 2014, 158, 24–33. [Google Scholar] [CrossRef]
  6. Das, T.K.; Saharawat, Y.S.; Bhattacharyya, R.; Sudhishri, S.; Bandyopadhyay, K.K.; Sharma, A.R.; Jat, M.L. Conservation agriculture effects on crop and water productivity, profitability and soil organic carbon accumulation under a maize-wheat cropping system in the North-western Indo-Gangetic Plains. Field Crops Res. 2018, 215, 222–231. [Google Scholar] [CrossRef]
  7. Dahiya, S.S.; Chauhan, Y.S.; Johansen, C.; Waldia, R.S.; Sekhon, H.S.; Nandal, J.K. Extra-short duration pigeonpea for diversifying wheat based cropping systems in the sub-tropics. Exp. Agric. 2002, 38, 1–11. [Google Scholar] [CrossRef]
  8. Ghosh, P.K.; Bandyopadhyay, K.K.; Wanjari, R.H.; Manna, M.C.; Misra, A.K.; Mohanty, M.; Subba Rao, A. Legume effect for enhancing productivity and nutrient use efficiency in major cropping systems—An Indian perspective: A review. J. Sustain. Agric. 2007, 30, 59–86. [Google Scholar] [CrossRef]
  9. Thierfelder, C.; Cheesman, S.; Rusinamhodzi, L. A comparative analysis of conservation agriculture systems: Benefits and challenges of rotations and intercropping in Zimbabwe. Field Crops Res. 2012, 137, 237–250. [Google Scholar] [CrossRef]
  10. Singh, V.K.; Dwivedi, B.S.; Shukla, A.K.; Chauhan, Y.S.; Yadav, R.L. Diversification of rice with pigeonpea in a rice–wheat cropping system on a Typic Ustochrept: Effect on soil fertility, yield and nutrient use efficiency. Field Crops Res. 2005, 92, 85–105. [Google Scholar] [CrossRef]
  11. Zheng, C.; Jiang, Y.; Chen, C.; Sun, Y.; Feng, J.; Deng, A.; Song, Z.; Zhang, W. The impact of conservation agriculture on crop yield in China depends on specific practices, crops and cropping regions. Crop J. 2014, 2, 289–296. [Google Scholar] [CrossRef]
  12. Kassam, A.; Friedrich, T.; Derpsch, R. Successful experiences and lessons from conservation agriculture worldwide. Agronomy 2022, 12, 769. [Google Scholar] [CrossRef]
  13. Chauhan, B.S.; Singh, R.; Mahajan, G. Ecology and management of weeds under conservation agriculture: A review. Crop Prot. 2012, 38, 57–65. [Google Scholar] [CrossRef]
  14. Chauhan, B.S.; Gill, G.S.; Preston, C. Effect of seeding systems and dinitroaniline herbicides on emergence and control of rigid ryegrass (Lolium rigidum) in wheat. Weed Technol. 2007, 21, 53–58. [Google Scholar] [CrossRef]
  15. Govindasamy, P.; Sarangi, D.; Provin, T.; Hons, F.; Bagavathiannan, M. Thirty-six years of no-tillage regime altered weed population dynamics in soybean. Agron. J. 2021, 113, 2926–2937. [Google Scholar] [CrossRef]
  16. Buhler, D.; Stoltenberg, D.; Becker, R.; Gunsolus, J. Perennial Weed Populations After 14 Years of Variable Tillage and Cropping Practices. Weed Sci. 1994, 42, 205–209. [Google Scholar] [CrossRef]
  17. Govindasamy, P.; Sarangi, D.; Provin, T.; Hons, F.; Bagavathiannan, M. No-tillage altered weed species dynamics in a long-term (36-year) grain sorghum experiment in southeast Texas. Weed Sci. 2020, 68, 476–484. [Google Scholar] [CrossRef]
  18. Roper, M.; Ward, P.; Keulen, A.; Hill, J. Under no-tillage and stubble retention, soil water content and crop growth are poorly related to soil water repellency. Soil Tillage Res. 2013, 126, 143–150. [Google Scholar] [CrossRef]
  19. Pasricha, N.S. Conservation Agriculture Effects on Dynamics of Soil C and N under Climate Change Scenario. Adv. Agron. 2017, 145, 269–312. [Google Scholar] [CrossRef]
  20. Wang, H.; Wang, S.; Yu, Q.; Zhang, Y.; Wang, R.; Li, J.; Wang, X. No tillage increases soil organic carbon storage and decreases carbon dioxide emission in the crop residue-returned farming system. J. Environ. Manag. 2020, 261, 110261. [Google Scholar] [CrossRef]
  21. Jahangir, M.M.R.; Nitu, T.T.; Uddin, S.; Siddaka, A.; Sarker, P.; Khan, S.; Jahiruddin, M.; Müller, C. Carbon and nitrogen accumulation in soils under conservation agriculture practices decreases with nitrogen application rates. Appl. Soil Ecol. 2021, 168, 104178. [Google Scholar] [CrossRef]
  22. Govaerts, B.; Sayre, K.D.; Lichter, K.; Dendooven, L.; Deckers, J. Influence of permanent raised bed planting and residue management on physical and chemical soil quality in rain fed maize/wheat systems. Plant Soil 2007, 291, 39–54. [Google Scholar] [CrossRef]
  23. Lal, R. Conservation tillage for sustainable agriculture: Tropics versus temperate environments. Adv. Agron. 1989, 42, 85–197. [Google Scholar]
  24. Godwin, R.J. Agricultural Engineering in Development: Tillage for Crop Production in Areas of Low Rainfall; FAO: Rome, Italy, 1990; p. 124. [Google Scholar]
  25. Yadav, G.S.; Saha, P.; Babu, S.; Das, A.; Layek, J.; Debnath, C. Effect of No-Till and Raised-Bed Planting on Soil Moisture Conservation and Productivity of Summer Maize (Zea mays) in Eastern Himalayas. Agric. Res. 2018, 7, 300–310. [Google Scholar] [CrossRef]
  26. Singh, V.P.; Tripathi, N.; Kumar, A. Resource conservation technology in rice–wheat cropping system: An ecological and sustainable approach. Res. J. Chem. Environ. 2011, 15, 365–371. [Google Scholar]
  27. Bhushan, L.; Ladha, J.K.; Gupta, R.K.; Singh, S.; Tirol-Padre, A.; Saharawat, Y.S.; Gathala, M.; Pathak, H. Saving of water and labor in a rice–wheat system with no-tillage and direct seeding technologies. Agron. J. 2007, 99, 1288–1296. [Google Scholar] [CrossRef]
  28. Choudhary, K.M.; Jat, H.S.; Nandal, D.P.; Bishnoi, D.K.; Sutaliya, J.M.; Choudhary, M.; Jat, M.L. Evaluating alternatives to rice-wheat system in western Indo-Gangetic Plains: Crop yields, water productivity and economic profitability. Field Crops Res. 2018, 218, 1–10. [Google Scholar] [CrossRef]
  29. Tripathi, S.; Das, A. Bed planting for resource conservation, diversification and sustainability of wheat based cropping system. J. Wheat Res. 2017, 9, 1–11. [Google Scholar] [CrossRef]
  30. Friedrich, T.; Kassam, A. No-till Farming and the Environment: Do No-Till Systems Require More Chemicals? Outlooks Pest Manag. 2012, 23, 153–157. [Google Scholar] [CrossRef]
  31. Ghosh, S.; Das, T.K.; Rana, K.S.; Biswas, D.R.; Das, D.K.; Singh, G.; Bhattacharyya, R.; Datta, D.; Rathi, N.; Bhatia, A. Energy budgeting and carbon footprint of contrasting tillage and residue management scenarios in rice-wheat cropping system. Soil Tillage Res. 2022, 223, 105445. [Google Scholar] [CrossRef]
  32. Walkley, A.; Black, I.A. An examination of the Degtjareff method for determining soil organic matter, and a proposed modification of the chromic acid filtration method. Soil Sci. 1934, 37, 29–38. [Google Scholar] [CrossRef]
  33. Pratibha, G.; Rao, K.V.; Srinivas, I.; Raju, B.M.K.; Shanker, A.K.; Madhavi, M.; Indoria, A.K.; Rao, M.S.; Murthy, K.; Reddy, K.S.; et al. Weed shift and community diversity in conservation and conventional agriculture systems in pigeonpea- castor systems under rainfed semi-arid tropics. Soil and Tillage Research 2021, 212, 105075. [Google Scholar] [CrossRef]
  34. Das, T.K.; Das, D.K. Using chemical seed dormancy breakers with herbicides for weed management in soyabean and wheat. Weed Res. 2018, 58, 188–199. [Google Scholar] [CrossRef]
  35. Krebs, C.J. Ecology: The Experimental Analysis of Distribution and Abundance, 3rd ed.; Harper and Row: New York, NY, USA, 1985. [Google Scholar]
  36. Southwood, T.R.E. Ecological Methods, 3rd ed.; Chapman and Hall: London, UK, 1978. [Google Scholar]
  37. Sørensen, T. A method of establishing groups of equal amplitude in plant sociology based on similarityof species and its application to analyses of the vegetation on Danish commons. Biol. Skr./K. Vidensk. Selsk. 1957, 5, 1–34. [Google Scholar]
  38. FAO. Irrigation Water Management: Irrigation Water Needs. In Irrigation Water Management Training Manual No. 3; FAO: Rome, Italy, 2010. [Google Scholar]
  39. Chaudhary, V.P.; Singh, K.K.; Pratibha, G.; Bhattacharyya, R.; Shamim, M.; Srinivas, I.; Patel, A. Energy conservation and greenhouse gas mitigation under different production systems in rice cultivation. Energy 2017, 130, 307–317. [Google Scholar] [CrossRef]
  40. Parihar, C.M.; Yadav, M.R.; Singh, A.K.; Kumar, B.; Pooniya, V.; Pradhan, S.; Verma, R.K.; Parihar, M.D.; Nayak, H.S.; Saharawat, Y.S. Long-term conservation agriculture and intensified cropping systems: Effects on growth, yield, water, and energy-use efficiency of maize in northwestern India. Pedosphere 2018, 28, 952–963. [Google Scholar] [CrossRef]
  41. Sheoran, O.P.; Tonk, D.S.; Kaushik, L.S.; Hasija, R.C.; Pannu, R.S. Statistical Software Package for Agricultural Research Workers. In Recent Advances in Information Theory, Statistics & Computer Applications; Hooda, D.S., Hasija, R.C., Eds.; Hasija Department of Mathematics Statistics, CCS HAU, Hisar.: Haryana, India, 1998; pp. 139–143. [Google Scholar]
  42. Das, T.K. Is transformation of weed data always necessary. Ann. Agric. Res. 1999, 20, 335–341. [Google Scholar]
  43. Baghel, J.K.; Das, T.K.; Mukherjee, I.; Nath, C.P.; Bhattacharyya, R.; Ghosh, S.; Raj, R. Impacts of conservation agriculture and herbicides on weeds, nematodes, herbicide residue and productivity in direct-seeded rice. Soil Tillage Res. 2020, 201, 104634. [Google Scholar] [CrossRef]
  44. Chhokar, R.S.; Sharma, R.K.; Jat, G.R.; Pundir, A.K.; Gathala, M.K. Effect of tillage and herbicides on weeds and productivity of wheat under rice-wheat growing system. Crop Prot. 2007, 26, 1689–1696. [Google Scholar] [CrossRef]
  45. Nath, C.P.; Das, T.K.; Rana, K.S.; Pathak, H.; Bhattacharyya, R.; Paul, S.; Singh, S.B.; Meena, M.C. Weed-management and wheat productivity in a conservation agriculture-based maize (Zea mays)-wheat (Triticum aestivum)-mungbean (Vigna radiata) system in north-western Indo-Gangetic plains of India. Indian J. Agron. 2015, 60, 554–563. [Google Scholar]
  46. Teasdale, J.R.; Mohler, C.L. Light transmittance, soil temperature, and soil moisture under residue of hairy vetch and rye. Agron. J. 1993, 85, 673–680. [Google Scholar] [CrossRef]
  47. Christoffoleti, P.J.; De Carvalho, S.J.P.; López-Ovejero, R.F.; Nicolai, M.; Hidalgo, E.; Da Silva, J.E. Conservation of natural resources in Brazilian agriculture: Implications on weed biology and management. Crop Protection 2007, 26, 383–389. [Google Scholar] [CrossRef]
  48. Mirsky, S.B.; Gallandt, E.R.; Mortensen, D.A.; Curran, W.S.; Shumway, D.L. Reducing the germinable weed seed bank with soil disturbance and cover crops. Weed Res. 2010, 50, 341–352. [Google Scholar]
  49. Crutchfield, D.A.; Wicks, G.A.; Burnside, O.C. Effect of winter wheat (Triticum aestivum) straw mulch level on weeds control. Weed Sci. 1986, 34, 110–111. [Google Scholar] [CrossRef]
  50. Nichols, V.; Verhulst, N.; Cox, R.; Govaerts, B. Weed dynamics and conservation agriculture principles: A review. Field Crops Res. 2015, 183, 56–68. [Google Scholar] [CrossRef]
  51. Ranaivoson, L.; Naudin, K.; Ripoche, A.; Rabeharisoa, L.; Corbeels, M. Is mulching an efficient way to control weeds? Effects of type and amount of crop residue in rainfed rice based cropping systems in Madagascar. Field Crops Res. 2018, 217, 20–31. [Google Scholar] [CrossRef]
  52. Schwartz, R.C.; Baumhardt, R.L.; Evett, S.R. Tillage effects on soil water redistribution and bare soil evaporation throughout a season. Soil Tillage Res. 2010, 110, 221–229. [Google Scholar] [CrossRef]
  53. Dhillon, S.S.; Prashar, A.; Thaman, S. Studies on bed planted wheat (Triticum aestivum L.) under different nitrogen levels and tillage methods. J. Curr. Sci. 2004, 5, 253–256. [Google Scholar]
  54. Tripathi, S.C.; Nagarajan, S.; Chauhan, D.S. Evaluation of zero tillage in wheat (Triticum aestivum) under different methods of rice (Oryza sativa) transplanting. Indian J. Agron. 1999, 44, 219–222. [Google Scholar]
  55. Bhattacharyya, R.; Bhatia, A.; Das, T.K.; Lata, S.; Kumar, A.; Tomer, R.; Singh, G.; Kumar, S.; Biswas, A.K. Aggregate-associated N and global warming potential of conservation agriculture-based cropping of maize-wheat system in the north-western Indo-Gangetic Plains. Soil Tillage Res. 2018, 182, 66–77. [Google Scholar] [CrossRef]
  56. Schoenau, J.J.; Campbell, C.A. Impact of crop residues on nutrient availability in conservation tillage systems. Can. J. Plant Sci. 1996, 76, 621–626. [Google Scholar] [CrossRef]
  57. Powlson, D.S.; Stirling, C.M.; Thierfelder, C.; White, R.P.; Jat, M.L. Does conservation agriculture deliver climate change mitigation through soil carbon sequestration in tropical agro-ecosystems? Agric. Ecosyst. Environ. 2016, 220, 164–174. [Google Scholar] [CrossRef]
  58. Choudhury, B.U.; Singh, A.K. Bed planted rice–wheat rotation at differential soil moisture regimes on soil hydro-physical properties, root growth, nitrogen uptake, and system productivity. Paddy Water Environ. 2013, 11, 265–275. [Google Scholar] [CrossRef]
  59. Hazra, K.K.; Venkatesh, M.S.; Ghosh, P.K.; Ganeshamurthy, A.N.; Kumar, N.; Nadarajan, N.; Singh, A.B. Long-term effect of pulse crops inclusion on soil–plant nutrient dynamics in puddled rice (Oryza sativa L.)-wheat (Triticum aestivum L.) cropping system on an Inceptisol of Indo-Gangetic plain zone of India. Nutr. Cycl. Agroecosys. 2014, 100, 95–110. [Google Scholar] [CrossRef]
  60. Erenstein, O. Smallholder conservation farming in the tropics and sub-tropics: A guide to the development and dissemination of mulching with crop residues and cover crops. Agric. Ecosyst. Environ. 2003, 100, 17–37. [Google Scholar] [CrossRef]
  61. Aquino, M.P. The Adoption of Bed Planting of Wheat in the Yaqui Valley, Sonora, Mexico; International Maize and Wheat Improvement Center (CIMMYT): Mexico City, Mexico, 1998. [Google Scholar]
  62. Erenstein, O.; Laxmi, V. Zero tillage impacts in India’s rice–wheat systems: A review. Soil Tillage Res. 2008, 100, 1–14. [Google Scholar] [CrossRef]
  63. Riley, H.; Borresen, T.; Ekeberg, E.; Rydberg, T. Trends in reduced tillage research and practice in Scandinavia. In Conservation Tillage in Temperate Agroecosystems; CRC Press: Boca Raton, FL, USA, 2017; pp. 23–45. [Google Scholar]
  64. Singh, Y.; Gupta, R.K.; Singh, G.; Singh, J.; Sidhu, H.S.; Singh, B. Nitrogen and residue management effects on agronomic productivity and nitrogen use efficiency in rice-wheat system in Indian Punjab. Nutr. Cycl. Agroecosys. 2009, 84, 141–154. [Google Scholar] [CrossRef]
Figure 1. Meteorological parameters recorded during winter 2021–2022.
Sustainability 15 07290 g001
Figure 2. Species-wise weed density under CT and CA (mean of three years 2010–2011, 2015–2016 and 2021–2022). CT and CA involved 9 and 33 observations, respectively. Different letter(s) presented above the error bars indicate significant difference based on Tukey’s HSD, where α = 0.05.
Sustainability 15 07290 g002
Figure 3. Year-wise density of different weed species (mean of 9, 12, and 21 observations in 2010–2011, 2015–2016, and 2021–2022, respectively). Different letter(s) presented above the error bars indicate the significant difference based on Tukey’s HSD, where α = 0.05.
Sustainability 15 07290 g003
Figure 4. Variation in wheat yield (%) of the respective treatments in 2021–2022 compared with those in 2010–2011 and 2015–2016.
Sustainability 15 07290 g004
Figure 5. Total water productivity (kg/ha.mm) (a) and total water use (mm) (b) across the treatments. Different letter(s) presented above the error bars indicate the significant difference based on Tukey’s HSD, where α = 0.05.
Sustainability 15 07290 g005
Table 1. Energy equivalence of different inputs and outputs used in the experiment.
ParticularsUnitEnergy Equivalence (MJ/Unit)
Tractor 50HP/electric motorkg68.4 a,c
Disc plough/disc harrow/seed drill kg62.7 a,c
Pigeon pea residue kg12.5 b
Diesel litre56.31 a,c
Wheat seedkg15.7
Herbicide kg120 a,c
N kg60.6 a,c
P2O5 kg11.1 a,c
K2O kg6.7 a,c
Water m31.03 b
Combine Harvestingkg83.5 a,c
ElectricitykWh11.93 b,c
Labour (men) hr1.96 a,c
Wheat grain kg15.7 c
Wheat straw kg12.5 c
a [40], b [39], c [31].
Table 2. Category-wise weed density and dry weight in wheat under the fixed-plot study across the treatments at 30 DAS.
TreatmentsWeed Density at 30 DAS (Number/m2)Weed Dry Weight at 30 DAS (g/m2)
GrassyBroad-LeavedSedgesTotalGrassyBroad-LeavedSedgesTotal
CT1.9 ‡
(3) ab
4.6
(20.7) a
4.3 (18.3) a6.5
(42) a
1.12 ‡
(0.7) b
1.23
(1.0) a
0.83
(0.2) a
1.57
(2.0) a
PNB2.4
(5.3) a
3.4
(11.3) ab
2.4 (5.7) bc4.8
(22.3) b
1.49
(1.6) a
1.04
(0.6) abc
0.77
(0.1) a
1.71
(2.4) a
PNBR75N1.7
(2.3) ab
2.3
(4.6) bc
1.9
(3) bcd
3.2
(10) cde
1.08
(0.7) b
0.76
(0.1) c
0.73
(0.1) b
1.13
(0.8) b
PNBR100N1.5
(1.7) ab
2.0
(3.6) c
1.8
(3) cd
3.0
(8.3) cde
0.95
(0.4) b
0.76
(0.1) c
0.76
(0.1) a
1.02
(0.5) b
PBB2.1
(4) ab
2.8
(7.6) bc
2.9
(8) b
4.4
(19.7) bc
1.12
(1.1) b
0.89
(0.3) bc
0.79
(0.1) a
1.29
(1.2) ab
PBBR75N1.6
(2) ab
2.1
(4) c
1.2
(1) de
2.9
(8) cde
1.01
(0.5) b
0.81
(0.1) b
0.73
(0.1) b
1.10
(0.7) b
PBBR100N1.6
(2) ab
2.1
(4) c
1.1
(0.7) de
2.8
(7.7) de
1.00
(0.5) b
0.82
(0.2) c
0.73
(0.1) b
1.10
(0.7) b
PFB1.9
(3) ab
3.5
(12) ab
0.7
(0) e
3.9
(15) bcd
0.90
(0.3) b
1.14
(0.8) ab
0.71
(0) b
1.27
(1.1) ab
PFBR75N1.2
(1) b
1.9
(3.3) c
0.7
(0) e
2.2
(4.3) e
0.83
(0.2) b
0.85
(0.2) c
0.71
(0) b
0.95
(0.4) b
PFBR100N1.3
(1.3) b
2.1
(4) c
0.7
(0) e
2.4
(5.3) de
0.80
(0.1) b
0.85
(0.2) bc
0.71
(0) b
0.93
(0.4) b
‡ Square-root-transformed value (x + 0.5)½, † Data in parentheses are original data. Different letter(s) within a column indicate mean difference based on Tukey’s HSD, where α = 0.05.
Table 3. Species-wise weed dynamics under CA and CT in wheat at 30 DAS over the years (2010–2011, 2015–2016 and 2021–2022).
TillageYearWeed Species
PHMI3CYESCHAL7CODI6MAPA5MEIN2PAHYSOOLSPAR
CT
(3)
2010–20113.6‡
(13) a
0.7
(0)c
4.1
(16.5) a
3.1
(9) c
0.7
(0) b
2.0
(3.5) c
0.7
(0) b
2.6
(6.5) a
2.2
(4.5) b
2015–20163.7
(13.5) a
0.7
(0) c
4.1
(16.5) a
7.9
(62) a
0.7
(0) b
3.6
(12.5) a
0.7
(0) b
0.7
(0) c
4.2
(17) a
2021–20221.8
(3) c
4.3
(18.3) a
3.0
(9) b
1.6
(2) d
0.7
(0) b
2.1
(4.3) c
0.7
(0) b
1.9
(2.1) b
0.7
(0) e
CA (18)2010–20112.8
(7.7) b
0.7
(0) c
3.5
(11.9) ab
2.7
(6.9) c
0.7
(0) b
2.8
(7.5) b
0.7
(0) b
2.5
(5.7) a
2.4
(5.2) b
2015–20162.0
(3.5) c
0.7
(0) c
1.7
(2.5) c
4.2
(16.5) b
0.7
(0) b
0.7
(0) d
0.7
(0) b
0.7
(0) c
1.3
(1.4) c
2021–20221.8
(3) c
1.3
(1.3) b
0.7
(0) d
1.0
(0.6) e
1.1
(0.8) a
0.7
(0) d
1.4
(1.4) a
1.1
(0.8) c
1.0
(0.4) d
p value 0.01<0.00010.0153<0.0001<0.00010.00040.00240.0617<0.0001
‡ Square-root-transformed value (x + 0.5)½, † Data in parentheses are original data. PHMI3: Phalaris minor Retz.; CYES: Cyperus esculentus L.; CHAL7: Chenopodium album L.; CODI6: Coronopus didymus (L.) Smith; MAPA5: Malva parviflora L.; MEIN2: Melilotus indicus (L.) All.; PAHY: Parthenium hysterophorus L.; SOOL: Sonchus oleraceus L.; SPAR: Spergula arvensis L. Each CT value is a mean of 3 observations and each CA value is a mean of 18 observations. Different letter(s) within each column indicate the mean difference based on Tukey’s HSD, where α = 0.05.
Table 4. Weed diversity indices in wheat across treatments at 30 DAS.
2010–20112015–20162021–2022
CTCACTCACTCA
Simpson index0.790.820.680.480.710.83
Shannon–Weiner index1.661.751.370.921.481.85
Sørensen similarity index1.000.890.62
Each CT value is a mean of 3 observations and each CA value is a mean of 18 observations.
Table 5. Wheat yield, cost of cultivation and net returns across treatments.
TreatmentsGrain Yield (t/ha)Straw Yield (t/ha)Cost of Cultivation
(×103 INR/ha)
Net Returns
(×103 INR/ha)
CT4.67 b7.14 b47.775.0 b
PNB5.05 ab7.34 ab40.290.9 a
PNBR75N5.21 ab7.56 ab45.789.5 ab
PNBR100N5.30 ab7.65 ab46.291.2 a
PBB5.09 ab7.43 ab40.292.0 a
PBBR75N5.26 ab7.60 ab45.790.7 a
PBBR100N5.33 a7.68 a46.292.0 a
PFB5.11 ab7.45 ab40.292.7 a
PFBR75N5.28 ab7.62 ab45.791.2 a
PFBR100N5.37 a7.71 a46.292.8 a
Contrast analysis
CT vs. CA 4.67 vs. 5.29 **7.14 vs. 7.64 **--
ZT+R vs. ZT5.29 vs. 5.08 *7.64 vs. 7.40 *--
CA75N vs. CA100N 5.25 vs. 5.33 ns7.59 vs. 7.68 ns--
Different letter(s) within each column indicate the mean difference based on Tukey’s HSD, where α = 0.05. * and ** indicates p < 0.05 and p < 0.001, respectively; ns: non-significant. The CT values are mean of 3 observations; the CA and ZT+R values are means of 18 observations; the ZT, CA75N and CA100N values are means of nine observations.
Table 6. Energy-use indices in wheat production across treatments.
TreatmentsEnergy Input
(×103 MJ/ha)
Energy Output
(×103 MJ/ha)
Energy Productivity (kg/MJ)Energy Biomass Productivity (kg/MJ)Energy Ratio
CT20.58162.52 b0.23 b0.57 b7.90 b
PNB17.73170.98 ab0.28 a0.70 a9.64 a
PNBR75N61.52176.26 ab0.08 c0.21 cd2.87 cd
PNBR100N63.79178.79 ab0.08 c0.20 cd2.80 cd
PBB17.51172.69 ab0.29 a0.71 a9.86 a
PBBR75N59.20177.57 ab0.09 c0.22 c3.00 c
PBBR100N61.47179.73 a0.09 c0.21 cd2.92 cd
PFB18.23173.45 ab0.28 a0.69 a9.52 a
PFBR75N78.68178.14 ab0.07 c0.16 d2.26 cd
PFBR100N80.95180.67 a0.07 c0.16 d2.23 d
Contrast analysis
CT (3) vs. CA (18)--0.23 vs. 0.08 *0.57 vs. 0.19 *7.90 vs. 2.68 *
ZT+R (18) vs. ZT(9)--0.08 vs. 0.29 *0.19 vs. 0.70 *2.68 vs. 9.67 *
CA75N (9) vs. CA100N (9)--0.08 vs. 0.08 ns0.20 vs. 0.19 ns2.79 vs. 2.74 ns
Different letter(s) within each column indicate the mean difference based on Tukey’s HSD, where α = 0.05. * indicates p < 0.001; ns: non-significant.
Table 7. Contrast analysis for total water productivity and partial factor productivity of N, P, K and NPK.
Total Water ProductivityPFPNPFPPPFPKPFPNPK
CT (3) vs. CA (18)11.76 vs. 15.05 *31.13 vs. 41.10 **178.31 vs. 202.01 **140.65 vs. 159.33 **22.30 vs. 28.00 **
ZT+R (18) vs. ZT (9)15.05 vs. 14.10 *41.10 vs. 33.88 **202.01 vs. 194.73 *159.33 vs. 153.06 *28.00 vs. 24.27 **
CA75N (9) vs. CA100N (9)14.93 vs. 15.17 ns46.65 vs. 35.56 **200.37 vs. 203.64 ns158.08 vs. 160.62 ns30.53 vs. 25.47 **
* and ** indicate p < 0.05 and p < 0.001, respectively; ns: non-significant.
Disclaimer/Publisher’s Note: The statements, opinions and data contained in all publications are solely those of the individual author(s) and contributor(s) and not of MDPI and/or the editor(s). MDPI and/or the editor(s) disclaim responsibility for any injury to people or property resulting from any ideas, methods, instructions or products referred to in the content.

