Article

Investigating the Relationship between Users’ Behavioral Intentions and Learning Effects of VR System for Sustainable Tourism Development

1
Graduate School of Design, National Yunlin University of Science and Technology, Douliou 64002, Taiwan
2
Department of Arts in Visual Arts, Macau Polytechnic University, Macao, China
*
Author to whom correspondence should be addressed.
Sustainability 2023, 15(9), 7277; https://doi.org/10.3390/su15097277
Submission received: 19 February 2023 / Revised: 17 April 2023 / Accepted: 23 April 2023 / Published: 27 April 2023
(This article belongs to the Special Issue Sustainable Learning in Education of Sustainability)

Abstract

:
Macao is a tourist city. It is home to the Ruins of Saint Paul’s, a unique 100-year-old landmark, which is still standing with manual maintenance, even after three fires and reconstruction events. Therefore, the continuous preservation of its culture, heritage education, and construction are important issues for Macao. With the development of digital technology in recent years, users can quickly search historical sites and save two-dimensional and three-dimensional images and videos through smartphones. These methods also enhance the communication power of culture. Virtual browsing on a smartphone requires computing power and storage space; yet, virtual reality devices are not widely used. Therefore, augmented reality and virtual reality are rarely used simultaneously for three-dimensional interactive guided tours and operation experiences on the same theme. However, by quickly creating virtual reality scenarios and preserving historical sites on mobile devices, 4DAGE’s 4DKanKan technology can provide augmented reality and metaverse virtual reality experiences. 4DKanKan can also integrate mobile guides and navigation software to connect mobile devices and assist in cultural inheritance and conduct sustainable education. This research linked this technology to the web by incorporating augmented reality and virtual reality technology to make designs and discussed the influences among service design, behavioral intentions, and learning effects. We collated and analyzed relevant data and text materials through systematic testing, observation, operation processes, and semi-structured interviews. The PLS multigroup structural model was used to explore and analyze the degree of influence and explanatory power of system quality, information quality, behavioral intention, and learning effects among themselves. The results of this study show that most users accepted the proposed innovative mode of operation and found it to be interesting and fun. Augmented reality is not limited by space or time; however, virtual reality devices taking too long to operate, switching too frequently, and having too many functional interfaces can cause operational problems. This study identified and modified the influencing factors and problems of the proposed system, with the aim of continuing to expand the applications of 4DKanKan to other cultural attractions or museums in the future. In addition, the research results can provide a reference for the sustainable development of related cultural sites.

1. Introduction

Cultural tourism is a rapidly developing field of global tourism and a focus of domestic and foreign visitors. Cultural heritage can be divided into tangible cultural heritage and intangible cultural heritage [1,2]. Tangible cultural heritage includes buildings, monuments, landscapes, and artifacts. Intangible cultural heritage refers to folk customs, culture, beliefs, traditions, knowledge, and language of intellectual property. The Korean Cultural Centre UK exhibits tangible and intangible cultural relics and assesses whether restoring these cultural relics will increase the audience’s interest [3]. Relevant governments and private sectors have also started to collaborate and have come up with proposals to connect scattered cultural and heritage sites into tourist routes by combining unique stories and guided tours to create interesting themes for visitors [4]. Zurab Pololikashvili, Secretary-General of the World Tourism Organization (UNWTO), pointed out: “Around the world today, businesses and jobs in countries of development depend on a strong and thriving tourism industry at a certain level. Tourism is also a driving force in preserving our natural and cultural heritage.” The Ruins of Saint Paul’s is one of Macao’s great attractions and was added to the World Heritage List in 2005. The ruins, along with the nearby Travessa da Paixão, St. Dominic’s Church, and Senado Square, form a unique cultural area of Macao. In order to promote these attractions, the Macao government has organized many experience activities, such as light festivals, smartphone-guided tours, and augmented reality (AR) experiences, with the hope of improving tourism efficiency. Many studies have mentioned that a good travel experience can build loyalty and identity and help tourists create memorable experiences. Using technology and the concept of links to guide visitors can effectively improve visitors’ knowledge of tourist attractions and history, and increase the sense of entertainment [5,6].
The COVID-19 pandemic has had a huge impact on museums and tourism both in Taiwan and internationally. Many museums have started to consider digital services, as well as visitors’ remote experiences and online evaluation factors [7]. To reduce contact, visitors have been restricted from going to museums or traveling, which has driven the development of virtual experiences and metaverse applications. People can attend virtual live concerts together online, conduct virtual shopping in the real world, work collaboratively with other colleagues in virtual offices, play games, and even take classes using avatars [8]. Regarding usage and application, the metaverse exhibits more flexible forms than other digital platforms. Through improving user satisfaction and the travel experience, the metaverse can support sustainable tourism. With the development of immersive virtual reality (VR) experiences in recent years, tourism managers have made changes in management systems on tourism platforms, along with tourism marketing methods, to enhance consumers’ experiences before, during, and after travel. Some travel companies have incorporated AR into their mobile apps, which are portable and convenient. During the travel process, these apps can provide route guidance and tourism information; they can help tourists learn about the historical background of cultural sites [9]. VR can assist museums, historic sites, cities, and tourism. Through using the positioning function of handheld devices as well as audio and video messages in designated spaces, it can help tourists create more memorable experiences [10]. However, it takes a lot of manpower, time, and resources to construct a complete and detailed virtual scene. Without professional modeling experience, the model may not be able to achieve a realistic effect. On the other hand, the rapid development of digital technology has made three-dimensional space technology become increasingly common. Technology companies in the 4D era have popularized the high-end 4DKanKan camera, which originally served only a specific industry, to the mass market. The end consumers’ demand for digitalized three-dimensional (3D) content can also be quickly realized under the condition of one 4DKanKan camera for everyone, and they can obtain high-quality 3D spatial models. The cameras can transfer large and bulky scanning devices to a smartphone. The application of such digital technologies could improve the restoration speed of historic sites and save modeling time [11].
The 3D virtual scene construction camera, 4DKanKan, was jointly launched by the China–Germany Artificial Intelligence Institute and ZHUHAI 4DAGE Technology. It eliminates the need for operators to possess complex professional knowledge. Three-dimensional virtual scenes are collected using a one-click method, and later modeling is uniformly processed using a one-click method in the cloud. For example, the Cloud Airshow was launched at the 13th China International Aviation & Aerospace Exhibition in 2021, and a model of the Longmen Grottoes in Luoyang, Henan Province, was built for the reconstruction and restoration [12].
Therefore, the purpose of this research was to use a 4DKanKan camera to take 3D images of the Ruins of Saint Paul’s in Macao and its surrounding area to construct a virtual scene. AR was used in combination with an app, a metaverse VR immersive game experience, and computers to conduct the system design. After visiting the site, and recording and collecting data, this study interviewed interaction designers for expert consultations and system feasibility evaluations. In the end, this study explored the impacts of combining various virtual technological innovations on users in terms of service design, behavioral intentions, and learning effects. Moreover, the willingness of users to learn continuously was also examined. This study’s specific objectives are as follows:
  • Analyze the feasibility and acceptance of applying VR interaction and design models for developing cultural tourism experience systems.
  • Explore the system and information quality, and user satisfaction of cultural tourism experience systems for users.
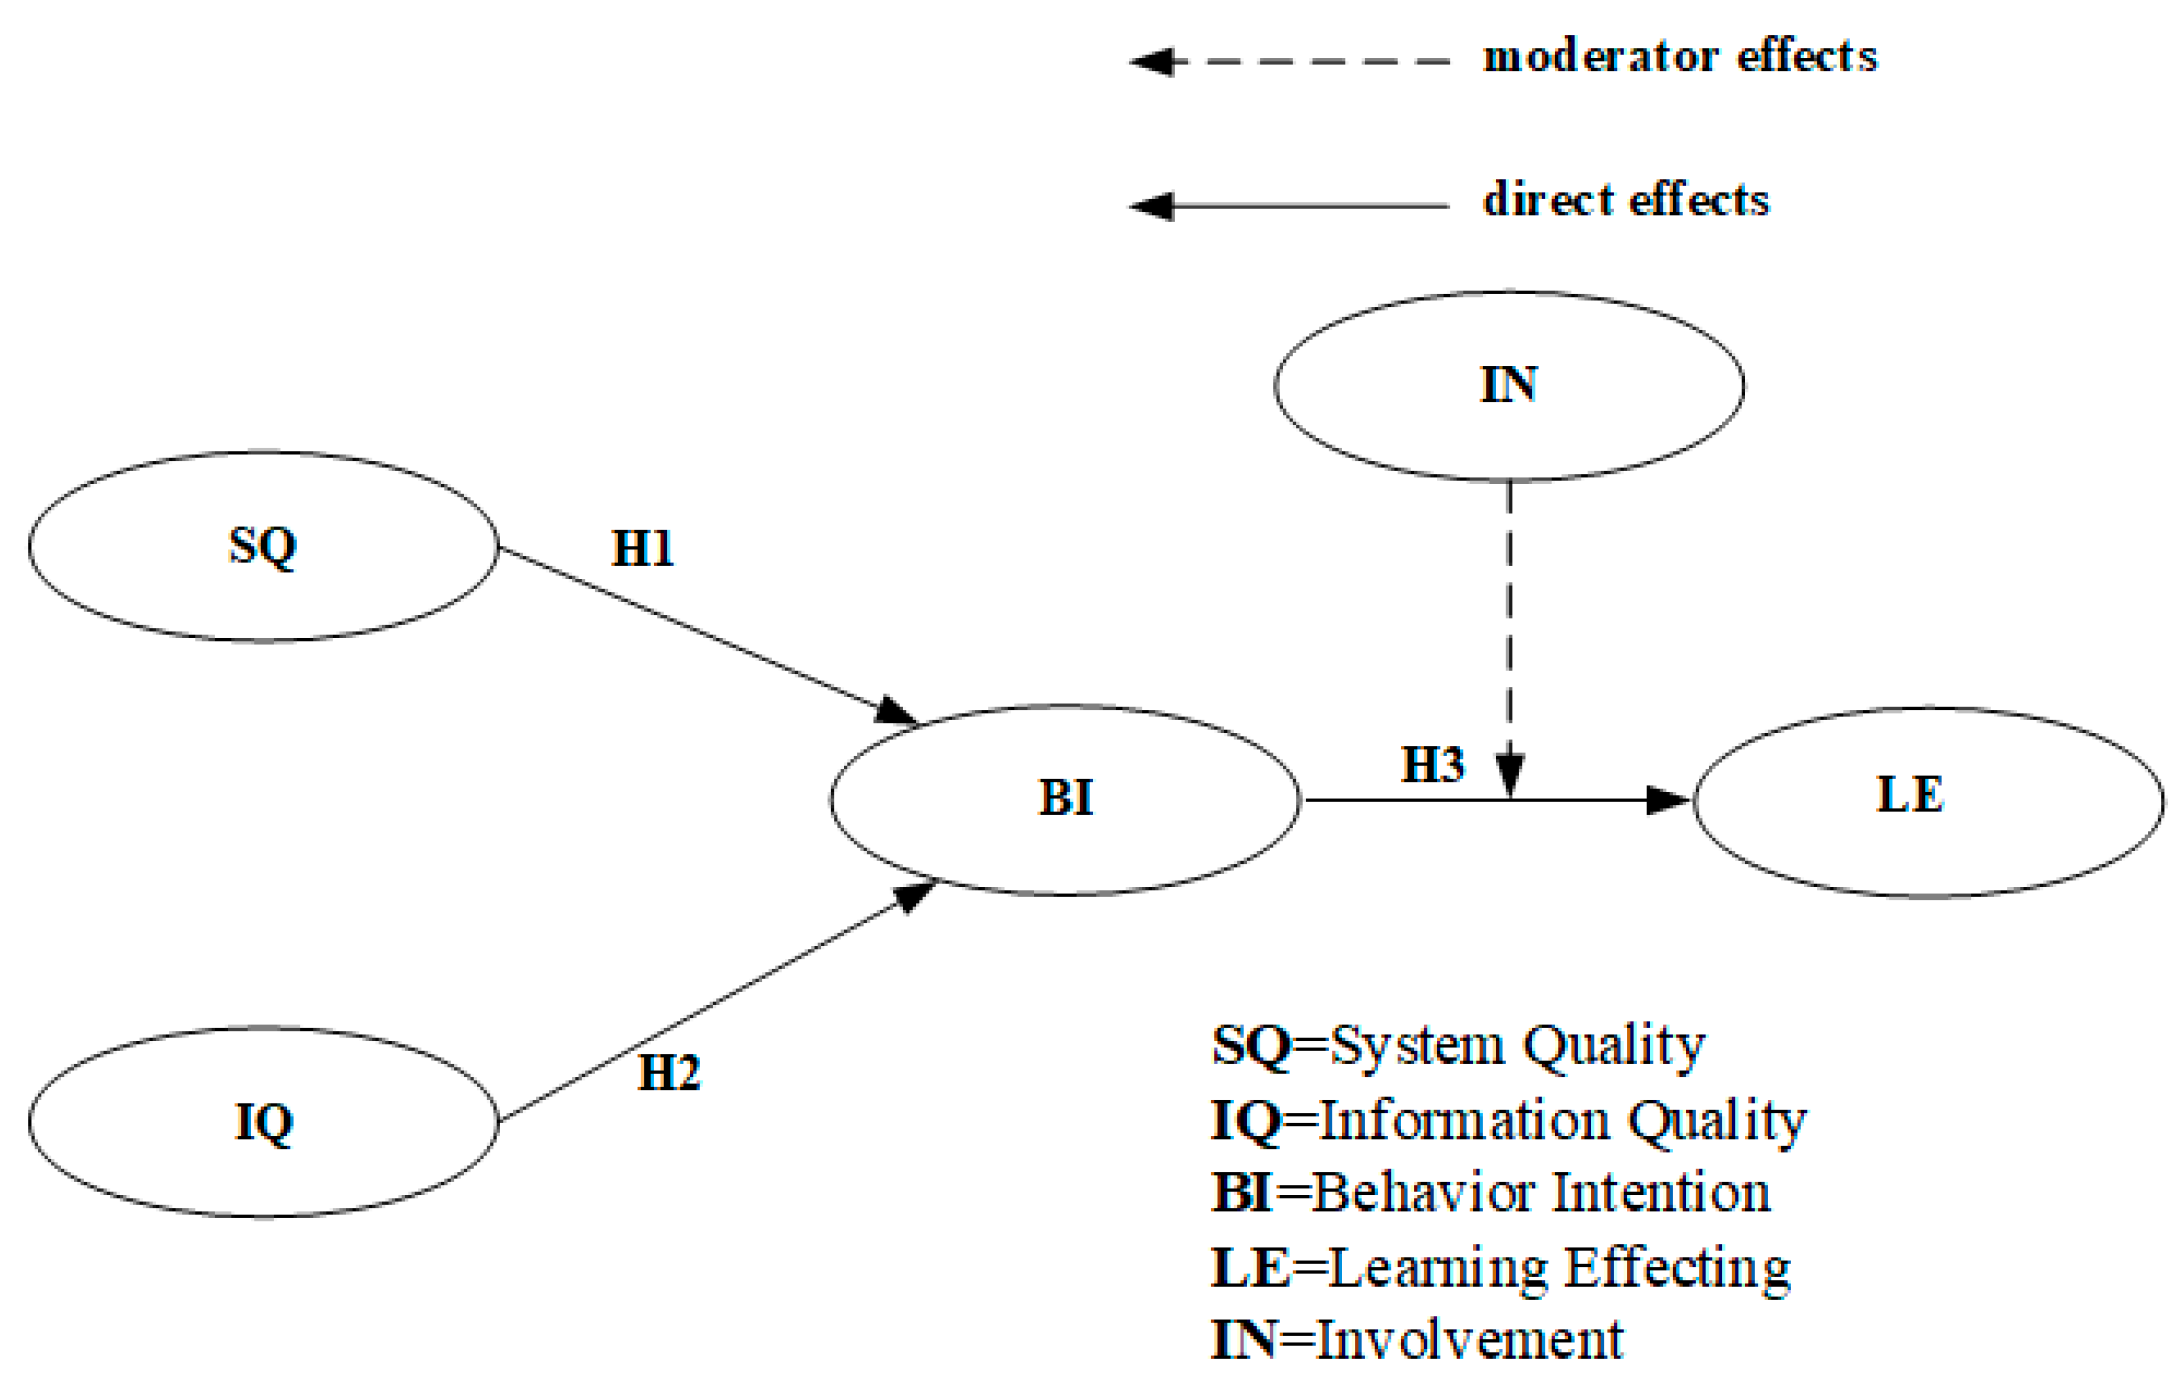
  • Construct a PLS multigroup structural model to explore and analyze the degree of influence and explanatory power of system quality, information quality, behavioral intention, and learning effects among themselves.

2. Background

2.1. Virtual and Augmented Reality

At present, virtual reality (VR) and augmented reality (AR) are widely applied in simulations, including applications related to cultural heritage, archaeology, museums, games, medicine, military services, and entertainment [13]. Tussyadiah et al. (2018) found that the increased sense of presence can enhance the enjoyment of users when operating VR [14]. In terms of the use of AR, dynamic language prompts in digital content can improve the willingness of users to pay for services, especially when the enhanced environment creates a strong sense of presence. In addition, the effectiveness of AR has also been validated in many educational studies [15,16]. As AR technology becomes more common, many AR functions have been developed simultaneously with situational learning theory, inquiry learning theory, and collaborative learning theory. Moreover, AR-based systems are more suitable for lower-level cognitive learning tasks. Based on the interview data, this study proposed a three-stage context-aware ubiquitous learning approach (CAUL) with the functions of tag searches, image tracking, and panoramic recognition by combining 3D animation with wearable AR devices [17].
Bozzelli et al. (2019) implemented ArkaeVision to integrate AR and VR. Their main goal was to use virtual technology to create sustainable cultural resources as well as provide users with a new way to experience cultural heritage [18]. Through a user-centered extension, Bozzelli et al. (2019) designed exploration games using 3D environments that included virtual reconstructions of ancient buildings, science fiction elements, and engaging story content. The platform used VR to explore the temple of Hera II Paestum and used AR to explore the tomb of the diver. Users could actively generate motivation and obtain a good experience in ArkaeVision through gamified participation. The ArkaeVision project also provided higher benefits to cultural education in the learning process [18]. The gallery of the Victoria and Albert Museum in London, U.K. has created a virtual museum with interactive VR and AR applications, and it encourages users to use VR and AR to manipulate 3D artifacts. Sylaiou et al. (2010) found that when users switch between virtual spaces and real spaces, they perceive a stronger sense of immediacy, and that the cognitive impact of VR and AR is positively correlated [19]. Jung et al. (2016) explored the impact of using VR and AR on visitor experiences in mining museums. The research results show that in a mixed environment containing VR and AR elements, social contact exists in the four experience domains of education, aesthetics, entertainment, and escape. Except for the aesthetics domain, these domains can be verified and extended to predict the overall tourism experience rating and re-visit intention [20]. The above findings suggest that today’s games, events, and exhibitions are increasingly focused on placing users in a single space for multi-device experiences. After tricking the brain with images, users interact with virtual objects or environments through a variety of technologies, such as stereo displays, motion tracking devices, input devices, and mobile computer platforms, for visual perception, motion sensing, and interactions.

2.2. Metaverse

The metaverse is a popular topic in the science and technology field right now, mainly due to the COVID-19 pandemic, which has given many companies the opportunity to nurture and develop immersive experience technologies. It provides a 3D space that allows users to conduct natural activities in a virtual environment, including working, playing, socializing, and other virtual experiences [21]. Recently, a number of scholars have begun to study issues related to the metaverse. Jaung (2022) used a virtual forest space to engage college students in recreational activities so as to understand the potential interactions between technology, society, and ecosystems. Jaung’s results show that the users enjoyed experiencing leisure activities in the virtual forest, and this interaction mode affected their interaction with nature [22]. Blockchain technology is a key component of the metaverse and represents an opportunity for developing countries to expand their market and promote a sharing economy [23]. Based on blockchain’s professional authentication, Gemiverse Limited Corporation developed the Gemiverse travel platform and set three development stages for users to experience the platform. Its provision of the travel platform has not only brought new opportunities for tourism but also provided a trustworthy platform for both travel agencies and tourists [24]. In order to discover the gradual change in the form of tourism, Martins et al. (2022) conducted a project based on Amiais, a village in central Portugal, which used the Second Life metaverse to reconstruct the village. This project has introduced the area to the whole world, improved the environment of cultural heritage and intangible cultural heritage, and promoted tourism in rural areas [25]. From the above literature, it could be found that the metaverse is still developing. Moreover, through blockchain technology, multi-development can be achieved by incorporating games, learning, and incentives to promote cultural value, user experience, and sustainability.

2.3. Sustainable and Interactive Experiences in Smart Tourism

Smart tourism technology (STT) has come into being in the Internet era. Smart tourism can make cultural and tourism resources come alive by using digital technology to enrich tourists’ consumption choices. Through cultivating cloud tourism, cloud performance, cloud entertainment, cloud live broadcasting, and cloud exhibition, a new scene of immersive tourism experience is being created. Conducting consumption upgrading and industrial innovation are becoming a future trend. For example, in 2016, the Dunhuang Caves in China employed digital technology to watch the wall paintings inside the grottoes from outside, thereby striking a balance between the protection of cultural relics and their open use. While improving the competitiveness of destinations, STT has also changed the traditional travel experience [26]. Smart cities are urban spaces shaped by global technology companies, governments, and research institutions. They collect and monitor the data generated by digital devices. Through data control and analysis, design methods can be understood more quickly and urban management strategies can be effectively planned, so as to contribute to sustainable urban spaces in the future [27]. de Lange (2015) and Nijholt (2017) explored the cases combining culture, fun, and city. Culture, fun, and city are increasingly being associated with the concept of smart cities and are designed and adopted via technologies. Smart cities also support sustainability, which is often understood as an innovative function related to technology [28,29]. The concept of playable cities started in Bristol, U.K. in 2012, and it has evolved into the Playable City network. This concept incorporates a game in which visitors from around the world act as players, taking on online challenges and involving local manufacturers. The network uses digital devices to increase the participation and favorability of residents and visitors to the city. Moreover, it combines brands with city culture. In the process of interaction with the city, it helps people to better understand the historical development of cities and feel humanistic emotions while being more attractive. The combination of cross-field technologies also makes the collocation between tangible and intangible culture more interactive and interesting to learn [30].
Research has suggested that successful tourist routes require suitable infrastructure provided by relevant government agencies, such as good visual information, city map guides, and aesthetic landscapes [2,31,32]. Presently, two-dimensional (2D) pictures still dominate information guides on the Internet; however, they have obvious deficiencies related to the users’ visual perceptions. Converting 2D into 3D images requires large data resources, and the information dimensions and equipment used also require further improvement. Many 3D buildings and scenes today also face the challenges mentioned above. To solve these issues, 4DAGE Co., Ltd. developed the 4DKanKan, a 3D camera that can quickly construct virtual scenes. Operators do not need complex professional knowledge to use this camera. By using a one-click method to shoot and record images, users can easily capture a 3D virtual scene. The images are then uploaded to the company’s cloud platform for rapid modeling. Beginners can become familiar with operating the system in only ten minutes. After completing the construction of virtual objects, buildings, and environments, interactive guided tours can be uploaded to the cloud network platform and integrated into smartphones or computers for interface planning. Users can download these interactive guided tours, view 3D scenes in real-time, and play virtual games. This model allows the general public to experience the enjoyment of innovative designs that include spatial modeling, artificial intelligence, and machine vision.

2.4. Sustainable Education

The international community is increasingly recognizing education for sustainable development as an indispensable indicator in the development of quality education programs in future cities. “Ensuring inclusive and equitable quality education and promoting lifelong learning opportunities for all” is the spirit of sustainable education, as mentioned in the fourth item of the Sustainable Development Goals (SDGs) set by the United Nations. Target 4.7 in SDG4 states that by 2030, governments must ensure that all learners can acquire the knowledge and skills needed to promote sustainable development, including education for sustainable development, sustainable lifestyles, human rights, appreciation of cultural diversity, and culture’s contribution to sustainable development [33]. Therefore, researchers have begun to explore the issues of culture, tourism, and sustainable education. Hsieh et al. (2022) conducted experiments on participants in different museums and used an eye tracker to detect their eye movements and gauge the participants’ interest in the exhibition content and whether their learning and cognition were directly affected. Through the experiment, Hsieh et al. tried to find the key factors that influence the participants’ interest in the exhibition content and whether their learning and cognition were directly affected [34]. Hsieh et al. (2022) mentioned that eye movement and gaze can also serve as indicators for the future design of AR and VR applications in metaverse environments. This mode could also provide reference values for people’s cognition of fast information in virtual environments [34]. Yen (2022) mentioned that designers should think about how to incorporate festival culture into their experience design and add emotional elements to the activities. By using virtual activities to emphasize personal elements and education content, and by combining local festival cultural characteristics with personal experience and group communication, the shared experience between locals and tourists can be promoted. The shared experience is conducive to the construction of a diverse urban landscape, strengthening community interaction, and encouraging the sustainable development of local festival culture [35]. When the media content is rich and VR is used to experience the content, tourists’ travel satisfaction, willingness to visit the destination, and word-of-mouth intention will be improved [36].

2.5. Research Questions and Hypotheses

According to the research purpose and the relevant literature, this study’s research problem statements are presented as follows:
Question 1: How well do users accept the VR system that integrates cultural tourism experience content? What are the potential system issues that may need correcting?
Question 2: To determine whether users are satisfied with their operating experience regarding the quality and information content of the virtual system. What are the factors affecting their satisfaction?
Question 3: Construct a PLS multigroup structural model to explain whether users are satisfied with their operating experiences regarding system quality and information quality. What are the issues affecting their satisfaction.
This study’s hypotheses are shown in Figure 1. According to the literature review, Information Quality (IQ) refers to the degree to which users perceive the usefulness, understandability, completeness, timeliness, and correctness of the information provided by a system’s content information. Delone and Mclean (1992) mentioned that good information quality has a positive impact on user adoption [37]. Yoo (2020) also used the information quality model to explore AR and consumers’ degree of satisfaction with information quality; their study illustrated the usability and ease of learning to measure the behavioral intention of information quality adoption. Therefore, this study proposes that H1: Good SQ positively impacts BI. System quality (SQ) refers to the degree to which users perceive the usefulness, understandability, completeness, timeliness, and correctness of the information a system provides. The system quality indicators proposed by Delone and Mclean (1992) were used by the present study to evaluate system adoption. Yoo (2020) also used this model to explore AR/VR and consumers’ satisfaction with the system, usability, ease of learning, convenience of access, system efficiency, and reaction time to measure system quality and whether good system quality can help users’ behavior of adoption. Therefore, this study proposes that H2: Good IQ positively impacts BI. Behavioral intention (BI) refers to the subjective perception that consumers may use an AR/VR system in the future. BI can be used to explore the relationship between attitude and behavior under various usage situations. When there are changes in behavioral attitude, subjective range, and perceptual behavior control, behavioral outcomes will change [37,38,39]. Fujita Stank and Thompson (1994) suggested that improving learning satisfaction has impacts on improving learning effects. Moreover, the strength of behavioral intention (BI) can positively impact learning effects [40]. Therefore, this study proposes H3: BI positively impacts LE. Involvement refers to the degree to which users believe that AR/VR systems are related to personal information needs and prior knowledge. Zaichkowsky (1985) discussed the degree to which VR systems were related to personal information needs [41]. Therefore, this study proposes the hypothesis that H4: Involvement has a mediating effect on H3. The overall study hypotheses are illustrated in Figure 1. The research framework of behavioral intentions and learning effects of sustainable tourism development.

3. Research Method

3.1. Research Design

Based on the conceptual theory of ubiquitous learning, this research conducted data preparation and analyses and explored the current theme and development form of the combination of AR and VR. This study designed a VR education system for the Ruins of Saint Paul’s in Macao and prepared a questionnaire according to the research questions. In addition, this study used a quasi-experiment method and semi-structured interviews to assist in discussing the results of the quantitative research on the users’ operation experience and learning process. As qualitative and quantitative methods both have advantages and disadvantages [42], this research adopted mixed research methods. Teddlie and Tashakkori (2010) mentioned that mixed research methods must have a complete process that includes problem formation, data collection, data analysis, and interpretation [43]. The research results should be in both qualitative and quantitative directions, and the interpretation results must be related to and discuss the relationship between qualitative and quantitative orientation. This method can be used to make up for the individual shortcomings of qualitative and quantitative methods [43]. Through quasi-experimental research, data collection, and analysis based on the questionnaires of user satisfaction with the system, this study discussed the degree of attraction and influence of the VR education system of the Ruins of Saint Paul’s in Macao on the users.

3.2. Procedures

The survey subjects of this research were mainly tourists or local college students in Macao who had used Macao tourism websites and apps, with a total of 60 participants. The experiment was carried out on 25–26 May 2021. The experimental process was divided into four parts, as shown in Table 1: activity explanation and system operation description; app operation experience on smartphones; interactive experience between VR and the computer virtual environment; and scale evaluation and user interviews. Before handing out the questionnaires, the respondents were asked if they had used local travel websites or apps in Macao. In order to better understand the actual operation and the users’ learning satisfaction after use, this study evaluated the system quality and the information quality.

3.3. Research Subjects

This study adopted random sampling recruitment methods. The main research subjects of this experimental system were adults over 18 years of age (including tourists to Macao or students from Macao). Regarding the VR experience, research subjects were invited to the digital media studio of the Macao Polytechnic University for the operation. Regarding the AR experience, subjects were required to download their own APP for operation. The study’s researchers accompanied the research subjects to mitigate issues that might have occurred during the experiment and they observed the operation process.

3.4. Questionnaire Design and Operational Definition of Variables

For the system evaluation, this study referred to the system quality indicators proposed by Delone and Mclean (1992). Yoo (2020) also used this model to discuss the relationship between AR and consumers’ satisfaction with the system [37,38]. Yoo (2020) employed database content, usability, ease of learning, accessibility, system efficiency, and reaction time to measure system quality. The system quality indicator has six items in total and presents the information quality measurement indicators in a single form [37,38,39]. Relevance, reliability, immediacy, ease of understanding, content, and format can be used to measure system quality [37,44]. Behavioral intentions can explore the relationship between attitudes and behaviors in various use situations. When behavioral attitudes, subjective scope, and perceived behavioral control change, behavioral outcomes will change [45,46,47]. Fujita-Stank and Thompson (1994) argued that the improvement of users’ learning satisfaction can enhance their learning persistence and devotion effort. In terms of external factors, by providing comfortable learning environments, interesting course designs and strategies, as well as teaching equipment assistance, users can be satisfied with learning [40]. In terms of internal factors, 3D virtual environments can stimulate learning motivation and improve satisfaction. This study used seven items to measure users’ learning satisfaction according to the four levels of love, involvement, competence, and satisfaction [47,48,49]. Finally, the current study also adopted Zaichkowsky’s (1985) degree of user involvement to explore the degree of correlation between VR systems and personal information needs [41]. The structured items of this research questionnaire were based on past theoretical references or revisions. These items were evaluated using a five-point Likert scale, with answers ranging from one to five points indicating strongly disagree to strongly agree (Table 2).

3.5. Statistical Analysis Method

The main analysis tools in this research were divided into three parts. The first part used Statistical Package for the Social Sciences (SPSS) statistical software to analyze the narrative statistics of the original data for each variable in this research. Harman’s one-factor test was used as the test method to study the common method variance of the research variables [51]. Second, to verify the research model and hypothesis, we adopted Walczuch et al.’s (2007) recommendation to test the sample distribution to determine the appropriate research method [52]. The collected samples used in the present study were tested to determine the normal distribution. We found that the sample distribution in this research was significantly abnormal. Third, we used partial least squares multigroup analysis (PLS-MGA) to understand whether there were significant differences among different groups. Partial least squares (PLS) analysis has a relaxed requirement for variables to conform to normality and randomness; it is better suited to handle relations between variables in abnormal data distributions [52,53]. Therefore, PLS was used as a model analysis tool in this research. To obtain the stability of each variable estimation, the verification procedure included 1000 iterations of bootstrap resampling [54].

3.6. System Concept Process and Design Application

3.6.1. Learning Objectives and Contents Corresponding to System Concepts

In this research, the system operation mode and digital learning content were designed based on the concept of ubiquitous learning. The characteristics of ubiquitous learning include permanency, accessibility, immediacy, interactivity, and ease of learning [55,56,57]. These characteristics were combined with mobile devices, courses, and AR and VR applications. During the learning process, this study adopted virtual tours and operation interactions, and integrated game experiences to increase the fun of the users during the experience process and to stimulate their learning motivations. Through searching for treasures and solving problems, the learners could improve their confidence. The system could record data at any time and had the function of facilitating learning to promote the continuity of learning motivation and encourage learners to actively seek challenges (Table 3).

3.6.2. System Design and Process Planning

According to the above literature discussion and research description, the following graphical description (Figure 2) of the system operation mode and the implementation process of digital learning content was proposed for the concept of ubiquitous learning.
In the first stage, digital data were collected, and Photoshop and Illustrator were used for the visual interface design. Subsequently, 4DKanKan cameras, 3DMAX, and the C# programming language of Unity3D were used to design VR and AR interactive content. Then, relevant 3D scene data and interface images were uploaded to a network server for execution on computers or smartphones. The operation methods included two types:
  • Users could download the APP to their smartphones to watch and learn at any time in the Ruins of St. Paul’s scenic area; they could also use VR devices to experience at home.
  • The subjects could use computer-related equipment (mouse, keyboard) in the laboratory and operate VR in a fixed space for experiential learning or scan a QR code to operate on their smartphones. Relevant data were sent back to the server for recording.
The researchers of the present study used a 4DKanKan camera for digital shooting and constructed virtual scenes (Figure 3) to realize 3D digital scene roaming and guided tour experience. Information hotspots were added to the overall scene to make a collaboration between the overall scene and other scenic spots. The hotspots illustrate details, such as the current 3D model, static pictures, content introduction, scenic spot map, and 360° surround animation. Furthermore, it could also perform fully- and semi-automatic tours, manual roaming tours, and guided tours of the scenes. Full and segmented voice explanations were also added to enrich the display mode of the entire scene, strengthen the feeling of immersion, and provide better user experiences. To improve students’ interest and increase enjoyment, this study also added AR and VR interactive operations.
In addition, the differential compression algorithm was adopted to realize the automatic recognition of different network interfaces. Without downloading any plug-ins, it could realize a 3D real-time browsing effect on a personal computer (Figure 4) or mobile device while compressing the 3D data of historical buildings established with the above method. Generally speaking, 1M to 2M of 3D data can ensure the structure information, material properties, and color properties of the 3D data of objects. Data of this size are easy to be transferred over the web for 3D online browsing and being downloaded from the cloud. At present, mainstream browsers, such as Internet Explorer, Google, Chrome, Firefox, and UC, have realized 3D real-time online displays and rendering functions. The data could automatically identify whether the port accessing them via the network was a PC, tablet, or smartphone. When it identified a mobile device, it could view the clearest data images and browse them smoothly (Figure 5).
On the other hand, operators could enter the VR home page to select the virtual scene. Once the operator put on the VR glasses, they could start the experience. In addition, they could select the autoplay function and adjust the sound and the depth of field. They could use the system’s advanced functions to view the 3D model environment of the buildings (Figure 6). VR devices could be operated in the classroom space. After the operation, operators could return to the home page for computer operation. When students put on VR glasses, virtual sensors sent signals to provide digital content with an immersive experience. In the AR part, users could view the app information while observing the buildings on site. They could also use the digital map to view information about the next scenic spots during treasure hunting and learn their relevant historical backgrounds (Figure 7).

4. Data Analysis and Findings

4.1. Narrative Statistics

This study included a total of 60 people in the research sample, among which 38 were males (63.33%) and 22 were females (36.67%). Most of them had used a local travel website or app in Macao, and 70% of the users had operated a virtual device. The operation experience of virtual devices might affect the smoothness of subsequent system operations. It could be found that subjects who had used AR accounted for the majority (55%) while those who had used VR accounted for the minority (20%); those who had used both VR and AR accounted for 16.67%, and those who had never used VR or AR accounted for 8.33% (Table 4).

4.2. System Quality Evaluation and Analysis

The prototype was modified after an expert evaluation according to the interface, operation fluency, and rules, and the evaluation was based on the system quality, information quality, and user satisfaction. SPSS 22.0 was used to analyze the reliability of each perspective of the questionnaire in this research. From the system quality perspective, the mean values of items IQ1 to IQ6 in Table 5 were 4.51, 4.30, 4.70, 4.00, 4.65, and 4.30, respectively. Sekaran and Bougie (2010) suggested that a Cronbach’s α value greater than 0.8 indicates high reliability and a value greater than 0.7 indicates acceptable reliability, while a value lower than 0.6 indicates poor reliability [58]. The Cronbach’s α of the system quality in the current study was 0.741, indicating acceptable reliability.
The overall mean of the VR education system of the Ruins of Saint Paul’s in Macao was 4.41, indicating that most subjects tended to agree with this system. The mean for IQ1, IQ3, and IQ5 in Table 5 was above 4.41. This result indicates that the overall responsiveness of the system, as well as the transmission of content, could allow users to access the system easily and use it smoothly. In addition, users could easily understand the message to be expressed in this system. Relevant statements were also mentioned in the open-ended questionnaire, with the specific details as follows:
  • I have played Pokémon GO for treasure hunting before. Combining this kind of game with history and culture could add more fun when traveling. On the other hand, when I was operating the VR system, I felt that the building was close by even though I was actually not there, and the explanatory information from the VR made me understand the history of the Ruins of Saint Paul’s very clearly.
  • After scanning the AR, the model appeared very quickly and I felt that it was very funny. However, this was my first experience with these devices. I did not know how to operate it without someone around to guide and teach me.
  • Despite the novelty, there were a little too many buttons in the system. I got a little confused when I operated it, but I got used to it after a few times. Both smartphones and computers could be used freely to log in and download the app. When I got home, I could play it with my friends. However, VR equipment is expensive and I probably would not buy it myself. I have experienced both AR and VR devices, and I find them fun. However, I am still unaccustomed to switching operation modes in a short time.
According to the data in Table 5 and the above feedback from the users, we found that complex system operations could cause confusion during the user experience. Users, therefore, required assistance from an instructor to facilitate the learning activities or operational processes. Since most of the subjects had a smartphone or a computer device, they could download the app from anywhere or log on via the Internet. However, at present, VR devices are not yet common purchases for the general public. There were challenges in achieving ubiquitous learning through operating VR in this study. Overall, most users showed positive attitudes toward the system. However, the switching between the function and system, and the arrangement of control and operation learning required further consideration and adjustment to reduce the difficulty of use.

4.3. Information Quality Evaluation and Analysis

From the perspective of information quality, the means of items SQ1 to SQ6 in Table 6 were 4.06, 4.15, 4.02, 4.45, 4.60, and 4.20, respectively. The overall mean was 4.26, and Cronbach’s α was above 0.7, at 0.734, therefore, the reliability met the standard. As shown in Table 6, the scores of four items, namely, SQ1, SQ2, SQ3, and SQ6 in Table 6, were lower than the overall mean. Through the open-ended questionnaire, relevant statements were found, as follows:
  • I have been to the Ruins of Saint Paul’s for travel. I found that in addition to the attractions that appear in this system, it seems there are some attractions that are not listed, such as Travessa da Paixão, the Leal Senado Building, and Lou Kau Mansion. These unlisted scenic spots also have distinctive features and long historical and cultural backgrounds. If these scenic spots could be added to the system and introduced together, it may make the system more complete.
  • When I use AR and VR for guided tours, watching virtual tour information for too long may make my eyes a little tired. However, it is great to be able to treasure hunt while gaining historical knowledge through using AR!
  • The researcher told me that this system is mainly based on field experiments; hence, messages for new events or updates may not be available in real-time, which is a little disappointing. Nowadays, big data and network clouds are very convenient. It would be better if a more complete background database could be constructed so that the system could update automatically.
  • There are videos which can be played in the system for guided tours, and the virtual narrator speaks very clearly. However, it seems to be only in Chinese. Almost all websites or apps I have used before have both Chinese and English versions. Foreigners might not understand the Chinese content. I hope it can add languages of different countries in the future, such as Portuguese, English, and Cantonese.
As seen above, a large amount of information was included in the system. In this study, all the users had gone to Macau for tourism before and had operated at least one local tourism website or application of Macao. As other existing apps have similar functions, the users in this study were relatively familiar with the operation of the app and found less difficulty in using it. However, as there are few applications combining 3D virtual tours with the ability to switch between AR and VR operations, the conversion could cause confusion for users. Most of the message content could be clearly presented to the users. Therefore, in addition to its own content information, improvements to the proposed system should be based on increasing the real-time update function and adding other scenic spots to make the system information more complete.

4.4. Evaluation and Analysis of Users’ Learning Satisfaction

From the users’ learning satisfaction perspective, the mean values of items USAT1 to USAT7 in Table 7 were 4.41, 4.75, 4.40, 4.55, 4.25, 4.11, and 4.70, respectively. Those with an overall mean above 4.45 were USAT2, USAT4, and USAT7. It could be found that the users had a strong sense of identity for using this system to learn history and culture as well as the overall system evaluation. Cronbach’s α was above 0.7, at 0.852; therefore, the reliability also met the standard (Table 7).
  • I do not think I would have failed every test if there had been such a device or game in my history class.
  • I like this system. If I had never gone to the Ruins of Saint Paul’s in Macao, I could know the appearance of this scenic spot just by watching the 360-degree surrounding scene with the corresponding 3D models using my computer or smartphone.
  • We also have VR equipment in our school. It turned out that combining lessons, learning, and games could be fun. I would like to learn how to make combinations with interesting themes and make a great VR game.
  • At present, many apps and web pages on the market are still based on 2D pictures for vision. In addition, due to the impact of the COVID-19 epidemic, we cannot travel freely. This 3D way of learning and experience gives me the feeling of innovation and convenience.
  • Is there any chance of issuing new levels or other themes? If this system has any new levels or other themes, please let me know. I would love to experience it again.
Most users were entertained by the system and wanted to play it again. Many scenic spots areas have been affected because of the epidemic. VR experiences could solve the problem of not being able to travel or collect information on site by allowing users to indirectly experience the local atmosphere. In addition to experience, the learning effect was also observed.

4.5. ANOVA Comparison Test for Different Groups

Table 8 shows the ANOVA comparison test for the VR tour group and the AR treasure-hunting group. The findings indicate significant differences in three variables between the two groups. The AR treasure-hunting group in this study scored significantly higher than the VR tour group in behavioral intentions (BI), learning effects (LE), and users’ learning satisfaction (ULS). Scheffe’s test data also indicated AR > VR.

4.6. PLS Structural Model Analysis

PLS structural modeling mainly uses the path coefficient and the explained variance (R Square) to test the interpretation and prediction ability of a model. In this study, the explanatory ability of the model was mainly understood by checking whether the path coefficients of the relationships between different perspectives were significant. Figure 8, Figure 9 and Figure 10 and Table 8 show the path analysis results of the model in this research. According to the test results of the model, learning effects (LE) were significantly positively affected by behavioral intentions (BI). In addition, the explanatory ability of variation was 28.7% in the samples from the low involvement group and 57.2% in the samples from the high involvement group. BI was positively affected by system quality (SQ) and information quality (IQ). However, BI was supported only for the high involvement group and significantly positively affected LE. The explanatory ability of variation was 57.2% in the samples from the high involvement group and 28.7% in the samples from the low involvement group. From the above statement, it could be seen that this research model had a good explanatory ability for both the high involvement group and the low involvement group.

4.7. Involvement Degree Interference Effect Verification

In terms of the interference effect of network activity types, this research referred to the PLS-MGA procedure developed by Chin (2000) and Keil et al. (2000) for verification. The verification procedure was divided into two steps [59,60]. In step 1, verification proceeded according to the mixed estimated value (Sp) of variation generated by Equation (2), where m and n represent the sample numbers of different groups, and SE represents the standard deviation of the path coefficient. Step 2 proceeded according to Equation (1), in which the t value was generated by Sp and the path coefficient. The verification results are shown in Table 9. According to the verification results, the relationships among SQ, IQ, BI, and LE were obviously different due to the varying involvement levels of the different types of involvement. Therefore, it could be seen from this research model that different types of involvement resulted in significant variations in the needs of learning effects (Table 10).
t = β β S p × 1 m + 1 n
S p = ( m 1 ) ( m + n 2 ) × S E 2 + ( n 1 ) ( m + n 2 ) × S E 2

5. Conclusions and Suggestions

5.1. Discussion

Position illusion is a key factor when users switch between the real and virtual worlds. This phenomenon may be more apparent in AR than in VR because AR presents a mixture of sensory inputs (e.g., images and light) from both the real world and the virtual world. In contrast, VR only provides computer-generated images [61,62]. Relevant studies have highlighted that a good ubiquitous learning system must provide effective learning information and convenient learning environments; it is necessary to improve learners’ participation in the learning environment [63,64,65]. This research employed the concept of ubiquitous learning, integrated 3D virtual tour technology, and combined AR with VR. Regarding system quality, information quality, and experience satisfaction, the subjects indicated they enjoyed using the device (with an average score of about 4 out of 5). This result shows that VR users were still in the minority. The interviewees mentioned that the VR experience effect was very good but that they would feel tired after a long operation time. However, with the help of AR, the users could go to the actual site to experience and freely choose to view the building onsite or rewatch the 3D model for review when leaving the site. This system also provided treasure-hunting games that the subjects could play while learning, which the users felt were fun and easy to learn. This study affirmed that system quality and information quality might impact the experience effect. However, differences in the users’ system experience and the system’s information quality, or the complexity of operations, may have resulted from differences in the level of immersion provided by different devices. These issues could also make the experience less enjoyable.

5.1.1. Actual Impact of System Quality and Information Quality on Users

The tourism industry currently needs comprehensive value-added services based on technologies which are highly dynamic and entertaining and that can make tourists want to revisit tourist attractions [10,66]. Mobile AR apps are highly portable and could serve as travel guides that provide information on demand. They could also make it easy to download and learn relevant information in real-time. Users can choose the amount of information freely, thus reducing information overload and decreasing the impact of irrelevant information. Information overload occurs when visitors are overwhelmed by transmitted information about historical sites, museum exhibits, and navigation speeds. When users perceive information as superfluous or beyond their specific knowledge level, the impact of information overload is further increased [67]. However, the scores for IQ1, IQ3, and IQ5 (picture and information volume in the system, the sensitivity of the operation, as well as message legibility and comprehensibility) were all higher than the overall mean. The information of SQ4 and SQ5 met the needs of users, was clear and organized, and had a high degree of recognition. Therefore, it conformed to the demonstration of the above research.

5.1.2. Good System Design Can Yield Higher Value and Improve Users’ Satisfaction

With the availability of good AR applications and mobile application functions, tourists can not only get higher values but also be better connected, so as to better understand information and enjoy more fun. In other words, the concept of ubiquitous learning greatly enhances the user experience [68,69]. Mobile AR applications can provide personalized visits according to the visitors’ desires and expectations, resulting in a more memorable experience [6]. The technical features of AR and VR greatly enhanced the users’ experience of ArkaeVision. Various studies have shown that the impacts of the following items were significant, the acquisition of knowledge (understanding and learning), the acquisition of certain skills (experience), and the medium-term and long-term preservation of knowledge (storage and processing), [18,70,71]. For items USAT2, USAT4, and USAT, learning satisfaction was higher than the average score of 4.45. This result indicates that when users used the VR education system of the Ruins of Saint Paul’s in Macao, they felt that the knowledge they had acquired had certain effects on the understanding of information, operation techniques, and knowledge coherence and preservation. For users who have not used such devices before, such factors might make operating the system more difficult. However, with practice, users can become familiar with its operation and grasp the learning information provided by the system. Overall, the results indicate the system was satisfactory.

5.1.3. PLS Multigroup Comparative Analysis of the Impact of Different Types of Participation on Learning Effects

This study’s results indicate that the participation of groups with different levels of involvement in PLS multigroup comparative analysis could mediate learning effects. The test results also show that the relationships between SQ, IQ, BI, and LE variables were significantly different due to the involvement of different types. Therefore, from this research model, it is evident that different types of involvement had significant differences in learning effect needs. The model test results show that LE was significantly and positively affected by BI; its variance interpretation ability was the low involvement group sample (28.7%) and the high involvement group sample (57.2%), respectively. The hypotheses based on this research model were all verified. This indicates that the higher the degree of correlation between the user’s information needs for the AR/VR system and their prior knowledge, the better the learning effects. This is consistent with the research on the correlation between the higher the user’s involvement, the better the effectiveness and the personal information needs, as proposed by Zaichkowsky (1985) [50].

5.2. Suggestions

Immersive technologies such as VR and AR can allow travel managers to design memorable experiences for visitors and increase visitor satisfaction. At present, most VR experiences at museums and cultural heritage sites utilize guided tours in the form of storytelling, and they have shown effective results in simulations, reconstructions, and physical displays [72]. However, the impact of the use of these technologies on the cultural heritage learning process has not been thoroughly researched. Through research, analysis, and discussion, this study found that the transition of interactive experiences in a short time can easily cause confusion among users. It was noted that users who had not previously operated VR or AR devices required assistance from instructors to facilitate the smooth progress of the experiment process. Due to the COVID-19 epidemic, many public places, as well as domestic and foreign scenic areas, have been difficult to reach. Therefore, innovative technologies can be used to create a new way of experience, increase users’ sense of participation, reduce human costs and contact risks, and reduce travel costs. With high-quality smart tourism technologies, users can have higher satisfaction with the service experience, which could induce positive or satisfied feelings from tourists in terms of the overall tourism evaluation. In addition to smart services, adding game elements can make the learning experience more interesting [73]. However, the game mechanics need to be carefully planned to avoid providing the players with too much information in a short period of time, which may cause excessive cognitive burdens and reduce their involvement, satisfaction, and effectiveness. Finally, according to the research results, the extension of future research could be divided into system design suggestions and research extensions, as described below.

5.2.1. System Design

(1)
Add special areas for messages or cooperative experience interactions
This system has the record function after the operation, but it did not provide a message area. At present, many apps offer message services that allow users to give feedback on their feelings after the experience. After collecting data and finding problems, this study carried out periodic system updates to make the system more complete and better meet the needs of users. On the other hand, this system adopted the standalone operation mode, so the operating experience was monotonic. By using cooperative experiences and task settings, every user could communicate and solve problems with their own views. The system could not only provide cognitive subject knowledge but also improve practical experience and techniques in emotion and skills.
(2)
The game element and competitive reward mechanism
This research mainly focused on guided tours, and there were no other game experiences to choose from other than simple treasure hunting games. The users’ feedback suggested that designing different games on the device could provide users with a better experience. Moreover, when a virtual game projection is more natural, it can not only improve the user experience but also enhance the enjoyment of the virtual game [74,75]. By adding competitions and a reward mechanism, the proposed system could provide users with an incentive to persevere and complete tasks. How to determine the appropriate number of games to include and the amount of information provided to the users should be the focus of further research.

5.2.2. Research Extensions

(1)
Discussion on the influence degree of the AR and VR operation experience
This research did not discuss the respective influence degrees of AR and VR. Most of the current research has separate focuses on AR or VR in different topics. However, few papers discuss AR and VR at the same time. In terms of learning or satisfaction, the use of different AR and VR devices may have different effects on the same topic. Future research should discuss these effects.
(2)
Discussion on the influence of cultural heritage innovation systems on the learning experience
Most research on cultural heritage sites, museums, and tourist attractions still focuses on experience satisfaction, marketing, and reconstruction, while there are few studies on the influence of cultural learning and knowledge acquisition. A key point of this research was to explore the impact of integrating ubiquitous learning concepts with innovative technology systems on learning satisfaction. It was found that instructive learning was a good way to pass down and understand historical sites, as it enabled more people to have a deeper understanding on the importance of these sites and learn methods to preserve them. Therefore, in the future, subsidiary courses on traditional culture can be designed to explore whether the proposed system is suitable to be included in the basic education of schools. Future studies are suggested to examine the effectiveness of such learning, as well as the models that could be implemented.

5.3. Research Limitations

This study’s limitations pertain to samples and sites. The main experimental activity involved inviting users to the laboratory for VR operations. Although there were also external observations of AR user operations, the number of users was limited by available personnel and time. Therefore, in the future, the experiment and observation time can be extended. In addition to the preset experimental subjects, research can also be conducted to investigate the users’ differences among various ethnic groups, such as foreign tourists and local residents. Furthermore, the memorial archway of the Ruins of St. Paul covers a wide area; some intangible aspects of cultural heritage around this site were not included in the virtual environment due to the limitations of this experiment. In the future, we can make additions to make the system richer and more complete. Future projects can also extend the content to include other cultural heritage sites in Macao for virtual content design and make exploration and comparison through this model.

Author Contributions

Conceptualization, P.-Y.S., P.-W.H. and K.-K.F.; methodology, P.-Y.S.; software, P.-W.H.; validation, P.-Y.S.; formal analysis, P.-W.H. and P.-Y.S.; investigation, P.-W.H.; resources, P.-W.H. and P.-Y.S.; data curation, P.-W.H. and P.-Y.S.; writing—original draft preparation, P.-W.H. and P.-Y.S.; writing—review and editing, P.-Y.S.; visualization, P.-W.H.; supervision, K.-K.F.; project administration, P.-W.H.; funding acquisition, P.-W.H. All authors have read and agreed to the published version of the manuscript.

Funding

This research was funded by the Macau Polytechnic University foundation, the grant number is RP/FAD-02/2022.

Institutional Review Board Statement

Not applicable.

Informed Consent Statement

Informed consent was obtained from all subjects involved in the study.

Data Availability Statement

The data are not publicly available due to privacy or ethical.

Conflicts of Interest

The authors declare no conflict of interest. The data presented in this study are available on request from the corresponding author.

References

  1. Alivizatou, M. Contextualising intangible cultural heritage in heritage studies and museology. Int. J. Intang. Herit. 2008, 3, 44–54. [Google Scholar]
  2. Sheng, N.; Tang, U.W. Spatial Techniques to Visualize Acoustic Comfort along Cultural and Heritage Routes for a World Heritage City. Sustainability 2015, 7, 10264–10280. [Google Scholar] [CrossRef]
  3. Rhee, B.; Pianzola, F.; Oh, N.; Choi, G.; Kim, J. Remediating tradition with technology: A case study of from Tangible to Intangible: A Media Showcase of Kisa chin p’yori chinch’an uigwe. Digit. Creat. 2021, 32, 56–70. [Google Scholar] [CrossRef]
  4. Murray, M.; Graham, B. Exploring the dialectics of route-based tourism: The Camino de Santiago. Tour. Manag. 1997, 18, 513–524. [Google Scholar] [CrossRef]
  5. Pine, B.J.; Gilmore, J.H. Welcome to the experience economy. Harv. Bus. Rev. 1998, 76, 97–105. [Google Scholar]
  6. Kounavis, C.D.; Kasimati, A.E.; Zamani, E.D. Enhancing the tourism experience through mobile augmented reality: Challenges and prospects. Int. J. Eng. Bus. Manag. 2012, 4, 1–6. [Google Scholar] [CrossRef]
  7. Pedro, A.D.V. Curating the Everywhere Museum of Everything. Digit. Creat. 2020, 31, 171–180. [Google Scholar]
  8. Park, S.M.; Kim, Y.G. A metaverse: Taxonomy, components, applications, and open challenges. IEEE Access 2022, 10, 4209–4251. [Google Scholar] [CrossRef]
  9. Yu, D.; Jin, J.S.; Lai, W.; Huang, Q. A useful visualization technique: A literature review for augmented reality and its application, limitation & future direction. In Visual Information Communication; Springer: Boston, MA, USA, 2009; pp. 311–337. [Google Scholar]
  10. Garcia-Crespo, A.; Chamizo, J.; Rivera, I.; Mencke, M.; Colomo-Palacios, R.; Gomez-Berbis, J.M. SPETA: Social pervasive e-Tourism advisor. Telemat. Inform. 2009, 26, 306–315. [Google Scholar] [CrossRef]
  11. 4DAGE. 2021. Available online: http://www.4dage.com/cn/#/ (accessed on 28 May 2022).
  12. Cui, Y. A Consumer-Grade 3D Camera that Changed the Progress of Human Civilization. 4DAGE Technology. 2018. Available online: https://www.4dkankan.com/#/cases/smartCity (accessed on 30 May 2022).
  13. Suh, A.; Prophet, J. The state of immersive technology research: A literature Analysis. Comput. Hum. Behav. 2018, 86, 77–90. [Google Scholar] [CrossRef]
  14. Tussyadiah, I.P.; Wang, D.; Jung, T.H.; tom Dieck, M.C. Virtual reality, presence, and attitude change: Empirical evidence from tourism. Tour. Manag. 2018, 66, 140–154. [Google Scholar] [CrossRef]
  15. Akçayır, M.; Akçayır, G. Advantages and challenges associated with augmented reality for education: A systematic review of the literature. Educ. Res. Rev. 2017, 20, 1–11. [Google Scholar] [CrossRef]
  16. Ibáñez, M.B.; Delgado-Kloos, C. Augmented reality for STEM learning: A systematic review. Comput. Educ. 2018, 123, 109–123. [Google Scholar] [CrossRef]
  17. Hu, C.-H.; Barrett, N.E.; Liu, G.-Z. The development and construction of an AR-guided learning model with focused learning theories. J. Comput. Assist. Learn. 2021, 37, 1423–1440. [Google Scholar] [CrossRef]
  18. Bozzelli, G.; Raia, A.; Ricciardi, S.; De Nino, M.; Barile, N.; Perrella, M.; Tramontano, M.; Pagano, A.; Palombini, A. An integrated VR/AR framework for user-centric interactive experience of cultural heritage: The ArkaeVision project. Digit. Appl. Archaeol. Cult. Herit. 2019, 15, e00124. [Google Scholar] [CrossRef]
  19. Sylaiou, S.; Mania, K.; Karoulis, A.; White, M. Exploring the relationship between presence and enjoyment in a virtual museum. Int. J. Hum.-Comput. Stud. 2010, 68, 243–253. [Google Scholar] [CrossRef]
  20. Jung, T.; tom Dieck, M.C.; Lee, H.; Chung, N. Effects of Virtual Reality and Augmented Reality on Visitor Experiences in Museum. In Information and Communication Technologies in Tourism; Springer: Bilbao, Spain, 2016; pp. 621–635. [Google Scholar]
  21. Shin, D.-H. The actualization of meta affordances: Conceptualizing affordance actualization in the metaverse games. Comput. Hum. Behav. 2022, 133, 107292. [Google Scholar] [CrossRef]
  22. Jaung, W. Digital forest recreation in the metaverse: Opportunities and Challenges. Technol. Forecast. Soc. Chang. 2022, 185, 122090. [Google Scholar] [CrossRef]
  23. Irannezhad, E.; Mahadevan, R. Is blockchain tourism’s new hope? J. Hosp. Tour. Technol. 2021, 12, 85–96. [Google Scholar] [CrossRef]
  24. Dongying, W. Gemiverse: The blockchain-based professional certification and tourism platform with its own ecosystem in the metaverse. Int. J. Geoheritage Park. 2022, 10, 322–336. [Google Scholar]
  25. Martins, D.; Oliveira, L.; Amaro, A.C. From co-design to the construction of a metaverse for the promotion of cultural heritage and tourism: The case of Amiais. Procedia Comput. Sci. 2022, 204, 261–266. [Google Scholar] [CrossRef]
  26. Pai, C.K.; Kang, S.; Liu, Y.; Zheng, Y. An Examination of Revisit Intention Based on Perceived Smart Tourism Technology Experience. Sustainability 2021, 13, 1007. [Google Scholar] [CrossRef]
  27. Monachesi, P.; Witteborn, S. Building the sustainable city through Twitter: Creative skilled migrants and innovative technology use. Telemat. Inform. 2021, 58, 101531. [Google Scholar] [CrossRef]
  28. Lange, M.D. The Playful City: Using Play and Games to Foster Citizen Participation, Social Technologies and Collective Intelligence; Mykolas Romeris University: Vilnius, Lithuania, 2015; pp. 426–434. [Google Scholar]
  29. Nijholt, A. Towards Playful and Playable Cities, Playable Cities: The City as a Digital Playground; Springer: Singapore, 2017; pp. 10–20. [Google Scholar]
  30. Marques, L.; Borba, C. Co-creating the city: Digital technology and creative tourism. Tour. Manag. Perspect. 2017, 24, 86–93. [Google Scholar] [CrossRef]
  31. Zheng, M.C. The design of a map for tourists to engage in circuitous movements. J. Asian Archit. Build. Eng. 2014, 13, 601–607. [Google Scholar] [CrossRef]
  32. Garau, C.; Ilardi, E. The “Non-Places” meet the “Places:” Virtual tours on smartphones for the enhancement of cultural heritage. J. Urban Technol. 2014, 21, 79–91. [Google Scholar] [CrossRef]
  33. Chen, F.-H.; Tsai, C.-C.; Chung, P.-Y.; Lo, W.-S. Sustainability Learning in Education for Sustainable Development for 2030: An Observational Study Regarding Environmental Psychology and Responsible Behavior through Rural Community Travel. Sustainability 2022, 14, 2779. [Google Scholar] [CrossRef]
  34. Hsieh, Y.L.; Lee, M.F.; Chen, G.S.; Wang, W.J. Application of Visitor Eye Movement Information to Museum Exhibit Analysis. Sustainability 2022, 14, 6932. [Google Scholar] [CrossRef]
  35. Yen, H.Y. How the Experience Designs of Sustainable Festive Events Affect Cultural Emotion, Travel Motivation, and Behavioral Intention. Sustainability 2022, 14, 11807. [Google Scholar] [CrossRef]
  36. Lee, U.K. Tourism Using Virtual Reality: Media Richness and Information System Successes. Sustainability 2022, 14, 3975. [Google Scholar] [CrossRef]
  37. Delone, W.H.; McLean, E.R. Information Systems Success: The Quest for the Dependent Variable. Inf. Syst. Res. 1992, 3, 60–95. [Google Scholar] [CrossRef]
  38. Yoo, J. The Effects of Perceived Quality of Augmented Reality in Mobile Commerce—An Application of the Information Systems Success Model. Informatics 2020, 7, 14. [Google Scholar] [CrossRef]
  39. Dağhan, G.; Akkoyunlu, B. Modeling the continuance usage intention of online learning environments. Comput. Hum. Behav. 2016, 60, 198–211. [Google Scholar] [CrossRef]
  40. Fujita-Stank, P.J.; Thompson, J.A. The Effects of Motivation and Classroom Environment on the Satisfaction of Noncredit Continuing Education Student; AIR 1994 Annual Forum Paper, No. ED: 3730646; University of Hawai’i at Manoa: Honolulu, HI, USA, 1994. [Google Scholar]
  41. Zaichkowsky, J.L. Measuring the Involvement Construct. J. Consum. Res. 1985, 12, 341–352. [Google Scholar] [CrossRef]
  42. Sung, Y.-T.; Chang, K.-E.; Lee, Y.-H.; Yu, W.C. Effects of a Mobile Electronic Guidebook on Visitors’ Attention and Visiting Behaviors. Educ. Technol. Soc. 2008, 11, 67–80. [Google Scholar]
  43. Teddlie, C.; Tashakkori, A. Overview of contemporary issues in mixed methods research. Handb. Mix. Methods Soc. Behav. Res. 2010, 2, 1–41. [Google Scholar]
  44. Liu, C.-H. A Design Respective of User Experience on Augment Reality Course: The Assessment by Using Information System Success with Expectation Theory Model. Int. J. Digit. Learn. 2015, 7, 1–27. [Google Scholar]
  45. Ajzen, I.; Madden, T.J. Prediction of goal-directed behavior: Attitudes, intentions, and perceived behavioral control. J. Exp. Soc. Psychol. 1986, 22, 453–474. [Google Scholar] [CrossRef]
  46. Davis, F.D. Perceived usefulness, perceived ease of use and user acceptance of information technology. MIS Q. 1989, 13, 319–340. [Google Scholar] [CrossRef]
  47. Taylor, S.; Todd, P. Decomposition and crossover effects in the theory of planned behavior: A study of consumer adoption intentions. Int. J. Res. Mark. 1995, 12, 137–155. [Google Scholar] [CrossRef]
  48. Chen, Y.C.; Liao, G.Z. Investigation on Materials Design of Virtual Reality and ARCS for Understanding Insects. Int. J. Digit. Learn. Technol. 2013, 5, 51–68. [Google Scholar]
  49. Chen, I.H.; Lin, H.C. A Study of Scientific Research Personnel in the Learning Motivation of the Academic Ethics Learning on the Research Ethical Attitude and Learning Satisfaction, Technology and Human Education Quarterly. J. Technol. Hum. Resour. Educ. 2018, 4, 88–109. [Google Scholar]
  50. Lu, B.F.; Fan, Z.W.; Zheng, J.M.; Li, L. Bio-Native shape modeling and virtual reality for bio education. Int. J. Image Graph. 2006, 6, 251–265. [Google Scholar] [CrossRef]
  51. Podsakoff, P.M.; Organ, D.W. Self-Reports in Organizational Research: Problems and Prospects. J. Manag. 1986, 12, 531–544. [Google Scholar] [CrossRef]
  52. Walczuch, R.; Lemmink, J.; Streukens, S. The effect of service employees’ technology readiness on technology acceptance. Inf. Manag. 2007, 44, 206–215. [Google Scholar] [CrossRef]
  53. World, H. Soft modeling: The basic design and some extensions. In Systems under Indirect Observations: Part II; Joreskog, K.G., Wold, H., Eds.; North-Holland: Amsterdam, The Netherlands, 1982; pp. 1–54. [Google Scholar]
  54. Chin, W.W. The partial least squares approach to structural equation modeling. In Modern Methods for BUSINESS Research; Marcoulides, G.A., Ed.; Lawrence Erlbaum Associates: Mahwah, NJ, USA, 1998; pp. 295–336. [Google Scholar]
  55. Chen, C.M.; Tsai, Y.N. Interactive augmented reality system for enhancing library instruction in elementary schools. Comput. Educ. 2012, 59, 638–652. [Google Scholar] [CrossRef]
  56. Ogata, H.; Yano, Y. CLUE: Computer supported ubiquitous learning environment for language learning. Trans. Inf. Process. Soc. Jpn. 2004, 45, 2354–2363. [Google Scholar]
  57. Hwang, G.J.; Yang, T.C.; Tsai, C.C.; Yang, S.J.H. A context-aware ubiquitous learning environment for conducting complex science experiments. Comput. Educ. 2009, 53, 402–413. [Google Scholar] [CrossRef]
  58. Sekaran, U.; Bougie, R. Research Methods for Business: A Skill Building Approach; John Wiley & Sons: Haddington, UK, 2010. [Google Scholar]
  59. Chin, W.W. Frequently Asked Questions-Partial Least Squares and PLS-Graph. 2000. Available online: http://disc-nt.cba.uh.edu/chin/plsfaq/plsfaq.htm (accessed on 30 June 2008).
  60. Keil, M.; Tan, B.C.Y.; Wei, K.; Saarinen, T.; Tuunainen, V.; Wassenaar, A. Cross-Cultural Study on Escalation of Commitment Behavior in Software Projects. MIS Q. 2000, 24, 299–325. [Google Scholar] [CrossRef]
  61. Slater, M.; Steed, A. A virtual presence counter. Presence Teleoperators Virtual Environ. 2000, 9, 413–434. [Google Scholar] [CrossRef]
  62. Margaryan, A.; Littlejohn, A.; Voit, G. Are digital natives a myth or reality? University students’ use of digital technologies. Comput. Educ. 2011, 56, 429–440. [Google Scholar] [CrossRef]
  63. Hranstinski, S. A theory of online learning as online participation. Comput. Educ. 2009, 52, 78–82. [Google Scholar] [CrossRef]
  64. Liu, T.Y.; Chu, Y.L. Using ubiquitous games in an English listening and speaking course: Impact on learning outcomes and motivation. Comput. Educ. 2010, 55, 630–643. [Google Scholar] [CrossRef]
  65. You, J.W.; Kang, M. The role of academic emotions in the relationship between perceived academic control and self-regulated learning in online learning. Comput. Educ. 2014, 77, 125–133. [Google Scholar] [CrossRef]
  66. Bogicevica, V.; Milos, B.; Anil, B.; Wan, Y.; Cobanoglud, C. The impact of traveler-focused airport technology on traveler satisfaction. Technol. Forecast 2017, 123, 351–361. [Google Scholar] [CrossRef]
  67. Oppermann, R.; Specht, M. A Nomadic Information System for Adaptive Exhibition Guidance. Arch. Mus. Inform. 1999, 13, 103–109. [Google Scholar] [CrossRef]
  68. Yovcheva, Z.; Buhalis, D.; Gatzidis, C. Engineering augmented tourism experiences. In Information and Communication Technologies in Tourism; Springer: Berlin/Heidelberg, Germany, 2013; pp. 24–35. [Google Scholar]
  69. Wang, D.; Park, S.; Fesenmaier, D.R. The role of smartphones in mediating the touristic experience. J. Travel Res. 2012, 51, 371–387. [Google Scholar] [CrossRef]
  70. Navvab, M.; Bisegna, F.; Gugliermetti, F. Experiencing the tangible past through virtual reconstruction: Cultural heritage of buildings and their environmental boundaries. Archeomatica 2003, 4, 36–41. [Google Scholar]
  71. Fassi, F.; Colizzi, L.; Pascalis, F.D. 3D visualization and virtual reality for cultural heritage diagnostic. Hist.-Tech. J. 2007, 7, 31–42. [Google Scholar]
  72. Ferdani, D.; Fanini, B.; Piccioli, M.C.; Carboni, F.; Vigliarolo, P. 3D reconstruction and validation of historical background for immersive VR applications and games: The case study of the Forum of Augustus in Rome. J. Cult. Herit. 2020, 43, 129–143. [Google Scholar] [CrossRef]
  73. Henderson, D. Games: Making learning fun. Annu. Rev. Nurs. Educ. 2005, 3, 165–183. [Google Scholar]
  74. Lanningham-Foster, L.; Jensen, T.B.; Foster, R.C.; Redmond, A.B.; Walker, B.A.; Heinz, D.; Levine, J.A. Energy expenditure of sedentary screen time compared with active screen time for children. Pediatrics 2006, 118, e1831–e1835. [Google Scholar] [CrossRef] [PubMed]
  75. Kim, K.J.; Sundar, S.S. Can interface features affect aggression resulting from violent video game play? An examination of realistic controller and large screen size. Cyberpsychol. Behav. Soc. Netw. 2013, 16, 329–334. [Google Scholar] [CrossRef] [PubMed]
Figure 1. The research framework of behavioral intentions and learning effects of sustainable tourism development.
Sustainability 15 07277 g001
Figure 2. Ubiquitous learning concept system and implementation process of digital learning content.
Sustainability 15 07277 g002
Figure 3. Shooting the ruins of Saint Paul’s with the 4DKanKan camera.
Sustainability 15 07277 g003
Figure 4. Constructing a guided tour of the virtual environment on a PC.
Sustainability 15 07277 g004
Figure 5. Functions and interface design of the digital version on a mobile device.
Sustainability 15 07277 g005
Figure 6. VR digital content and VR operation effect.
Sustainability 15 07277 g006
Figure 7. VR tour and AR treasure hunting experience.
Sustainability 15 07277 g007
Figure 8. Path analysis results of the base model. (**: p < 0.01, ***: p < 0.001).
Sustainability 15 07277 g008
Figure 9. Path analysis results of the low involvement group. (*: p < 0.05, **: p < 0.01).
Sustainability 15 07277 g009
Figure 10. Path analysis results of the high involvement group. (***: p < 0.001).
Sustainability 15 07277 g010
Table 1. Experimental process.
Serial NumberExperimental Process DescriptionTime
1Activity explanation and system operation description5 min
2App operation on smartphones
(1) Through using 4DKanKan technology, users could select the tour mode through touch control. With surrounding real scenes and interactive clicks on each scenic spot, users could switch among scenic spots and receive explanations for the spots.10 min
(2) In the AR digital content experience, in addition to real-view tours, viewers could engage in treasure hunting around the Ruins of Saint Paul’s. Assisted by AR, images could be rotated to observe the structures of the sculptural patterns of various layers in the Ruins of Saint Paul’s.10 min
3VR device operation
(1) After AR operation, users could switch to VR operation for historical background learning, structure learning, interactive tours, and simple treasure hunting activities, thus allowing users to conduct experiential learning after watching AR.15 min
(2) Guided tours could also be played separately. Through videos and explanations, users could view virtual buildings from different angles, thus making the experience more realistic.5 min
4After the operation, questionnaires were completed, and semi-structured interviews were carried out.15 min
Table 2. Perspectives of the evaluation questionnaire and the corresponding literature.
VariablesOperational DefinitionQuestionsNumberRef.
Information quality (IQ)The user’s cognition of the information provided by the system in terms of its usefulness, ease of understanding, integrity, immediacy, and correctness degree.The VR education system of the Ruins of Saint Paul’s in Macao is responsive during operation.IQ1[37,38,39]
The VR education system of the Ruins of Saint Paul’s in Macao can be used anytime there is an Internet connection.IQ2
The VR education system of the Ruins of Saint Paul’s in Macao transmits information and graphics smoothly.IQ3
The VR education system of the Ruins of Saint Paul’s in Macao is simple in terms of operation and learning.IQ4
The information in the VR education system of the Ruins of Saint Paul’s in Macao is easy to browse.IQ5
The operating interface for the VR education system of the Ruins of Saint Paul’s in Macao is easy to understand and operate.IQ6
System quality (SQ)The user’s cognition of the information provided by the content information of the system in terms of its usefulness, ease of understanding, integrity, immediacy, and correctness degree.The content of the VR education system of the Ruins of Saint Paul’s in Macao is relevant to the on-site information.SQ1[37,44]
The information provided by the VR education system of the Ruins of Saint Paul’s in Macao is trustworthy.SQ2
The VR education system of the Ruins of Saint Paul’s in Macao can update information in real-time.SQ3
The information provided by the VR education system of the Ruins of Saint Paul’s in Macao meets my needs.SQ4
The information table in the VR education system of the Ruins of Saint Paul’s in Macao is easy to understand.SQ5
The function icons on the VR education system of the Ruins of Saint Paul’s in Macao are brief and clear.SQ6
Behavioral intentions (BI)The subjective cognition of the user to use VR systems in the future.I plan to use the VR education system of the Ruins of Saint Paul’s in Macao to learn about VR tourism teachingBI1[45,46,47]
I plan to use the VR education system of the Ruins of Saint Paul’s in Macao to help me understand the city’s history and cultural stories.BI2
I plan to use the VR education system of the Ruins of Saint Paul’s in Macao frequently to learn the history of the city’s development.BI3
User Learning Satisfaction
(ULSAT)
An emotional state generated by the user’s evaluation of past experiences with information searching in the VR system.The VR education system of the Ruins of Saint Paul’s in Macao makes me more interested in learning content.ULSAT1[40,48,49,50]
The VR education system of the Ruins of Saint Paul’s in Macao makes me more interested in knowledge related to history and culture.ULSAT2
The VR education system of the Ruins of Saint Paul’s in Macao makes the whole learning process more interesting.ULSAT3
I think the VR education system of the Ruins of Saint Paul’s in Macao is an effective teaching and tourism experience tool.ULSAT4
I think the VR education system of the Ruins of Saint Paul’s in Macao makes me satisfied with this research.ULSAT5
I hope to have this system to help me learn and experience in every class I attend.ULSAT6
On the whole, after experiencing the VR education system of the Ruins of Saint Paul’s in Macao, I think it has a friendly atmosphere, and it is conducive to my complete understanding and learning.ULSAT7
Involvement (IV)The degree to which users perceive the VR system to be relevant to their personal information needs.I think the VR education system of the Ruins of Saint Paul’s in Macao meets my needs.IV1[41]
I think that using the VR education system of the Ruins of Saint Paul’s in Macao is helpful for understanding tourism knowledge.IV2
I often use the VR education system of the Ruins of Saint Paul’s in Macao to learn about urban development stories.IV3
Table 3. Ubiquitous concepts and learning objectives in system content design.
Ubiquitous ConceptsLearning ObjectivesLearning Content DesignRef.
PermanencyThe system could record the learning process at any time, and the learners could repeat and continuously practice concepts to understand the instructional content.The instructions for the experience and instructional content of this part are as follows:
The system could record the operation experience process, and the users could learn the history and architectural structure of important scenic spots near the Ruins of Saint Paul’s in accordance with the AR and VR content.
The system could provide tips for concepts that were hard to understand. In addition, users could also re-watch and conduct operation practice.
[55,56,57]
AccessibilityUsers could use smartphones or computers to scan or download learning information.Users were provided with the executable file and the internet linkage to the system. The system could be downloaded through a network computer. In addition, computers at home could be used to connect with the system and store relevant digital data.
ImmediacyOnline access to digital content was available at any time.Users could use a mobile device to download the app or connect to a computer to access the system at any time.
InteractivityLearners could interact with virtual characters in the system.The features of AR and VR were utilized to achieve interactive effects. Users could freely choose devices for digital learning and activities, and interact with virtual characters.
Contextualization of instructional activitiesConcepts formed through observation and understanding were integrated into everyday life. If users were in a live space, they could use the app for guided tours and learn knowledge in the treasure hunting game.Knowledge learned from smartphones and computer platforms using AR and VR could be seen in the actual travel scene. Users could combine digital content with the live space and use the game experience to enhance the learning effect.
Table 4. Frequencies and percentages of the observable variables.
VariableLevelNumberPercentage
GenderMale3863.33%
Female2236.67%
Number of local travel websites or apps used in MacaoOne4270%
Two1016.67%
More than two813.33%
Experience with relevant digital devicesAR3355%
VR1220%
Both1016.67%
Neither58.33%
Table 5. Evaluation scores of the system quality questionnaire.
Evaluation ContentQuestionnaire ItemMeanStandard DeviationOverall MeanCronbach’s α
Information QualityThe VR education system of the Ruins of Saint Paul’s in Macao responds rapidly during operation.IQ14.510.7204.410.741
VR education system of the Ruins of Saint Paul’s Macao can be used anytime there is an Internet connection.IQ24.300.887
The VR education system of the Ruins of Saint Paul’s in Macao transmits information and graphics smoothly.IQ34.700.462
The VR education system of the Ruins of Saint Paul’s in Macao is simple in terms of operation and learning.IQ44.000.843
The information in the VR education system of the Ruins of Saint Paul’s in Macao is easy to browse.IQ54.650.659
The operating interface on the VR education system of the Ruins of Saint Paul’s in Macao is easy to understand and operate.IQ64.300.720
Table 6. Evaluation scores of the information quality questionnaire.
Evaluation ContentNumber of QuestionsMeanStandard DeviationOverall MeanCronbach’s α
Information qualityThe content of the VR education system of the Ruins of Saint Paul’s in Macao is relevant to the on-site information.SQ14.060.7324.260.734
The information provided by the VR education system of the Ruins of Saint Paul’s in Macao is trustworthy.SQ24.251.016
The VR education system of the Ruins of Saint Paul’s in Macao can update information in real-time.SQ34.020.462
The information provided by the VR education system of the Ruins of Saint Paul’s in Macao meets my needs.SQ44.450.674
The messages in the VR education system of the Ruins of Saint Paul’s in Macao are clear and organized (easy to understand).SQ54.600.588
The function icons on the VR education system of the Ruins of Saint Paul’s in Macao are brief and clear.SQ64.200.755
Table 7. Evaluation scores of users’ learning satisfaction.
Evaluation ContentItemsMeanStandard DeviationOverall MeanCronbach’s α
Users’ learning satisfactionThe VR education system of the Ruins of Saint Paul’s in Macao makes me more interested in the learning content.ULSAT14.410.6684.450.852
The VR education system of the Ruins of Saint Paul’s in Macao makes me more interested in knowledge related to history and culture.ULSAT24.750.436
The VR education system of the Ruins of Saint Paul’s in Macao makes the whole learning and experience process more interesting.ULSAT34.401.071
I think the VR education system of the Ruins of Saint Paul’s in Macao is an effective teaching and tourism experience tool.ULSAT44.550.594
I think the VR education system of the Ruins of Saint Paul’s in Macao makes me satisfied with this research.ULSAT54.250.773
I hope to have this system help me learn and experience in every class I attend.ULSAT64.110.845
On the whole, after experiencing the VR education system of the Ruins of Saint Paul’s in Macao, I think the system has a friendly atmosphere and is conducive to my complete understanding and learning.ULSAT74.700.561
Table 8. ANOVA Comparison Test for Different Groups.
VR Tour Group vs. AR Treasure Hunting Group
VR Tour Group (n = 30)AR Treasure Hunting Group (n = 30)F-ValueScheffe’s Test
VariablesMSDMSD
Behavioral intentions (BI)71.418.2287.515.418.22 ***AR > VR
Learning effects (LE)80.257.1688.564.2112.52 ***AR > VR
Users’ learning satisfaction (ULS)72.516.2286.325.7113.24 ***AR > VR
*** p < 0.001.
Table 9. Research hypotheses and verification results.
Low InvolvementHigh Involvement
HypothesisHypothesis Path NamePath Coefficientt ValueR2Path Coefficientt ValueR2Hypothesis Support
H1System quality (SQ) → Behavioral intentions (BI)0.2481 **2.252 0.524 ***6.852 Supported
H2Information quality (IQ) → Behavioral intentions (BI)0.158 *2.368 0.657 ***9.223 Supported
H3Behavioral intentions (BI) → Learning effects (LE)0.1231.268 0.6015 ***9.065 Only be supported at high involvement
Behavioral intentions (BI) 0.256 0.412
Learning effects (LE) 0.287 0.572
*: p < 0.05, **: p < 0.01, ***: p < 0.001.
Table 10. Multi-group analysis results for the high-involvement and low-involvement groups.
HypothesisHypothesis Path NameSpB1–B2t ValueDifference of Influence
H1System quality (SQ) → Behavioral intentions (BI)0.0652780.390251.23Significant
H2Information quality (IQ) → Behavioral intentions (BI)0.0722540.02575.21Significant
H3Behavioral intentions (BI) → Learning effects (LE)0.0678570.294137.54Significant
Disclaimer/Publisher’s Note: The statements, opinions and data contained in all publications are solely those of the individual author(s) and contributor(s) and not of MDPI and/or the editor(s). MDPI and/or the editor(s) disclaim responsibility for any injury to people or property resulting from any ideas, methods, instructions or products referred to in the content.

