Article

Can Dried Fruits Replace Unhealthy Snacking among Millennials? An Empirical Study on Dried Fruit Consumption in Italy

Department of Agricultural, Food and Forest Sciences, University of Palermo, Viale delle Scienze, Edificio 4, 90128 Palermo, Italy
*
Author to whom correspondence should be addressed.
Sustainability 2023, 15(9), 7083; https://doi.org/10.3390/su15097083
Submission received: 2 March 2023 / Revised: 12 April 2023 / Accepted: 21 April 2023 / Published: 23 April 2023

Abstract

:
The consumption of dried fruits in place of unhealthy snacks, which are rich in sugars, salt, and fats, could represent a valid option for reaching the daily intake recommended by the WHO for fruits and for encouraging the adoption of a sustainable diet. However, the consumption of dried fruits is lower than that of unhealthy snacks, especially among young people. Therefore, to foster young people’s intentions to consume dried fruits instead of unhealthy snacks, it is important to identify the factors underlying millennials’ consumption intentions. Using a convenience sample of 174 Italian millennials, this paper aimed to understand the factors influencing young people’s intentions to consume dried fruits by measuring their willingness to pay a price premium. The findings showed that under half of respondents were willing to pay an extra premium for dried fruits. The intentions to consume dried fruits among Italian millennials would seem to be characterized by a certain predisposition toward novelty, as revealed by the attitudes of being neophiliacs, as well as by convenience and emotional aspects related to the product. Relative to socio-demographic factors, Italian millennials with higher household incomes and high educational levels tended to show a high willingness to pay a price premium for dried fruits. These results may have theoretical, managerial as well as policy implications. They could enrich the existing literature on dried fruits consumption and provide suggestions for practitioners wishing to adopt effective marketing strategies and specific promotion campaigns, as well as for government policies or programs.

1. Introduction

According to the World Health Organization (WHO), to prevent non-communicable diseases, including cardiovascular disease, cancer and other chronic diseases, the recommended daily intake of fresh fruits and vegetables should reach 400 g [1]. This daily intake provides the diet with an optimal source of fiber and micronutrients, which are functional for maintaining good human health [2,3]. However, the global fruit and vegetable intake is below the threshold recommended by the WHO [4]. For example, in Australia, only 6.1% of adults eat the WHO’s recommended amount of fruits and vegetables [5]; in the United States, only one in ten adults meet this daily intake [6]; while in the European Union, only one in three people reach the WHO’s recommended intake [7]. This is especially true among young adults, whose fruit and vegetable intake is particularly suboptimal [8]. In the United States, only 9.2% of young people eat the WHO’s recommended amount of fruit, and only 6.7% eat the recommended amount of vegetables [9]. Similarly, in the UK, only 8% of adolescents meet the WHO’s recommended daily intake of fruits and vegetables [10]. Furthermore, in parallel with the low consumption of fruits and vegetables among young people, there is growing consumption of unhealthy foods, which represent an important preventable risk factor for chronic diseases and obesity [4,11]. Among these foods, a key role is played by unhealthy snacks (e.g., salty chips, chocolates, desserts, etc.) that are rich in saturated fat, salt and refined sugar [12,13]. Consumption of unhealthy snacks has increased over the last few years worldwide [11], and a recent survey estimates that salty crisps represent the favorite snack for 66% of UK consumers, followed by cookies (63%) and chocolates (60%) [14]. Millennials represent the largest consumer market target for snacks and, on average, 50% of them eat 3.5 snacks a day [15]. Indeed, this generation consumes a large amount of easy-to-eat products, as millennials are often out for meals more than other generations [16,17,18]. Therefore, governments, researchers, and practitioners need to make efforts to encourage a higher daily intake of fruits and vegetables in substitution for unhealthy snacks [13,19]. Several studies have shown that making fruits and vegetables easily accessible to consumers can increase their daily intake among young people [20,21]. For example, Hyldelund and colleagues [22] found that vegetable intake among millennials increases when they are readily available and conveniently served. For their part, Cano-Lamadrid et al. [23] highlighted that smoothies can be an easy way to increase fruit and vegetable consumption among millennials.
In this context, an interesting tool to improve fruit consumption is represented by dried fruits, which are characterized by the removal of water from fresh fruits through sun-drying or various processing techniques, which increases their shelf life [24]. These products have a content of nutrients similar to their fresh counterparts but more concentrated. They are easily stored, transported, and consumed, allowing consumers to eat fruits even outside of their season [25]. Although dried fruits have several beneficial and positive aspects that meet the growing consumer demand for healthy and convenient products [26,27], their consumption is still much less than a single recommended portion/day (30 g) [25]. According to the latest available data [28], the U.S. per capita consumption of dried fruits amounts to 2.9 g/day, while in the UK the average daily intake is equal to 3 g, ranging from 6 g among over 65-year-olds to only 2 g among younger people (until 18-years-old) [29].
Several studies in the literature have analyzed consumers’ preference for dried fruits, trying to understand the factors underlying the choice to consume them [30,31,32]. For example, Sabe et al. [33] showed that familiarity with the product is the most important determinant of purchase intention, while Jesionkowska and colleagues [34] highlighted that health aspects are the main determinants in the choice of dried fruits as perceived as rich in functional ingredients. Similarly, a study by Sun and Liang [30], which segmented consumers’ preference for dried fruits based on their age, found that younger people consider health-related aspects to be the most important factor in the decision-making process, while the convenience features are preferred by older consumers. By contrast, Sijtsema et al. [35] pointed out that dried fruits are not chosen for their healthy characteristics, but rather for their convenience attribute, which makes them preferred over their fresh counterparts. For their part, Alphonce and colleagues [36] showed that consumers are mainly influenced by the taste of dried fruits and their credibility attributes, including organic and fair trade, for which consumers are willing to pay a higher price.
However, to date, it is still unclear whether dried fruits are preferred over unhealthy snacks and what factors influence this preference among millennials. Therefore, the present study has a twofold purpose. Firstly, it aims to better understand whether millennial consumers may prefer dried fruits in substitution for unhealthy snacks. Second, the study tries to understand whether specific consumption habits, perceived values (i.e., health, convenience and emotions) and a tendency to be neophiliac may influence this preference. This is because in the literature, while health, convenience, and emotional properties can play a key role in snack choices inasmuch as they have a significant effect on consumers’ behavior [37], only one study has considered each of them [30]. Moreover, although the willingness to try a new product is often correlated with low food neophobia [38,39], no study on dried fruit consumption has considered it among the main determinants of consumers’ decision-making process.
The remainder of the article is organized as follows. The next section deals with dried fruits’ characteristics; the third section explains the adopted methodology; the fourth section shows the obtained results; the fifth section provides a discussion of the results based on the existent literature; while the last section outlines the conclusions. The findings of our study shed light on the consumption of dried fruits as snacks among millennials and also provide useful suggestions for both firms’ marketing strategies and policy-makers seeking to improve their consumption and reduce the incidence of non-communicable diseases.

2. Dried Fruits’ Characteristics

Several studies have shown that if dried fruits have no added sugar prior to the drying process [25,31,40], they can represent healthier snacks than other ones. These products, in fact, are rich in nutrients, bioactive compounds, and antioxidants that can contribute to reducing the risk of obesity among young consumers, as well as cardiometabolic and other non-communicable diseases [24,41,42]. This is because modern drying processes can maintain several components compared to fresh fruits, ensuring health benefits as well as an improvement in appetite control [42]. Drying is generally an operation that converts a solid or semi-solid material into a solid material with lower moisture content relative to the initial state [43]. The process generally occurs through the vaporization of liquid by supplying heat to whole fruit, halves, slices, pieces, spears, chunks, or cubes. Dried fruits have a long shelf life and lower weight than fresh ones, prolonging their storage and reducing packaging costs. The drying process for fruit impedes microbial degradation as well as fungi and mold growth on the products [44]. Moreover, market-rejected fruit can be converted into dried products, reducing food waste and offering a well-appreciated fruit-derived product.
Sun-drying is the oldest technique. It permits a product with good qualitative traits, but it is subject to environmental contamination and the process is slow [45]. Moreover, the local climatic conditions can substantially influence the drying performance. Today, there are different single or combined drying methods: tray-dryers, conduction (contact or indirect dryers), radiation, microwave, and radio frequency electromagnetic methods [43]. Therefore, drying processes influence the composition and functional properties of fruit [46,47]. The color, flavor, and texture properties are modified, obtaining a new generation of products [48].
The bulk of the production of dried fruits are dried grapes, commonly known as raisins, and table dates, followed by prunes, apricots, cranberries, and figs. Demand for dried tropical fruits in Europe is rising, driven by the healthy snacking trend and the popularity of exotic flavors [49]. Dried tropical fruits are prepared from fruits that are grown in tropical regions or from fruits grown in Italy, such as mango, loquat, and papaya. Unlike fruits imported from tropical countries, Italian fruits are harvested ‘ripe on tree’ and often come from organic supply chains [46,50]. The European market, in fact, places limits on levels of harmful contaminants, such as pesticide residues and mycotoxins [49].

3. Materials and Methods

To investigate which characteristics may influence millennials’ preferences regarding dried fruit consumption, a structured online survey was developed to obtain data for processing. Data were collected in Italy (specifically, in the southern regions of the country) in autumn 2022, and the only conditions required for participation in the survey were belonging to the millennial generation and being a consumer of fruits and snacks in general. As in other studies, we defined millennials as the people born between 1980 and 2000 [51,52]. Following previous similar studies [53], the questionnaire was disseminated through websites, social networks, and word of mouth. Although it is known that this survey method entails some important limitations, such as the non-representativeness of the target population [54], it allows many consumers to be reached in a short time and without the use of financial resources. For this reason, it was chosen from among several opportunities, although several necessary tools were adopted to minimize possible bias: consequentiality scripts [55], honesty priming [56], and cheap talk [57].
Since Italian millennial consumers of dried fruits could represent a large and unknown population, to determine the simple size, as in other studies [58,59], it was decided to adopt Cochran’s formula [60]:
n = Z 2 p q e 2
where n represents the simple size; Z is the critical value of the confidence level (which for a 99% is equal to 2.58); p represents the expected proportion of respondents from the millennial population (0.5); q is p − 1 (0.5); and e represents the decision precision level (0.10). Therefore, the sample size is equal to 165. To reach this sample size, 212 questionnaires were administered, of which 174 were retained for analysis, while 27.9% of the questionnaires were considered invalid because they were not complete.
The questionnaire was structured into four sections. In the first section, consumption habits were investigated, paying attention to the consumption frequency of fruits (both fresh and dried) and snacks, importance attached to label information, consumption occasion (where usually snacks are consumed) and familiarity (previous experiences) with dried fruits. As far as snack consumption was concerned, this included any sweet or salty packaged snacks (e.g., cereal bars, milk, chocolate) that are high in calories and low in nutrition and that consumers usually eat outside main meals.
In the second section, consumer preferences for dried fruit snacks were investigated. First, the willingness to purchase the product was requested. Subsequently, only those who answered positively to the first question were also asked what price premium they were willing to pay for a 50 g pack of dried fruit snacks (Figure 1).
More specifically, using a drop-down menu with increasing amounts of €0.10 at a time, respondents were asked to indicate the maximum amount they were willing to pay for the purchase of a pack of dried fruit snacks, considering a base price of €1.20. This price represents the symbolic cost of a generic unhealthy snack (e.g., cereal, milk, chocolate). People who wanted to buy the dried fruit snacks without giving a price premium could select the €1.20 option. The choice of setting a basic price (in our case, €1.20) by linking it to the snack usually consumed eliminates possible personal interpretation bias. In fact, in this way, everyone has the same basic condition as a reference. The WTP for dried fruits represented the dependent variable that was subsequently used in the econometric model.
In the third section, various attitudinal and psychological measures were investigated using four different psycho-attitudinal scales (Appendix A). The first adopted scale was the reduced version of the Food Neophobia Scale (FNS) developed by Pliner and Hobden [61]. It is a 6-item scale adopted by previous studies [62,63], and it was chosen to determine the neophiliac traits of respondents [64,65]. The food neophilia variable was the sum of each item score, and it had been constructed by reversing the scores of half statements that have neophobic traits.
Then, a 14-item scale developed by Sun and colleagues [31] was adopted to measure the three dimensions of perceived value of dried fruits. It consists of an 8-item subscale aimed at evaluating the perceived health value (PHV), a 3-item subscale for perceived emotional value (PEV) and a 3-item one for perceived convenience value (PCV).
Finally, in the fourth and last section, the socio-demographic characteristics of consumers were investigated, i.e., gender, educational level, and income of the respondents. As regards education level, it was measured in six categories: elementary school leaving certificate, junior high school leaving certificate, diploma, bachelor’s degree, master’s degree, and doctorate. Respondents’ monthly income was measured, as in other studies [66,67], taking into consideration four categories: ‘With my household income I have a lot of difficulty coping with all the financial expenses that come up during the month’ (Very low), ‘With my household income I have some difficulty coping with all the financial expenses that come up during the month’ (Low), ‘With my household income I have no difficulty coping with all the financial expenses that come up during the month’ (Medium), and ‘With my household income I manage to put some savings aside’ (High).
The data analysis was processed using STATA 16.0 statistical software, and it was divided into two main steps. Initially, a descriptive analysis of the sample was performed to determine possible differences between those who showed a willingness to pay a premium price for dried fruits and those who were not interested in purchasing the product. In particular, the socio-demographic and psychological characteristics of the sample and the purchasing behavior of the consumers were investigated. In the second phase, a tobit regression was performed to measure how the individual variables examined in the analysis could influence the price premium for dried fruits. We chose to use the tobit model in our analysis due to the censored nature of the dependent variable. Specifically, 95 respondents (54.6% of the total sample) indicated that they were not willing to pay a price premium for a 50 g pack of dried fruit snacks, resulting in an accumulation of observations at the baseline value. In the presence of the censored nature of the dependent variable, tobit regression provides consistent parameter estimates [68].
This stochastic model may be expressed by the following relationship:
y t = X t β + u t i f   X t   β + u t > 0 y t = 0     i f   X t   β + u t   0 t = 1 ,   2 ,   ,   N
where N represents the observations, y t is the dependent variable, X t is a vector of the covariates, β is a vector of the unknown coefficients, and u t represents the error term.

4. Results

4.1. Sample Characteristics

The final sample included 174 millennial consumers. All the respondents gave their willingness to buy the snacks. However, giving one’s willingness to buy the dried fruit snacks does not necessarily correspond to giving one’s WTP a higher price premium for the current food product. In fact, 95 consumers declared a WTP of €1.20, which is the same value set for a generic unhealthy snack they usually consume. Based on the declared WTP for the proposed dried fruit snacks, to investigate possible differences between the consumers who declared their WTP for dried fruit snacks and those who did not want to pay an extra price premium, the sample was divided into two subgroups. The respondents’ socio-demographic and psycho-attitudinal characteristics and consumption habits were analyzed for each of them. Table 1 shows the results obtained in detail.
Table 1 shows the variables used for the econometric analysis, specifying how they are made up: ‘Gender’ (0 = Female; 1 = Male), ‘Education’ (0 = Not graduated; 1 = Graduate), ‘Product familiarity’ (0 = No; 1 = Yes) and ‘Consumption occasion’ (0 = Daily routine; 1 = Occasions of leisure).
Regarding the percentages found through the descriptive analysis of the variables, some interesting considerations are apparent. First, 64.56% of those belonging to the ‘willing to pay a price premium’ group have a high degree of education, compared to 49.56% of their counterparts. This would suggest that a more educated consumer might be more likely to choose this product category. Similarly, 85.26% of those who were not willing to pay a price premium for dried fruit snacks stated that they had no previous experience with the product. Finally, regarding the psycho-attitudinal variables, neophiliac traits as well as health and convenience aspects (represented by the FNS, PHV and PCV scales, respectively) were higher in the subgroup that declared a WTP a price premium for dried fruits, whereas the emotional aspect (PEV scale) was much lower in the other subgroup.

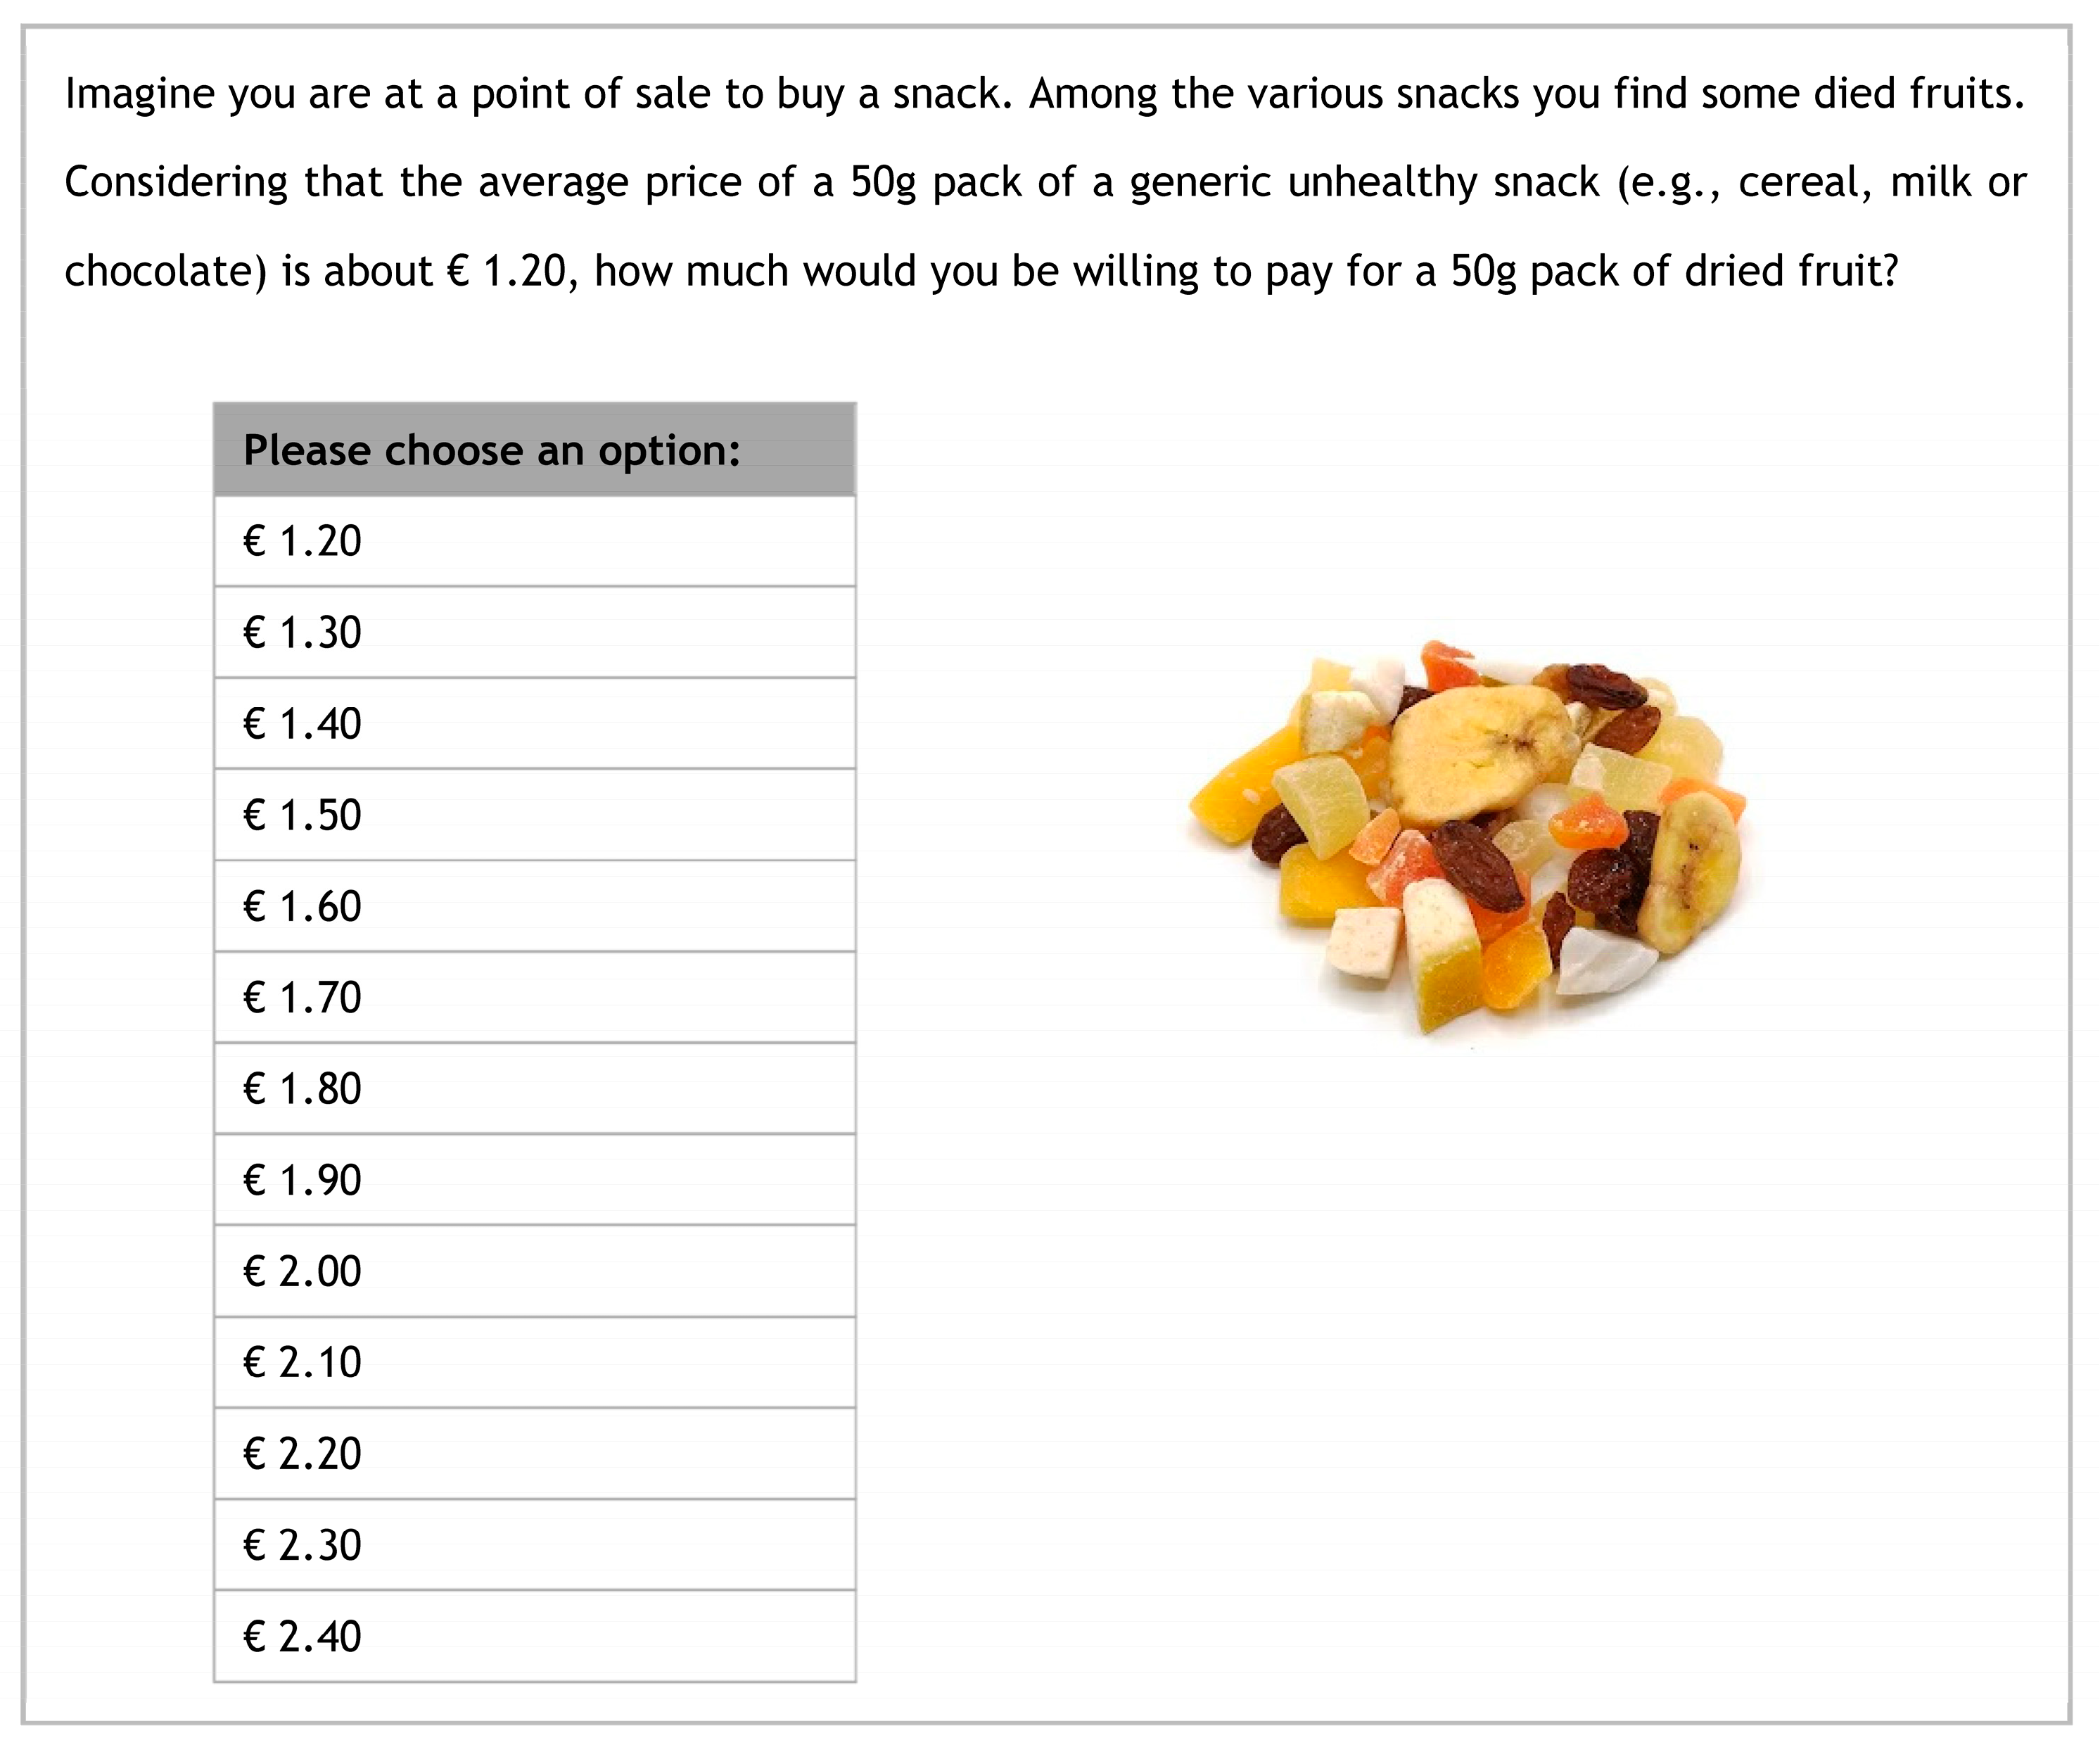
4.2. Willingness to Pay for Dried Fruits

The results reveal that 45.4% of the surveyed consumers were willing to pay a price premium for dried fruits compared to unhealthy snacks, with an average of €1.42. The lowest value offered was €1.20, while the highest was €2.40. The standard deviation was 0.312.
Table 2 shows the individual declared WTPs and their frequencies. About 77% of the sample declared a WTP less than or equal to €1.50, while only about 3% of the respondents gave a very high WTP, that is, greater than or equal to €2.0.
Figure 2 and Figure 3 show the K-density and the box-plot of the respondents who were willing to pay a premium price for dried fruit snacks compared to the base value of €1.20.

4.3. Reliability of Psycho-Attitudinal Scales

To verify the reliability of the four psycho-attitudinal scales, the Cronbach’s alpha was investigated. This coefficient is a statistical indicator used to measure the internal validity among the scale items for a sample of subjects examined. In general, it can be accepted that all the values were greater than or equal to 0.65; therefore, from the results reported in Table 3, a good internal consistency can be confirmed for each of the scales.
Finally, the correlation analysis revealed a low degree of correlation between the variables examined, except for ‘Fruit consumption frequency’ and ‘Snack consumption frequency’, which seemed quite interrelated, showing a correlation value equal to 0.635 (see Appendix B). For this reason, they were eliminated from the conclusive model. However, to investigate the implications of the high percentage of respondents who reported a relatively high frequency of fresh fruit consumption, the correlation between the WTP for dried fruit snacking and the frequency of fresh fruit consumption was observed. It was found to be very low (+0.16), so fresh fruit consumption was not closely correlated with the consumption of dried fruits. Attending to the psycho-attitudinal variables, they showed direct proportionality, i.e., as one increased, so did the other considered. The matrix of correlation is shown in Appendix B.

4.4. Econometric Model

In Table 4, the marginal effects are reported. They represent the variation in the dependent variable when one independent variable varies by one unit, considering all the other independent variables to be the average. If the independent variable is a dummy, the marginal effect explains the variation in the dependent variable, in the passage of the covariate from 0 to 1.
The analysis reveals the relevance of several psycho-attitudinal, experiential, and socio-cultural variables. Among the psycho-attitudinal variables, the ‘FNS scale’ (0.1524), ‘PEV scale’ (0.1363) and ‘PCV scale’ (0.1025) show a positive correlation with the dependent variable. It follows that as the value of these regressors increases, the mean of the dependent variable tends to increase. First, the positive value of the Food Neophilia Scale underlines that millennials are not afraid to taste dried fruits, although they have pleasure when tasting a novelty. Furthermore, this means that millennial consumers choose a dried fruit snack because it comforts them (emotional aspect) and, at the same time, because it is ready-made and easy to consume (convenience aspect).
Conversely, the PHV does not significantly affect the respondents’ WTP, denoting that millennials do not care about the health-related benefits of dried fruits. Among other variables, the one that most influences the consumer is product familiarity (0.2751), followed by education (0.2661) and income (0.1218), while gender, consumption occasion and the importance of reading the label before buying are not significant.

5. Discussion

The findings show that only one out of four of the sample consume daily fruits and just under half of respondents are willing to pay a price premium for dried fruits, highlighting how especially younger consumers continue to prefer unhealthy snacks such as biscuits, chocolate, or chips [13]. This confirms the low consumption of dried fruits among younger people, especially compared to older consumers, as shown by other studies [25,30,31,32,34].
As confirmation that consumers consider dried fruits as niche products that are eaten in small quantities regardless of the place or daily activity [36], the current findings show that the consumption occasion does not affect the respondents’ WTP. This suggests that younger people do not consider dried fruits as unhealthy snacks, which usually are consumed watching TV or during other recreational and work activities [13,69].
One of the main reasons for the low consumption is consumers’ confused perception of dried fruits, which can mislead their choices [25,30,31], despite their beneficial effects on health being recognized in the literature [41,42]. Dried fruits, in fact, having high levels of phenolic acids, flavonoids and carotenoids, are rich in health-promoting substances, representing an important snack for consumers’ dietary needs [70].
A direct consequence of consumers not being able to fully understand the drying process or product typology is that the label does not have a significant influence on their WTP for dried fruits, despite it representing a tool to reduce consumers’ confusion and market asymmetry [71]. On the one hand, this is in contrast with a study by Alphonce and colleagues [36], which showed that consumers of dried fruits pay particular attention to product information and are willing to pay an extra premium for organic, origin and fair-trade attributes. On the other hand, our findings differ from the consumption literature in which it is well-known that the label is increasingly recognized by consumers as a quality attribute, as it improves the image and knowledge of a product in terms of environmental, safety and quality issues [71]. Moreover, this quality attribute is particularly perceived among millennials, who are willing to recognize an extra premium for labelled products thanks to their greater product awareness [51].
Conversely, according to the current findings, dried fruits’ familiarity plays a key role in millennials consumers’ preference. This is true especially for those products that are relatively new on the market [72]. In fact, the higher the product familiarity, the higher the WTP for dried fruits, inasmuch as consumers have no doubts after they have tasted them or are well informed about their benefits. This confirms that product knowledge and previous experience affect positively consumers’ choices and represent two of the most important determinants not only for dried fruits [33] but also for every agri-food product [65,73,74].
Since the label represents a tool to reduce consumers’ confusion as well as to introduce healthy products into their dietary behavior [62], when consumers do not care about the label, they usually do not pay attention to the possible health benefits reported on the package [75]. This could explain the reason why perceived health value does not seem a determinant of the dried fruits choice among millennials. Indeed, according to our results, the respondents’ WTP for dried fruits is not significantly influenced by a high score on the PHV scale, highlighting that product health aspects are not important drivers of millennials’ decision-making process. This is in line with the literature on snack consumption, where younger people often continue to prefer less healthy products as influenced mainly by taste, considering healthier alternatives less attractive [69]. Similarly, Sulistyawati and colleagues [76] have shown that consumers’ preferences for dried fruits are not affected by healthiness, while other factors, including taste, texture and color, seem to influence consumers’ preference. In this context, a recent study by Sun et al. [31] has highlighted that the purchase intention toward dried fruits is negatively affected by perceived health aspects, confirming that in the consumers’ mind dried fruits are not considered healthy food, unlike fresh fruits [35]. Moreover, our findings are in contrast with previous studies in which consumers consider health-related and nutritional aspects among the most important attributes for their choices [27,31,32,34], even for younger people [30]. Dried fruits, in fact, are mainly consumed by people with higher diet quality to reach the fruit daily intake recommendations [41].
Unlike the perceived health value, the current results show that both convenience and emotional ones positively affect millennials’ WTP for dried fruits. Specifically, our findings suggest that consumers who score higher on both the PCV and PEV scales are more likely to have a higher WTP for dried fruits. This is in line with the literature on snack consumption for which the practicality and emotional values are two key factors for consumer choices among the youngest. In fact, snacks are mainly consumed outside the main meals, and for this reason, they need be easy to eat or to find [13,69]. Furthermore, young people want to have emotional experiences from snacking when they are with their friends and peers, satisfying their socialization demand [69,77]. This is in line with other studies that have shown that millennials are more likely to consume a product when they are on social occasions [51]. In this way, although dried fruits are still consumed by a low share of millennials representing a relatively new and little-known market sector, these products could have a high growth potential. Millennials, in fact, recognize these products as a snack and begin to eat and share them during all daily occasions [30], leading consumers to an increase in their satisfaction [78]. However, this is in contrast to Sun and colleagues’ study [31], which found that emotional values have no effect on the choice to consume dried fruits.
The econometric model shows that another import factor affecting positively the WTP of the respondents for dried fruits is their food neophilia, which is the tendency to seek to taste something new [65]. Although in the literature on dried fruit consumers no study has paid attention to neophiliac traits, our findings confirm that one of the main determinants of consumers’ acceptance of a new product is represented by a high neophilia predisposition [62,65]. A food neophobia attitude, in fact, represents an obstacle when new products are launched in the market [38,39,79]. This is because the intake of food within one’s body intimately involves the consumer, who has to evaluate what he is eating before each meal, especially if it is a new or unknown food [80]. In this context, our results highlight that consumers with a low score for food neophobia are also familiar with the product, because previous positive experiences reassure their choices, as demonstrated by other studies [81,82].
As regards the socio-demographic variables, consumers with a higher education level and income are willing to pay a higher price premium for dried fruits. These results corroborate previous studies in which education level and income positively affected dried fruit consumption [32,36,41]. Conversely, unlike other studies in which females paid more attention to dried fruits [32,33,36], the findings have shown that gender does not significantly affect the WTP of the respondents.

6. Conclusions

The aim of this study was to investigate the factors motivating millennials to choose dried fruits over unhealthy snacks. This study is one of the first to focus on this topic, specifically concerning millennial consumers. Our findings show that approximately half of the respondents were willing to pay an average price premium of €0.22 for dried fruit snacks compared to unhealthy options. The respondents were characterized by neophiliac traits and driven by convenience and emotional reasons rather than health-related factors. Moreover, the consumers’ previous experiences with dried fruits, high levels of education, and income were also found to have a positive influence on the WTP.
The results may have theoretical, managerial as well as policy implications.
As regards the theoretical implications, the study enriches the existent literature on dried fruit consumption as snacks by trying to understand the factors affecting millennials’ food choices. To improve dried fruit consumption, knowledge of millennials’ behavior is a very important issue because they are the main market target for snack consumption as well as a key segment for preventing non-communicable diseases.
From a managerial perspective, our findings provide useful suggestions for firms seeking to adopt effective marketing strategies aimed at reaching the specific needs of the millennial market target. To improve dried fruit consumption, firms should emphasize the emotional and convenience aspects as well as better specify the drying process and health benefits of dried fruits by means of the label to reduce the confusion and misconceptions among millennials. To this end, specific promotion campaigns by means of government policies or programs could improve consumers’ knowledge of the health-related aspects of dried fruits. This could contribute to further increasing the consumption of fruits, representing an important tool to reach the daily intake threshold of fruits and vegetables as recommended by the WHO, especially among younger people.
Although this study shed light on millennials’ preference for dried fruits, our findings have some limitations. First, this study refers to a small convenience sample and, therefore, the resulting information represents a guideline that cannot be generalized to the entire population. Furthermore, to obtain a more exhaustive picture of dried fruit consumption among millennials, further studies could also take into consideration other factors involved in the decision-making process, such as pleasure, price, or availability. Moreover, to mitigate hypothetical and social bias deriving from online surveys, other studies could determine the WTP by means of experimental studies. In fact, if the choice to fix a base price reduces the possible personal interpretative biases, it may happen that when a consumer wishes to purchase the product at a lower price, this information is not detectable, given the choice of a fixed starting point.
Finally, since no specific theoretical framework has been adopted, further studies should be carried out considering a specific behavioral theory or model to better understand millennials’ choices concerning dried fruits.

Author Contributions

Conceptualization, R.T., G.R. and G.M.; methodology, R.T. and G.M.; validation, V.F. and G.S.; formal analysis, G.R. and R.T.; investigation, R.T. and I.T.; data curation, G.R., G.M. and R.T.; writing—original draft preparation, R.T., G.R., I.T. and F.V.; writing—review and editing, G.M. and V.F.; visualization, F.V. and G.S.; supervision, G.M. All authors have read and agreed to the published version of the manuscript.

Funding

This research received no external funding.

Institutional Review Board Statement

This study was conducted in accordance with the Declaration of Helsinki.

Informed Consent Statement

All the participants provided informed consent to take part in the study and all the data were fully anonymous and processed anonymously.

Data Availability Statement

Data will be made available on request.

Conflicts of Interest

The authors declare no conflict of interest.

Appendix A. Items of Adopted Scales

ScaleItems
Food Neophilia ScaleI am constantly sampling new and different foods
I don’t trust new foods (R)
If I don’t know what is in a food, I won’t eat it (R)
I am afraid to eat things I have never had before (R)
I will eat almost anything
At dinner parties I will try a new food
Perceived Health ValueDried fruit is beneficial for health
Dried fruit is nutritious
Dried fruit is easily digestible
Dried fruit contains vitamins
Dried fruit contains protein
Dried fruit contains prebiotics
Dried fruit contains antioxidants
Dried fruit reduces the risk of heart disease
Perceived Emotional ValueI eat dried fruit when I feel happy
I eat dried fruit when I feel frustrated
I eat dried fruit when I feel angry
Perceived Convenience ValueDried fruit is easily eaten
Dried fruit is easy to store
Dried fruit is easy to carry

Appendix B. Matrix of Correlation

Variables(1)(2)(3)(4)(5)(6)(7)(8)(9)(10)(11)(12)
(1) Gender1.000
(2) Education−0.2451.000
(3) Monthly income0.0930.0061.000
(4) Product familiarity0.255−0.099−0.0081.000
(5) Fruit consumption freq.−0.0160.0860.030−0.0111.000
(6) Snack consumption freq.0.039−0.139-0.0030.0850.6351.000
(7) Label importance0.4210.089-0.1030.0130.0690.0591.000
(8) Consumption occasion0.1030.1900.1350.0020.016−0.106−0.0711.000
(9) FNS scale0.086−0.0150.1270.115−0.025−0.0660.0040.0351.000
(10) PHV scale0.1620.0670.0870.274−0.0010.0400.1570.0390.1141.000
(11) PEV scale0.200−0.063−0.0330.1640.028−0.0050.1510.034−0.0360.3841.000
(12) PCV scale0.0150.0690.0700.1830.025−0.0740.0470.0190.1770.5490.2941.000

References

  1. World Health Organization (WHO). Report of the Formal Meeting of Member States to Conclude the Work on the Comprehensive Global Monitoring Framework, including Indicators, and A Set of Voluntary Global Targets for the Prevention and Control of Communicable Diseases. 2012. Available online: http://apps.who.int/gb/NCDs/pdf/A_NCD_2-en.pdf (accessed on 9 January 2023).
  2. Aune, D.; Giovannucci, E.; Boffetta, P.; Fadnes, L.T.; Keum, N.; Norat, T.; Greenwood, D.C.; Riboli, E.; Vatten, L.J.; Tonstad, S. Fruit and vegetable intake and the risk of cardiovascular disease, total cancer and all cause mortality—A systematic review and dose-response meta analysis of prospective studies. Int. J. Epidemiol. 2017, 46, 1029–1056. [Google Scholar] [CrossRef] [PubMed]
  3. Slavin, J.L.; Lloyd, B. Health benefits of fruits and vegetables. Adv. Nutr. 2012, 3, 506–516. [Google Scholar] [CrossRef] [PubMed]
  4. Afshin, A.; Sur, P.J.; Fay, K.A.; Cornaby, L.; Ferrara, G.; Salama, J.; Mullany, E.; Abate, K.H.; Abbafati, C.; Abebe, Z.; et al. Health effects of dietary risks in 195 countries, 1990–2017: A systematic analysis for the Global Burden of Disease Study 2017. Lancet 2019, 393, 1958–1972. [Google Scholar] [CrossRef]
  5. Australian Bureau of Statistics. Key Statistics and Data about Child and Adult Consumption of Fruit, Vegetables, Sugar Sweetened, and Diet Drinks. 2022. Available online: https://www.abs.gov.au/statistics/health/health-conditions-and-risks/dietary-behaviour/latest-release (accessed on 9 January 2023).
  6. Centers for Disease Control and Prevention (CDC). Disparities in State-Specific Adult Fruit and Vegetable Consumption—United States, 2015. 2017. Available online: https://www.cdc.gov/mmwr/volumes/66/wr/mm6645a1.htm?s_cid=mm6645a1_w (accessed on 9 January 2023).
  7. Eurostat. How Much Fruit and Vegetables Do You Eat Daily? 2019. Available online: https://ec.europa.eu/eurostat/web/products-eurostat-news/-/ddn-20220104-1 (accessed on 9 January 2023).
  8. Nour, M.; Sui, Z.; Grech, A.; Rangan, A.; McGeechan, K.; Allman-Farinelli, M. The fruit and vegetable intake of young Australian adults: A population perspective. Public Health Nutr. 2017, 20, 2499–2512. [Google Scholar] [CrossRef]
  9. Lee-Kwan, S.H.; Moore, L.V.; Blanck, H.M.; Harris, D.M.; Galuska, D. Disparities in state-specific adult fruit and vegetable consumption—United States, 2015. Morb. Mortal. Wkly. Rep. 2017, 66, 1241. [Google Scholar] [CrossRef] [PubMed]
  10. Ensaff, H. A nudge in the right direction: The role of food choice architecture in changing populations’ diets. Proc. Nutr. Soc. 2021, 80, 195–206. [Google Scholar] [CrossRef]
  11. De Vet, E.; Stok, F.M.; De Wit, J.B.; De Ridder, D.T. The habitual nature of unhealthy snacking: How powerful are habits in adolescence? Appetite 2015, 95, 182–187. [Google Scholar] [CrossRef]
  12. Amrein, M.A.; Scholz, U.; Inauen, J. Compensatory health beliefs and unhealthy snack consumption in daily life. Appetite 2021, 157, 104996. [Google Scholar] [CrossRef]
  13. Hess, J.M.; Jonnalagadda, S.S.; Slavin, J.L. What is a snack, why do we snack, and how can we choose better snacks? A review of the definitions of snacking, motivations to snack, contributions to dietary intake, and recommendations for improvement. Adv. Nutr. 2016, 7, 466–475. [Google Scholar] [CrossRef] [PubMed]
  14. Statista. Global Snack Food Market—Statistics&Facts. 2022. Available online: https://www.statista.com/topics/7781/global-snack-food-market/#dossierKeyfigures (accessed on 27 January 2023).
  15. USDA Foreign Agricultural Service. The Dutch Food Retail Report 2019. 2019. Available online: https://apps.fas.usda.gov/newgainapi/api/report/downloadreportbyfilename?filename=Retail%20Foods_The%20Hague_Netherlands_6-26-2019.pdf (accessed on 27 January 2023).
  16. Okumus, B. A qualitative investigation of Millennials’ healthy eating behavior, food choices, and restaurant selection. Food Cult. Soc. 2021, 24, 509–524. [Google Scholar] [CrossRef]
  17. Kuhns, A.; Saksena, M. Food Purchase Decisions of Millennial Households Compared to Other Generations; EIB-186; U.S. Department of Agriculture, Economic Research Service: Washington, DC, USA, 2017. [Google Scholar]
  18. Allman-Farinelli, M.; Partridge, S.R.; Roy, R. Weight-related dietary behaviors in young adults. Curr. Obes. Rep. 2016, 5, 23–29. [Google Scholar] [CrossRef]
  19. Vatanparast, H.; Islam, N.; Patil, R.P.; Shafiee, M.; Smith, J.; Whiting, S. Snack consumption patterns among Canadians. Nutrients 2019, 11, 1152. [Google Scholar] [CrossRef]
  20. DeCosta, P.; Møller, P.; Frøst, M.B.; Olsen, A. Changing children’s eating behaviour—A review of experimental research. Appetite 2017, 113, 327–357. [Google Scholar] [CrossRef]
  21. Andreyeva, T.; Luedicke, J. Incentivizing fruit and vegetable purchases among participants in the Special Supplemental Nutrition Program for Women, Infants, and Children. Public Health Nutr. 2015, 18, 33–41. [Google Scholar] [CrossRef]
  22. Hyldelund, N.B.; Worck, S.; Olsen, A. Convenience may increase vegetable intake among young consumers. Food Qual. Prefer. 2020, 83, 103925. [Google Scholar] [CrossRef]
  23. Cano-Lamadrid, M.; Tkacz, K.; Turkiewicz, I.P.; Clemente-Villalba, J.; Sánchez-Rodríguez, L.; Lipan, L.; Wojdyło, A. How a Spanish group of millennial generation perceives the commercial novel smoothies? Foods 2020, 9, 1213. [Google Scholar] [CrossRef] [PubMed]
  24. Chang, S.K.; Alasalvar, C.; Shahidi, F. Review of dried fruits: Phytochemicals, antioxidant efficacies, and health benefits. J. Funct. Foods 2016, 21, 113–132. [Google Scholar] [CrossRef]
  25. Sadler, M.J.; Gibson, S.; Whelan, K.; Ha, M.A.; Lovegrove, J.; Higgs, J. Dried fruit and public health–what does the evidence tell us? Int. J. Food Sci. Nutr. 2019, 70, 675–687. [Google Scholar] [CrossRef] [PubMed]
  26. Testa, R.; Schifani, G.; Migliore, G. Understanding consumers’ convenience orientation. An exploratory study of fresh-cut fruit in Italy. Sustainability 2021, 13, 1027. [Google Scholar] [CrossRef]
  27. Asioli, D.; Rocha, C.; Wongprawmas, R.; Popa, M.; Gogus, F.; Almli, V.L. Microwave-dried or air-dried? Consumers’ stated preferences and attitudes for organic dried strawberries. A multi-country investigation in Europe. Food Res. Int. 2019, 120, 763–775. [Google Scholar] [CrossRef]
  28. Statista. Dried Fruit Market—Statistics&Facts. 2022. Available online: https://www.statista.com/topics/6002/dried-fruit-market/#topicHeader__wrapper (accessed on 23 January 2023).
  29. Public Health England. National Diet and Nutrition Survey Results from Years 7 and 8 (combined) of the Rolling Programme (2014/2015–2015/2016). 2018. Available online: https://www.gov.uk/government/statistics/ndns-results-from-years-7-and-8-Combined (accessed on 11 January 2023).
  30. Sun, Y.; Liang, C. Effects of determinants of dried fruit purchase intention and the related consumer segmentation on e-commerce in China. Br. Food J. 2021, 123, 1133–1154. [Google Scholar] [CrossRef]
  31. Sun, Y.; Liang, C. Factors determining consumers’ purchase intentions towards dried fruits. Int. J. Fruit Sci. 2020, 20 (Suppl. 2), S1072–S1096. [Google Scholar] [CrossRef]
  32. Cinar, G. Consumer perspective regarding dried tropical fruits in Turkey. Ital. J. Food Sci. 2018, 30, 809–827. [Google Scholar]
  33. Sabbe, S.; Verbeke, W.; Van Damme, P. Familiarity and purchasing intention of Belgian consumers for fresh and processed tropical fruit products. Br. Food J. 2008, 110, 805–818. [Google Scholar] [CrossRef]
  34. Jesionkowska, K.; Sijtsema, S.J.; Konopacka, D.; Symoneaux, R. Dried fruit and its functional properties from a consumer’s point of view. J. Hortic. Sci. Biotechnol. 2009, 84, 85–88. [Google Scholar] [CrossRef]
  35. Sijtsema, S.J.; Jesionkowska, K.; Symoneaux, R.; Konopacka, D.; Snoek, H. Perceptions of the health and convenience characteristics of fresh and dried fruits. LWT-Food Sci. Technol. 2012, 49, 275–281. [Google Scholar] [CrossRef]
  36. Alphonce, R.; Temu, A.; Almli, V.L. European consumer preference for African dried fruits. Br. Food J. 2015, 117, 1886–1902. [Google Scholar] [CrossRef]
  37. Ryu, K.; Lee, H.R.; Kim, W.G. The influence of the quality of the physical environment, food, and service on restaurant image, customer perceived value, customer satisfaction, and behavioral intentions. Int. J. Contemp. Hosp. Manag. 2012, 24, 200–223. [Google Scholar] [CrossRef]
  38. Palmieri, N.; Nervo, C.; Torri, L. Consumers’ attitudes towards sustainable alternative protein sources: Comparing seaweed, insects and jellyfish in Italy. Food Qual. Prefer. 2023, 104, 104735. [Google Scholar] [CrossRef]
  39. Ritchey, P.N.; Frank, R.A.; Hursti, U.K.; Tuorila, H. Validation and cross-national comparison of the food neophobia scale (FNS) using confirmatory factor analysis. Appetite 2003, 40, 163–173. [Google Scholar] [CrossRef]
  40. Magalhães, M.; Santos, D.; Castro, S.M.; Silva, C.L. Nuts and dried fruits potential as functional foods. In Functional Properties of Traditional Foods; Kristbergsson, K., Ötles, S., Eds.; Springer: Boston, MA, USA, 2016; pp. 293–307. [Google Scholar]
  41. Sullivan, V.K.; Na, M.; Proctor, D.N.; Kris-Etherton, P.M.; Petersen, K.S. Consumption of Dried Fruits Is Associated with Greater Intakes of Underconsumed Nutrients, Higher Total Energy Intakes, and Better Diet Quality in US Adults: A Cross-Sectional Analysis of the National Health and Nutrition Examination Survey, 2007–2016. J. Acad. Nutr. Diet. 2021, 121, 1258–1272. [Google Scholar] [CrossRef]
  42. Alasalvar, C.; Salvadó, J.S.; Ros, E. Bioactives and health benefits of nuts and dried fruits. Food Chem. 2020, 314, 126192. [Google Scholar] [CrossRef]
  43. Jayaraman, K.S.; Gupta, D.D. Drying of fruits and vegetables. In Handbook of Industrial Drying; Mujumdar, A.S., Ed.; CRC Press: Boca Raton, FL, USA, 2020; pp. 643–690. [Google Scholar]
  44. Immaculate, J.; Sinduja, P.; Jamila, P. Biochemical and microbial qualities of Sardinella fimbriata sun dried in different methods. Int. Food Res. J. 2012, 19, 1699–1703. [Google Scholar]
  45. Prakash, O.; Kumar, A.; Sharaf-Eldeen, Y.I. Review on Indian solar drying status. Curr. Sustain. Renew. Energy Rep. 2016, 3, 113–120. [Google Scholar] [CrossRef]
  46. Farina, V.; Gentile, C.; Sortino, G.; Gianguzzi, G.; Palazzolo, E.; Mazzaglia, A. Tree-ripe mango fruit: Physicochemical characterization, antioxidant properties and sensory profile of six Mediterranean-grown cultivars. Agronomy 2020, 10, 884. [Google Scholar] [CrossRef]
  47. Fratianni, A.; Adiletta, G.; Di Matteo, M.; Panfili, G.; Niro, S.; Gentile, C.; Farina, V.; Cinquanta, L.; Corona, O. Evolution of carotenoid content, antioxidant activity and volatiles compounds in dried mango fruits (Mangifera indica L.). Foods 2020, 9, 1424. [Google Scholar] [CrossRef]
  48. Tinebra, I.; Passafiume, R.; Scuderi, D.; Pirrone, A.; Gaglio, R.; Palazzolo, E.; Farina, V. Effects of Tray-Drying on the Physicochemical, Microbiological, Proximate, and Sensory Properties of White-and Red-Fleshed Loquat (Eriobotrya Japonica L.) Fruit. Agronomy 2022, 12, 540. [Google Scholar] [CrossRef]
  49. CBI. The European Market Potential for Dried Tropical Fruit. 2023. Available online: https://www.cbi.eu/market-information/processed-fruit-vegetables-edible-nuts/dried-tropical-fruit/market-potential (accessed on 27 February 2023).
  50. Farina, V.; Barone, F.; Mazzaglia, A.; Lanza, C.M. Evaluation of fruit quality in loquat using both chemical and sensory analyses. Acta Hortic. 2011, 887, 345–349. [Google Scholar] [CrossRef]
  51. Nassivera, F.; Gallenti, G.; Troiano, S.; Marangon, F.; Cosmina, M.; Bogoni, P.; Campisi, B.; Carzedda, M. Italian millennials’ preferences for wine: An exploratory study. Br. Food J. 2020, 122, 2403–2423. [Google Scholar] [CrossRef]
  52. Newbold, K.B.; Scott, D.M. Insights into public transit use by Millennials: The Canadian experience. Travel Behav. Soc. 2018, 11, 62–68. [Google Scholar] [CrossRef]
  53. Pomarici, E.; Vecchio, R. Millennial generation attitudes to sustainable wine: An exploratory study on Italian consumers. J. Clean. Prod. 2014, 66, 537–545. [Google Scholar] [CrossRef]
  54. Couper, M.P. The future of modes of data collection. Public Opin. Q. 2011, 75, 889–908. [Google Scholar] [CrossRef]
  55. Vossler, C.A.; Watson, S.B. Understanding the consequences of consequentiality: Testing the validity of stated preferences in the field. J. Econ. Behav. Organ. 2013, 86, 137–147. [Google Scholar] [CrossRef]
  56. Loomis, J.B. 2013 WAEA keynote address: Strategies for overcoming hypothetical bias in stated preference surveys. J. Agric. Resour. Econ. 2014, 39, 34–46. [Google Scholar]
  57. Cummings, R.G.; Taylor, L.O. Unbiased value estimates for environmental goods: A cheap talk design for the contingent valuation method. Am. Econ. Rev. 1999, 89, 649–665. [Google Scholar] [CrossRef]
  58. Rajkumar, S. Impact of social media marketing on buying behavior of Millennial towards Smart Watches in Bangalore city. Turk. Online J. Qual. Inq. 2021, 12, 6932–6944. [Google Scholar]
  59. JagadeeshBabu, M.K.; SaurabhSrivastava, S.M.; AditiPriya Singh, M.B.S. Influence of social media marketing on buying behavior of millennial towards smart phones in bangalore city. PalArch’s J. Archaeol. Egypt/Egyptol. 2020, 17, 4474–4485. [Google Scholar]
  60. Cochran, W.G. Sampling Techniques, 3rd ed.; John Wiley & Sons: Hoboken, NJ, USA, 1977. [Google Scholar]
  61. Pliner, P.; Hobden, K. Development of a scale to measure the trait of food neophobia in humans. Appetite 1992, 19, 105–120. [Google Scholar] [CrossRef] [PubMed]
  62. Coderoni, S.; Perito, M.A. Sustainable consumption in the circular economy. An analysis of consumers’ purchase intentions for waste-to-value food. J. Clean. Prod. 2020, 252, 119870. [Google Scholar] [CrossRef]
  63. Verbeke, W. Profiling consumers who are ready to adopt insects as a meat substitute in a Western society. Food Qual. Prefer. 2015, 39, 147–155. [Google Scholar] [CrossRef]
  64. Knaapila, A.; Laaksonen, O.; Virtanen, M.; Yang, B.; Lagström, H.; Sandell, M. Pleasantness, familiarity, and identification of spice odors are interrelated and enhanced by consumption of herbs and food neophilia. Appetite 2017, 109, 190–200. [Google Scholar] [CrossRef] [PubMed]
  65. Migliore, G.; Farina, V.; Tinervia, S.; Matranga, G.; Schifani, G. Consumer interest towards tropical fruit: Factors affecting avocado fruit consumption in Italy. Agric. Food Econ. 2017, 5, 24. [Google Scholar] [CrossRef]
  66. Caso, G.; Rizzo, G.; Migliore, G.; Vecchio, R. Loss framing effect on reducing excessive red and processed meat consumption: Evidence from Italy. Meat Sci. 2023, 199, 109135. [Google Scholar] [CrossRef]
  67. Rizzo, G.; Testa, R.; Dudinskaya, E.C.; Mandolesi, S.; Solfanelli, F.; Zanoli, R.; Schifani, G.; Migliore, G. Understanding the consumption of plant-based meat alternatives and the role of health-related aspects. A study of the Italian market. Int. J. Gastron. Food Sci. 2023, 32, 100690. [Google Scholar] [CrossRef]
  68. Cameron, A.C.; Trivedi, P.K. Microeconometrics: Methods and Applications; Cambridge University Press: NewYork, NY, USA, 2005. [Google Scholar]
  69. Grunert, K.G.; Brock, S.; Brunsø, K.; Christiansen, T.; Edelenbos, M.; Kastberg, H.; Krogager, S.G.S.; Mielby, L.H.; Povlsen, K.K. Cool snacks: A cross-disciplinary approach to healthier snacks for adolescents. Trends Food Sci. Technol. 2016, 47, 82–92. [Google Scholar] [CrossRef]
  70. Donno, D.; Mellano, M.G.; Riondato, I.; De Biaggi, M.; Andriamaniraka, H.; Gamba, G.; Beccaro, G.L. Traditional and unconventional dried fruit snacks as a source of health-promoting compounds. Antioxidants 2019, 8, 396. [Google Scholar] [CrossRef]
  71. Selvaggi, R.; Zarbà, C.; Pappalardo, G.; Pecorino, B.; Chinnici, G. Italian consumers’ awareness, preferences and attitudes about Sicilian blood oranges (Arancia Rossa di Sicilia PGI). J. Agric. Food Res. 2023, 11, 100486. [Google Scholar] [CrossRef]
  72. Spiteri Cornish, L.; Moraes, C. The impact of consumer confusion on nutrition literacy and subsequent dietary behavior. Psychol. Mark. 2015, 32, 558–574. [Google Scholar] [CrossRef]
  73. Testa, R.; Migliore, G.; Schifani, G.; Tinebra, I.; Farina, V. Chemical–physical, sensory analyses and consumers’ quality perception of local vs. imported Loquat fruits: A sustainable development perspective. Agronomy 2020, 10, 870. [Google Scholar] [CrossRef]
  74. Frez-Muñoz, L.; Steenbekkers, B.; Fogliano, V. The choice of canned whole peeled tomatoes is driven by different key quality attributes perceived by consumers having different familiarity with the product. J. Food Sci. 2016, 81, S2988–S2996. [Google Scholar] [CrossRef] [PubMed]
  75. Silvestri, C.; Cirilli, M.; Zecchini, M.; Muleo, R.; Ruggieri, A. Consumer acceptance of the new red-fleshed apple variety. J. Food Prod. Mark. 2018, 24, 1–21. [Google Scholar] [CrossRef]
  76. Sulistyawati, I.; Dekker, M.; Verkerk, R.; Steenbekkers, B. Consumer preference for dried mango attributes: A conjoint study among Dutch, Chinese, and Indonesian consumers. J. Food Sci. 2020, 85, 3527–3535. [Google Scholar] [CrossRef]
  77. Macht, M. How emotions affect eating: A five-way model. Appetite 2008, 50, 1–11. [Google Scholar] [CrossRef]
  78. Grunert, K.G. Current issues in the understanding of consumer food choice. Trends Food Sci. Technol. 2002, 13, 275–285. [Google Scholar] [CrossRef]
  79. Aschemann-Witzel, J.; Asioli, D.; Banovic, M.; Perito, M.A.; Peschel, A.O. Communicating upcycled foods: Frugality framing supports acceptance of sustainable product innovations. Food Qual. Prefer. 2022, 100, 104596. [Google Scholar] [CrossRef]
  80. Coppola, A.; Verneau, F.; Caracciolo, F. Neophobia in food consumption: An empirical application of the FTNS scale in Southern Italy. Ital. J. Food Sci. 2014, 26, 81–90. [Google Scholar]
  81. Arena, E.; Mazzaglia, A.; Selvaggi, R.; Pecorino, B.; Fallico, B.; Serranò, M.; Pappalardo, G. Exploring consumer’s propensity to consume insect-based foods. Empirical evidence from a study in Southern Italy. Appl. Syst. Innov. 2020, 3, 38. [Google Scholar] [CrossRef]
  82. Hartmann, C.; Shi, J.; Giusto, A.; Siegrist, M. The psychology of eating insects: A cross-cultural comparison between Germany and China. Food Qual. Prefer. 2015, 44, 148–156. [Google Scholar] [CrossRef]
Figure 1. Experimental design.
Sustainability 15 07083 g001
Figure 2. K-density.
Sustainability 15 07083 g002
Figure 3. Box-plot.
Figure 3. Box-plot.
Sustainability 15 07083 g003
Table 1. Sample characteristics.
Variable Total
Sample
(n = 174)
WTP a Price Premium
(n = 79)
Not WTP a Price Premium
(n = 95)
GenderFemale83 (47.7%)32 (40.51%)51 (53.68%)
Male91 (52.3%)47 (59.49%)44 (46.32%)
EducationNot graduated76 (43.68%)28 (35.44%)48 (50.53%)
Graduate or higher98 (56.32%)51 (64.56%)47 (49.47%)
Monthly incomeVery low2 (1.15%)0 (0%)2 (2.11%)
Low34 (19.54%)12 (15.19%)22 (23.16%)
Medium90 (51.72%)41 (51.90%)49 (51.58%)
High48 (27.59%)26 (32.91%)22 (23.16%)
Product familiarityYes42 (24.14%)28 (35.44%)14 (14.74%)
No132 (75.86%)51 (64.56%)81 (85.26%)
Label importanceMean ± S.D.
[Likert scale 1–5]
3.59 ± 1.163.75 ± 1.173.46 ± 1.50
Fruit consumption frequencyOnce a month2 (1.15%)0 (0%)2 (2.11%)
Two/three times a month5 (2.87%)2 (2.53%)3 (3.16%)
Once a week20 (11.49%)11 (13.92%)9 (9.47%)
Two/three times a week48 (27.59%)21 (26.58%)27 (28.42%)
Once a day46 (26.44%)18 (22.78%)28 (29.47%)
More than once a day53 (30.46%)27 (34.18%)26 (27.37%)
Snack consumption frequencyOnce a month0 (0%)0 (0%)0 (0%)
Two/three times a month64 (36.78%)34 (43.04%)30 (31.58%)
Once a week55 (31.61%)20 (25.32%)35 (36.84%)
Two/three times a week42 (24.14%)20 (25.32%)22 (23.16%)
Once a day10 (5.75%)4 (5.06%)6 (6.32%)
More than once a day3 (1.72%)1 (1.27%)2 (2.11%)
Consumption occasionOccasions of leisure37 (21.26%)19 (24.05%)18 (18.95%)
Daily routine137 (78.74%)60 (75.95%)77 (81.05%)
Food Neophilia ScaleSum
[Likert scale 1–5]
272427
PHV scaleMean ± S.D.
[Likert scale 1–6]
4.14 ± 0.994.63 ± 0.854.05 ± 1.02
PEV scaleMean ± S.D.
[Likert scale 1–6]
2.29 ± 1.212.74 ± 1.221.92 ± 1.08
PCV scaleMean ± S.D.
[Likert scale 1–6]
4.77 ± 1.075.11 ± 0.894.48 ± 1.12
Table 2. Respondents’ WTP (€).
WTPFreq.PercentCum.
1.209554.6054.60
1.30137.4762.07
1.4042.3064.37
1.502212.6477.01
1.6010.5777.59
1.7052.8780.46
1.8084.6085.06
1.9031.7286.78
2.001810.3497.13
2.2031.7298.85
2.3010.5799.43
2.4010.57100.00
Total174100.00
Table 3. Reliability of adopted scales.
ScaleCronbach’s Alpha
FNS0.79
PHV0.90
PEV0.84
PCV0.78
Table 4. Factors affecting WTP for dried fruits.
VariableDy/DxStd. Err.ZP > |Z|
Gender 0.13380.10021.340.182
Education0.26610.10302.580.010
Monthly income0.12180.06951.750.080
Product familiarity0.27510.11132.470.014
Label importance0.03000.04280.700.483
Consumption occasion0.05120.11590.440.659
FNS scale0.15640.06262.500.012
PHV scale0.02970.06370.470.641
PEV scale0.13630.04373.120.002
PCV scale0.10250.05861.750.081
Limits: Lower = 1.20 and Upper = +inf; Number Obs = 174 (79 uncensored); LR chi2 (10) = 55.48, Prob > chi2 = 0.0000; Pseudo R2 = 0.1259. Bold variables are significant at 1%, 5% or 10%.
Disclaimer/Publisher’s Note: The statements, opinions and data contained in all publications are solely those of the individual author(s) and contributor(s) and not of MDPI and/or the editor(s). MDPI and/or the editor(s) disclaim responsibility for any injury to people or property resulting from any ideas, methods, instructions or products referred to in the content.

