1. Introduction
Over the past few decades, China has experienced rapid economic development, with GDP rising dramatically from USD 150 billion in 1978 to USD 14.72 trillion in 2020. In the 34 years since the reform and opening up, China’s economy has grown at an average annual rate of 9.9% [
1]. Behind the rapid economic development, many environmental problems are becoming increasingly serious and cannot be ignored [
2]. Among them, greenhouse gas emissions are an imminent problem. China is a major global emitter of carbon dioxide. In 2019, China’s carbon dioxide emissions accounted for approximately 27.9% of global carbon emissions [
3]. Greenhouse gas emissions will lead to global climate change, thus bringing about a climate and environmental crisis that threatens the future survival and development of humanity [
4]. Therefore, a global consensus on carbon neutrality has been reached on the issue of greenhouse gas emissions [
5,
6].
At the 75th session of the United Nations General Assembly, General Secretary Xi Jinping proposed a double carbon target, that is, China should achieve carbon peak by 2030 and carbon neutrality by 2060 [
7]. Combined with the background of the current situation and the global development trend, China must control carbon emissions, promote high-quality economic development and green low-carbon development, and realize the unity of economic development and environmental protection. Since the release of the Kyoto Protocol by the United Nations [
8], carbon emissions trading has been favored by many countries as a means of economic stimulus to control greenhouse gas emissions. In October 2011, China issued the Notice on the Pilot Project of Carbon Emission Trading, and announced that the pilot project of carbon emission trading would be carried out in seven provinces and cities, including Beijing, Shanghai, Tianjin, Chongqing, Hubei, Guangdong, Shenzhen, etc. [
9]. In 2013, Shenzhen took the lead in launching the pilot project of carbon emission trading, and the national carbon emission trading market was opened in 2021 [
3], which means that the carbon trading policy was promoted and implemented nationwide in China. As China is one of the major emitters of carbon dioxide [
10], the implementation of carbon trading policies is of great significance, and it is therefore even more important to study the actual policy effects of carbon trading policies.
In the current economic development paradigm, the marine economy is an indispensable and important part of the national economy, and is also a new driving force for national economic growth. According to the China Marine Economy Statistical Bulletin 2020, the gross marine product in 2020 reached RMB 8001 billion, accounting for 8.1% of the gross domestic product and 14.9% of the gross coastal product [
11]. Meanwhile, the report of the 19th Party Congress proposed to adhere to the integration of land and sea and accelerate the construction of a strong ocean state [
12]. From this, we can see that the construction of an ocean power has also become a top priority as regards national strategy. Therefore, it is necessary for us to pay attention to the development trend of this field of marine economy. China is in a critical period of structural transformation, and the upgrading of the structure of the marine industry cannot be ignored. How can the upgrading of marine industrial structure be affected as a result of the current nationwide promotion and implementation of carbon trading policies? This paper will examine the policy effects of China’s carbon trading policy through a double-difference approach, taking the marine industry structure of China’s coastal provinces from 2010 to 2018 as an example to test whether carbon trading policy can promote the upgrading of the marine industry structure, which will provide suggestions and support for promoting carbon emission trading policy and achieving carbon neutrality, as well as explore new paths for upgrading marine industrial structure and achieve the goal of marine power.
The contributions of this paper are mainly reflected in the following points: Firstly, most of the existing literature focuses on the impact of carbon trading policies on variables such as carbon emission intensity and low-carbon technological innovation, and there are fewer studies on the policy effects of carbon trading policies on the structure of the marine industry. Based on a panel data sample of Chinese coastal provinces and a DID model, this paper investigates the impact of carbon trading policy on the upgrading of marine industry structure and verifies the promotion effect of carbon trading policy on the upgrading of marine industry structure. Secondly, most studies on the policy effects of carbon trading focus on the pilot sites of the policy, and few consider the spatial spillover effects of the policy effects on neighboring regions. This paper explores whether the policy effects of carbon trading policies are spatially heterogeneous through panel data of China’s coastal provinces, and provides suggestions for realizing the synergistic development of the marine economy.
3. Theoretical Analysis and Research Hypothesis
Starting with the implementation of carbon trading policies, no economic entity can emit carbon at will any longer, and the amount of carbon emissions determines the size of the economic entity’s environmental costs. The trading of carbon emission rights gives them a commodity attribute [
29]. Companies with excess carbon emissions need to acquire carbon credits through market transactions, while companies with excess carbon credits can sell their carbon credits.
For companies participating in the carbon pilot, the government will issue carbon emission allowances. If the actual carbon emission of the enterprise exceeds the carbon emission quota, the enterprise will need to pay a fine or go to the carbon market to buy the quota, which will increase the environmental cost [
30] and compress the profit space of the enterprise, and the development of high pollution and high emission marine industries will be restricted; if the actual carbon emission of the enterprise does not exceed the carbon emission quota, these firms can sell its excess carbon credits in the carbon market to gain additional green revenue [
31], thus getting ahead of other firms, having the financial support to pursue low-carbon green innovation and promoting the structural upgrading of the marine industry. The role of carbon trading policies in promoting green innovation has also been empirically tested [
32,
33].
The Porter hypothesis suggests that through reasonable environmental regulation, firms can be motivated to actively internalize external environmental costs and encouraged to carry out technological innovation to achieve higher production efficiency and output, thus partially or completely offsetting environmental costs and generating innovation compensation effects [
34]. The environmental regulations brought about by carbon trading policies make enterprises increase their environmental costs. Of those marine enterprises that are constrained by this, those that are able to innovate will actively engage in low-carbon technology innovation to gradually offset the environmental costs while promoting their own green transformation and changing their production methods; those that are not able to innovate can purchase allowances in the carbon market to promote the development of other low-carbon-emitting marine industries. However, the constant purchase of carbon allowances can make it too expensive for companies to survive, reducing their market competitiveness, and high emitters may even abandon production and withdraw from the market.
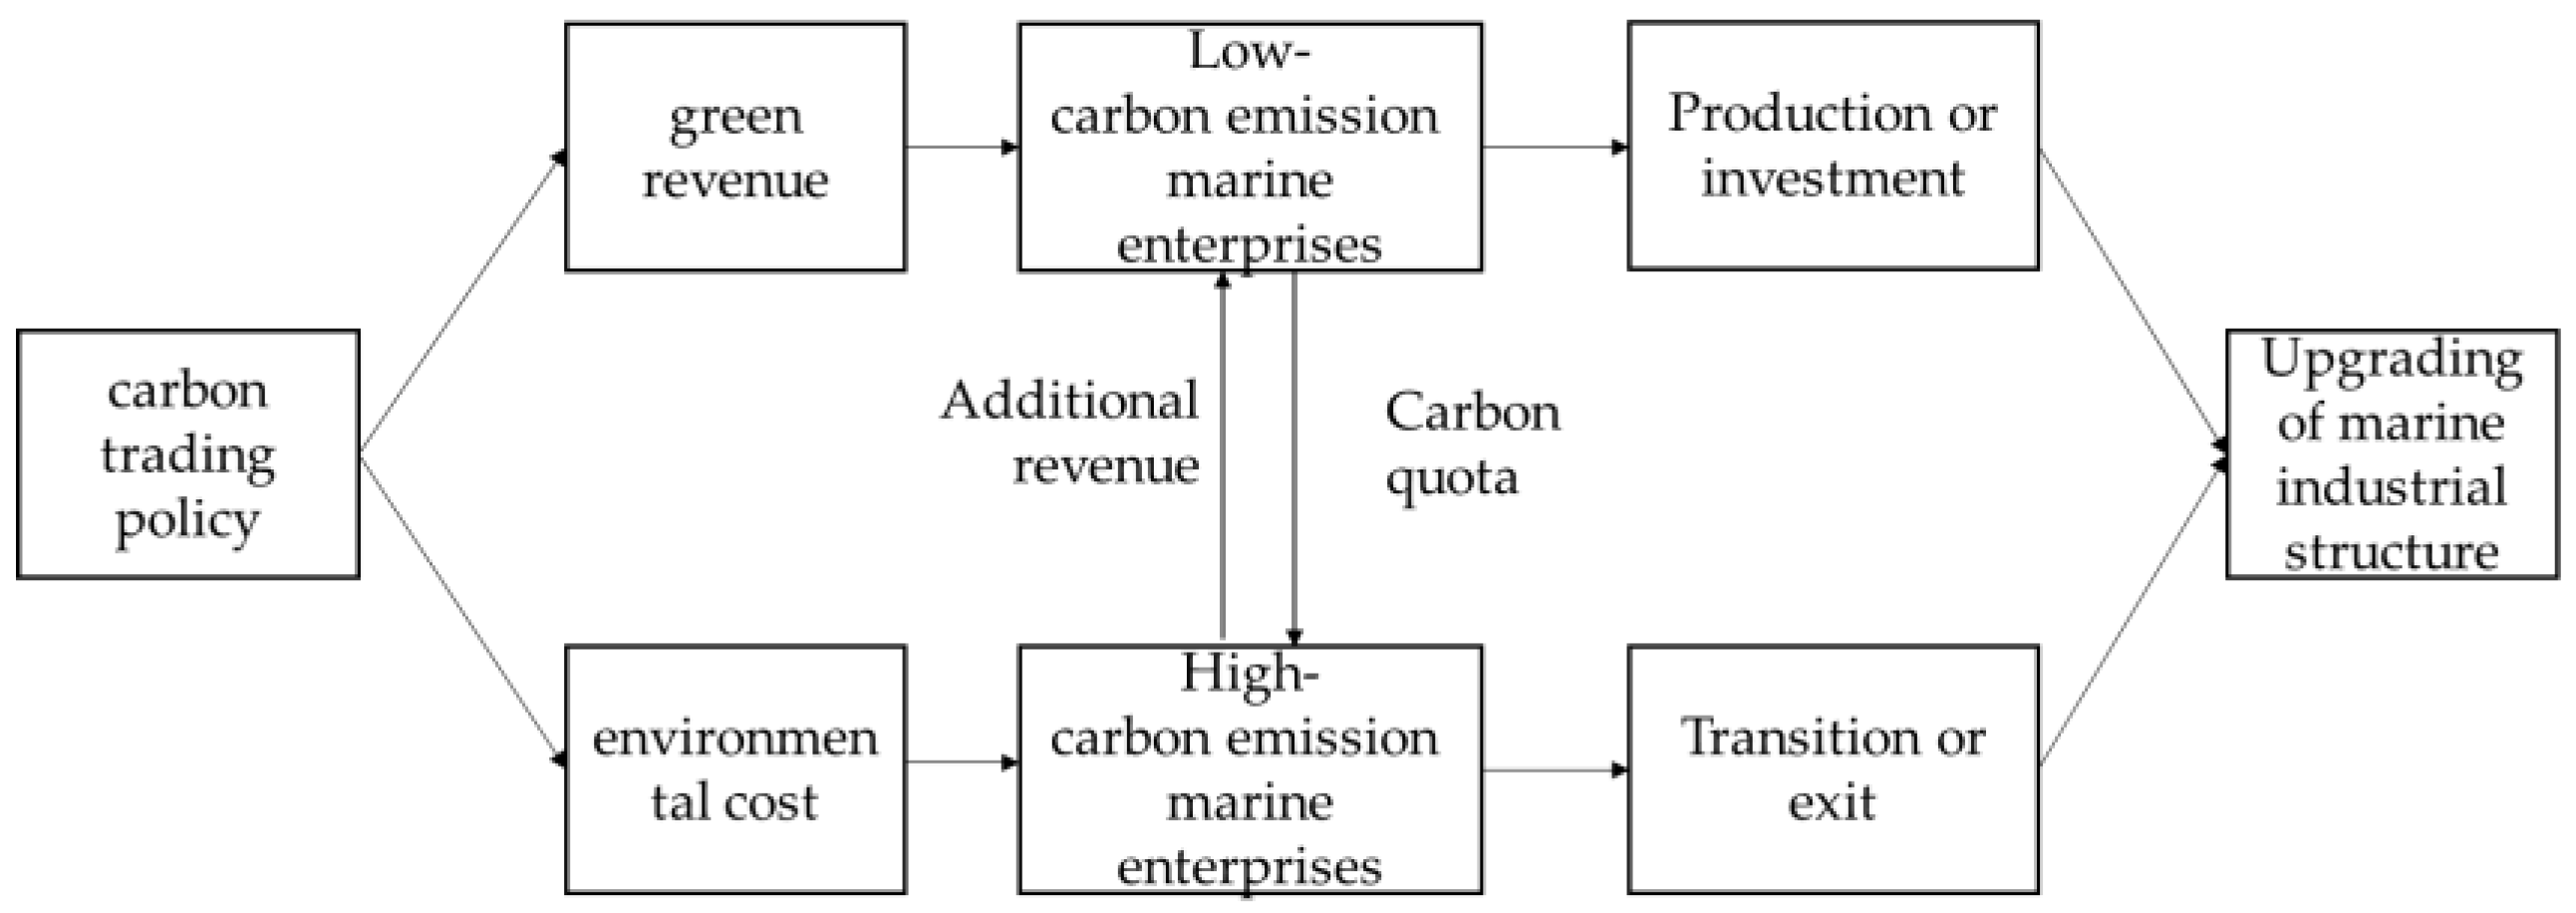
In summary, the carbon trading policy guides and restricts the marine industry through market-based means. High-carbon emitting marine enterprises will be burdened with huge environmental costs and face the pressure of transformation. Marine enterprises with low carbon emissions can reap “real gold and silver”, obtaining additional green benefits through carbon emissions trading, and directly using this additional income for production or investment, technological innovation, or scale expansion, resulting in the restructuring and upgrading of the marine industry. A theoretical framework is drawn to provide a detailed overview of the main research ideas, as shown in
Figure 1.
Based on the above analysis, this paper proposes Hypothesis 1:
H1. Carbon emission trading policy can promote the upgrading of marine industry structure.
Can there be “macro heterogeneity” in the effect of the policy between regions? In China, a large number of scholars have concluded that there is spatial heterogeneity in economic variables. Tong et al. pointed out the spatial heterogeneity of the policy effect, and found that the poverty alleviation policy of establishing national poverty counties had a significant effect on county economic growth and there was spatial heterogeneity in its impact, decreasing from northwest to southeast of China, with an inhibitory effect in some central and southeastern regions [
35]. Sun Yanan et al. studied the relationship between regional economic differences and spatial correlation in China and found that the spatial correlation of economic development had a significant impact on interregional economic differences [
36]. Du Gang et al. found that emissions trading policies had a significant promotion effect on green innovation in pilot regions and a significant inhibitory effect on surrounding regions, and verified the existence of spatial spillover effects [
37]. Using a dynamic spatial panel model, Shao Xiaoyu et al. demonstrated the significant spatial and temporal heterogeneity of the effects of environmental regulation and market demand on green innovation, and pointed out that environmental regulation had a positive spillover effect on local green innovation [
38].
China’s regions are widely and closely linked economically, and spatially linked regions often show strong linkages in various aspects of macroeconomic performance. At the same time, environmental governance policies are often learned and imitated by other connected regions, which further enhances the spatial linkages of economic variables across spatially connected regions [
39]. When carbon trading policy has a positive impact on the structural upgrading of marine industries in the pilot provinces, there will be spatial spillovers of labor and capital as well as knowledge [
40], and there will also be a siphoning effect of the policy [
41]. Thus, carbon trading policy has different impacts on neighboring provinces and provinces further away from the pilot provinces, i.e., there is also spatial heterogeneity in the impact of carbon trading policies on provincial areas.
The spatial spillover effect is affected when the distance changes [
42], and the effect of carbon trading policy has the greatest impact on the policy pilot sites. The spillover effect of the policy effect will be greater than the siphon effect when the distance to the pilot area is closer [
43]; therefore, the carbon trading policy will have a positive impact on the upgrading of the marine industry structure in the area near the pilot site. When the distance gradually increases, the impact of the policy effect will show a gradual decreasing trend with the increasing distance from the pilot site.
Based on the above analysis, this paper proposes Hypothesis 2:
H2. There is spatial heterogeneity in the impact of carbon trading policy on the upgrading of marine industry structure.
4. Method
4.1. Model Setting
In policy assessment effect studies, most of the existing literature uses the difference in differences method. This approach assesses the effects of policy implementation by comparing the difference before and after policy implementation between the experimental group in which the policy pilot occurred and the control group in which no pilot occurred. Theoretically, the difference in differences method can avoid endogeneity problems and thus obtain robust empirical results. The difference in differences method is now widely used in the fields of policy evaluation such as purchase restriction policies, free trade zones, smart city construction and emissions trading systems [
44,
45,
46,
47]. Therefore, this paper adopts the difference in differences method to construct a model of the influence of carbon trading policy on the structural upgrading of marine industry:
where the subscript
i denotes provinces (or municipalities) and
t denotes time. The variable
MTIit is the level of structural upgrading of marine industry in coastal provinces,
piloti reflects the dummy variable of carbon trading policy pilot, pilot provinces (or municipalities) take 1, non-pilot provinces (or municipalities) take 0.
postt denotes the dummy variable of carbon trading policy pilot implementation time (this paper takes 2013 as the node of policy pilot implementation);
postt = 1 denotes the post-policy implementation (
t ≥ 2013),
postt = 0 denotes the pre-policy implementation (
t < 2013).
Xit denotes the control variable for the structural upgrading of the marine industry.
μi,
γt denote province-fixed effects, time-fixed effects,
μi ×
γt denote time trend terms for provinces, and
εit denotes the random error term affected by time changes. Therefore, the impact of carbon trading policy on the structural upgrading of marine industry studied in this paper is the coefficient of the double cross product term.
The model of Equation (1) only tests the average effect of carbon trading policy on the structural upgrading of marine industry; however, considering that there may be a time lag in the impact of policy implementation, this paper improves Equation (1) and establishes the following model to further test the dynamic effect of each year after policy implementation.
To simplify the expression, we denote the double cross product term of piloti ∗ postt in Equation (1) with did. In the formula, represents the policy implementation to the Nth year. For example, 2013 is the pilot year of the policy, and 2014 is the first year after the implementation of the policy, n = 1, = 1, and the double cross product term for other years is 0.
4.2. Sample Selection
To study the impact of carbon trading policy on the upgrading of marine industry structure, this paper uses 11 coastal provinces (or municipalities) in China from 2010 to 2018 as samples for empirical evidence. The 11 coastal provinces (or municipalities) are Tianjin, Guangdong, Shanghai, Fujian, Hebei, Liaoning, Jiangsu, Zhejiang, Shandong, Guangxi, and Hainan. Among them, there are four pilot sites, namely Tianjin, Guangdong, Shanghai, and Fujian. The data are obtained from the China Statistical Yearbook and China Marine Statistical Yearbook and EPS database and incoPat patent database.
4.3. Selection of Indicators
4.3.1. Dependent Variable
Regarding the level of upgrading of the marine industry structure, Ren Haijun et al. [
48] used the ratio of the value added of the tertiary industry to the value added of the secondary industry as an indicator to measure the degree of optimization of the industrial structure. Chen Shengming et al. [
49] and Tan Yanzhi et al. [
50] used the ratio of the sum of the gross value added of marine secondary and tertiary industries to the gross value added of marine industries as an indicator to measure the upgrading of the marine industrial structure. In this paper, drawing on Jiang Han et al.’s work [
17], the ratio of the gross value of marine tertiary industries to the gross marine product is used to measure the level of upgrading of the marine industrial structure.
4.3.2. Control Variables
The change in marine industry structure will also be influenced by other factors. Therefore, this paper selects the level of marine economic development, capital investment, the level of marine science and technology, and the level of low carbon technology innovation as control variables. Among them, this paper adopts gross marine product to measure the level of marine economic development [
51]; adopts the ratio of social fixed asset investment to regional GDP to represent capital investment [
52]; adopts the number of employees in marine research institutions to measure the level of marine science and technology [
51]; this paper draws on Wang Weidong’s work [
53] (2020) and uses the number of patents under category Y02 of the cooperative patent classification jointly issued by the European Patent Office and the U.S. Patent Office to measure the level of low carbon technology innovation. The specific indicators mentioned above are shown in
Table 1.
5. Results
5.1. Descriptive Statistics
The dependent variable (MTI) is the level of structural upgrading of the marine industry, which is the ratio of the gross marine tertiary industry to the gross marine product. As can be seen from the
Table 2, MTI has a mean value of 0.513, a minimum value of 0.313, a maximum value of 0.673 and a standard deviation of 0.0821 for the 11 coastal provinces in nine years, indicating that the proportion of marine tertiary industry in each province is about 51%, up to 67.3%, and the difference between most of the values and their means is small. Among the control variables, the mean value of low carbon technology innovation level is 8.255 and the standard deviation is 1.276; the mean value of marine economic development level is 8.29 and the standard deviation is 0.884; the mean value of capital investment level is 0.643 and the standard deviation is 0.221; the mean value of marine science and technology level is 7.358 and the standard deviation is 0.890, which indicates that most of the control variables have a certain gap between provinces.
5.2. Baseline Regression Results
Table 3 reveals the regression results of the difference in differences model. The results of the average effect in column of
Table 3 (1) indicate that the regression coefficient of did is significantly positive at the 10% level with a coefficient of 0.0203 after fixing the province effect and the time effect, indicating that the carbon trading policy can promote the structural upgrading of the marine industry, which is consistent with Hypothesis 1 of this paper. For the control variables, the coefficient of low carbon technology innovation is 0.0534, which is significant at the 1% level; the coefficient of marine economic development level is −0.309, which is significant at the 1% level; the coefficient of capital input level is 0.193 and is significant at the 1% level; the coefficient of marine science and technology level is 0.0266, which is significant at the 5% level, indicating that control variables such as low-carbon technological innovation, marine economic development level, capital investment level, and marine science and technology level can have a significant impact on the upgrading of the marine industrial structure.
From the test results of dynamic effects in column 3 (2) of
Table 3, we can see that after fixing the province effect and time effect, the regression coefficient of did
1 is 0.0175, which is not significant; the regression coefficient of did
2 is 0.0242, which is not significant; the regression coefficient of did
3 is 0.0330, and is significant at the 10% level; the regression coefficient of did
4 is 0.0399, and is significant at the 10% The regression coefficient of did
5 is 0.0391 and is significant at the 5% level. The results of the dynamic effects test are significantly positive from the third year after the pilot. The coefficient of the effect of the policy is the highest in the fourth year, after which it starts to decline slightly, but still has a significant positive effect. This indicates that the carbon trading policy has a time lag, and the effect is not significant in the first and second years after the pilot, until the third year when it starts to have a significant positive effect. In terms of regression coefficients, the influence of carbon trading policy starts to grow gradually after the pilot, and starts to play a significant role in the third year, and reaches the highest point in the fourth year, and then decreases slightly, but still maintains a positive and significant contribution.
5.3. Robustness Tests
5.3.1. Parallel Trend Hypothesis Testing
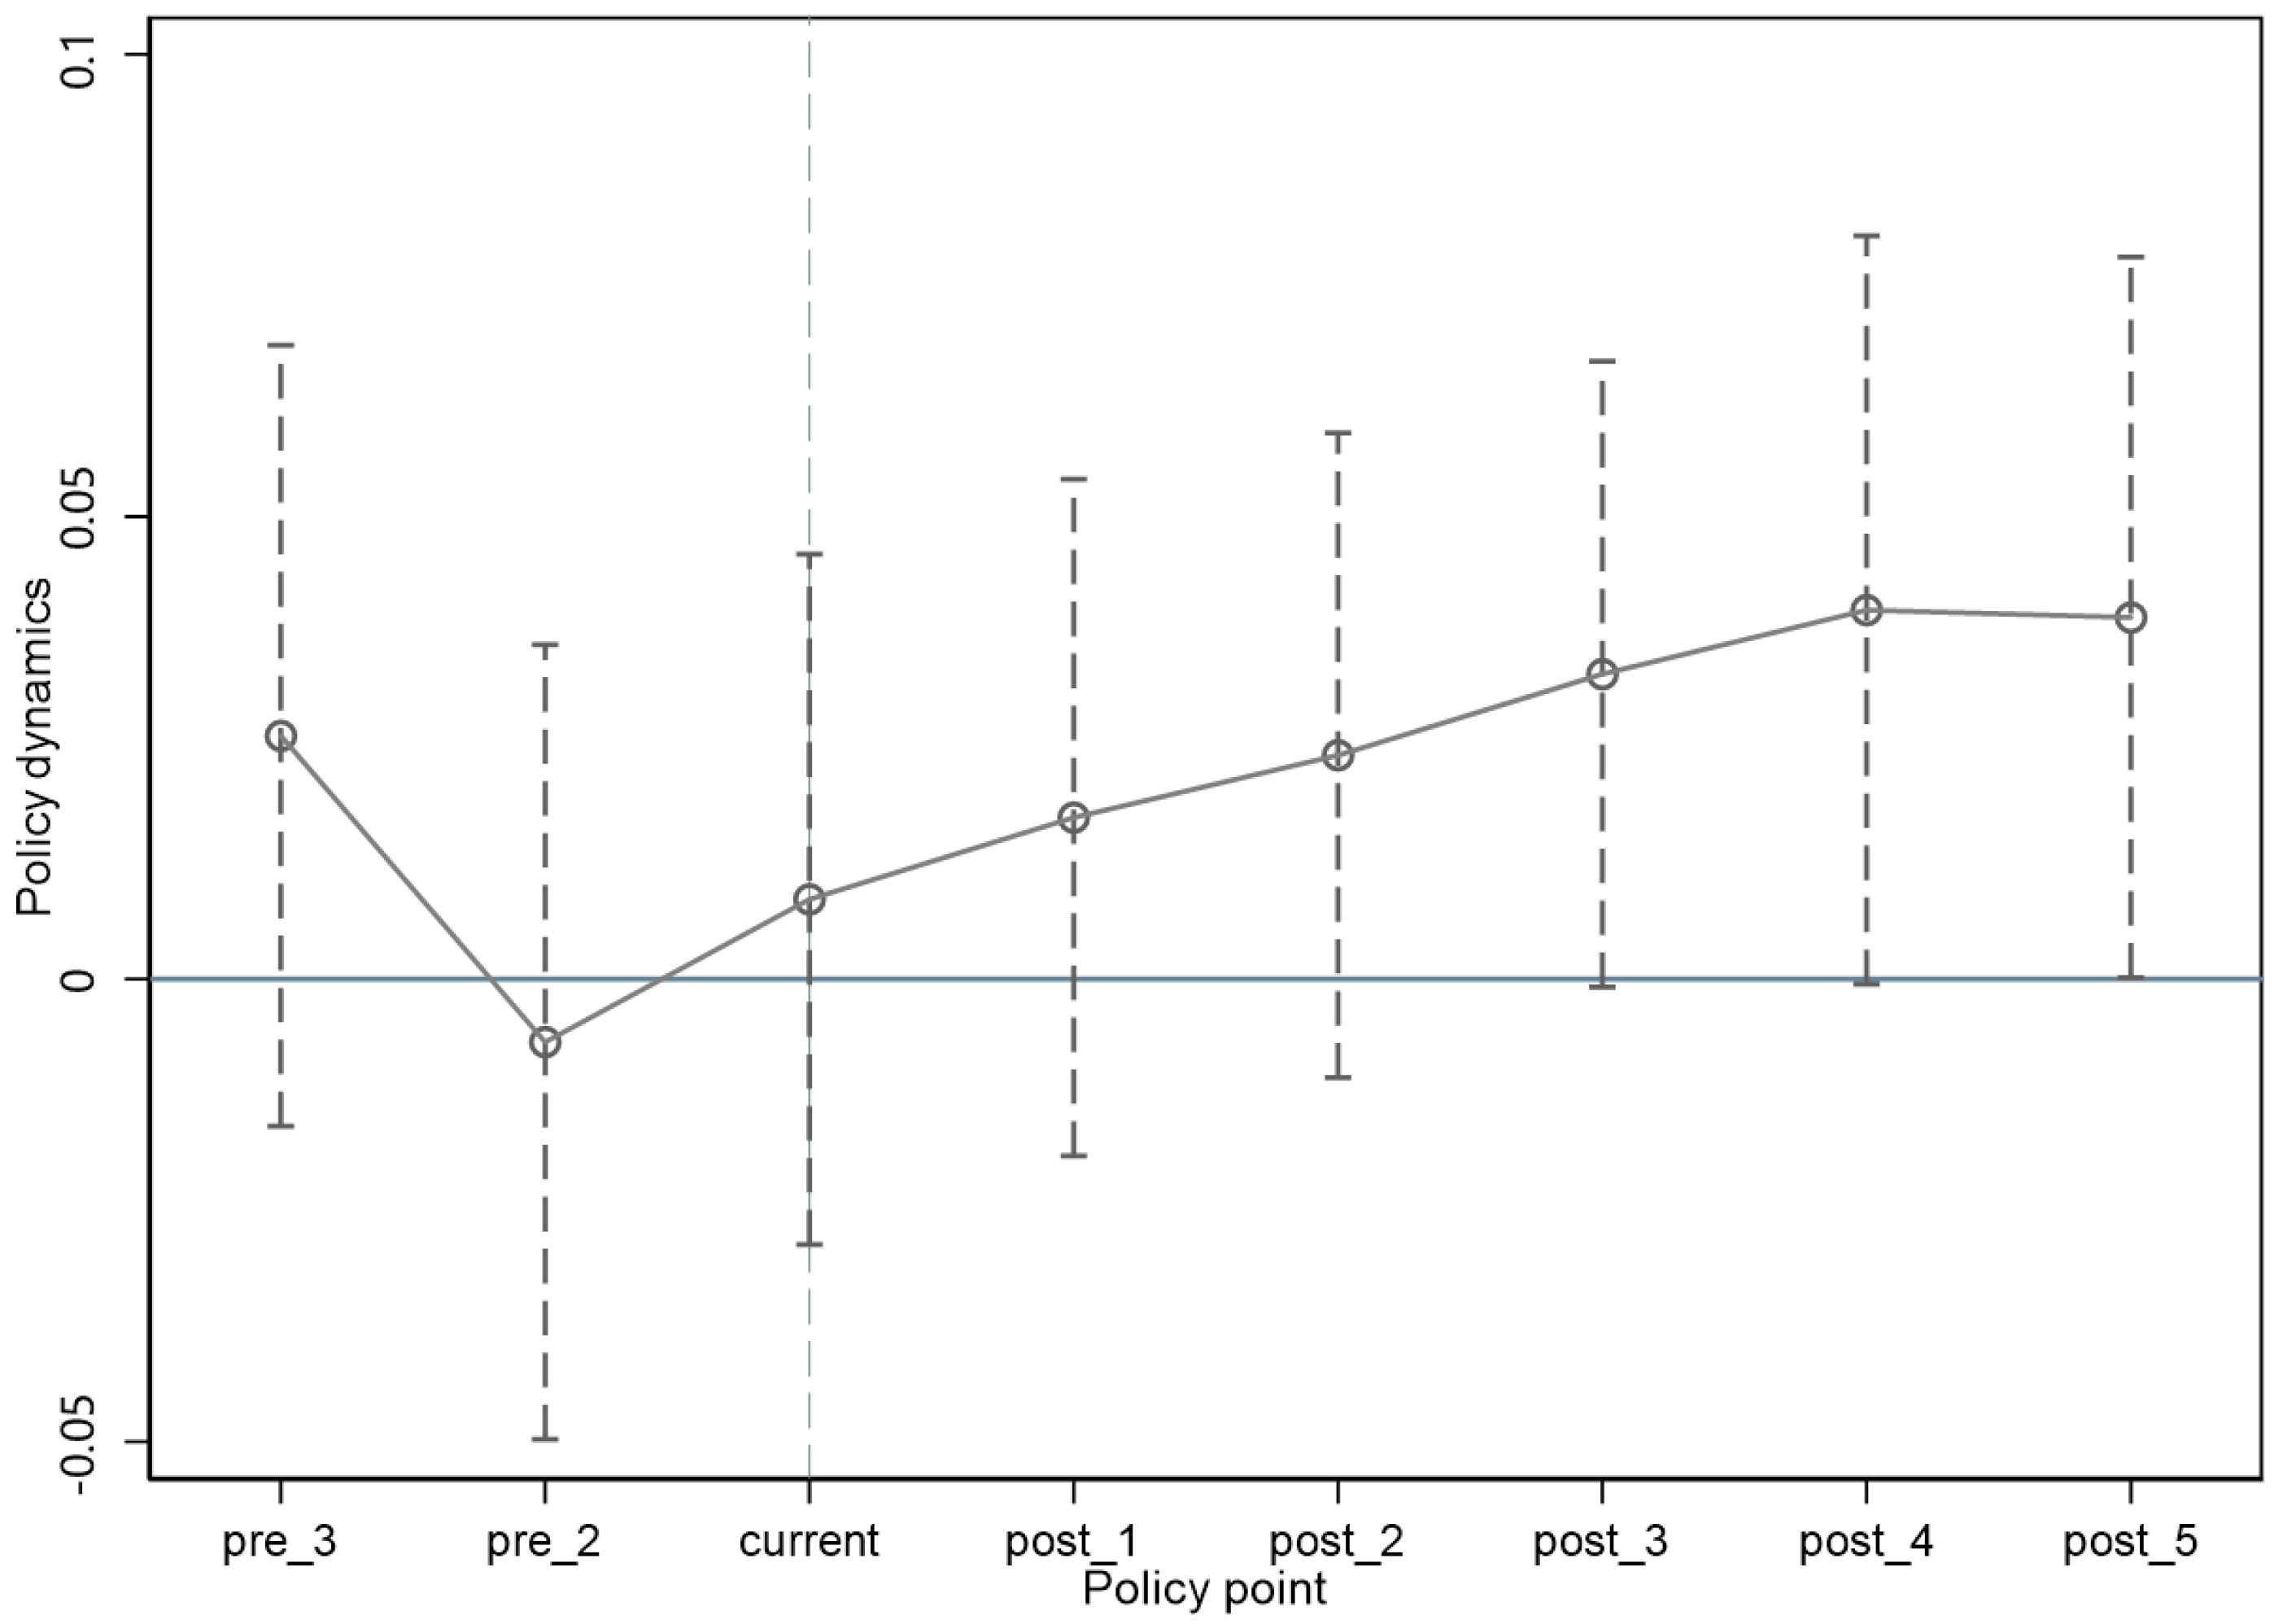
Table 4 shows the results of the parallel trend hypothesis test, where pre_3 indicates the third year before the carbon emissions trading pilot, pre_2 indicates the second year before the carbon emissions trading pilot, and pre_1 indicates the first year before the carbon emissions trading pilot. To avoid multiple co-linearities, pre_1 is used as the baseline group and pre_1 is dropped. As shown in
Table 4 and
Figure 2 below, before the carbon emission trading pilot, none of the regression coefficients are significant, indicating that there is no significant difference of the marine industry structure between the experimental groups and control groups before the carbon emission trading pilot; after the carbon emission trading pilot, the regression coefficients gradually start to be significant and the marine There is a significant difference of the industrial structure between the experimental groups and control groups. The results in
Table 4 and
Figure 2 below indicate that the parallel trend test hypothesis is passed and the previous double-difference regression results are plausible.
5.3.2. Replacing Measure of Explanatory Variables
In this paper, the value M, a weighted average of the output value of each marine industry, is used to measure the structure of the marine industry instead of the measure in baseline regression [
54]. Its calculation formula is as follows:
where
yi indicates the output value share of each marine industry. When M is equal to 1 or close to 1, the lower the marine industry structure level is; when M is close to 3 or equal to 3, the higher the marine industry structure level is.
Table 5 reports the results of the robustness tests. After fixing the time and province effects, the regression coefficient of did is significantly positive at the 10% level with a coefficient of 0.0220, indicating that the carbon trading policy can indeed promote the upgrading of the marine industry structure, again verifying Hypothesis 1 of this paper. In addition, the regression coefficients of the control variables of low-carbon technological innovation, marine economic development level, capital investment level, and marine science and technology level are all significant, indicating that the low-carbon technology innovation, the level of marine economic development, the level of capital investment, the level of marine science and technology and other control variables can play a significant impact on the upgrading of the structure of marine industry.
5.3.3. Placebo Test
In order to exclude other random factors from confounding the results, a placebo test was conducted by fictitious treatment groups. Since there were four actual pilot coastal provinces, this paper is conducted by randomly selecting four provinces as the fictitious policy pilot provinces, i.e., the treatment group, repeating the fictitious process 500 times and finally observing whether the coefficients on the ‘pseudo-policy dummy variables’ were significant.
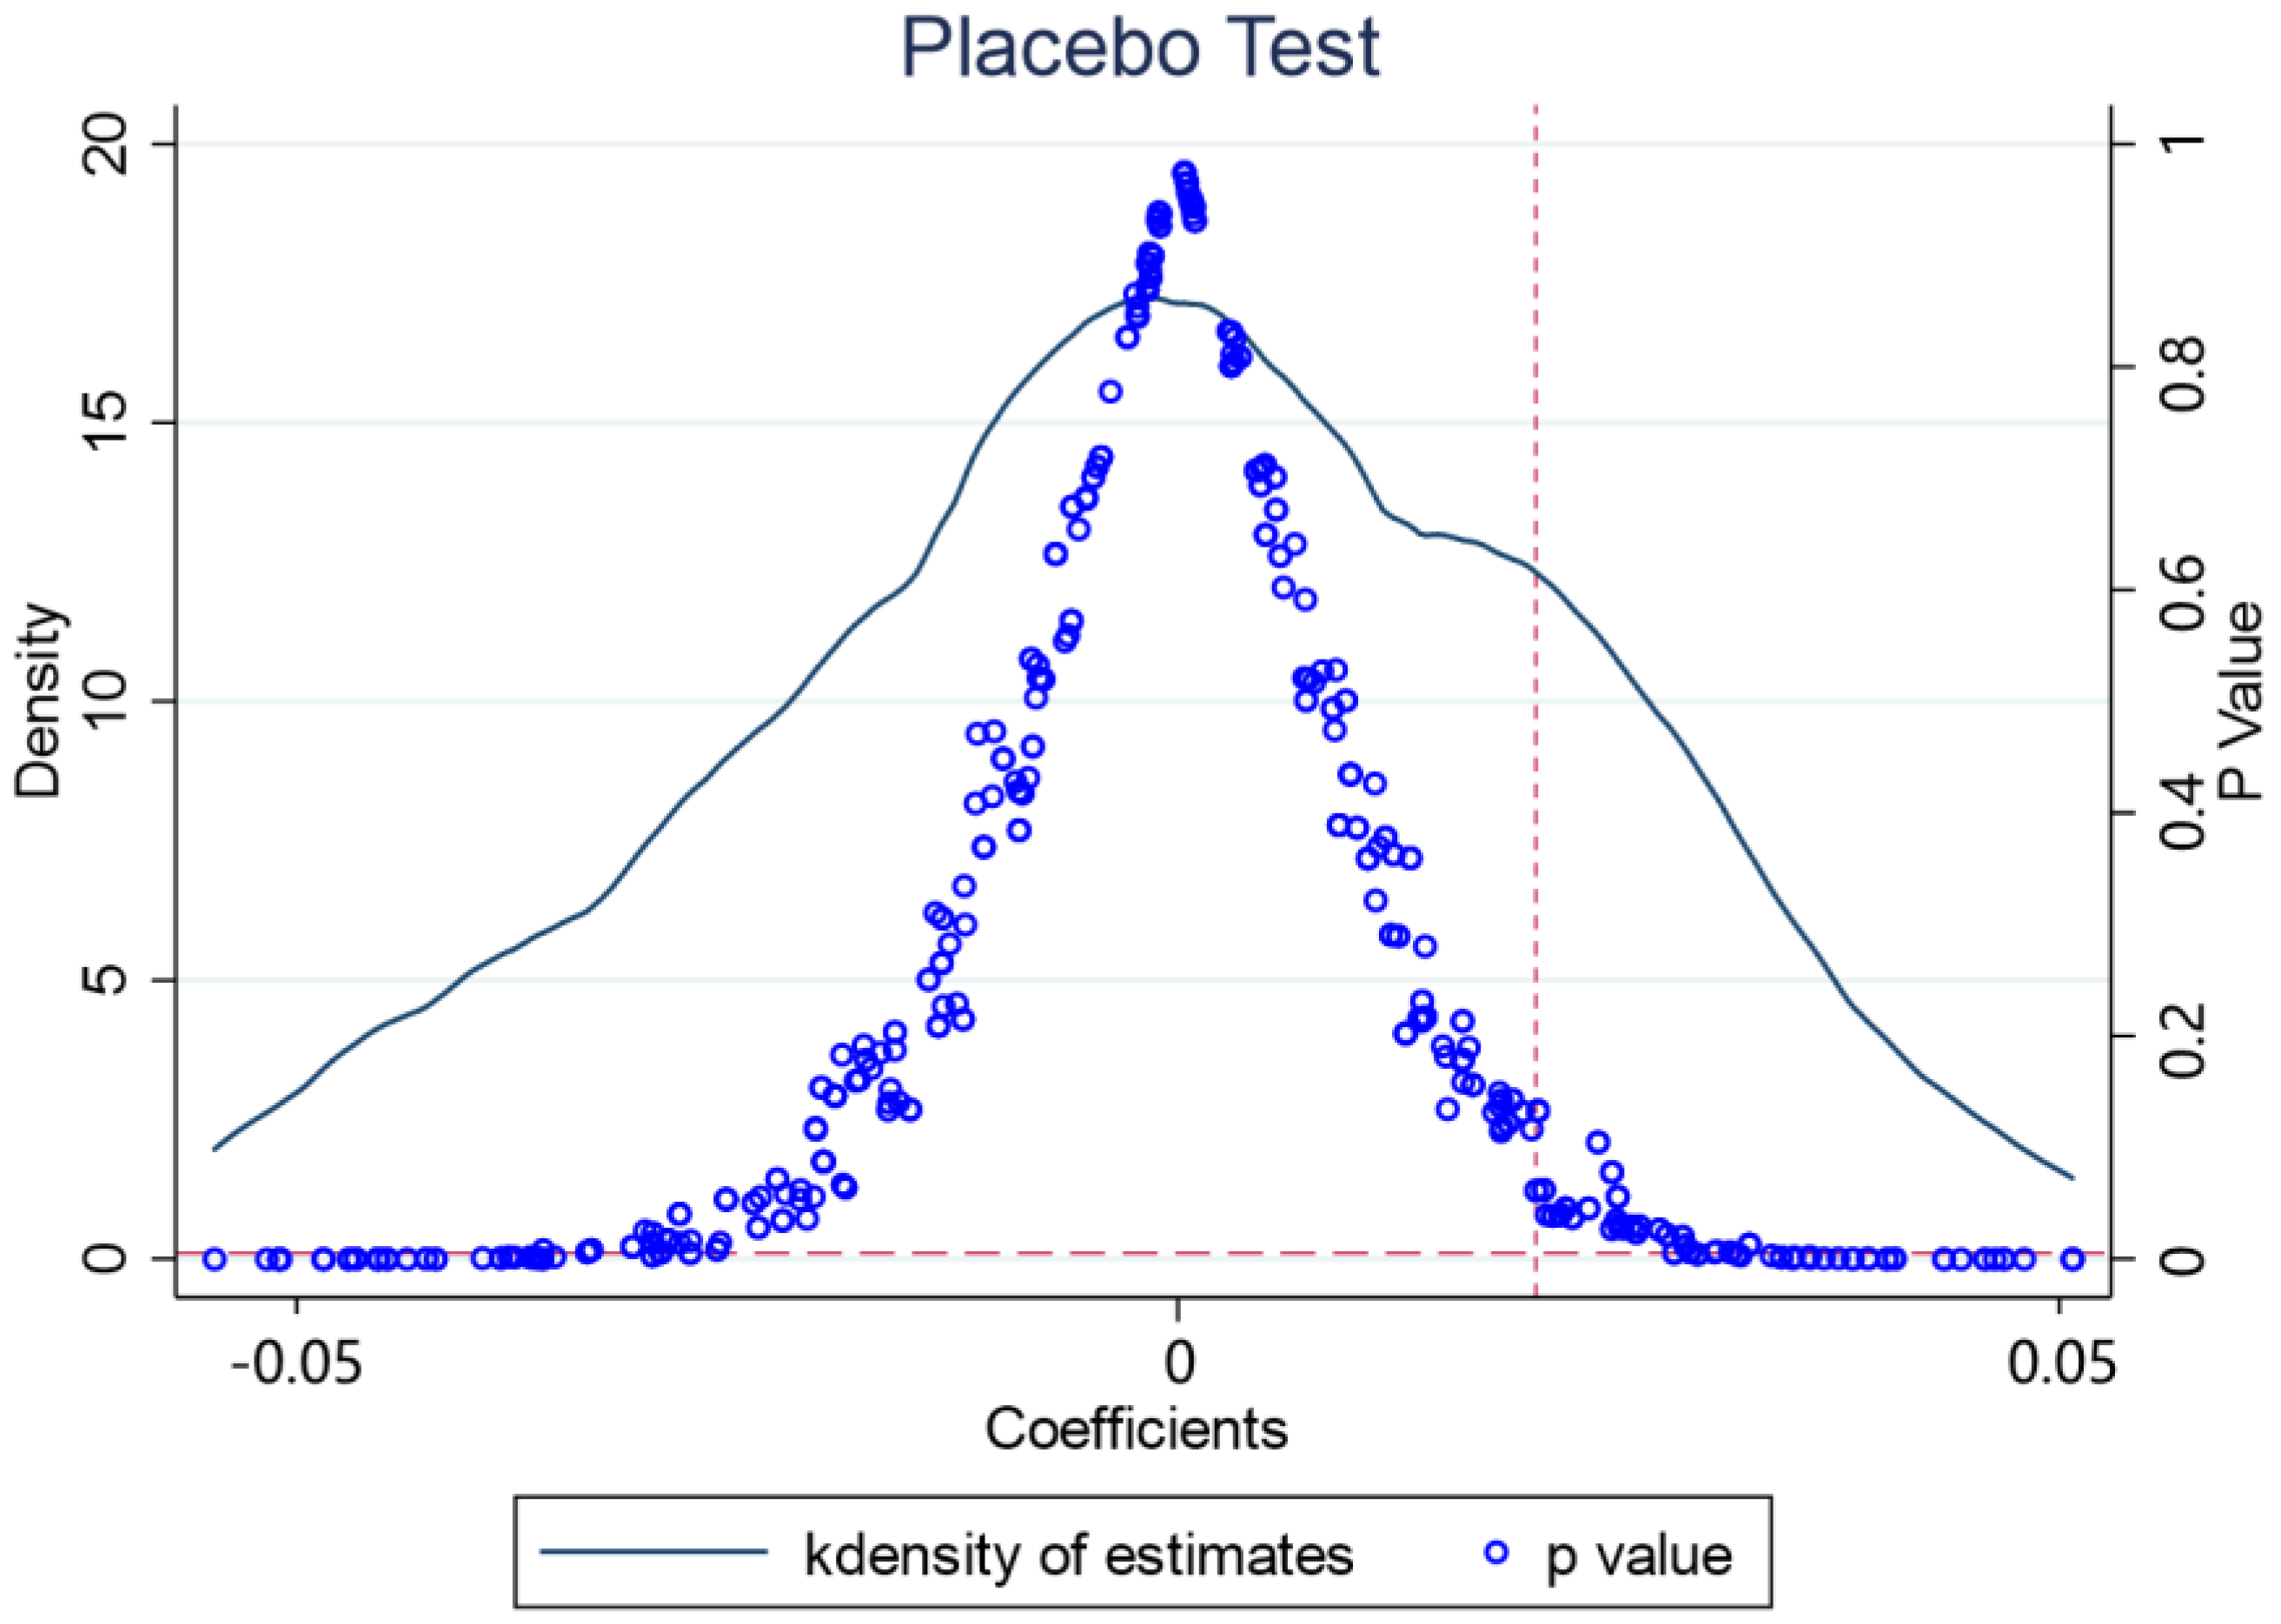
The results of the placebo test are reported in
Figure 3 below, showing the distribution of regression coefficients and
p-values for the regression results after setting 500 dummy treatment groups, with the vertical dashed line in the figure being the true estimate of the difference in differences model of 0.0203. As can be seen from the results in
Figure 3, the estimated coefficients are mostly concentrated around the zero point; most of the estimates have
p-values greater than 0.1, i.e., they are not significant at the 10% level. Not many points fall on the vertical dashed line in the figure, i.e., there are few cases where the true estimate of 0.0203 is obtained for the difference in differences model. This suggests that the effect of carbon trading policy on the upgrading of the marine industry is not caused by other random factors and that the previous empirical results of this paper are unlikely to have been obtained by chance, again demonstrating the robustness of the results of this paper.
5.4. Spatial Heterogeneity Analysis
This paper concludes that the carbon trading policy can promote the structure of marine industry in the pilot provinces. Furthermore, this paper continues to analyze whether there is spatial heterogeneity in the effect of the policy, i.e., what effect the carbon trading policy has on its neighboring provinces and provinces farther apart, respectively, while it can promote the effect of the policy on that pilot province.
Drawing on Wang Xiongyuan and Bu Lufan’s work [
55], this paper develops the following model to investigate the spatial heterogeneity of the promotion effect of carbon trading policy on the structural upgrading of marine industries.
Equation (4) adds a new set of control variables on the basis of Equation (1). The parameter s represents the geographic linear distance between provinces (in kilometers, s ≥ 160). Among the coastal provinces, the geographical distance between the two nearest provinces is around 160 km; thus, this paper uses 160 km as the interval for spatial heterogeneity testing. If there are coastal provinces that have started carbon trading pilot in the spatial range of distance from province i (s − 160, s] in year t, then = 1, otherwise = 0. Therefore, the coefficient of the variable measures the impact of the carbon trading policy on the structure of the marine industry in the provinces surrounding the pilot provinces.
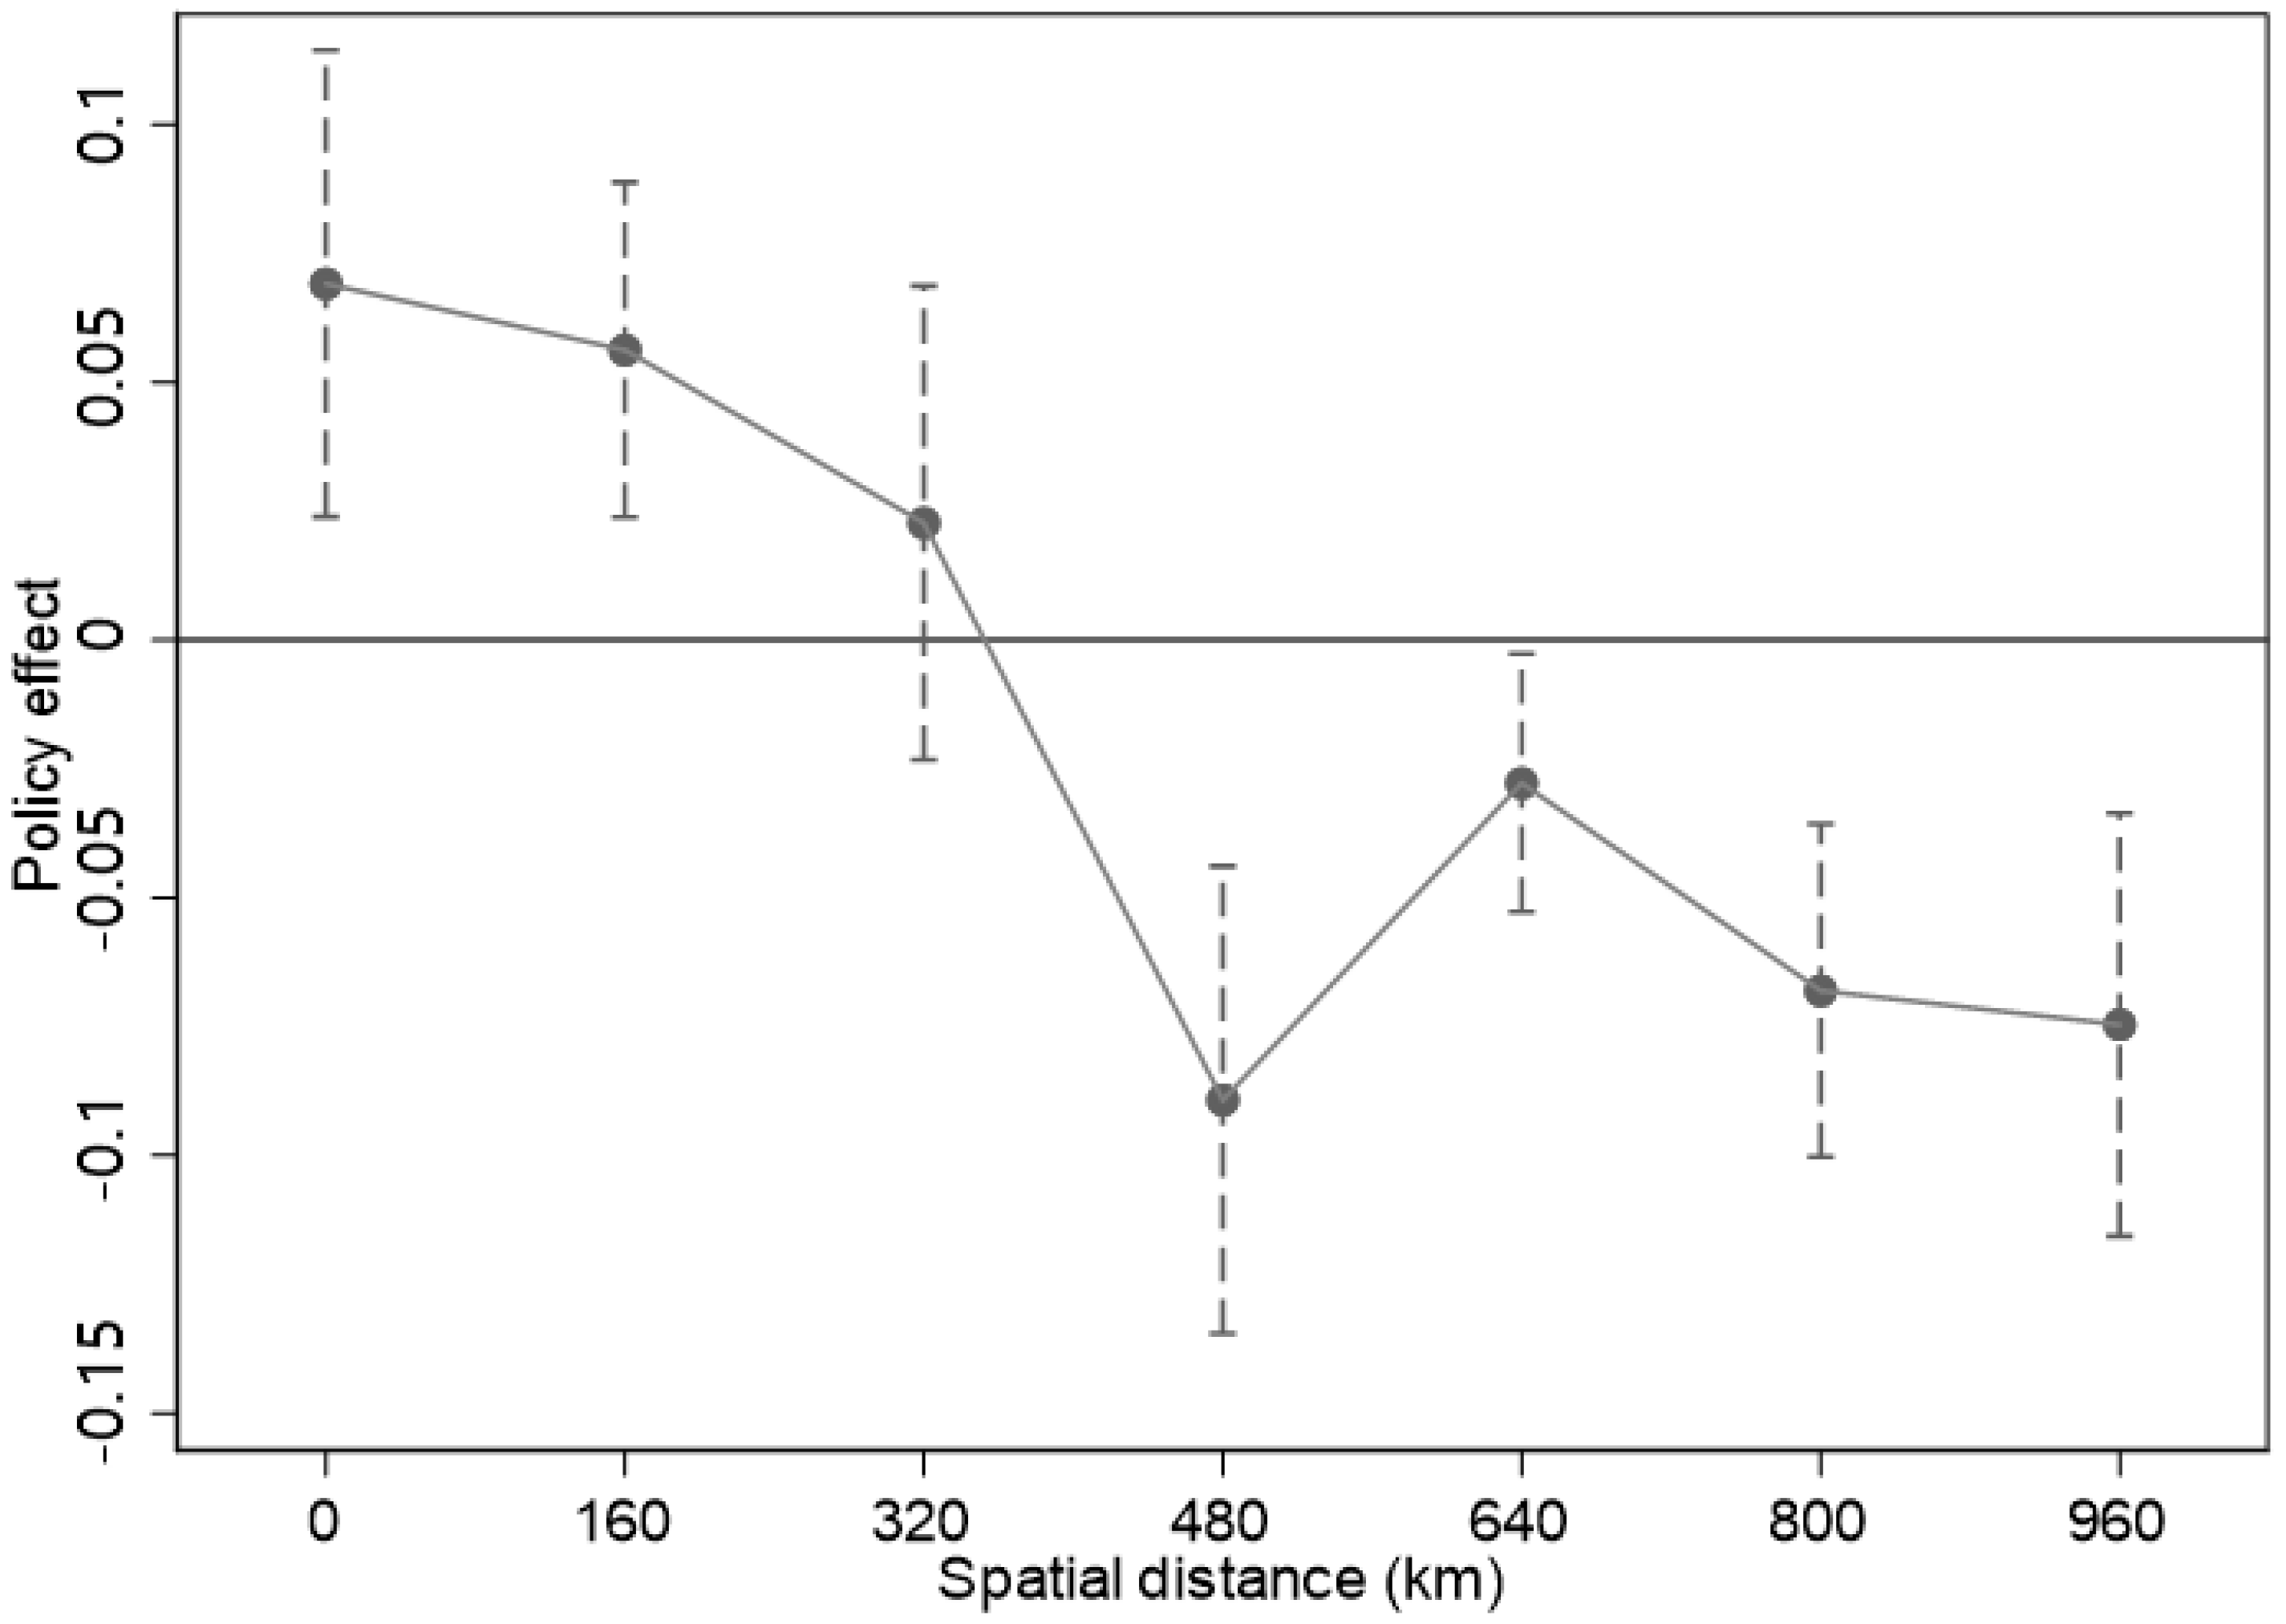
Table 6 and
Figure 4 report the results of spatial heterogeneity, and we can see from the images that the impact of carbon trading policies tends to become smaller and then negatively larger as the distance increases.
Within 160 km around the pilot provinces, the carbon trading policy has the same significant positive promotion effect on the structure of the marine industry in the surrounding provinces, but the impact coefficient of the policy gradually decreases, that is, spatial spillover occurs. Briefly, when the carbon trading policy has an impact on the marine industrial structure of the pilot province, the neighboring provinces of that pilot will be driven to upgrade the marine industrial structure due to the significant presence of labor and capital flows and knowledge spillover.
When the distance increases to the range of 160–320 km around the pilot province, the carbon trading policy does not significantly contribute to the marine industrial structure of the provinces within that range. We can understand that as the distance increases, the impact gradually diminishes and is no longer significant.
As the distance increases to 320–960 km around the pilot provinces, the impact of carbon trading policy on the marine industrial structure of the provinces in that range becomes negatively significant, verifying Hypothesis 2, that the promotion effect of carbon trading policy on the upgrading of marine industrial structure is spatially heterogeneous. When the distance between the pilot provinces and the pilot provinces exceeds 320 km, the pilot provinces upgrade the marine industrial structure under the influence of the carbon trading policy, master more technologies for green and low-carbon development, and attract more high-level talents; then, the provinces farther away from the pilot provinces will lose high-level talents and lose the first opportunity to develop green and low-carbon technologies, which will have a negative impact on the upgrading of the marine industrial structure.
6. Conclusions and Policy Implications
6.1. Conclusions
In order to study the promotion effect of carbon trading policy on the upgrading of marine industry structure, this paper collects relevant data from 2010 to 2018 in coastal areas and conducts an empirical study using difference in differences model. The results passed the parallel trend test, the robustness test of replacing the indicators of the explanatory variables, and the placebo test, and the empirical results have credibility. This paper concludes that a carbon trading policy can promote the upgrading of the marine industry structure. In addition, this paper also conducts a spatial heterogeneity test and found that a carbon trading policy has the same significant positive promotion effect on the marine industry structure in the surrounding provinces within 160 km of the pilot provinces. However, the influence of carbon trading policy on the structure of marine industry tends to become smaller and then negatively larger as the distance from the pilot provinces increases. Within the range of 160–320 km around the pilot provinces, the carbon trading policy cannot significantly promote the marine industrial structure of the provinces within this range. Within the range of 320–960 km around the pilot provinces, the impact of carbon trading policy on the marine industrial structure of the provinces within this range turns negative.
This paper enriches the research content of carbon trading policy in the field of policy effects, clarifies the influence between carbon trading policy and marine industry structure, verifies the existence of spatial heterogeneity of policy effects, and provides new ideas for transforming the development mode of marine economy in coastal areas, improving the regional layout of coastal economy, and promoting the sustainable development of marine economy.
6.2. Policy Implications
Based on the findings obtained from the empirical evidence, the policy implications of this paper are as follows:
(1) Under the current strategy of strengthening the country by the sea, it is impossible to bypass the marine economy in the development of the national economy. We have seen from the practice of the pilot regions of the carbon trading policy that it has had a positive impact on the structural upgrading of the marine industry. The success of the carbon trading policy in the pilot regions can be replicated by extending the carbon trading policy nationwide. Therefore, the implementation of the carbon trading policy on a national scale is of great significance and worthy of active practice. The implementation of the carbon trading policy is an important reform in the process of China’s economic development, and is a necessary path under the dual carbon target.
(2) During the promotion and implementation of the carbon trading policy, economic entities also need to make timely changes in accordance with the actual situation and their own development status, carry out high-quality innovation to maintain market competitiveness [
56], and adapt to the current trend of green development. For the state and the market, we need to establish a system and mechanism to promote the upgrading of industrial structures in all sectors based on the synergistic effects of green technological innovation and energy substitution under the carbon trading policy.
(3) The spatial heterogeneity of the impact of the carbon trading policy demonstrates that the carbon trading policy also has a significant promotion effect on the provinces within 160 km of the pilot provinces, though it will be weaker than that in the pilot provinces. This will drive the synergistic development of the marine industry in the region. Surrounding provinces should actively adapt to the pace of industrial structure upgrading in the pilot provinces and seize the opportunities of capital, human and knowledge flows. This paper also finds that the impact of carbon trading policy on the upgrading of marine industry structure becomes negatively significant in the 320–960 km range around the pilot provinces. Therefore, those provinces that are far away from the pilot provinces should take proactive actions to break down the geographical barriers and reduce the differences in regional development. In addition, considering the situation from the perspective of spatial heterogeneity, it is important to implement carbon trading policies on a national scale to achieve synergy in marine economic development and avoid excessive differences among regions.
6.3. Research Shortcomings and Future Directions
Although this paper verifies the actual impact of carbon trading policies on the structural upgrading of the marine industry and provides new insights into carbon neutrality, there are still some limitations.
Firstly, this paper only takes coastal provinces as the research sample, which is a relatively macro perspective and the scale of observation is not large enough. The next step will be to examine the policy effects of carbon trading policies from the micro perspective of coastal cities. Second, further research on other mediating and moderating factors may be needed to further enrich the study of the influence process of carbon trading policy on the structural upgrading of the marine industry.


