1. Introduction
Environmental issues such as global warming are some of the most important issues in the world today. In recent years, strategies to respond to threats such as climate change and energy shortage and to strengthen sustainable development have been increasingly widely discussed. In 2018, the United Nations Intergovernmental Panel on Climate Change (IPCC) issued the Special Report on Global Warming of 1.5 °C, which stated that “Human activities are estimated to have caused global warming of about 1.0 °C above pre-industrial levels, with a possible range of 0.8 °C to 1.2 °C. If the current rate of warming continues, global warming could reach 1.5 °C between 2030 and 2052 (high confidence)”. Global warming will lead to the melting of glaciers, an increase in the frequency of extreme weather, impact on ecosystems, etc., posing a serious threat to the survival of organisms. Therefore, it is imperative to protect the environment.
The proposals of “carbon peak” and “carbon neutrality” reflect the Chinese government’s increasing attention to environmental issues. However, economic development is inseparable from the improvement of productivity, and the process of production is inevitably inseparable from the use of energy and gas emissions. Therefore, improving energy efficiency is an important breakthrough required to effectively solve the contradiction between economic development and environmental protection, and it is also an important issue that needs to be explored and solved. Therefore, this paper discusses the influencing factors of energy efficiency.
There is a significant positive relationship between energy efficiency and industrial agglomeration (Wu et al., 2020 [
1]; Kenta and Managi, 2021 [
2]; Yang et al., 2020 [
3]). This is because industrial agglomeration will promote the flow of knowledge, talent and other factors, which are conducive to improving the technological innovation ability of a region. However, because of China’s special ideology, the government’s “visible hand” has more influence on markets than in most capitalist countries. For now, economic growth and the promotion tournament are still very common under the Chinese system. The promotion tournament is a model of governing government officials that combines the centralization of administrative power with strong incentives. The superior government has the centralization of administrative and personnel power and sets the criteria for the competition, and the winners of the competition are promoted. Therefore, related governments tend to take short-term economic behavior in formulating policies, only paying attention to short-term economic growth while ignoring the promotion of long-term energy efficiency. This will make the Schumpeter effect of industrial agglomeration gradually prominent, and the negative externality is more serious.
In summary, the panel data of 30 provinces, municipalities directly under the central government and autonomous regions (except Tibet) in mainland China from 2007 to 2019 were selected in this paper, and a fixed effect model, spatial econometric model and panel threshold model were used to analyze the internal influence mechanism of high-tech industry agglomeration and government intervention on regional energy efficiency. Thus, this paper provides an important contribution toward effectively solving the endogenous contradiction between environmental protection and economic development in China, and lays down a theoretical foundation.
2. Literature Review
2.1. A Literature Review of High-Tech Industrial Agglomeration and Regional Energy Efficiency
The growth of regional energy efficiency has been an important issue in research on economy in recent years, and high-tech industry agglomeration, being one of the key variables in regional energy efficiency, has been widely discussed. As has been shown in the literature in recent years, scholars have used a variety of models to try to conduct quantitative analyses on the relationship between the two. After sorting the results of the studies, scholars believe that although industrial agglomeration brings negative effects, such as increasing negative externalities, causing free-rider and race-to-the-bottom effects and manifesting the Schumpeterian effect (Liu et al., 2017 [
4]; Han et al., 2018 [
5]; Hong et al., 2020 [
6]; Aghion et al., 2005 [
7]), on the whole, industrial agglomeration can significantly promote the improvement of energy efficiency, and this conclusion has been confirmed in agriculture (Wu et al., 2020 [
1]), the production service industry (Yang et al., 2020 [
3]), the textile industry (Zhao and Lin, 2019 [
8]), the manufacturing industry (Yuan et al., 2020 [
9]), and in other industries.
On this basis, some scholars found that the direction of industrial agglomeration’s impact on energy efficiency was related to the industry. Although the impact was positive in the paper industry and pulp industry, it was negative in the cement industry (Tanaka and Managi, 2021 [
2]) and the financial industry (Li and Ma, 2021 [
10]). There are different conclusions among scholars, possibly due to the location of the industry and government policies. For example, Tanaka and Managi (2021) pointed out that cement factories prefer to be located near mines needed to make cement, so the cement industry is limited in selecting suitable locations for effective energy. Therefore, in the cement industry, industrial agglomeration can promote energy efficiency. The paper and pulp industries, on the other hand, can locate their plants near bays with easy access to many types of energy, so the agglomeration of industries in the region can promote energy efficiency.
Furthermore, some scholars found that there is a positive nonlinear relationship between industrial agglomeration and energy efficiency (Zhao and Lin, 2019 [
8]; Zheng and Lin, 2018 [
11]); specifically, there is a positive (Yuan et al., 2020 [
9]) or inverted U shape (Li and Liu, 2022 [
12]; Xu et al., 2022 [
13]) between the two.
In addition, some scholars discussed the spatial spillover effect and concluded that industrial agglomeration has a spatial spillover effect. Among them, most scholars agree that the spatial spillover effect of industrial agglomeration is positive (Yang et al., 2020 [
3]; Feng et al., 2022 [
14]). However, a few scholars believe that the spatial spillover effect is negative (Han et al., 2018 [
5]; Hong et al., 2020 [
6]; Xie et al., 2021 [
15]), the reason for which lies in the interaction between industrial agglomeration and government intervention, thus showing its negative effect.
Moreover, some scholars discussed spatial heterogeneity. Scholars generally believe that there is spatial heterogeneity in industrial agglomeration in China, but the effect is different. One view holds that industrial agglomeration is more significant in the central and eastern regions of China (Qu et al., 2020 [
16]; Liu et al., 2017 [
4]), and it has a restraining effect on energy efficiency in the western regions (Qu et al., 2020 [
16]). Another point of view is that the positive effect of industrial agglomeration in the central and western regions is higher than that in the eastern regions (Ding et al., 2022 [
17]), or the promoting effect of industrial agglomeration in the western regions is greater than that in the central regions (Liu et al., 2017 [
4]). A possible reason is that the agglomeration of different industries has different heterogeneities of influence on energy efficiency. For example, Qu et al. (2020) discussed the impact of financial agglomeration on energy efficiency. These scholars believe that compared with central and eastern regions, the industrial base of western regions is relatively weak, and financial agglomeration will increase the competition among traditional industries with high pollution, which is not conducive to the promotion of energy efficiency. Liu et al. (2017) did not subdivide industry agglomeration but discussed the relationship between industry agglomeration and energy efficiency from a macro perspective. They believe that due to the low degree of industrial agglomeration in western China, industrial agglomeration in western China has a greater impact on energy efficiency than that in eastern China.
In summary, although there are studies with contradictory conclusions, most of them basically affirm the positive promotion effect of industrial agglomeration on regional energy efficiency and believe that there are spatial spillover effects and spatial heterogeneity. However, the academic community has not reached a unified conclusion on the direction of influence of the surrounding areas. In addition, academia has also found that some factors distort the impact of industrial agglomeration on regional energy efficiency, but few studies have discussed government intervention as a variable.
2.2. A Literature Review of Government Intervention and Regional Energy Efficiency
Compared with most countries in the world, China’s special social system makes the impact of government intervention on market development more significant. Therefore, most international studies on the impact of government intervention on energy efficiency are focused on China.
Some scholars believe that China’s government intervention has promoted the improvement of energy efficiency. In particular, the government has improved taxation (He et al., 2021 [
18]), transportation infrastructure (Liu et al., 2020 [
19]), use of fiscal decentralization (Wang and Su, 2022 [
20]) and environmental regulation (Li and Ma, 2021 [
10]; Song and Han, 2022 [
21]). The government has also established a carbon emissions trading system (Chen et al., 2021 [
22]), implemented a civilized city policy (Li et al., 2022 [
23]), the green credit guide 2012 (Tan et al., 2022 [
24]), an emissions trading policy (Tan et al., 2022 [
25]), a system of carbon emissions trading rights (Hong et al., 2022 [
26]), a strategy of “digital China” (Gao et al., 2022 [
27]), smart city construction (Dong et al., 2022 [
28]) and a sulfur dioxide emissions trading system (Li et al., 2021 [
29]), etc. These measures can stimulate the market to develop green and innovative technologies to reduce pollutant emissions and, thus, improve local energy efficiency.
However, other scholars take the opposite point of view. They believe that although government policies tend to promote regional innovation, from a practical perspective, more government intervention leads to the inhibition of energy efficiency, especially with Chinese fiscal decentralization, where the government exhibits short-term economic behavior for short-term economic growth, inclining resources toward traditional energy-intensive industries. This leads to a “race to the bottom” (Kassouri, 2022 [
30]) and inhibits improvements in energy efficiency.
In summary, at present, the academic community has not reached a unified conclusion on the direction of government intervention on energy efficiency, although studies show that some policies, such as taxes, trading pilots and trading systems, can promote energy efficiency. Other government actions, such as tilting financial resources toward traditional energy-intensive industries, have the opposite effect. Therefore, in actuality, whether government intervention really plays a promoting role requires further discussion.
2.3. A Literature Review of High-Tech Industrial Agglomeration and Government Intervention
At present, there are few studies on the relationship between high-tech industry agglomeration and government intervention. Some scholars have directly studied the relationship between the two and believe that the government will affect industrial agglomeration through subsidies (Kondo, 2013 [
31]), improvements to transportation networks (Liu et al., 2022 [
32]) and other intervention methods.
Some scholars have also introduced a third variable for discussion. One view is that the interaction between the two will have negative effects, such as negative externalities for the environment, causing the “race to the bottom” and “free-riding” phenomena (Hong et al., 2020 [
6]). Another point of view is that government intervention will distort the positive impact of industrial agglomeration on land prices (Lin and Ben, 2009 [
33]), green technology innovation (Wu et al., 2021 [
34]), etc.
In summary, firstly, government intervention can directly affect industrial agglomeration; secondly, government intervention will interact with industrial agglomeration and cause externalities; and thirdly, government intervention and industrial agglomeration may have opposite forces on a third party, and government intervention can distort the influence of industrial agglomeration on the third variable. Therefore, in terms of energy efficiency, it is worth discussing whether government intervention and market agglomeration still conform to the above laws, and the results can also provide a theoretical basis for the government’s decision making.
3. Theoretical Mechanism
3.1. High-Tech Industrial Agglomeration and Regional Energy Efficiency: Evasive Competition Effect
High-tech industry agglomeration can exert a significant positive influence on regional technological progress and innovation (Zhang et al., 2019 [
35]) through methods including the activation of regional innovation activities (Akhvlediani and Cieślik, 2017 [
36]) led by knowledge and technology spillover among regional high-tech enterprises (Carlino et al., 2007 [
37]; Li et al., 2017 [
38]). In this process, the evasive competition effect of industrial agglomeration has an important influence (Kireyeva et al., 2018 [
39]), namely, the high and new technology industry cluster can produce industry competition, the evolvement of which follows the logic of “high and new technology industry agglomeration–cluster competition–technology innovation”. Because industrial technology innovation needs a certain amount of knowledge and experience, it has the characteristics of being complex and having long cycles. Therefore, the innovator has a certain learning cost when carrying out innovation (Mayley, 1996 [
40]; Ahn, 1999 [
41]). At this time, the geographic agglomeration of high-tech industry is conducive to the concentration of a large number of professional talents and human capital related to technological innovation, increasing the input of specialized intermediate goods and knowledge spillover to reduce the learning cost, promoting the improvement of the regional innovation efficiency and technological innovation level. The evasive competition effect means that the more intense the competition, the lower the profits of the firm. Therefore, the firm will escape the competition through innovation. This boosts the latecomers to the local technological innovation activities by intensifying the inter-industry competition, which makes the effect of evasive competition more obvious, promoting the continuous improvement of the regional innovation ability.
At the same time, existing research shows that technological innovation can create a new capital accumulation structure, improve labor efficiency, broaden new value creation channels, reduce energy waste in the production process of enterprises and promote the development of a regional low-carbon economy and the continuous improvement in the energy efficiency (Tirole, 1988 [
42]; Fisher-Vanden et al., 2006 [
43]; Witajewski-Baltvilks et al., 2015 [
44]). In particular, environmentally friendly technological innovation can significantly promote energy conservation and emissions reduction and improve regional energy efficiency by enhancing the regional green development potential and guiding technological progress toward green development (Yao et al., 2016 [
45]).
Based on the above analysis, regional high-tech industry agglomeration can promote regional technological progress and innovation through an evasive competition effect mechanism and effectively promote regional energy efficiency through technology improvement. Thus, this paper puts forward the following hypothesis:
Hypothesis 1 (H1).
High-tech industrial agglomeration can significantly improve regional energy efficiency by promoting regional technological progress.
3.2. Government Intervention and Regional Energy Efficiency: The “Race to the Bottom” Trap
This paper analyzed the interaction between government fiscal policy intervention and regional energy efficiency at the macro level. When the government adopts an expansionary fiscal policy, it will promote public R&D expenditure, while taking the decision to vigorously promote regional innovation, which will intensify social competition for technological innovation resources, cause more rent-seeking behavior by enterprises, boost the social R&D cost and further diminish the regional innovation ability (Goolsbee, 1998 [
46]).
The deeper impact of government intervention on regional energy intensity lies in that the government would fall into a “race to the bottom” as it intervenes in energy standards (Han et al., 2018 [
5]) and tax competition (Hong et al., 2020 [
6]). Because of the unreasonable achievements appraisal system and promotion system, the local government is forced to continuously participate in tournaments that “compete for growth”. As a result, the local government tilts more financial resources toward traditional high-pollution, high-energy consumption industries with shorter cycles, lower risk and fast payback; thus, the share of green innovation enterprises are squeezed out. Enterprises, in order to survive, are forced to give up research and development on green technology with longer cycles, and this will inhibit energy efficiency.
According to the above analysis, government intervention will intensify the social plunder of innovation resources and also make the governments themselves into a “race to the bottom”. Therefore, in the long run, this mechanism will inhibit the improvement of regional energy efficiency, which will ultimately hurt others. Based on the above analysis, this paper puts forward the following hypothesis:
Hypothesis 2 (H2).
Government intervention stifles regional energy efficiency by triggering a race to the bottom.
3.3. High-Tech Industrial Agglomeration, Government Intervention and Regional Energy Efficiency: Moderating Effect
From the above analysis, it can be seen that high-tech industry agglomeration will promote technological progress and innovation, thus it has a positive impact on energy efficiency. In addition, government intervention can stifle energy efficiency by triggering a “race to the bottom”. In China, the government plays a pivotal role in the market. To some extent, government intervention is closely related to industrial agglomeration and energy efficiency. For example, subsidies and other policy means are used to create local high-tech industry agglomeration. Therefore, this paper continues to explore whether the influence of the two on regional energy efficiency will change when they exist together.
It can be seen from existing studies that industrial agglomeration will trigger the effect mechanism of “evasive competition”, thereby amplifying the innovation ability of the region and promoting the improvement of energy efficiency (Aghion et al., 2005 [
7]). However, government intervention can distort this mechanism by inducing a “race to the bottom” trap (Hong et al., 2020 [
6]) and the “Schumpeter effect” (Aghion et al., 2005 [
7]). Based on the Schumpeter effect, once a monopoly is formed in an industrial agglomeration market and some enterprises rely on excess profits for a long time, this will inhibit the decline in the overall innovation ability of the region. Government intervention will not only aggravate the “Schumpeter effect” through path dependence, but would also make traditional high-energy consumption enterprises with a low green innovation ability the monopolistic enterprises in the region, which will further distort the green innovation of the whole region. The reason for this mainly lies in the fact that in order to obtain short-term economic growth, the government would tilt the fiscal resources toward traditional high-energy-consumption, high-pollution industries. This, on the one hand, squeezes the share of green development-oriented enterprises. On the other hand, traditional companies have a large market share which can ensure continuous excess profits; therefore, enterprises would lack the motivation to develop long-cycle and high-input green innovation technology.
In addition, research also shows that there is a U-shaped relationship between industrial agglomeration and energy efficiency (Li and Liu, 2022 [
12]; Xu et al., 2022 [
13]). The critical points and negative externalities are related to the transportation infrastructure’s construction and industrial structure (Liu et al., 2020 [
19]; Zhong et al., 2020 [
47]). Moreover, these factors are related to government intervention.
Based on the above analysis, on the one hand, high-tech industrial agglomeration will bring dividends, such as talent agglomeration, knowledge spillover and transportation cost reduction, thus promoting the growth of energy efficiency. On the other hand, government intervention will trigger the trap of a “race to the bottom”, aggravate the negative externalities brought by industrial agglomeration, and inhibit energy efficiency. Thus, this paper puts forward the following hypothesis:
Hypothesis 3 (H3).
Government intervention will distort the positive effect of high-tech industry agglomeration on energy efficiency.
3.4. Spatial Spillovers: Trickle-Down Effect and Diffusion Effect
Energy efficiency creates a spatial spillover effect. In terms of the impact of government intervention on energy efficiency, existing studies have shown that government policy support (Yu et al., 2022 [
48]), the establishment of corresponding pilot programs (Tan et al., 2022 [
25]) and the proposal of national strategies (Gao et al., 2022 [
27]) all have spatial spillover effects on energy efficiency. Government intervention not only affects the region but also causes a similar market structure and market proximity among neighboring provinces in China. As a result, the policies of a province will siphon talents from surrounding areas or radiate to surrounding areas (Ke and Feser, 2010 [
49]), which will also affect the energy efficiency of the surrounding areas.
In addition, in terms of the impact of high-tech industry agglomeration on energy efficiency, existing studies also fully show that industrial agglomeration has a nonlinear relationship with energy efficiency, which is affected by spatial correlation, etc. (Wu et al., 2020 [
1]). This is because the advantages of geographical location lead to close cooperation between enterprises in neighboring provinces. Moreover, with a developed transportation network and government support, the improvement in the regional innovation and technology will spill over to neighboring provinces, along with the population and the internet, so as to enhance the technological level of other provinces and improve their energy efficiency.
Based on the above analysis, both high-tech industry agglomeration and government intervention have a nonlinear relationship on energy efficiency, and there is a spatial spillover effect. In general, thanks to policy, transportation, population and other factors, the positive spatial spillover effect in the eastern region is significantly greater than that in the central and western regions. Thus, this paper puts forward the following hypothesis:
Hypothesis 4 (H4).
In terms of exploring the influencing factors and mechanism of energy efficiency, the effects of energy efficiency, high-tech industry agglomeration and government intervention all have spatial spillover effects.
4. Model Construction, Variable Selection and Spatial Distribution
4.1. Model Construction
4.1.1. Fixed Effects Model
This paper studied the impact of government intervention and high-tech industry agglomeration on energy efficiency in 30 provinces, municipalities and autonomous regions (excluding Tibet) in mainland China from 2007 to 2019. Although the fixed effect model cannot estimate the influence of variables that do not change over time, compared with random effects, it can achieve consistent estimations even if the individual effects are related to explanatory variables. Therefore, in order to avoid the endogeneity problem in the model, a fixed effect model was constructed in this paper. The application premise of this model is to assume that the results of independent studies tend to be consistent, and there is no significant difference in the consistency test. The specific model is as follows:
In this model, i represents the province; t represents the year; represents the explained variable, namely, regional energy efficiency; represents the degree of government intervention; represents the degree of high-tech industry agglomeration; represents a set of control variables; and , respectively, represent the individual effect and time effect of the model; and represents the disturbance term.
4.1.2. Construction of the Spatial Econometric Model
Spatial econometrics is a term that was first publicly proposed by Jean Paelinck in 1974 at the second annual meeting of the Dutch Statistical Association. Compared with traditional econometric models, spatial econometrics focuses on the spatial dependence in the model. That is, the attribute value of a certain spatial unit depends on the degree to which the attribute value of its neighboring space is desirable. Therefore, although the model is strict in the selection of the spatial weight matrix, the model has the advantage of considering the spatial dependence in the model. The premise of a spatial econometric model is the spatial autocorrelation of the explained variables. Government intervention and high-tech industry agglomeration in a region would not only directly affect the local energy intensity, but also have different degrees of impact on other regions through a spatial spillover effect. Therefore, this paper introduced the spatial econometric model and combined the panel data of 30 provinces, municipalities directly under the central government and autonomous regions (except Tibet) in mainland China from 2007 to 2019 to explore the impact of high-tech industry agglomeration and government intervention on the regional energy effect. In addition, in order to solve the endogeneity problem of the model, we referred to the research framework of Elhorst (2014) [
50]. The following spatial Durbin model (SDM), spatial error model (SEM) and spatial lag model (SAR) were constructed.
In this model, the subscripts i and t represent the provinces and years, respectively; ρ represents the spatial lag coefficient; λ represents the spatial error coefficient; β and θ are the parameters to be estimated; represents a series of explanatory variables, including the main explanatory variables of government intervention system and high-tech industry agglomeration degree, as well as a series of control variables. represents the spatial individual effect; represents the spatial time effect; represents the random disturbance term, which satisfies the assumptions of zero mean, homoscedastic, zero covariance and homodistribution; and is a normalized n-by-n dimensional spatial 0–1 adjacency matrix. There are many ways to set the spatial weight matrix, including the spatial weight matrix based on the adjacency; the spatial weight matrix based on the spatial distance and economic distance; and the composite spatial weight matrix weighted by the above methods. In this paper, the spatial weight matrix of the adjacency was selected, and only the spatial dependence (i.e., autocorrelation) caused by the adjacent spatial locations of the research objects was considered.
4.1.3. Panel Threshold Model Construction
Based on past experience (Li and Liu, 2022 [
12]; Xu et al., 2022 [
13]), when government intervention and high-tech industrial technology cluster, they are also likely to have nonlinear effects on energy efficiency. Therefore, when further exploring the impact of government intervention and high-tech industry agglomeration on regional energy efficiency, this paper took the practice of Hansen (1999) [
51] as a reference, selecting a nonlinear panel model, took government intervention as the threshold variable and high-tech industry agglomeration as the core explanatory variable, and set the following model. The premise of this model is the existence of a threshold effect. Although the model has the disadvantage that the differentiation interval and the sample separation point are selected arbitrarily, rather than determined by the internal mechanism of economy, the method has the advantages that it does not need to give the form of a nonlinear equation, and the threshold value and its number are completely determined by the internal data of the sample. Therefore, this paper chose the panel threshold model.
where
is the energy efficiency;
is the degree of high-tech industry agglomeration;
is the degree of government intervention;
represents a set of control variables;
is the residual error; i is the province; t is the time;
is the threshold value corresponding to the threshold variable; and
is an indicative function. If the condition is satisfied, the value is 1; if the condition is not satisfied, the value is 0.
4.2. Variable Interpretation and Data Sources
4.2.1. Explained Variable
- (1)
Energy efficiency (EE)
The concept of energy efficiency was first proposed by Kaya and Yokobori (1997) [
52]. Based on the super-SBM model and using DEA Solver Pro 5.0 software, this paper constructed the energy efficiency measurement system, as shown in
Table 1, to measure the carbon emission efficiency of 30 provinces, municipalities and autonomous regions in mainland China from 2007 to 2019.
In
Table 1, the capital stock is calculated by referring to the method of Jun et al. (2004) [
53], using the “perpetual inventory method”, and 2006 was selected as the base period and the unit was CNY 100 million. The labor force index is measured by the total number of employees in the three industries in the same year, and the unit was 10,000. The total energy consumption was selected as the energy input index, and the unit was ten thousand tons of standard coal. At the same time, the gross domestic product (GDP) of each province was taken as the output factor index. Due to the consideration of price changes, this paper took 2006 as the base period and used the index deflator to convert the real GDP of each province or region over the past years. The data sources were the China Statistical Yearbook, China Energy Statistical Yearbook and statistical yearbooks of the provinces, municipalities directly under the central government and autonomous regions.
In addition, this paper used the super-SBM model to measure the efficiency against the input–output index system, shown in
Table 1. The SBM model sets slack variables to make up for the influence that the “slack” factor brings to the traditional DEA model. The super-SBM model was proposed by Tone (2001) [
54] on the basis of the SBM, which effectively solves the problem that the SBM model cannot distinguish effective decision-making units. The super-SBM model is expressed in Equation (6).
where x represents the input factor variable, y represents the output factor variable, m represents the number of input indicators, s represents the number of output indicators;
is the slack variable of the input,
is the slack variable of the output and
denotes the weight vector.
4.2.2. Core Explanatory Variables
- (1)
High-tech Industrial Technology Agglomeration (HIC)
In this paper, the location entropy was used to measure high-tech industry agglomeration. At present, there are mainly three methods to calculate the location entropy at home and abroad:
In this model, represents the location entropy of industry i; , and , respectively, represent the output value, employment number, and number of enterprises of i industry in a certain region; , and , respectively, represent the total output value, total employment number and total number of enterprises of all industries in region i; , and , respectively, represent the output value, employment number and number of enterprises of industry i in all regions; , and represent the total output value, total employment and number of enterprises of all industries in the country.
Based on the existing data, there is a lot of missing data on the annual output value of high-tech industry in China’s provinces, and local governments have limited disclosure of this index. However, the agglomeration degree of regional high-tech enterprises represented by the location entropy of enterprises obviously does not take into account the size of enterprises. In addition, based on the data availability, as well as considering that human capital is the most important and also the most active element in high and new technology industry, as well as that its quantity and degree of concentration can greatly act on behalf of the regional high-tech industry cluster, this paper used the provincial high and new technology industry location employment entropy as the region’s high-tech industry agglomeration agent variables. The data on the number of jobs in high-tech industries came from the China Statistical Yearbook and the statistical yearbooks of the provinces and regions.
- (2)
Degree of Government Intervention (GI)
The contents of government intervention include legal means, economic policies, planning guidance and administrative means. Among them, one of the most direct and flexible methods of government intervention is fiscal policy, so this paper adopted fiscal policy intervention as the proxy variable of government intervention. Fiscal policy includes expansionary fiscal policy and contractionary fiscal policy, the former accompanied by fiscal deficit, while the latter accompanied by fiscal surplus. The ratio of fiscal expenditure and regional output (GDP) is used as the measurement index of fiscal intervention in most existing studies (Qiu-yun et al., 2017 [
55]). This measurement method only considers the measure of expansionary fiscal intervention but does not reflect the government’s intervention degree when fiscal contraction occurs. Therefore, this paper made a correction, and the measure of the government’s intervention degree is shown in Equation (8).
where
represents the intervention degree of regional government in period t of region i;
represents the government fiscal revenue in t period of time of i region;
represents the government fiscal expenditure in t period of time of i region;
is an expression representing the degree of government intervention when implementing contractionary fiscal policies; and
is an expression representing the degree of government intervention when conducting expansionary fiscal policy.
4.2.3. Control Variables
In order to avoid the endogeneity problem caused by missing variables and to obtain effective estimation results, this paper controlled the influence of other relevant variables, including:
- (1)
Provincial Forest Coverage Rate (Forest)
The relevant data were obtained from the China Statistical Yearbook and the statistical yearbooks of the various provinces and cities.
- (2)
Fiscal Transparency (FT)
In this paper, we adopted the comprehensive score of financial transparency of the Chinese provinces published by the Shanghai University of Finance and Economics as its proxy variable, which is the most authoritative one in China.
- (3)
Financial Development Index (FD)
In this paper, we measured the Financial Development Index (FD) on the basis of Raymond W. Goldsmith’s book Financial Structure and Development, and the specific measurement formula is (balance of deposits of financial institutions + balance of loans of financial institutions)/GDP. The data used in the measurement came from the China Statistical Yearbook, China Financial Statistical Yearbook and the statistical yearbooks of each province.
- (4)
Industrial Structure Deviation (ISD)
In this paper, we refer to the Theil index constructed by Gan et al. (2011) [
56] to measure the deviation index of the industrial structure. The Theil index is constructed as follows:
where
is the total output value of the three industries;
is the output value of the first, second and third industrial sectors;
is the total population employed in the tertiary industries; and
is the population employed in the primary, secondary and tertiary industry sectors. The Theil index value represents the deviation degree of the industrial structure. The larger the Theil index value, the greater the industrial structure deviates from the equilibrium state and the lower the degree of rationalization of the industrial structure.
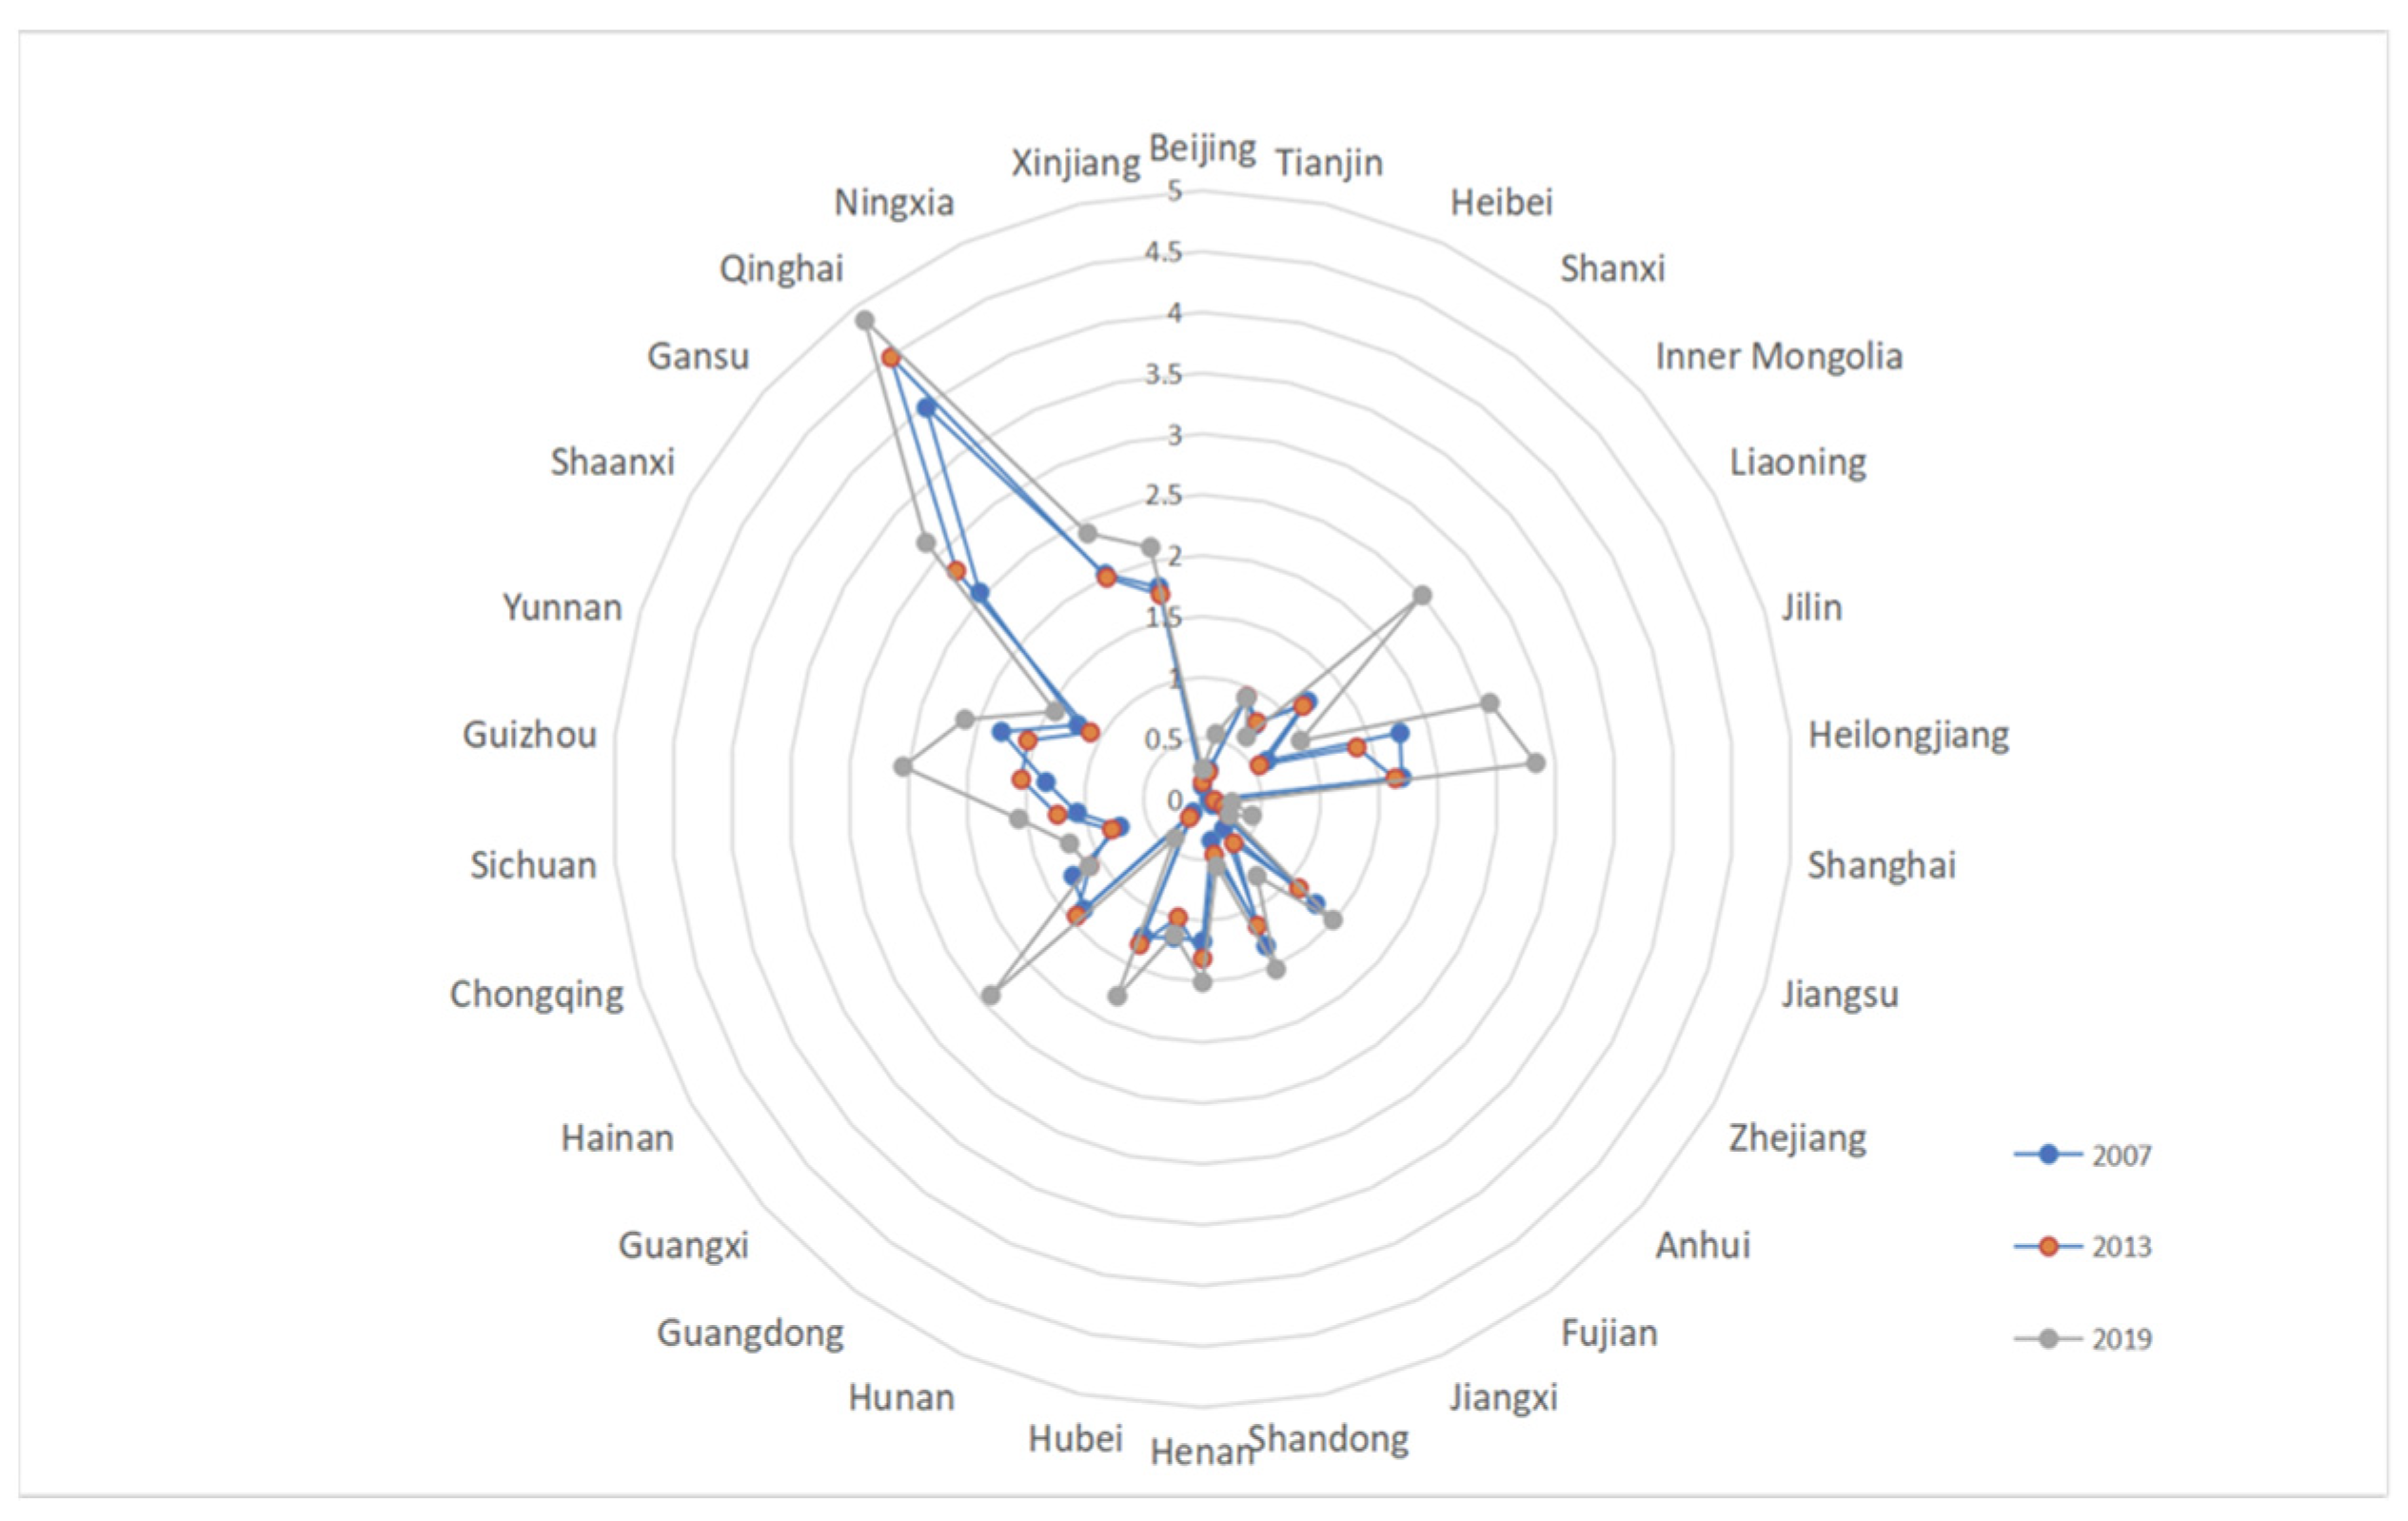
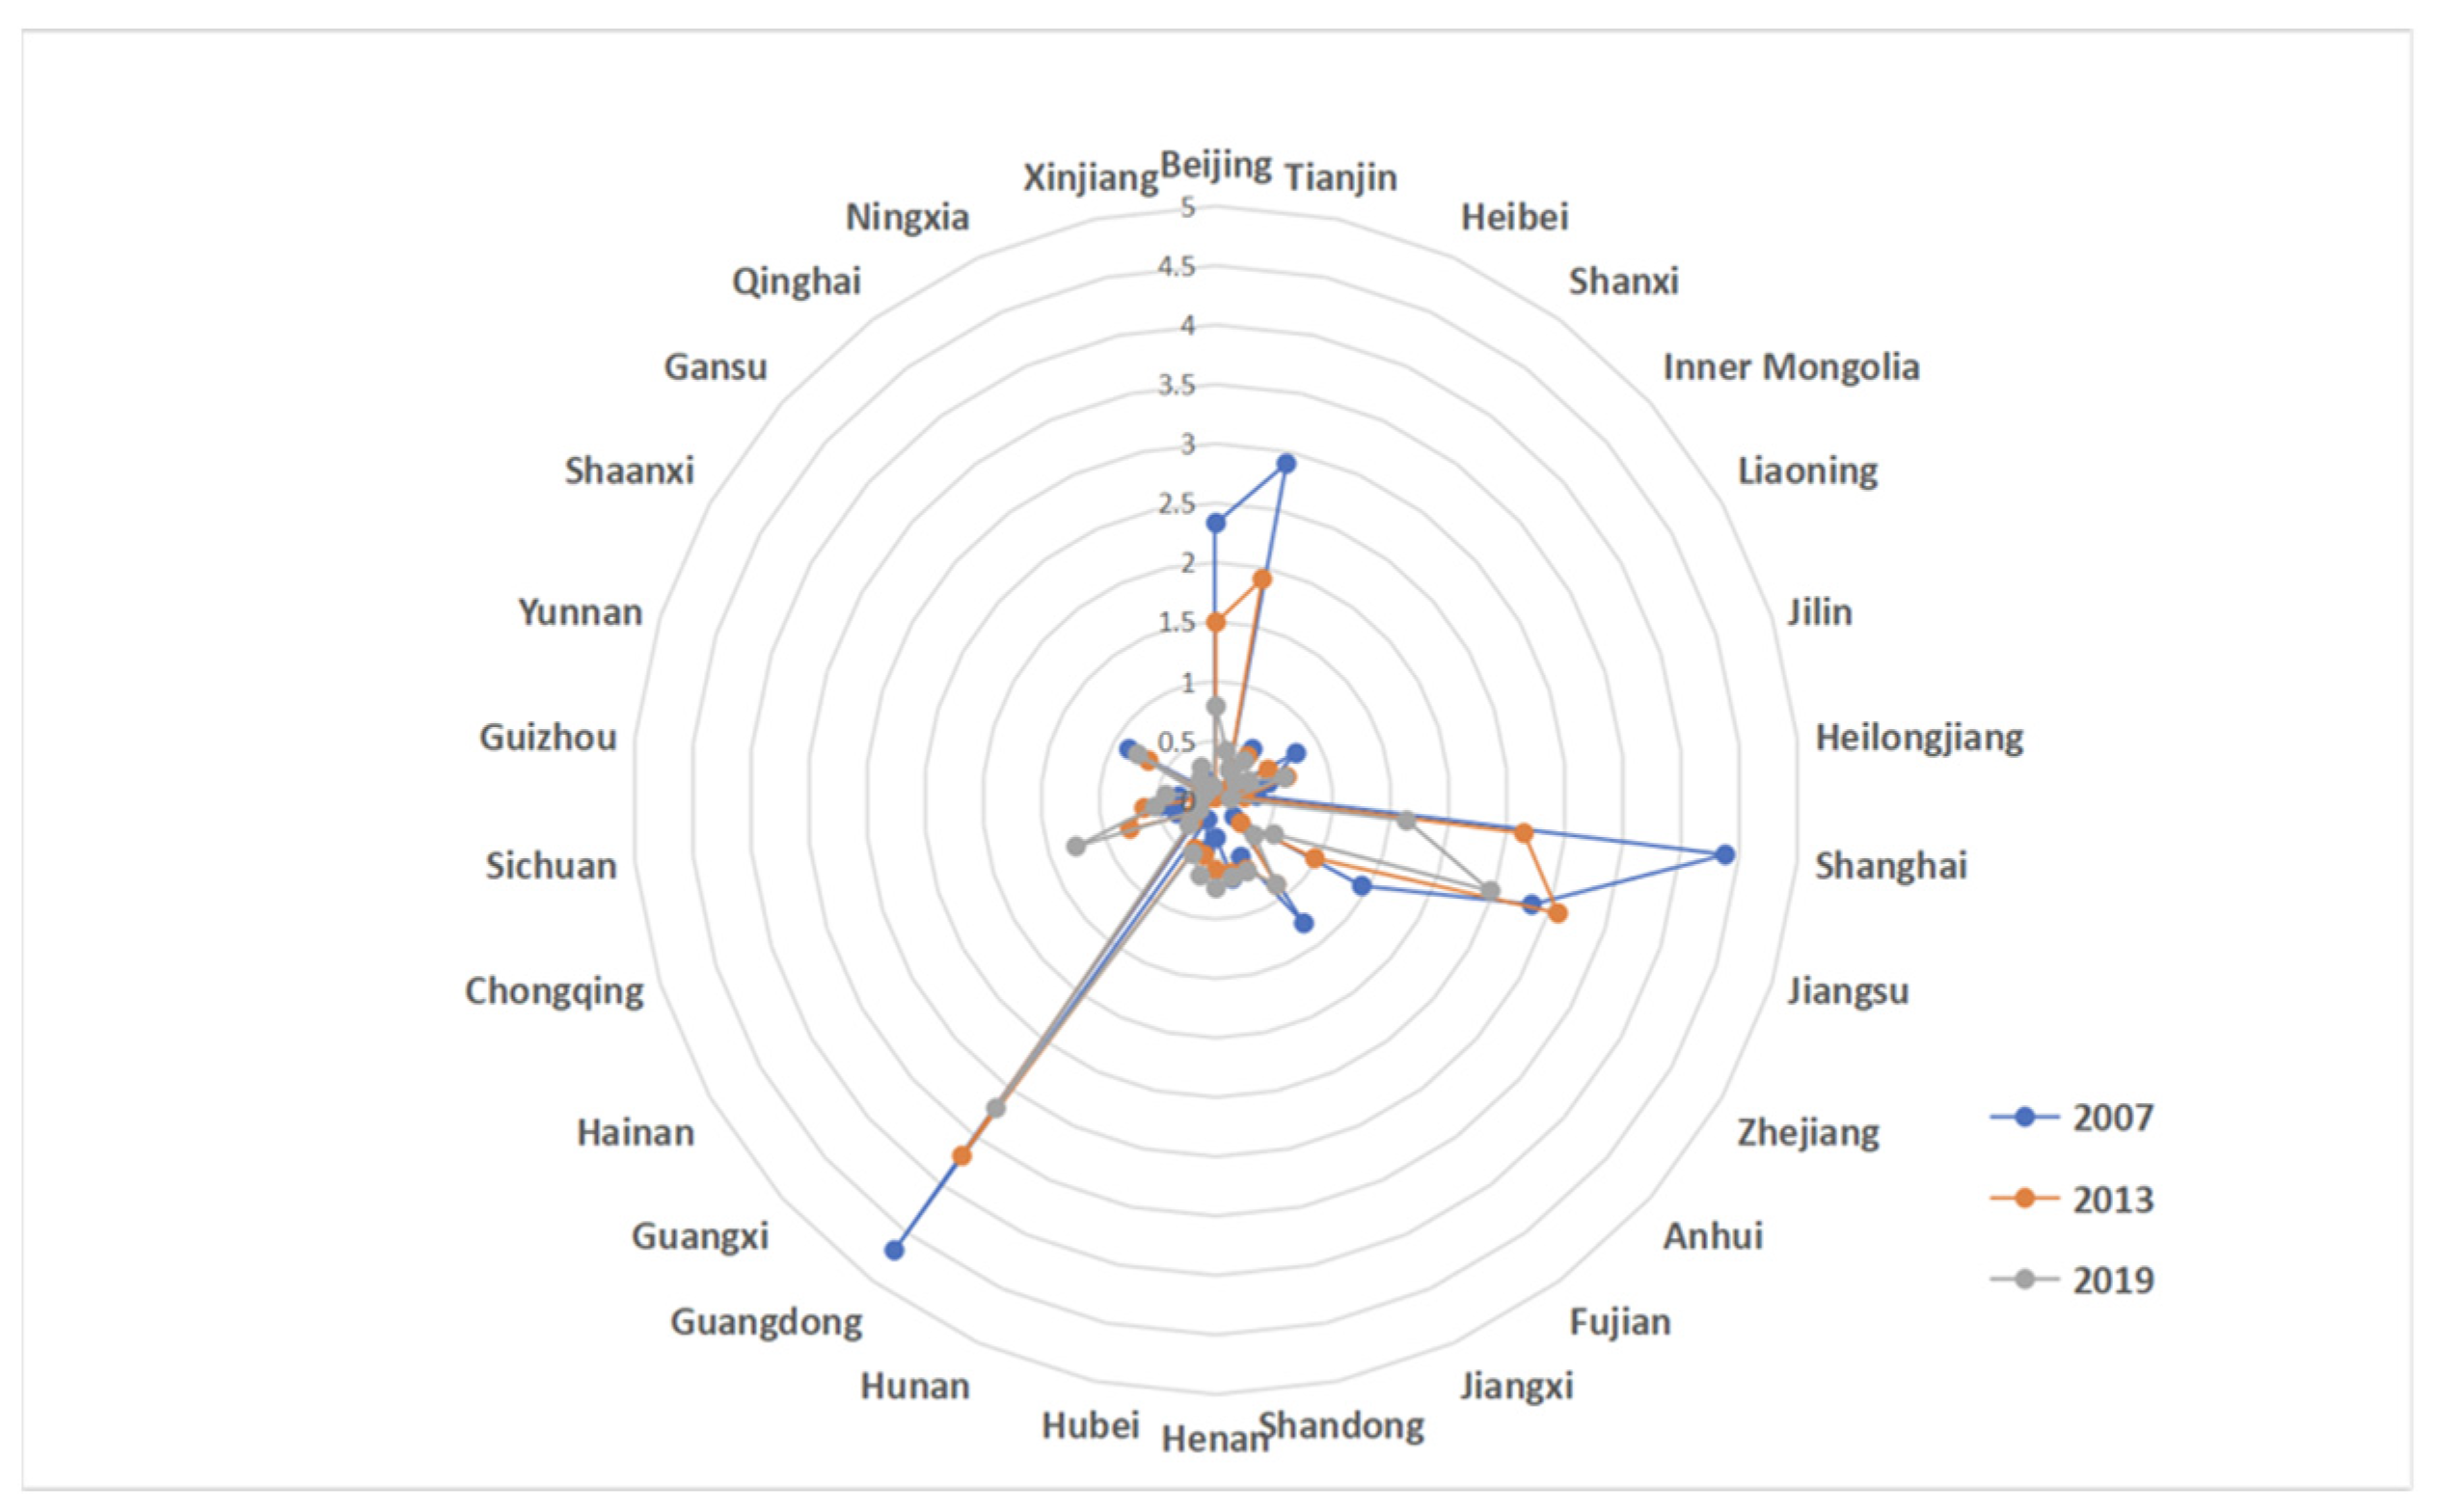
Considering the availability of data, panel data of 30 provinces, municipalities directly under the central government and autonomous regions (except Tibet) in mainland China from 2007 to 2019 were selected as samples in which the data on the explained variable (EE) were obtained. In order to alleviate the negative impact of heteroscedasticity on the model estimation, this paper took logarithms of all of the variables, except energy efficiency (EE) (
Figure 1,
Figure 2 and
Figure 3).
Table 2 reports the descriptive statistical results of the explained variables, core explanatory variables and control variables.
4.2.4. Spatial Weight Matrix
The three common spatial weight matrices are the 0–1 adjacency matrix, that is, the adjacency of two regions is denoted as 1; the geographical distance matrix, that is, the inverse of the distance between the two regions is used as the weight matrix; and the economic distance matrix, that is, the inverse of the absolute value of the difference between the per capita GDP of the two regions is used as the weight matrix. This paper focused on the spatial spillover effect between geographically adjacent regions, so the first matrix, namely, the 0–1 adjacency square matrix, was selected. The matrix is as follows:
where
is the spatial weight matrix. Both i and j represent provinces; when province i and j are adjacent,
is 1; otherwise, it is 0.
4.2.5. Spatial Distribution of the Core Variables
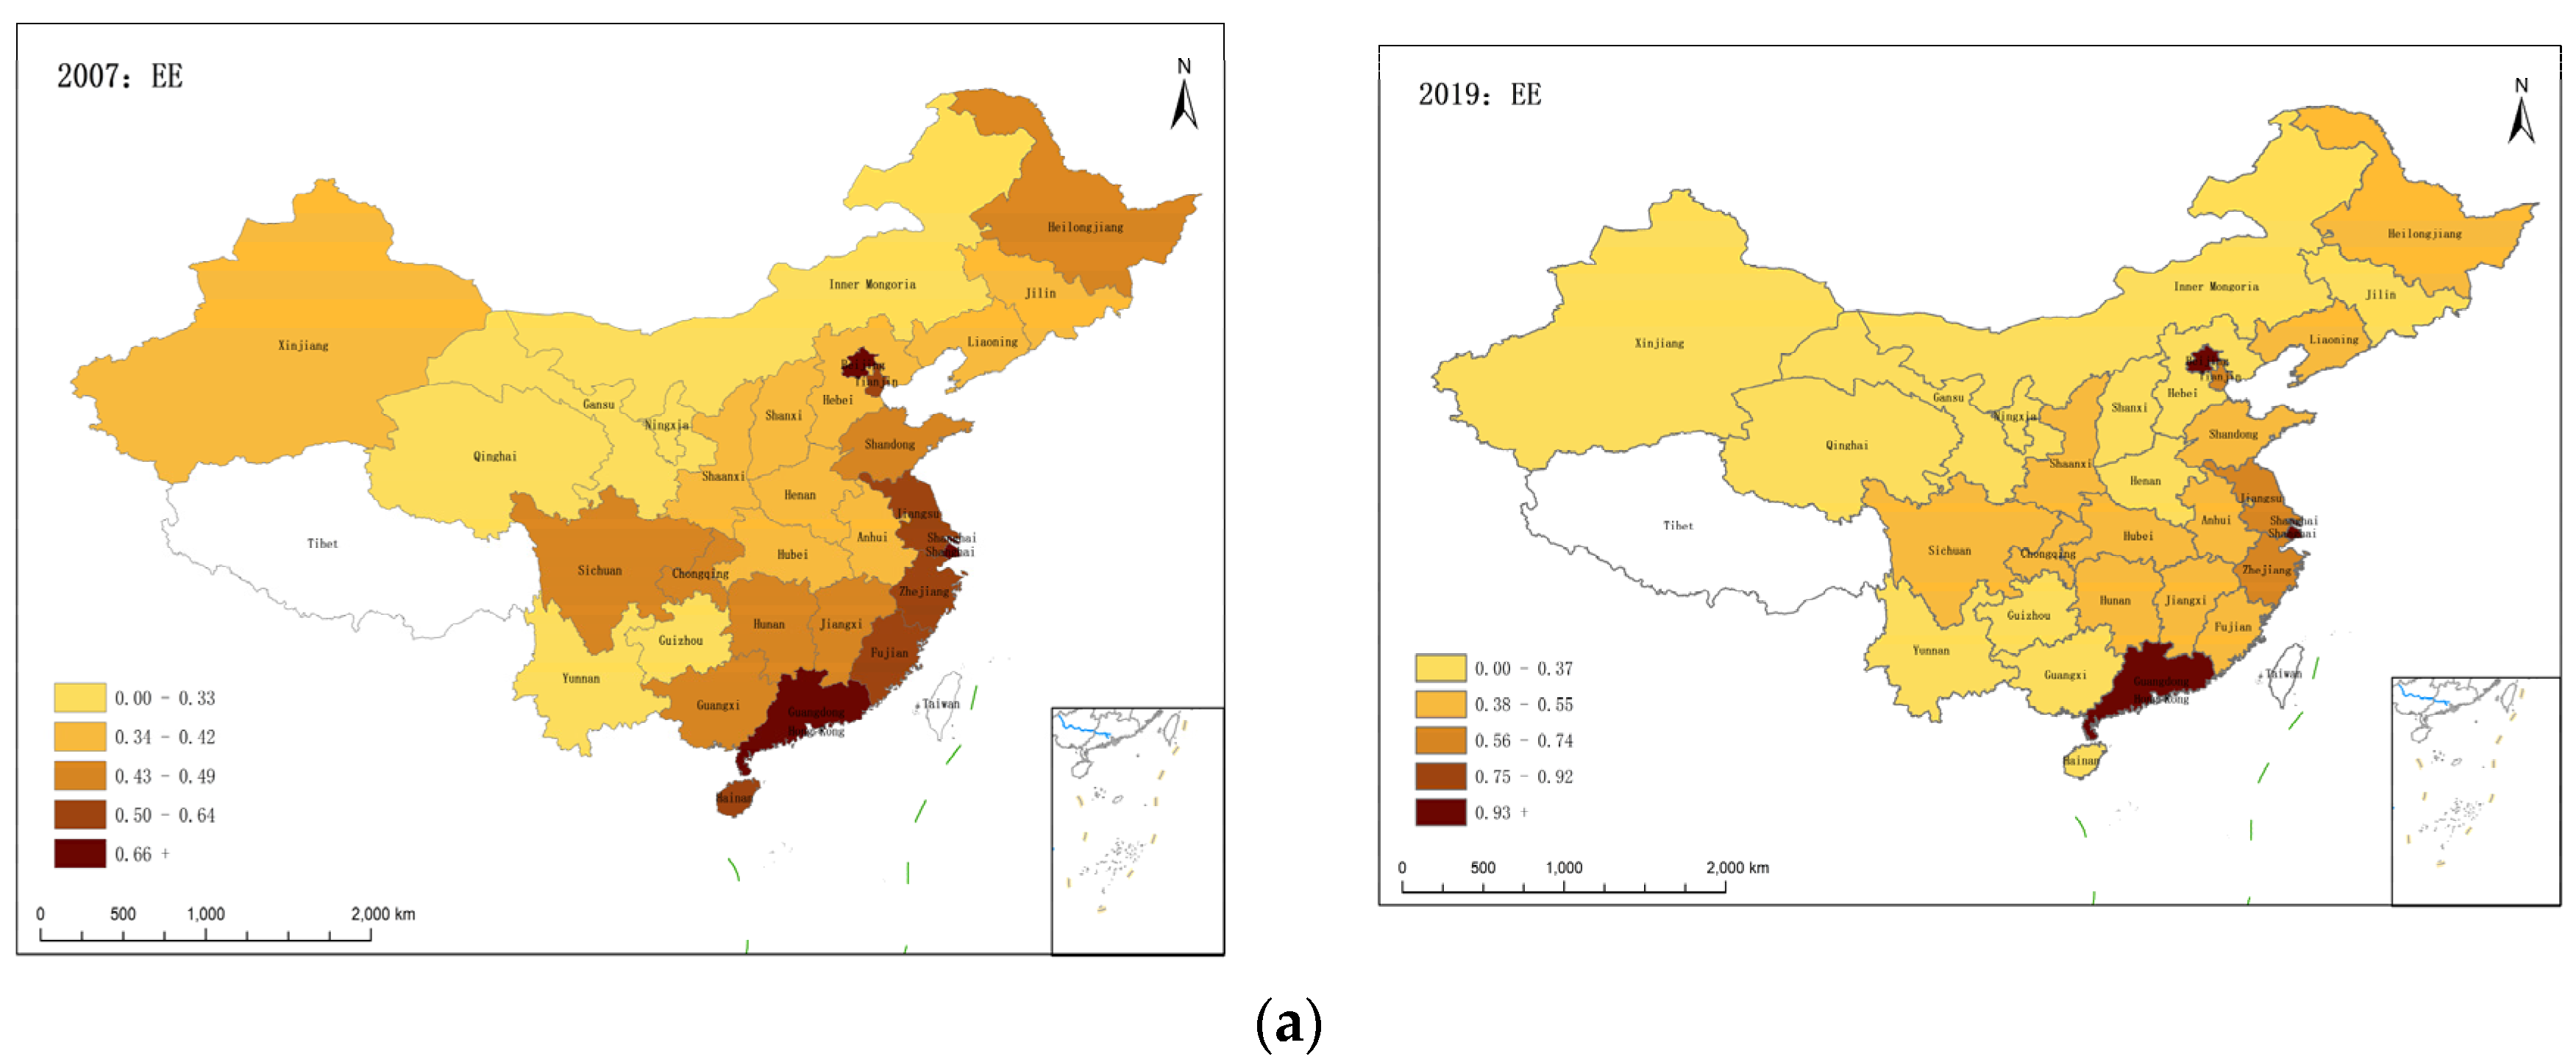
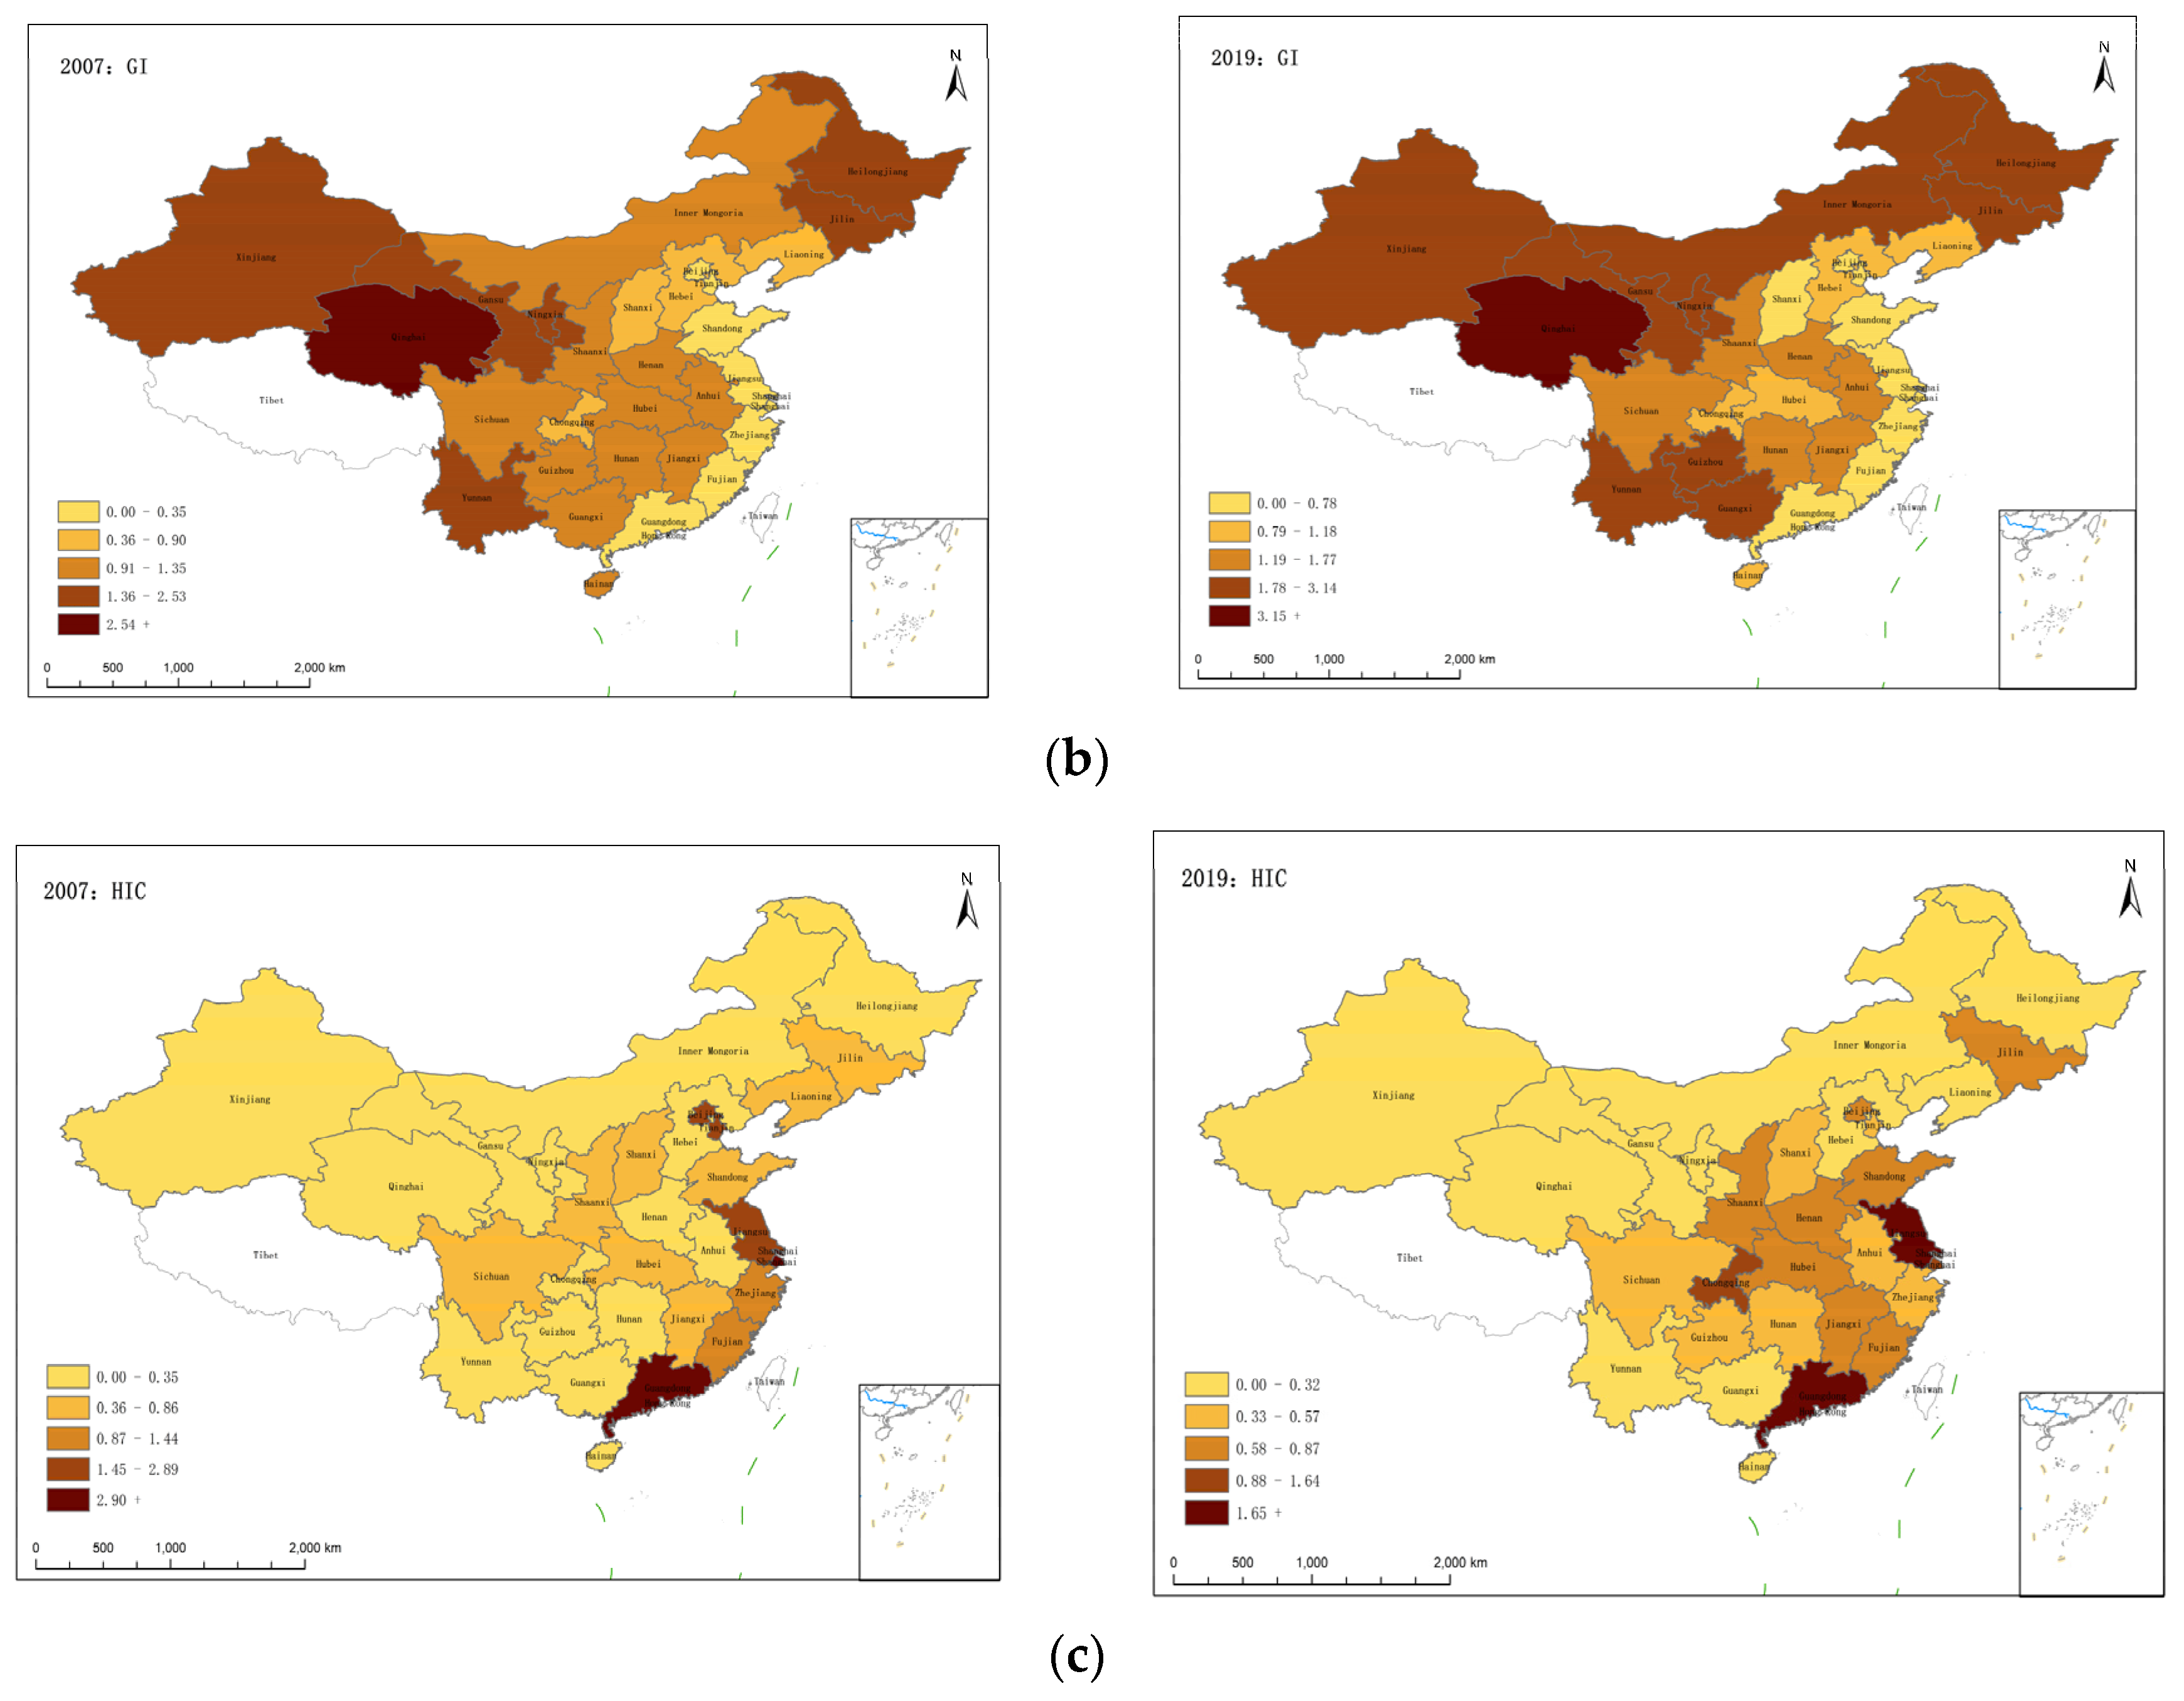
Figure 4 shows the spatial and temporal distribution of the core variables in 2007 and 2019. Among them,
Figure 4a shows the spatial and temporal distribution of the regional energy intensity in 2007 and 2019;
Figure 4b shows the spatial and temporal distribution of high-tech industry agglomeration in 2007 and 2019; and
Figure 4c shows the spatial and temporal distribution of government intervention in 2007 and 2019.
Based on the above spatial and temporal distribution maps, it can be seen that there is obvious spatial heterogeneity azmong the regional energy intensity, degree of high-tech industry agglomeration and degree of government intervention in China, no matter whether from south and north or from east and west. Among them, regional energy intensity and the degree of high-tech industry agglomeration show the distribution characteristics of ”the north is lighter than the south, while the west is lighter than the east”, whereas the degree of government intervention shows the distribution characteristics of “the north is heavier than the south, while the west is heavier than the east”. It can be seen that there are gaps in the economic development level and government system between the south and the north of China. Therefore, this paper also focused on the spatial heterogeneity of the variable interactions.
5. Empirical Results and Analysis
5.1. Fixed Effect Model Analysis
Model 1 is a dual-fixed effect model under the spatial Durbin model. In this paper, Stata17.0 was used to test the model variables, and the results are shown in
Table 3.
As can be seen from
Table 3, the coefficients of government intervention under different numbers of control variables were −0.0590, −0.0619, −0.0593, −0.0600 and −0.0603. Since the
p-values were all less than 0.05, the null hypothesis of no correlation between regional energy efficiency and government intervention is rejected, and the correlation coefficients were all negative. This indicates that government intervention has a significant impact on regional energy efficiency, and this impact is negative; that is, government intervention inhibits the development of regional energy efficiency, which supports Hypothesis H2. The reason for this is that the government is under a “tournament for growth”. The unreasonable examinational system and promotion system prompted the local government and local officials to focus on short-term economic growth, thus short-sighted policy, fiscal expenditure and preferential policies to attract foreign capital, improve traditional energy-intensive industries, such as in its direction, causing “the bottom competition” trap, inhibiting the development of regional energy efficiency.
In addition, under the condition of a different number of control variables, the high-tech industry agglomeration was 0.0465, 0.0459, 0.0443, 0.0452 and 0.0453, and the p-values were all less than 0.01, strongly rejecting the null hypothesis, and the correlation coefficients were all positive. High-tech industry agglomeration has a significant promoting effect on regional energy efficiency. Hypothesis H1 is supported. This is because the agglomeration of high-tech industries will bring knowledge, population and other dividends; increase the input of specialized intermediate goods; reduce learning costs; promote the improvement of regional innovation efficiency and degree of technological innovation; and enhance the effect of “escape competition”. At the same time, the Chinese government attaches great importance to and supports green development. In addition, more latecomers and fiercer competition further force capital to carry out technological innovation so as to explore more environmentally friendly production modes, which also promotes the development of regional energy efficiency.
In addition, in order to further investigate the joint action mechanism of high-tech industry agglomeration and government intervention on regional energy efficiency, this paper added the multiplicative interaction term between high-tech industry agglomeration and government intervention as a new core explanatory variable in the model to estimate the parameters again. The results are shown in
Table 4.
As can be seen from
Table 4, the coefficients of the new core explanatory variables were −0.0322, −0.0325, −0.0313, −0.0313 and −0.0324 and the
p-value passed the significance hypothesis test at the 5% level. It can be seen that the joint main effect of high-tech industry agglomeration and government intervention is significantly negative. This indicates that government intervention has a distorting effect on the positive externality of high-tech industry agglomeration, which supports Hypothesis H3. The reason for this is that many governments, in order to pursue short-term economic benefits and promotion targets, adopt short-term economic behaviors, which increases the Schumpeter effect of industrial agglomeration and amplifies its negative effect. As a result, high-tech industry agglomeration will inhibit the growth of regional energy efficiency as a whole.
5.2. Analysis of the Spatial Econometric Model
5.2.1. Spatial Applicability Test
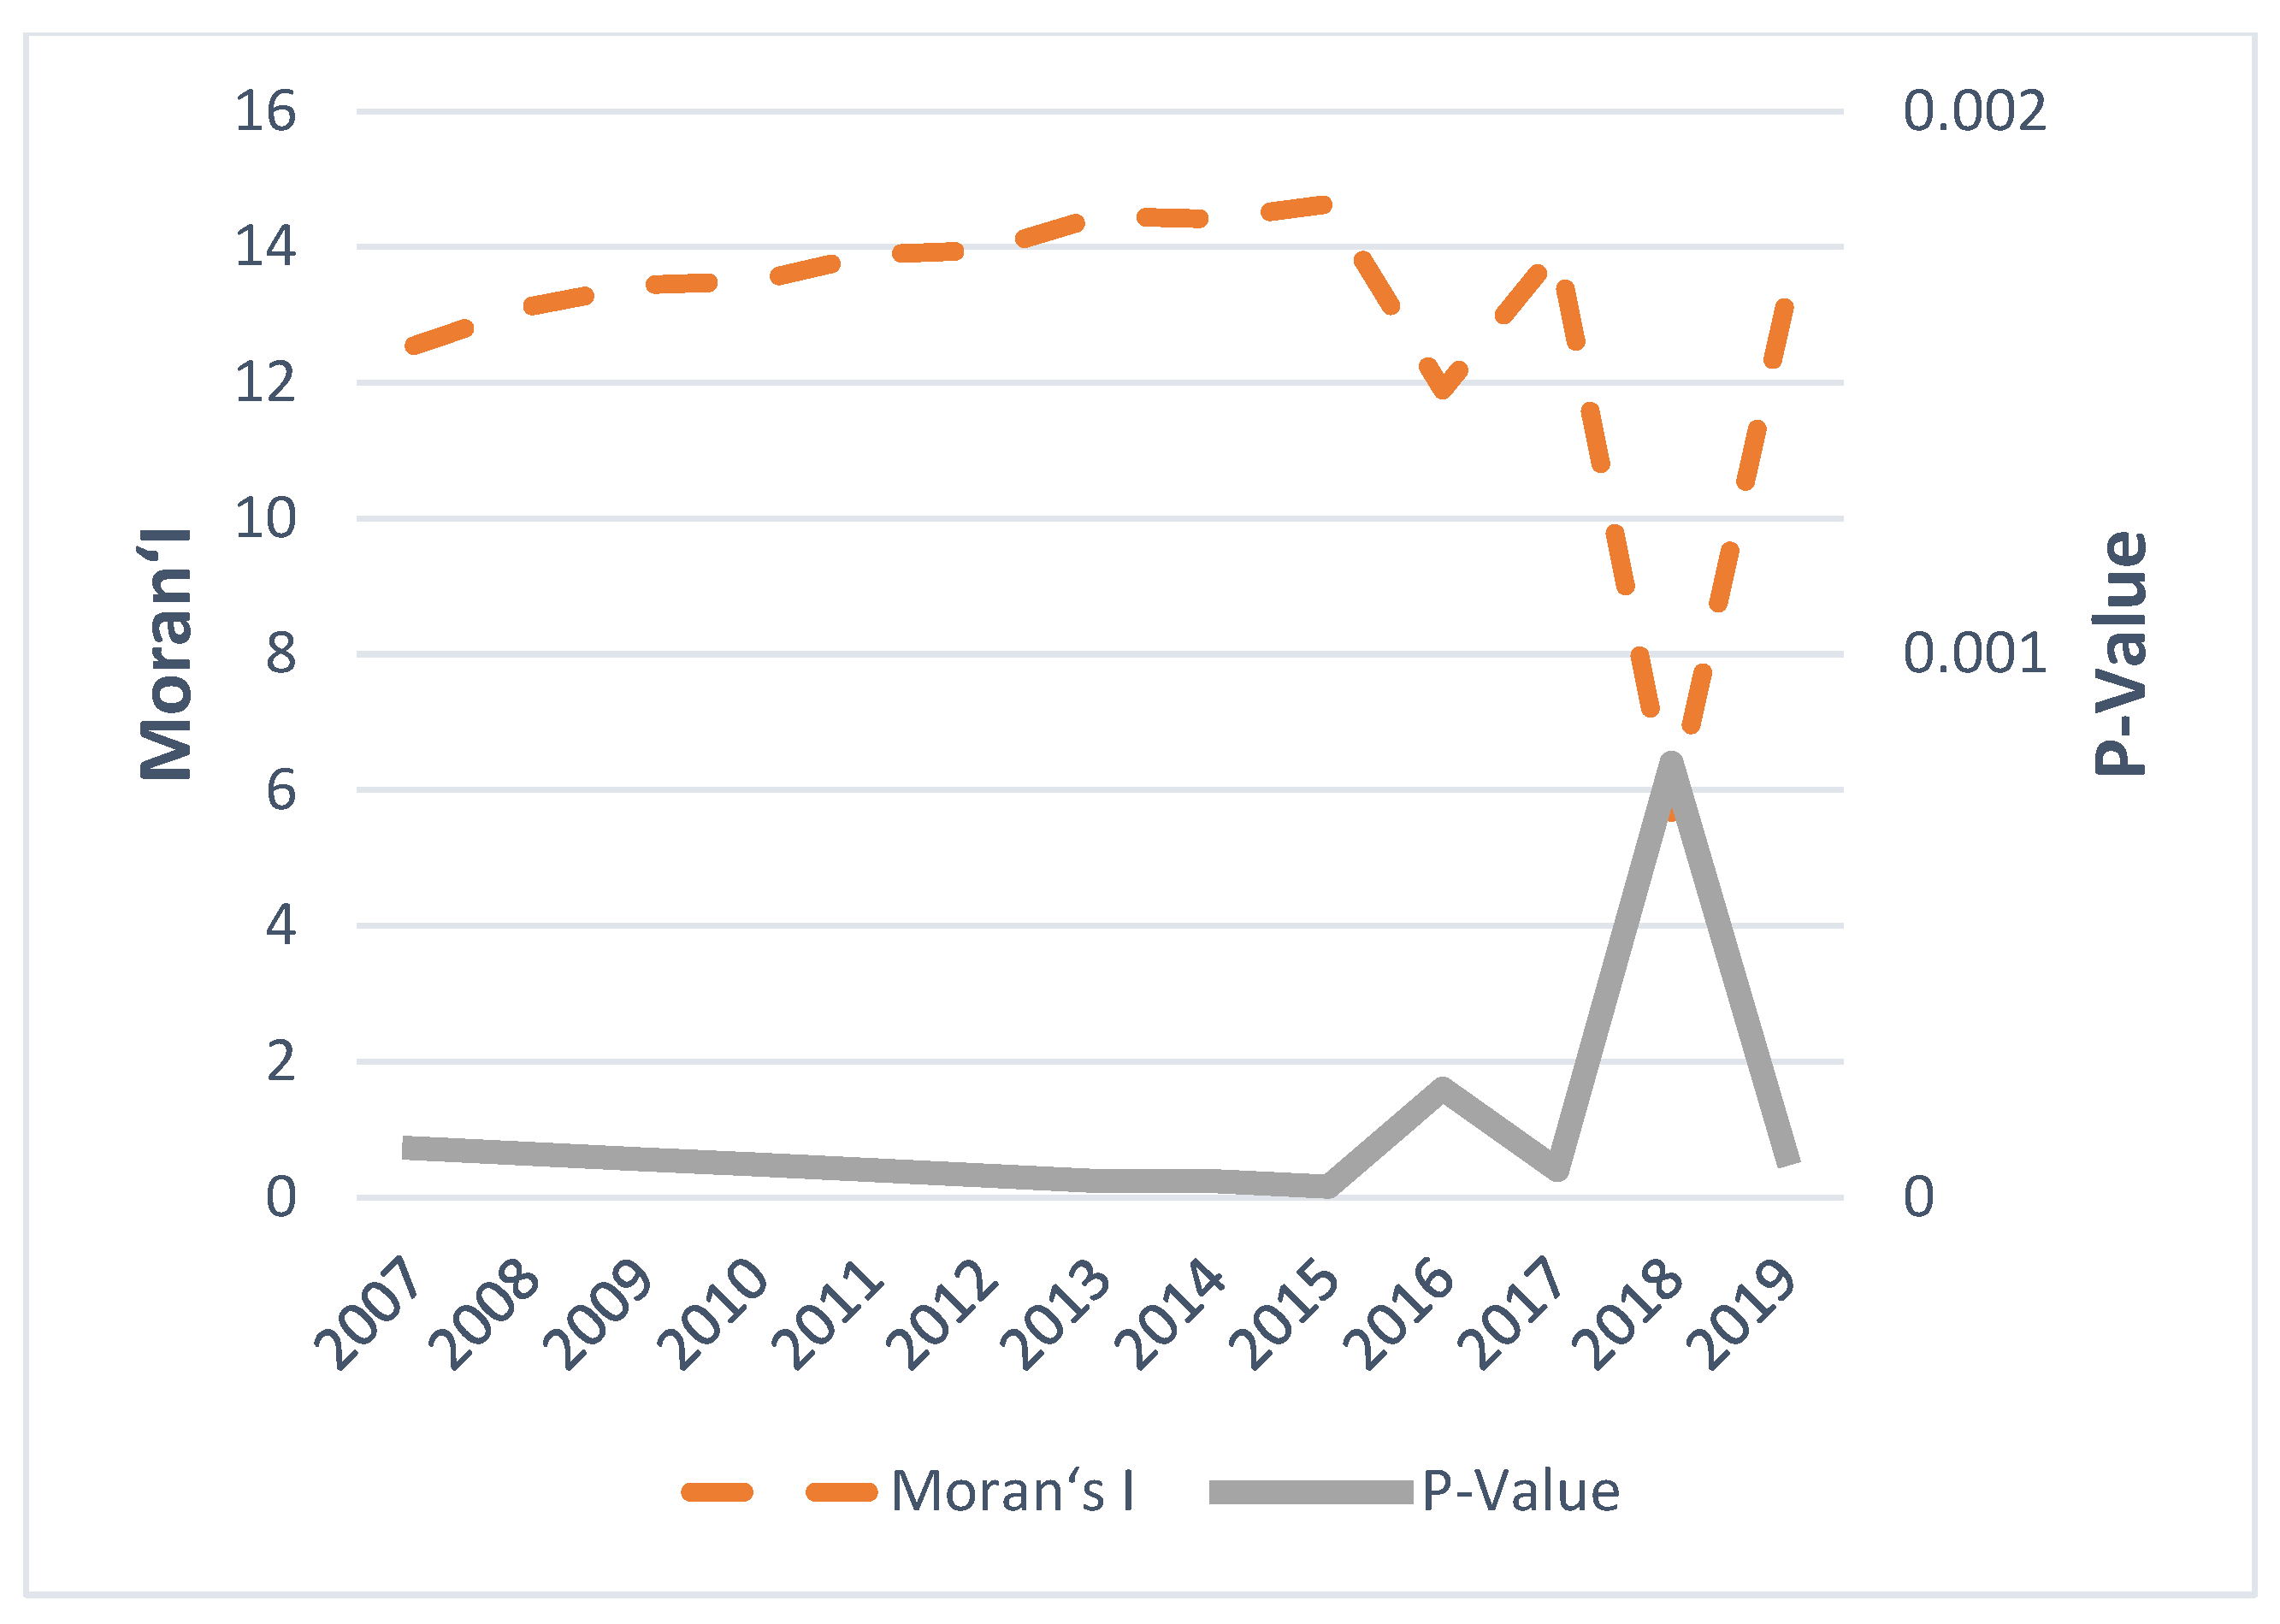
Stata 17.0 was used to calculate the global Moran’s I index and its significance for the energy efficiency of 30 provinces, municipalities and autonomous regions (except Tibet) in China from 2007 to 2019 based on the 0–1 spatial weight matrix considering geographical factors. The results are shown in
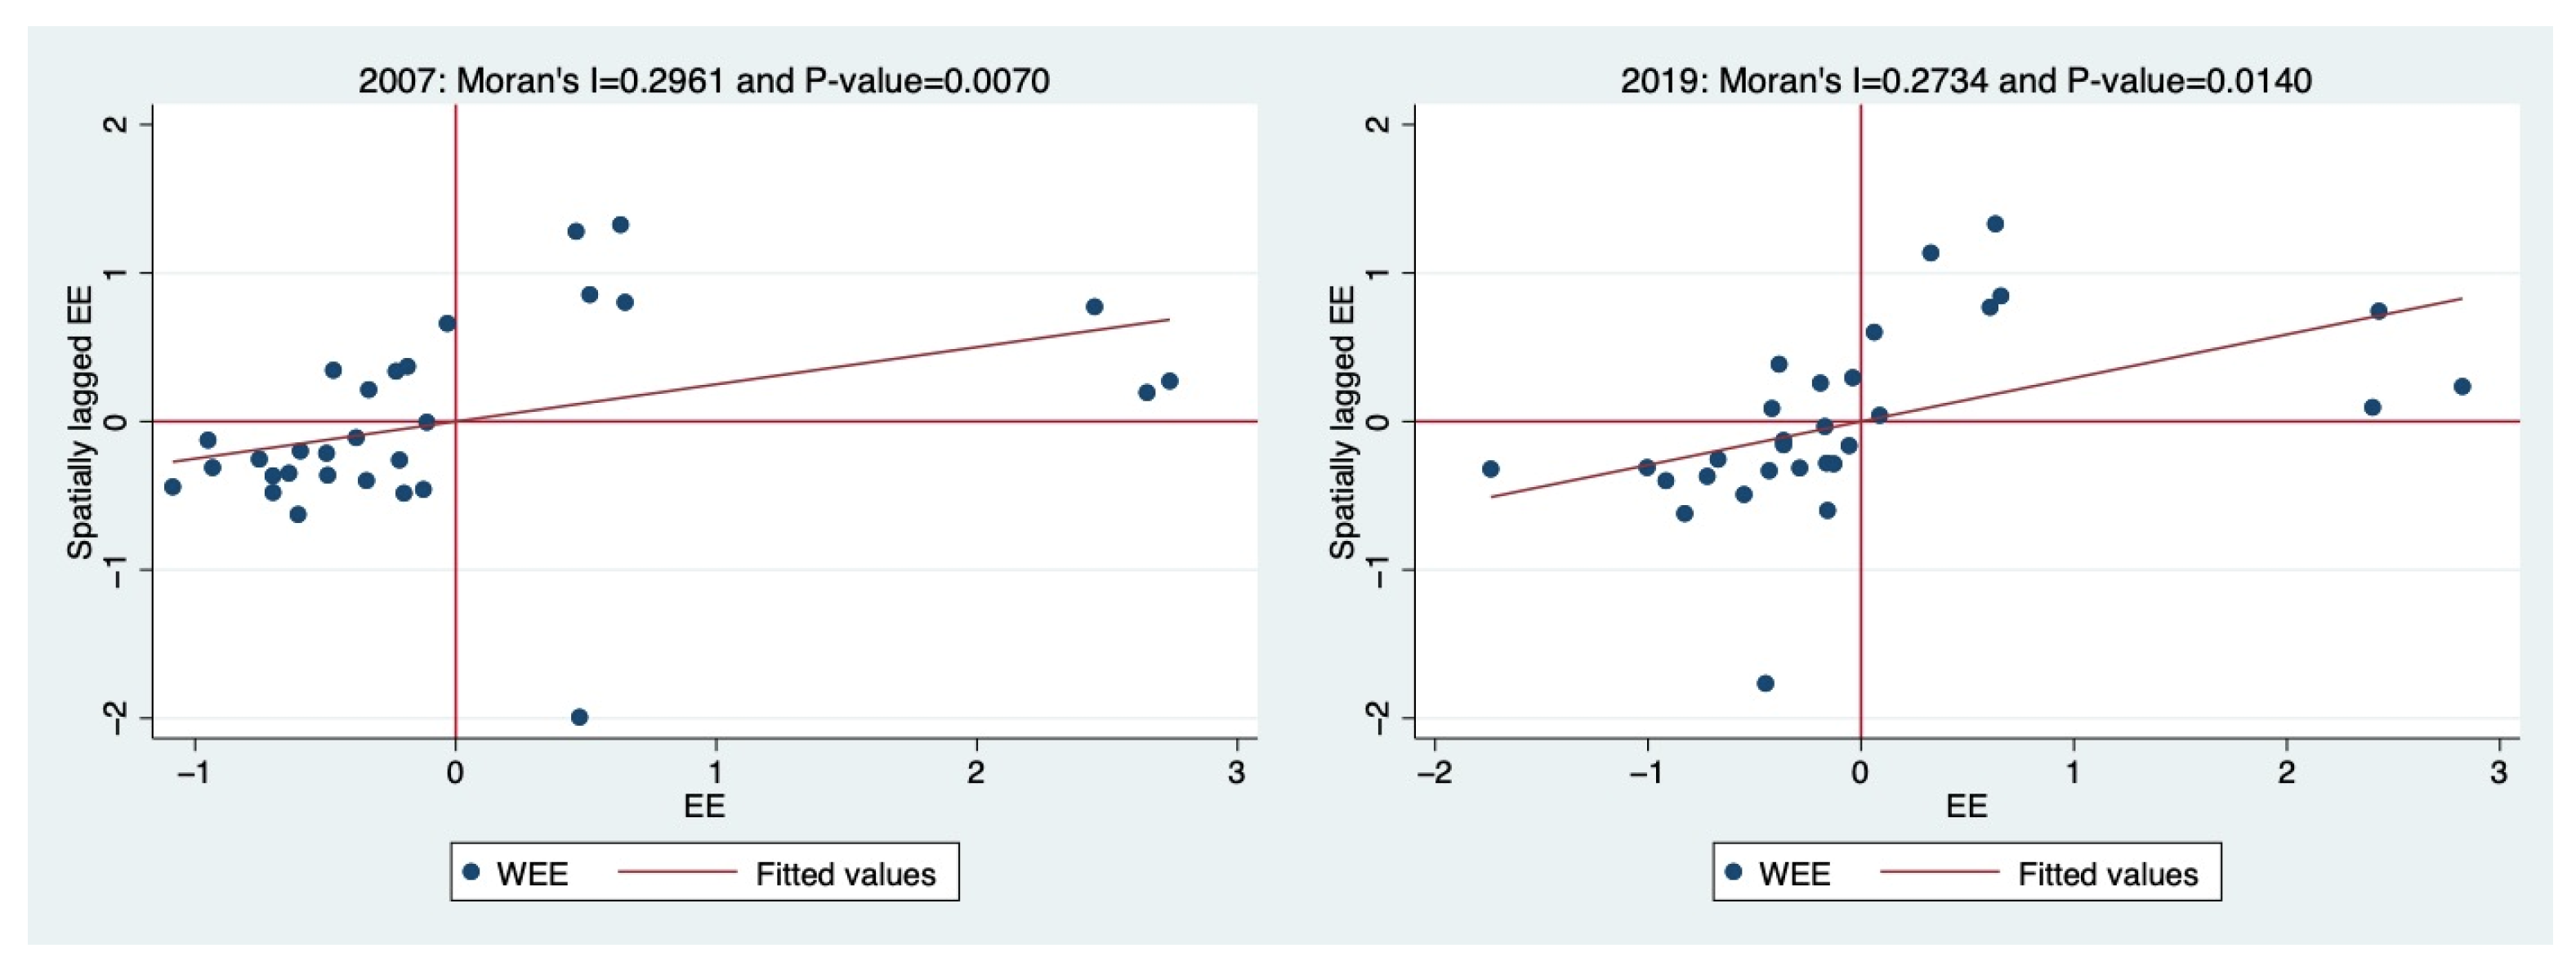
Figure 5. In addition, Moran scatter plots of regional energy intensity (EI) in 2007 and 2019 were also drawn, and the results are shown in
Figure 6.
Figure 5 shows that under the 0–1 spatial weight matrix, the global Moran’s I index of regional energy efficiency, government intervention and high-tech industry agglomeration were all positive and higher than four, and the
p-value was less than 1%, which passes the significance test, indicating that during 2007–2019, the regional energy efficiency, government intervention and high-tech industry agglomeration all reject the null hypothesis of no spatial autocorrelation significantly; that is, they all have significant positive spatial autocorrelation.
Visible from the
Figure 6, most of the years are located in the first quadrant and the third quadrant, which means that in most of the years, the provincial energy efficiency were high–high gathered (HH) in either a high or low–low concentration (LL), once again showing that a “high–high gathered and low–low gathered” spatial correlation among the regional energy efficiency, government intervention and the high-tech industry agglomeration exists. All of the above proves that it is reasonable to set up the spatial econometric model under the 0–1 spatial weight matrix.
5.2.2. Identification, Selection and Test of the Spatial Econometric Model
This paper constructed a spatial econometric model of high-tech industry agglomeration, government intervention and regional energy efficiency based on the 0–1 adjacency spatial weight matrix. The LM test, Hausman test, LR test, LR test and Wald test were used to identify which type of spatial econometric model was best. The results are shown in
Table 5.
As can be seen from
Table 5, first, the
p-value of the data passed the LM test at 1% significance, indicating that it was appropriate to choose both the SEM model and SAR model, so the SDM model combining them was selected. Second, in the Hausman test, the data passed the significance test at 1%, so the null hypothesis was significantly accepted, indicating that the fixed effect model was better when the SDM model was selected. Third, in the Wald test, the
p-value was 0.01, which also passed the significance test, again verifying that the SDM model should be selected in this paper. Fourth, in LR test, the
p-value was 0, which proves that the null hypothesis was significantly rejected, consistent with the previous test results, and the SDM cannot be degraded into the SAR model or SEM model, which again proves the correctness and accuracy of selecting the SDM model.
5.2.3. Spatial Durbin Model Regression Analysis
Based on the above analysis, this paper adopted the spatial Durbin model (SDM) with dual fixed effects to conduct an econometric analysis of the relationship among high-tech industry agglomeration, government intervention and regional energy efficiency. The results are shown in
Table 6.
As can be seen from
Table 6, the spatial autoregressive coefficients were 0.394, 0.393, 0.396, 0.393 and 0.392. The
p-value passed the significance test at the 1% level, and the coefficients were all positive, indicating that the energy efficiency of the explained variable region had a significant positive spatial spillover effect on itself. That is, the energy efficiency improvement of one province in China can significantly improve the energy efficiency level of neighboring provinces. This is because the improvement in the energy efficiency is mainly thanks to the improvement in the technical level of the region due to the rapid development of the internet and transportation network. Communication between provinces will increasingly be cross-regional cooperation among enterprises, etc., and all of these enhanced diffusion effects, namely, promoting knowledge spillover, talent spillover, etc., to enhance the technology level of the neighboring provinces, improves the energy efficiency in neighboring areas.
In addition, under the condition of a different number of control variables, the main effect coefficients of the degree of government intervention were −0.0510, −0.0526, −0.0545, −0.0582 and −0.0594, which passed the significance test at the 1% or 5% level, and the values were negative. Although the main effect coefficient of high-tech industry agglomeration did not pass the significance test at the 10% level in the regression of group (3), with a value of 0.0273, the regression of group (1), group (2), group (4) and group (5) all passed the significance test at 10%. The values were 0.0279, 0.0294, 0.0305 and 0.0302, respectively, and the values were all positive. In conclusion, government intervention can significantly inhibit regional energy efficiency, while high-tech industry agglomeration can significantly promote regional energy efficiency, which verifies the above results. This is because the government is obsessed with winning competition through short-term excellent performance, and it is very short-sighted when formulating policies. For example, it favors traditional high-energy industries with fiscal expenditure, thus promoting the rapid development of local economy and, indeed, improving energy efficiency and promoting green development in the short term. However, in the long run, this policy may trigger a “race to the bottom”, aggravate the negative externalities of enterprises on the environment and have a negative effect on energy efficiency. Therefore, in the long run, government intervention has a restraining effect on energy efficiency.
The coefficients of W × lnGI under a different number of control variables were 0.0328, 0.0328, 0.0397, 0.0241 and 0.0284, which failed to pass the significance test at the 10% level. Therefore, the null hypothesis is accepted, indicating that there is no significant spatial spillover effect of government intervention. That is, government intervention in one province will not have a spatial transmission effect on the energy intensity of neighboring provinces, which is contrary to the hypothesis of this paper. This is because, first, the policies of one province apply only to the region; second, provincial and municipal governments are in a parallel relationship and take orders from the central government, so they formulate local policies according to the central government’s policies. Moreover, the promotion mechanism and performance appraisal model of local governments are similar, so the policies of most provinces are similar. Third, market segmentation and local protectionism caused by government intervention in China make it difficult for local governments’ policies and economic activities to influence other policies outside their own jurisdictions. Therefore, the intervention policies of neighboring provinces naturally do not have spillover effects on the energy efficiency of neighboring provinces.
However, W × lnHIC passed the significance test at the 10% level, and the values were 0.0584, 0.0658, 0.0660, 0.0718 and 0.0819. Therefore, the null hypothesis is rejected, indicating that high-tech industry agglomeration has a significant spatial transmission effect; that is, the degree of high-tech industry agglomeration in a province will spillover through the spatial effect, increasing the energy intensity of neighboring provinces. Visibly, as the market and market structure are roughly similar, high-tech industry agglomeration does cause a “competition to avoid” effect, enhancing the innovation ability of enterprises. In addition, developed transportation and the internet strengthen the links among different enterprises, such as sending personnel to learn from each other and cooperating to develop novel products; these all enhance the knowledge spillover, thus improving the level of science and technology of the neighboring province, which in turn reduces the energy efficiency of neighboring provinces.
5.2.4. Deconstruction Analysis of the Spillover Effect of the Spatial Durbin Model
Furthermore, in order to avoid the endogeneity problem, this paper referred to the practice of Elhorst (2010) [
57] and used Stata 17.0 to deconstruct the spatial spillover effect into direct effect, indirect effect and total effect. In addition, in order to analyze the differences between southern and northern China in a more detailed way, this paper again deconstructed the direct effect, indirect effect and total effect of the spatial spillover effect in different regions.
Table 7 shows the spatial effect decomposition results based on the 0–1 spatial weight matrix under the SDM model.
As can be seen from
Table 7, the coefficient of the direct effect of government intervention was significantly negative, with a value of −0.0587, whereas the coefficient of the indirect effect and total effect failed to pass the significance test, with a value of 0.00776 and −0.0510, respectively, which confirms the above results of the econometric analysis, indicating that government intervention has a significant negative impact on local energy intensity. However, there is no significant spatial spillover effect, which will not have a spatial transmission effect on the energy intensity of other neighboring provinces. In addition, on the whole, the impact of government intervention on the national energy efficiency is not significant enough. It can be seen that the “race to the bottom” caused by the government’s short-sightedness due to the unreasonable promotion mechanism and other factors will have a significant negative impact on the energy efficiency of the region. However, due to the similarity and incoherence of the policies, the negative impact of a provincial government intervention has no significant spatial spillover effect.
The coefficient of high-tech industry agglomeration of the direct effect, indirect effect and total effect all passed the 5% level of the significance test, and the values were 0.0380, 0.133 and 0.171, showing that high-tech industry agglomeration not only significantly promotes energy efficiency in the province, but also has a strong spatial spillover effect on the energy efficiency of adjacent provinces. At the national level, the agglomeration of high and new industries has a significant positive impact on enhancing the regional energy efficiency. This conclusion again confirms the above analysis and also indicates that high-tech industry agglomeration will promote regional technological progress and innovation through the mechanism of the evasive competition effect. With the rapid development of transportation and the internet in China in recent years, the awareness of win–win cooperation among enterprises has gradually increased. Therefore, technological progress and innovation in one province will spill over to other provinces, thus promoting the improvement of the energy efficiency in neighboring provinces.
5.2.5. Expanding the Analysis
Given China’s vast territory and different levels of development in different regions, there may also be spatial heterogeneity in the government intervention and high-tech industry accumulation. Therefore, the spatial effects of the core explanatory variables are discussed in this paper by dividing the regions of China into the southern region and the northern regions.
Table 8 shows the decomposition results of the spatial effects based on the 0–1 spatial weight matrix in the southern and northern regions under the SDM model.
As can be seen from
Table 8, for government intervention, only the indirect effect passed the significance test at the 10% level in the northern region, with a coefficient of 0.162, whereas in the southern region, the direct effect passed the significance test at the 10% level, with a value of −0.0639. This shows that in the north of China, government intervention in one province has no significant inhibitory effect on the local energy efficiency but has a significant inhibitory effect on the energy efficiency of neighboring provinces. However, in the southern region, the conclusion is the opposite. The government intervention in one province has a significant inhibitory effect on the local energy efficiency, but there is no significant spatial spillover effect, and it has no significant negative effect on the energy efficiency of neighboring provinces. A possible explanation is that the central government is located in the northern region, which also leads the governments of neighboring provinces to pay attention to environmental protection and long-term sustainable development. Therefore, some governments will attract high-quality technologies from other provinces through policies, resulting in a siphon effect, which reduces the energy efficiency of other provinces. In the south, on the contrary, it is far away from the central government, so the government pays more attention to data; thus, more policies will directly inhibit the energy efficiency of the region.
In addition, for high-tech industry agglomeration, whether in the south or north, the direct effect, indirect effect and total effect all passed the 10% level of the significance test. It can be seen that the effects high-tech industry agglomeration have on regional energy efficiency does not have obvious spatial heterogeneity, whether in the north or the south. The improvement of the level of high-tech industry agglomeration in a province can have a significant positive effect on the improvement of the energy efficiency in the province and neighboring provinces. The above has demonstrated the promoting effect of high-tech industry agglomeration on energy efficiency many times, so it will not be repeated. However, it can be found from the data that the indirect effects in the north and the south were similar; this is because in the northern and southern parts of China, factors such as the traffic facilities and internet popularization level are relatively close and, thus, so are the overflow of knowledge and the population is similar; that is, a province at the technical level of the overflow are similar, both in the south and north, and the spatial spillover effect of the high-tech industry agglomeration is obvious.
6. Test for Robustness
6.1. Modification of the Spatial Weight Matrix
The spatial weight matrix in this paper was a 0–1 matrix based on the adjacency of geographic regions. Among them, China’s Hainan Province is an island province that does not geographically border any provinces or cities. Therefore, in the spatial weight matrix of this paper, the corresponding matrix elements of Hainan Province and any province were all 0, but this deviates from the economic significance of the spatial weight matrix. Therefore, in view of the small geographical distance between Hainan Province and Guangdong Province and the close economic connection between the two provinces, this paper considered Hainan Province and Guangdong Province as adjacent provinces when setting the spatial weight matrix. After obtaining the new spatial weight matrix, this paper re-estimated the parameters, and the results are shown in
Table 9, which show that the research in this paper is robust.
6.2. Elimination of the Annual Data That may Cause Interference
The annual period studied in this paper was 2007–2019. The Chinese central government set ecological civilization construction as one of the national goals in October 2007. Since then, ecological civilization construction has generally become one of the goals of local government policies. In addition, China’s National People’s Congress in 2018 sharply revised the “law on the prevention and control of atmospheric pollution” and then began to increase the intensity of the prevention of coal and other energy pollution and promoted national key areas for the control of air pollution in buildings, rebuildings and expansions of coal, reducing the amount of coal or replacing the project, to advocate for a new green energy. Therefore, 2007 was a period of adjustment for China’s energy and ecological policies, and in 2019 and afterwards, they are likely to cause significant changes in China’s energy efficiency situation. Therefore, in this paper, the data from 2007 and 2019 were removed from the sample, and the parameter estimation was re-performed (the results are shown in
Table 10). The results are basically consistent with the previous, which again verifies the robustness of this study.
6.3. Panel Threshold Model Analysis
6.3.1. Threshold Effect Test and Threshold Value Determination
It was proved above that high-tech industry agglomeration significantly promotes regional energy efficiency and has an obvious spatial spillover effect. Government intervention significantly inhibits regional energy efficiency, but the spatial spillover effect is not obvious. Considering various endogeneity problems, this paper set the threshold model to further study the influence mechanism of high-tech industry agglomeration on regional energy efficiency under the condition of government intervention. In this paper, using Stata 17.0, a bootstrap sampling test was used 300 times, and the seed value was set as 101. The results show that the
p-value of a single threshold effect was −0.9241, so it is considered that the test passed at the significance level of 1%, whereas the double threshold effect and triple threshold effect failed the test. This result indicates that the panel threshold model in this paper should set a single threshold, and the specific test results are shown in
Table 11.
6.3.2. Threshold Authenticity Test
Then, the threshold value was estimated in this paper, and the result is shown in
Table 12, which is the confidence interval between the threshold value calculated by LR and the 95% confidence level. The result shows that the estimated threshold value was −1.0263, and the 95% confidence interval was between −1.1018 and −1.0074.
6.3.3. Analysis of the Threshold Regression Results
From the results of the threshold effect test, it can be seen that high-tech industry agglomeration passed the single threshold test and had a threshold effect, which verifies the hypothesis above. It is proved that the impact of high-tech industry agglomeration on regional energy efficiency has nonlinear characteristics, and government intervention has a distorting effect on the above mechanism. The estimation results of the threshold model are shown in
Table 13.
As can be seen from
Table 13, when the government intervention degree is lower than the threshold value of 4.5400, high-tech industry agglomeration has a significant positive impact on regional energy efficiency. It can be seen that high-tech industry agglomeration can still promote energy efficiency as long as the government intervention is controlled within an appropriate range.
When the government intervention degree exceeds the threshold value of 4.5400, the parameter estimate value of high-tech technology industry agglomeration on regional energy efficiency is −0.0118, which fails to pass the significance test, indicating that at this time, high-tech industry agglomeration has no significant impact on regional energy efficiency. From the above analysis, in joining the threshold variable after the discussion of government intervention, high-tech industry agglomeration has no significant impact on regional energy efficiency; apparently, government intervention has a distorting effect on the mechanism, and this is because government intervention causes “bottom” competition, expanding hi-tech industrial agglomeration, bringing negative externalities. Moreover, the government’s financial resources will also be inclined toward energy-consuming enterprises with high short-term benefits and resource-wasting enterprises, thus crowding out the share of high-tech industries. In order to obtain more government resources, high-tech industries will also be forced to give up long-cycle economic R&D activities, resulting in the fading of the positive impact of high-tech industry agglomeration.
7. Conclusions of the Empirical Analysis
Based on the in-depth discussion of the impact of high-tech industrial agglomeration and government intervention on regional energy efficiency and the mechanism of the three, this paper used the panel data of 30 provinces in China from 2007 to 2019 and combined with Stata 17.0 software conducted an empirical study. The results show the following.
First, high-tech industry agglomeration has a significant positive impact on regional energy efficiency. From the analysis of the spatial Durbin model (SDM), it can be seen that high-tech industry agglomeration is conducive to the emergence of “escape competition”, which, combined with fierce competition and other factors, promotes the regional innovation level and promotes the improvement of regional energy efficiency.
Secondly, government intervention has a significant inhibitory effect on regional energy efficiency. Differently from previous studies on the impact of a single behavior such as a government policy on energy efficiency, this paper analyzed from the macro level, explored the impact of the overall degree of government intervention on energy efficiency and refuted studies that only relied on a single behavior to believe that government intervention will promote energy efficiency. From the analysis of the spatial Durbin model (SDM), it can be seen that government intervention will increase the R&D investment of enterprises, thus reducing the regional innovation level. In addition, the “race to the bottom” will intensify the appearance of negative externalities and, finally, inhibit the improvement of energy efficiency.
Thirdly, government intervention has a distorting effect on the impact of high-tech industry agglomeration on energy efficiency. Existing studies rarely discuss the relationship between government intervention and high-tech industry agglomeration. In this paper, government intervention was taken as the regulating variable of high-tech industry agglomeration on energy efficiency. From the analysis of the panel threshold model, it can be seen that high-tech industry agglomeration itself has a significant positive impact on energy efficiency, but when the threshold variable government intervention is introduced and the government intervention is greater than a certain degree, the positive impact of high-tech industry agglomeration on energy efficiency will fade and its positive effect will be distorted.
Fourth, both high-tech industrial agglomeration and energy efficiency have spatial spillover effects. From the spatial measurement results, thanks to the developed transportation and other factors, the spillover of knowledge and population is more convenient. Therefore, the improvement of the high-tech industry agglomeration level and energy efficiency in one province can radiate to neighboring provinces and drive the improvement of the energy efficiency in other provinces.
Fifthly, the impact of high-tech industry agglomeration on energy efficiency has significant spatial heterogeneity. Different from previous studies on spatial heterogeneity in the central, western and eastern regions, this paper divided China into southern and northern regions, further enriching the research in this field. From the analysis and effect deconstruction of the spatial Durbin model (SDM), it can be seen that although both the northern and southern regions had significant positive effects on the impact of high-tech industry agglomeration on energy efficiency, from the perspective of the total effect, the high-tech industry agglomeration in the northern region had a more significant impact on energy efficiency.
8. Policy Suggestions
In order to achieve the goal of improving energy efficiency and effectively solving the contradiction between economic development and environmental protection, the research conclusions are put into practice. Based on the above conclusions, this paper puts forward the following policy suggestions.
8.1. Improve the System and Focus on "Voting with Your Feet"
It is suggested to improve the performance appraisal system and promotion system, adding “resident voting” as one of the assessments. In China, local governments hold office for a short period of time and are appointed by the central government, which is also responsible for assessment and promotion. Their power comes from the central government, and they are mainly responsible to the central government. This is the key reason why the government is more willing to take short-term economic actions and pour resources into traditional high-energy industries with short cycles, which can make the short-term regional economy grow. According to the above study, for the government, such government intervention can inhibit regional energy efficiency improvement by inducing a “race to the bottom”. Therefore, by increasing the “residents’ vote”, the above issues could be solved. Residents “vote with their feet” and prefer areas with a fine ecological and environmental quality, which requires the local to conduct industry upgrading and green development. To achieve this goal, the government has to pay more attention to the long-term development so that improved performance appraisal systems would greatly reduce the likelihood of a “race to the bottom” being triggered to improve the problem.
8.2. Optimize Expenditure and Improve Bias
It is suggested to improve the structure of government spending and correct local governments’ bias toward energy-intensive industries with short cycles and quick results in terms of fiscal spending and resource allocation. According to this study, for enterprises, government intervention will inhibit the improvement of regional energy efficiency by increasing investment in R&D. At present, China’s local government fiscal expenditure and resource allocation are obviously tilting to the short-cycle, quick-gain energy-intensive industries, which not only makes traditional energy-intensive industries occupy the dominant position in the market with the aid of path dependence for a long time, but because of the lack of innovation power, green innovation enterprises’ market share is also squeezed, as well as the an increased corporate investment in the development of green and innovative technologies. The enterprises, in order to survive, are forced to reduce R&D of green innovation technology. Therefore, the optimization of the fiscal expenditure structure and the provision of the minimum amount of expenditure and resource allocation for green innovative enterprises can not only ensure the survival of enterprises with funds and encourage green innovative enterprises to actively research and develop, but also bring a sense of crisis to the traditional energy-intensive industries and force related enterprises to reform and upgrade.
8.3. Support Green Enterprises and Give Subsidies
Special subsidies should be given to green development enterprises and major awards should be given to those that have made achievements to promote industrial agglomeration. Financial subsidies can improve regional industrial agglomeration, which can improve regional innovation ability through the effect mechanism of “evasive competition” and, finally, improve energy efficiency. In addition, considering the spatial spillover effects of government intervention, the move can also siphon enterprises in surrounding areas, attracting high-quality enterprises from the surrounding areas to this province. This would bring pressure to other provincial governments from the side and force them to take economic actions such as subsidies to optimize fiscal expenditure, leading to more newcomers for the industry. At the same time, creating a major award for successful enterprises can not only stimulate the green innovation vitality of an enterprise, but could also select a “leader” in this area, leading other enterprises to put more power into exploration and innovation under fierce competition, thus improving the regional innovation ability in terms of science and energy efficiency.
8.4. Increase the Flow of Factors of Production and Enhance Cooperation
The two-way flow of factors among provinces should be promoted and active cooperation among enterprises should be encouraged. From the above research, energy efficiency, industrial agglomeration and government intervention have a spatial spillover effect; therefore, the provincial science and technology level or energy efficiency would drive the regional science and technology level or the improvement of energy efficiency, and the spillover effect via a developed transportation network, the internet and government support among elements such as implementation. Therefore, the government, by encouraging enterprises to cooperate and by removing barriers to the flow of populations and other factors, can allow for greater spatial spillover of the energy efficiency, thereby avoiding the “Matthew effect” and enabling regions with high energy efficiency to drive regions with low energy efficiency to achieve common development.
9. Marginal Contribution and Insufficient Research
The marginal contribution of this paper is mainly in three aspects: first, it matches the relevant data of 30 provinces, municipalities directly under the central government and autonomous regions (except Tibet) in mainland China from 2007 to 2019, and the panel data span 13 years and are accurate at the provincial level; second, it redefines the measurement standard of government intervention, where in this process the expansion and contraction of fiscal policy are included in the investigation of government intervention; third, high-tech industrial technology agglomeration, government intervention and regional energy efficiency were included in the unified model for the first time to analyze and test, and the mutual relationship and action mechanism among them were discussed.
In addition, due to the limitations of the data and the complexity of the operation, this paper still has the following shortcomings: first, the data were not accurate at the city level; second, the hypothesis of this paper was mainly based on previous research and theory, without using mathematical tools such as big data analysis; third, the econometric analysis in this paper was mainly based on the spatial econometric model, without using the neural network model and other more convincing models. Although this paper demonstrates in detail the scientific nature of model selection, a neural network model is more convincing in comparison. As a nonlinear fitting model without presetting functions, it can better fit the relationship between explanatory variables and explained variables, reduce the errors between predicted values and observed values and improve the accuracy of the model. Therefore, after this, the authors can further collect data at the city level and use mathematical tools such as big data analysis and neural network models to conduct in-depth research on the subject. After further exploration, this project can provide more scientific and accurate suggestions for China to improve regional energy efficiency and also help China to solve the contradiction between economic development and environmental protection as soon as possible.


