Article

An Introduction to Nuclear Industrial Archaeology

1
Interface Analysis Centre, H.H. Wills Physics Laboratory, University of Bristol, Bristol BS8 1TL, UK
2
National Nuclear Laboratory, Risley, Warrington WA3 6AE, UK
3
Atomic Weapons Establishment, Aldermaston, Reading RG7 4PR, UK
*
Author to whom correspondence should be addressed.
Sustainability 2023, 15(7), 6178; https://doi.org/10.3390/su15076178
Submission received: 20 January 2023 / Revised: 11 February 2023 / Accepted: 9 March 2023 / Published: 4 April 2023
(This article belongs to the Special Issue Nuclear Waste Management and Sustainability)

Abstract

:
The legacy of the early days of the Atomic Age consists of many problematic sites worldwide, including radioactive waste dumps, uranium mines, spent fuel reprocessing plants, and defunct processing and enrichment plants. Although nature quickly reclaims abandoned sites, any remaining radioisotopes can pose a threat for millennia to come, long after the benefits gained from nuclear technology have faded. The field of nuclear industrial archaeology specialises in finding and characterising these sites to support local communities and site owners. Where maps and building plans have been lost, nuclear archaeologists deploy state-of-the-art analysis techniques on the ground to unravel the current state of legacy sites, and quantify the remaining radioactive inventories to the standard required by the nation the site is located within. The objectives of nuclear industrial archaeology are varied and site dependent. Whether the objective is to puzzle the forgotten history of activity back together or safeguard and recover dangerous radioactive materials, nuclear industrial archaeology adapts radioanalytical laboratory and site-surveying techniques in order to understand the site and allow scientists to communicate this information to support remediation efforts. This paper discusses current methodologies alongside a case study.

1. Introduction

Nuclear forensics (NF) is the analysis of radioactive and other nuclear material in support of governmental priorities including national security [1,2]. Although NF work has been ongoing within the radioanalytical realm since World War II, modern nuclear forensics as a field of activity coalesced in earnest when several large finds of fissile materials were seized by law enforcement across Europe [3,4]. These discoveries created a subsequent need to formalise the assessment of the radiological hazard, intended use, and origin of the material, necessitating the development of a tailored suite of measurements, techniques and databases to store the details of each declared incident [5]. In the three decades since the first high profile seizure of a uranium fuel pellet outside of regulatory control, several countries have developed their forensic capabilities, dedicated facilities and specific programs for dealing with threats should they appear within or escape their borders.
The Incident and Trafficking Database (ITDB), maintained by the International Atomic Energy Agency (IAEA) since 1995 [6], serves as a nonpartisan record, increasing the ability of governments to track, find, and provenance nuclear materials that have been smuggled, lost, improperly disposed of, or stolen. It is a database that is voluntarily maintained by member governments, with over 3500 incidents recorded within it as of 2022. Approximately 10% of these have been confirmed as “acts related to trafficking or malicious use” [6]. Incidents reported to the ITDB involve radioactive materials such as uranium, plutonium, and thorium, as well as naturally occurring and artificially produced radioisotopes, and radioactively contaminated material.
In the last three decades, NF has expanded from subdisciplines of radiochemistry and geochemistry to a field in its own right, giving rise to numerous experimental techniques, methodologies, and microfields [7]. The methods that nuclear forensics encompasses are broad and varied, ranging from field-based instruments such as portable X-ray fluorescence spectroscopy (pXRF) and Geiger–Müller (GM) counters to specialised lab-based methodologies, including inductively coupled plasma mass spectrometry (ICP-MS) and radiochronometry [7]. These techniques do not only apply to forensic questions, however— they are also used in cases where no crime has been committed and where instead the investigatory focus is on other aspects, including process reconstruction, legacy waste analysis, medical/industrial radiation sources, releases from civilian nuclear reactors, accident investigation, or decommissioning and clean-up of legacy nuclear facilities.
Nuclear forensics is iterative, following the requirements of law enforcement, and accomplishes only the agreed-upon analytical plan to provide the necessary data aiming to answer a defined question [8]. All results are produced by using methods verified and approved within a legally recognised quality framework [9,10]. However, an investigation of historical radiological material is structured differently from a forensic investigation; scientists and prosecutors can have different requirements ranging from the chain of custody reporting requirements to the level of certainty required. “Nuclear forensics” is an incorrect designation unless there is a prosecutorial element. The phrase “forensic investigation” is more than a misnomer; it can be actively damaging to the overall aims of the scientists involved. Open and honest discussions about radiological holdings and clean-up efforts are hindered if the threat of prosecution is assumed [11]. Therefore, nuclear industrial archaeology (NIA) is a more accurate designation for the study of historical nuclear sites, free of many constraints placed on nuclear forensics [12]. Without an active crime scene and the need for findings to have confidence levels that would hold up in court, a more balanced view of the radiological material and the environment it is settled within can be taken. The more relaxed standards of accuracy and precision levels required can, in turn, inform future nuclear forensic investigations, allowing new techniques to enter the investigative process after extensive field and laboratory testing on low-risk, low time-pressured samples, although these results must still be accurate and defensible. Nuclear industrial archaeology, therefore, is also a developmental pipeline enabling the validation of novel scientific techniques before their adoption in NF.

2. Nuclear Industrial Archaeology

Definitions of nuclear forensics and nuclear archaeology have changed throughout history, with different authors adopting variations in scope and meaning depending on the context. Considerable overlap between definitions exists depending on the context. In the late 1970s and throughout the 1980s, the meaning of “nuclear archaeology” was almost identical to present-day “nuclear forensics”. Nuclear forensics is defined by the IAEA as
“…the analysis of intercepted illicit nuclear or radioactive material and any associated material to provide evidence for nuclear attribution. The goal of nuclear analysis is to identify forensic indicators in interdicted nuclear and radiological samples or the surrounding environment, e.g. the container or transport vehicle. These indicators arise from known relationships between material characteristics and process history. Thus, NF analysis includes the characterisation of the material and correlation with its production history.”
IAEA Nuclear Forensics Support Reference Manual, 2006 [13]. In this context, “analysis” includes radiometric and nonradiometric measurement techniques.
In common usage, nuclear forensics has been expanded to include any investigation of radiological material that uses techniques in common with a criminal investigation. This is seen in relevant paper titles and conference proceedings [14,15,16]. It is these authors’ opinion that this is a misnomer and that in scientific endeavours which do not include an element of law enforcement (especially where the aim is to support safe decommissioning and characterisation of legacy sites) any reference to “forensics” is undesirable. The more appropriate term is, “nuclear industrial archaeology”. This has parallels, interlinks, and joint interests with similar fields where investigations of legacy activities is relevant, such as industrial archaeology:
“The systematic study of structures and artefacts as a means of enlarging our understanding of the industrial past.”
Industrial Archaeology Principles and Practice [17] (p. 21)
The term “nuclear archaeology” itself has historically been associated with two different meanings. The earliest mention dates back to 1973 when radiocarbon dating became the main activity of the University of Missouri–Columbia (UMC) Laboratory for Nuclear Archaeology (LNA), and neutron activation analysis (NAA) gradually became a mainstream technique by which to analyse archaeological and palaeontological artefacts [18,19,20,21]. Afterward, “nuclear archaeology” was adopted in a deceiving nuclear forensics context, referring to the investigations related to dose rate estimations of atomic bomb survivors [22,23], and more frequently, efforts to estimate the amount of fissile materials produced or passed through reactors based on residual radiation signatures [24,25,26]. Neither meaning can be applied to the study of legacy installations and radioactive relics from the early nuclear era when the focus is on understanding and/or reconstructing processes in the nuclear industry regardless of law enforcement interests. Nuclear industrial archaeology (NIA) is thus defined as
“the systematic study of material evidence from the nuclear industrial past, with the aim to understand and reconstruct nuclear processes, record nuclear history, preserve nuclear heritage and/or facilitate containment, decontamination and decommissioning of hazardous nuclear industrial legacies.”
In this study, we use an investigation into a disused radiological processing site in Ukraine to demonstrate the key advantages of considering it as a nuclear industrial archaeology study, rather than a nuclear forensics case.

3. NIA Case Study: Pridnyprovsky Chemical Plant

Prydniprovsky Chemical Plant (PChP) is a large ex-Soviet materials and chemicals processing site of roughly 260 hectares in central Ukraine, on the outskirts of the city of Kamianske. Between 1948 and 1991 [27] (p. 217), the site processed uranium and thorium ore into ore concentrate, separated rare earth elements and produced other industrial chemicals such as fertiliser [28] and ion exchange resins [29]. Tens of millions of tonnes of radioactive waste were generated on the site during its operational lifetime. The site has fallen into disrepair but has no legal investigation into it. A NIA investigation therefore offers more potential to the site operators that a narrower NF investigation could not.
This industrial area comprises ∼100–200 buildings and structures, many of which are in a state of disrepair and dereliction. Approximately 45% of the southern part of the site has become radioactively contaminated as a direct consequence of the site’s operation, compounded by the lack of historic management of the resulting radioactive byproducts. Approximately 20 buildings are heavily contaminated with radiation levels up to a maximum of 4 mSv h 1 reported, which is equivalent to nearly twice the average annual dose received by members of the general public from natural sources in the UK, in one hour [30]. It is estimated that there are over 40 million tonnes of low-level radioactive waste stored in the site’s tailings ponds, which is evidenced to be slowly leaching into the Dnieper river [31].
As of 2022, the European Commission is working with the Ukraine Ministry of Energy and Coal Use and the Nuclear Regulator to improve radiological safety and security. For remediation works to proceed, site management needs a detailed characterisation of the radioactive materials held there. As part of this activity, a team from the University of Bristol surveyed several of the most heavily contaminated buildings, analysing a selection of in situ material samples.
The application of nondestructive characterisation methods field tested in and around the PChP buildings is explored below. It is the experience of these authors that in initial field surveys, less equipment and lower complexity of equipment allows more data to be collected. This is due to the reduced time spent carrying, testing, decontaminating, inventorying, and problem solving. There will always be a tradeoff in terms of the weight that operatives can carry and the amount of analytical equipment that can be carried. Equally, based on the limited carrying capacity, the toolkit for in situ investigations must be carefully planned and consider factors such as battery life, as well as mass of equipment and even the ease and cost of transportation in compliance with transport regulations.

4. Techniques

As in a traditional forensic investigation, preservation of life and, therefore, investigators’ safety is paramount during nuclear industrial archaeology [32]. Assessment of ionising radiation on a site must include alpha, beta, and gamma rays as well as neutrons. Irrespective of radiological detection methods used, users must understand their personal, equipment and project limits and capabilities to avoid a site being inadvertently declared safe for lack of accurate assessment for radiation. For example, it cannot be assumed that all site workers will have access to an alarmed dosimeter calibrated to the isotopes expected to be present. Although these reduce the risk of accidental exposure, they can also be prohibitively expensive for legacy site management with constrained budgets.
Radioactive compounds may also be chemically toxic in addition to their radiotoxicity, and for isotopes with half lives in excess of 1 million years (Ma), chemical toxicity can be more dangerous than the emitted radiation. The chemical toxicity of uranium is similar to other heavy metals [33], and equivalent protection measures must be taken.

4.1. Nondestructive vs. Destructive Analysis

Nondestructive, in-situ analysis techniques are key components of complex site investigations and have several advantages over destructive techniques. Notably, they allow samples to be analysed quickly and in a safe manner, minimising operator exposure. The most important drawback of destructive analysis techniques is that analyses cannot be repeated because parts of the sample, and particularly features of interest, are destroyed during the analysis process. This is true for traditional chemical analysis methods such as chromatography, which typically require sample fragments to be dissolved, but also for stand-off methods such as laser-induced breakdown spectroscopy (LIBS). In the specific case of LIBS, a high-power laser pulse is used to vaporise a sample and generate a light-emitting plasma, of which the spectral lines are subsequently analysed with a spectrometer. The U-associated emissions, for example, are then easily identified at 385.464 nm, 385.957 nm, and 386.592 nm respectively [34]. Because the amount of vaporised material and the resulting plasma wavefront is slightly different every time a LIBS analysis is conducted, the obtained data tend to drift. Firing the laser at the same location multiple times leads to cavitation of the sample, affecting plasma formation. If the sample is heterogeneous (for example, if it has a surface composition that is slightly different due to oxidation effects), then subsequent LIBS measurements will show varying results. This is because the first plasma will vaporise surface oxides whereas the following measurements reflect the composition of the now exposed interior of the sample. Analysis techniques destroying samples pose a challenge for scientific falsification. This scientific research principle dictates that peer reviewers must be able to replicate research results to independently verify the research data. It can also have consequences for forensic investigations if samples later turn out to have been criminal evidence [35] (pp. 455–456).
A third drawback of using destructive analysis methods is that, by definition, a part of the sample transforms into waste products. When analysing radioactive samples, this leads to radioactive waste products that must be disposed of, and such disposal process is regulatorily complex if the composition of the sample and its resulting waste is unknown. Radioactive waste produced during the destructive analysis of radioactive samples may also contaminate analysis instrumentation, increasing its background radiation signature, and further jeopardising repeatability of the analysis. In the case of wet chemical analysis, they are in the form of a radioactive effluent. LIBS, for example, can cause aerosolised radioactive particles found in the plasma to be dispersed over a wider area. This leads to possible contamination of the equipment and scientists performing in situ measurements, with radiologically contaminated PPE requiring additional remediation as a result. Nonetheless, techniques such as LIBS have been used for in situ nuclear industrial archaeology [36], but when the subject is related to radioactive contamination, such techniques can thus contribute to spreading contamination or causing cross-contamination.

4.2. Geiger–Müller Counting

Geiger–Müller (GM) counters are among the oldest radiation detectors available and remain useful in field-deployed nuclear industrial archaeology as the first line of intervention on site. GM counters can be fitted with probes sensitive to alpha [37], beta [38], gamma [39,40,41], positron [42], or a combination of those ionising radiation types [43]. GM counters have several advantages in comparison to more sophisticated scintillators or semiconductor detectors that can perform gamma energy spectrometry: they are low-cost [44], [45] (p. 103), can be tuned to different radiation types easily by fitting filters, and produce digital pulses that are processed electronically in a straightforward manner [46,47].
GM tubes are often wired straight to a buzzer, which produces characteristic ticks when ionising radiation strikes the tube. The ticking rate (per minute or second) is proportional to the number of detected events in a given period. It can also be calibrated over a known distance to allow for initial triaging of samples and areas. The instrument’s ease of use, simplicity, and resulting reliability make it a standard instrument in the nuclear industrial archaeology toolkit.
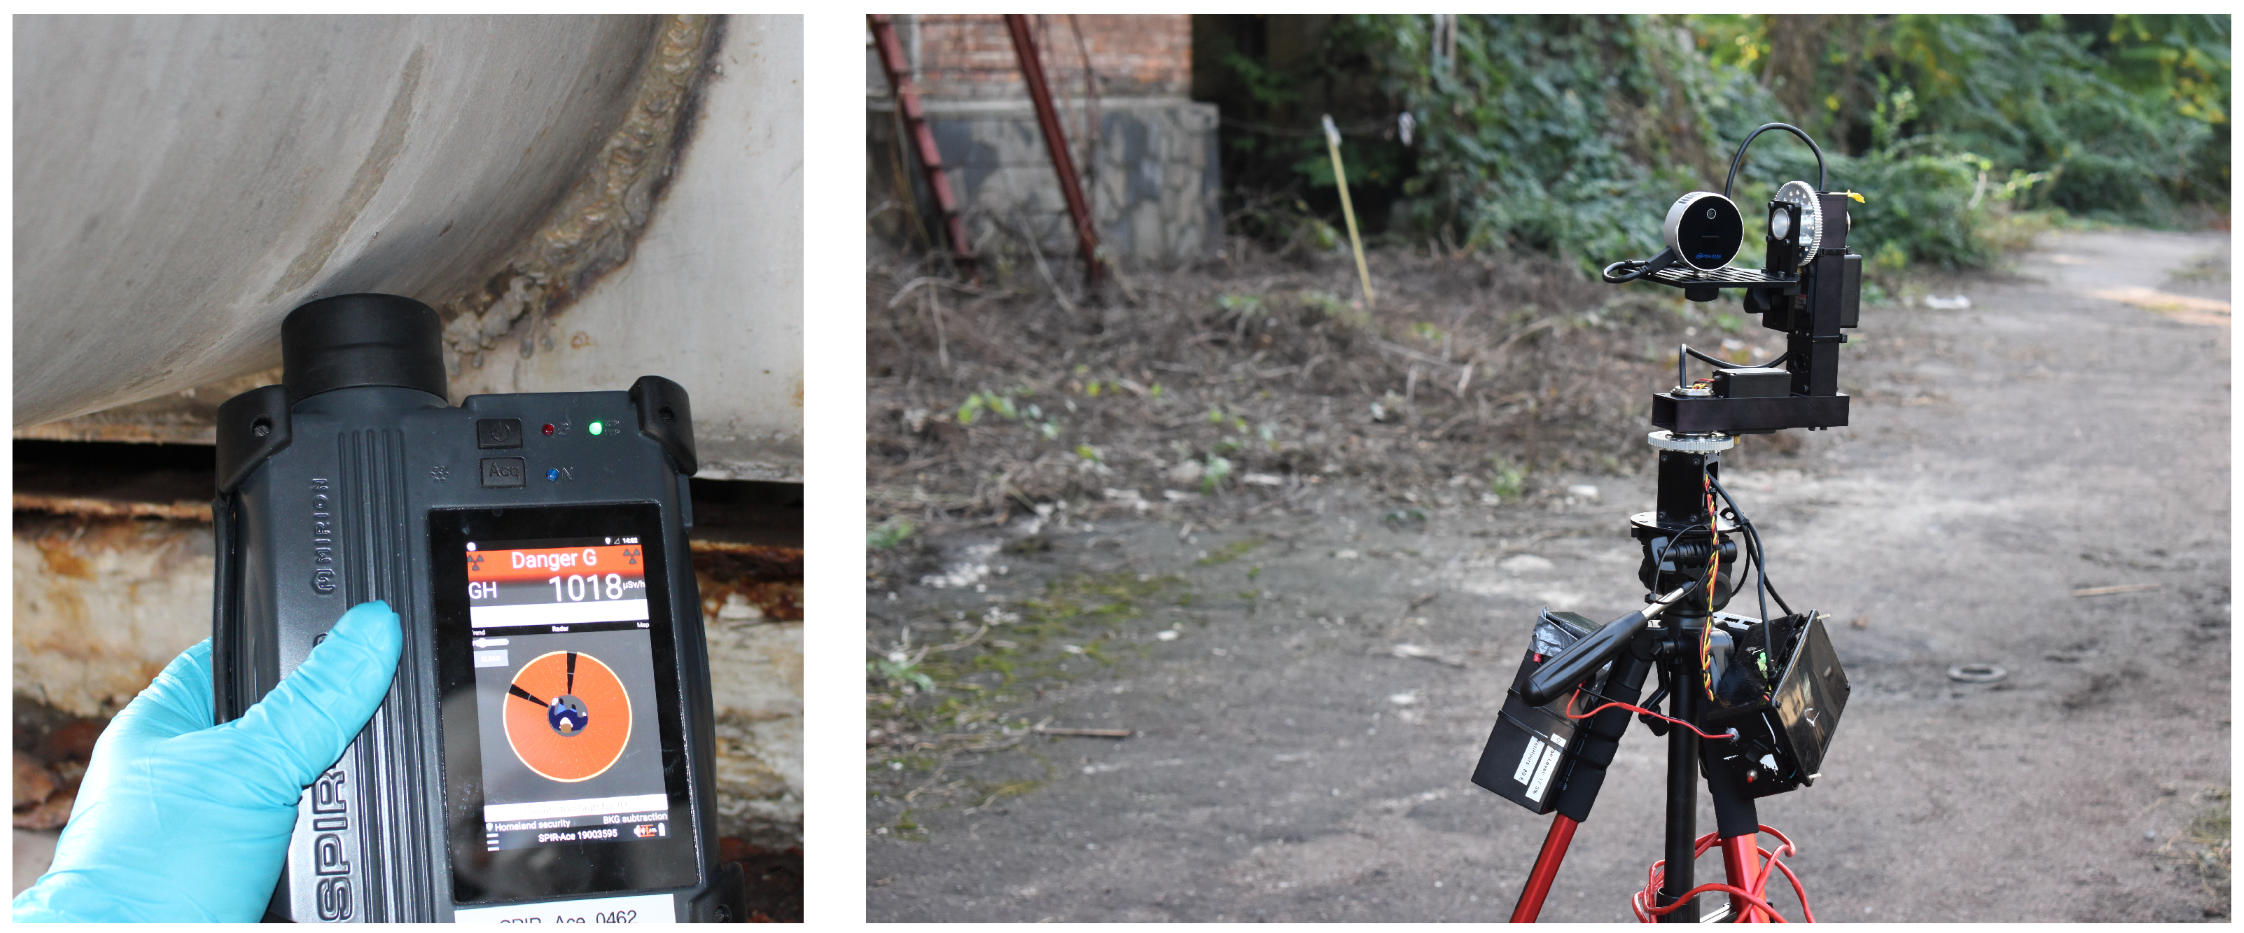
What makes a GM counter particularly useful in the field is the instant response of the tick rate, as opposed to analogue or digital displays, which make use of moving averages over a set period to calculate and display a count rate in counts per second (cps) or counts per minute (cpm). Because GM counters with a mica window are sensitive to α , β , and γ radiation and have such a fast response, they are the best method to track down the location of radioactive contamination of unknown origin. This is typically done by sweeping a pancake-type GM tube with a large window over a surface and listening to the tick rate. Using this method, a trained operator can quickly locate the source of ionising radiation. If the source is physically small, such as a single droplet of a solution containing a radioactive salt, a GM counter is often the fastest and most reliable way to track it down. An additional advantage is that operators do not need to look at a display or gauge to interpret measurements, which improves safety in the field in nuclear industrial archaeology environments such as disused industrial facilities that present numerous trip hazards.
GM counters also have two drawbacks. The first limitation is the inability of a tube to differentiate between α , β , or γ radiation. Any of these radiation types will trigger the electron cascade (the Geiger–Müller effect), and the resulting current pulse contains no information on the type of radiation or its energy. This can be partially mitigated by fitting different filters, exposing the tube either unfiltered ( α + β + γ ), through a thin Al window ( β + γ ), or through a thick Al window ( γ only) [48]. Some models have built-in filters, whereas others require different probes to be fitted. A second limitation of GM tubes is the low density of their fill gas, which makes them more sensitive to α and β radiation than to γ radiation, of which most passes through the tube without significant attenuation, especially at energies above 100 k e V . However, this is rarely an issue in practice because pure γ -emitters are of synthetic origin and usually sufficiently concentrated to produce detectable changes in tick rates even at low concentrations and short distances.
Because GM counters are low-cost, compact, and lightweight, they should be among the first instruments deployed in an unknown field environment to assess the radiological situation. First and foremost, they are used to establish whether there is a radiological anomaly present—that is, whether the area of interest shows count rates that are significantly above natural background levels. Secondly, if ionising radiation is detected, it should be used to qualitatively assess the radiation levels in preparation for further field nuclear industrial archaeology analysis. This takes advantage of the fast impulse response and relative directionality of the sensor to measure whether radiation levels are low enough to accommodate safe further inspections or too high (thereby putting operators at risk). For most instruments, the saturation limit—the point at which subsequent pulses overlap—is between 2 × 10 3 10 × 10 3 cps. As a general rule of thumb, if the GM counter saturates during the survey, radiation levels are potentially hazardous, and the survey should be aborted as a precaution. In such cases, a robot may need to be deployed instead.
The efficiency and speed with which GM counters can help locate radiation sources in the field means that further analysis methods can be deployed more quickly and effectively (at specific points of interest rather than needlessly sampling large areas). The resulting reduction in time required to perform analyses also reduces the radiation dose of workers.
A consequence of the inability of GM counters to differentiate between ionising radiation types or their respective energies is that personal electronic dosimeters (PED), which are often based on internal GM tubes, are intrinsically unable to measure actual dose rates. This is because the radiation dose is a function of radiation type and energy, neither of which the GM tube can measure [49]. PEDs are typically calibrated under the assumption of specific isotopic composition (such as 137Cs or 90Sr in a nuclear power station environment), which leads to drastically different results when surveying a processing facility for naturally occurring radioactive materials (NORM), for example. If accurate dosimetry is desired, a gamma spectrometer must be used instead.
The final field utilisation of GM counters is during postdeployment decontamination. Regardless of how careful nuclear industrial archaeology field analysts are during their work, there is always a risk of contamination of protective equipment (PPE) or instrumentation. For overshoes, gloves, or hard hats, such contamination is even expected. GM counters are the ideal instrument for contamination assessments on personnel and equipment, facilitating targeted decontamination if needed.

4.3. Gamma Spectroscopy

Gamma spectroscopy, the identification and quantitative study of the energy spectra of radioisotopes that emit γ -rays, is a rapid and nondestructive standoff measurement technique that has been used and developed since Rutherford and Andrade’s work on emission lines in 1914 [50].
Portable gamma spectrometers are comparatively less accurate and precise than laboratory detectors such as high purity germanium (HPGe), but as they are small and portable, they are beneficial for in-field analysis. Even where sample geometries are unknown, reliable conclusions can be drawn about which gamma-emitting isotopes are present, which can inform further decommissioning work and allow a more detailed assessment of radiological risk for site workers than that offered by GM counters. This is especially useful for uncategorised loose radioactive debris and sealed tanks, both of which prevent significant issues for analysis. Micro gamma spectrometers can easily be mounted onto a probe or telescopic boom, allowing analysts to maintain a safe distance from unknown samples, or deployed on a mobile robotic platform [51]. Gamma spectrometers require careful calibration before field applications to ensure that isotopic peak assignments are reliably made. Examples of gamma spectrometers deployed in the field are shown in Figure 1.
Gamma spectrometry is an important tool in the initial phases of an investigation where identifying the nuclides present is of paramount importance. Some radionuclides present a more substantial toxicological risk than radiological; hence, a device that can discern nuclides is of key importance.

4.4. X-ray Fluorescence

X-rays are well suited to probe the composition of matter because they can penetrate the surface of a sample to a depth inversely proportional to the density of that sample. The most popular analysis methods using X-rays are X-ray diffraction (XRD) and X-ray fluorescence (XRF). Both are available in a portable form for in-situ (handheld) analysis: portable XRF analysers are in use to determine alloy compositions in metal recycling industry, and portable XRD analysers are in use for metal alloy phase identification in junkyards. Combined XRD/XRF instruments have been developed for space missions, such as the CheMin instrument onboard the Curiosity Mars rover [54,55]. XRF gives information on the sample’s elemental composition and is the most simple of the X-ray analysis techniques.
For analysis of samples in nuclear industrial archaeology applications, XRF as an analysis technique works well for samples containing heavy elements because these elements have electrons in high-energy orbits, which thus produce high-energy fluorescence. Light elements (LE; H to Na) have loosely bound electrons and give rise to high Compton scattering rather than fluorescence. The fluorescence effect is maximal when the incident X-rays are only marginally higher in energy than the electron’s binding energy. If the photons have an energy that is too high, there is a higher chance of scattering than fluorescence. Likewise, if the photons have an energy that is under the binding energy, electrons cannot be ejected, and no fluorescence can occur. Because binding energy is a function of the electron shell, and these, in turn, are a function of the number of electrons the atom has, the ideal X-ray excitation energy depends on the sample’s elemental composition. This is an essential consideration in the design of an XRF instrument. Even when fluorescence occurs in LE, the emitted secondary photons are of such low energy (in the order of a few eV) that they are either absorbed by the sample, the air, or the window of the spectrometer itself. The lightest identifiable element using XRF can vary from Be to Ti depending on spectrometer sensitivity. All heavier elements can be identified up to Am [56,57] in concentrations ranging from ppm to percentage levels, although noble gases are rarely calibrated for.
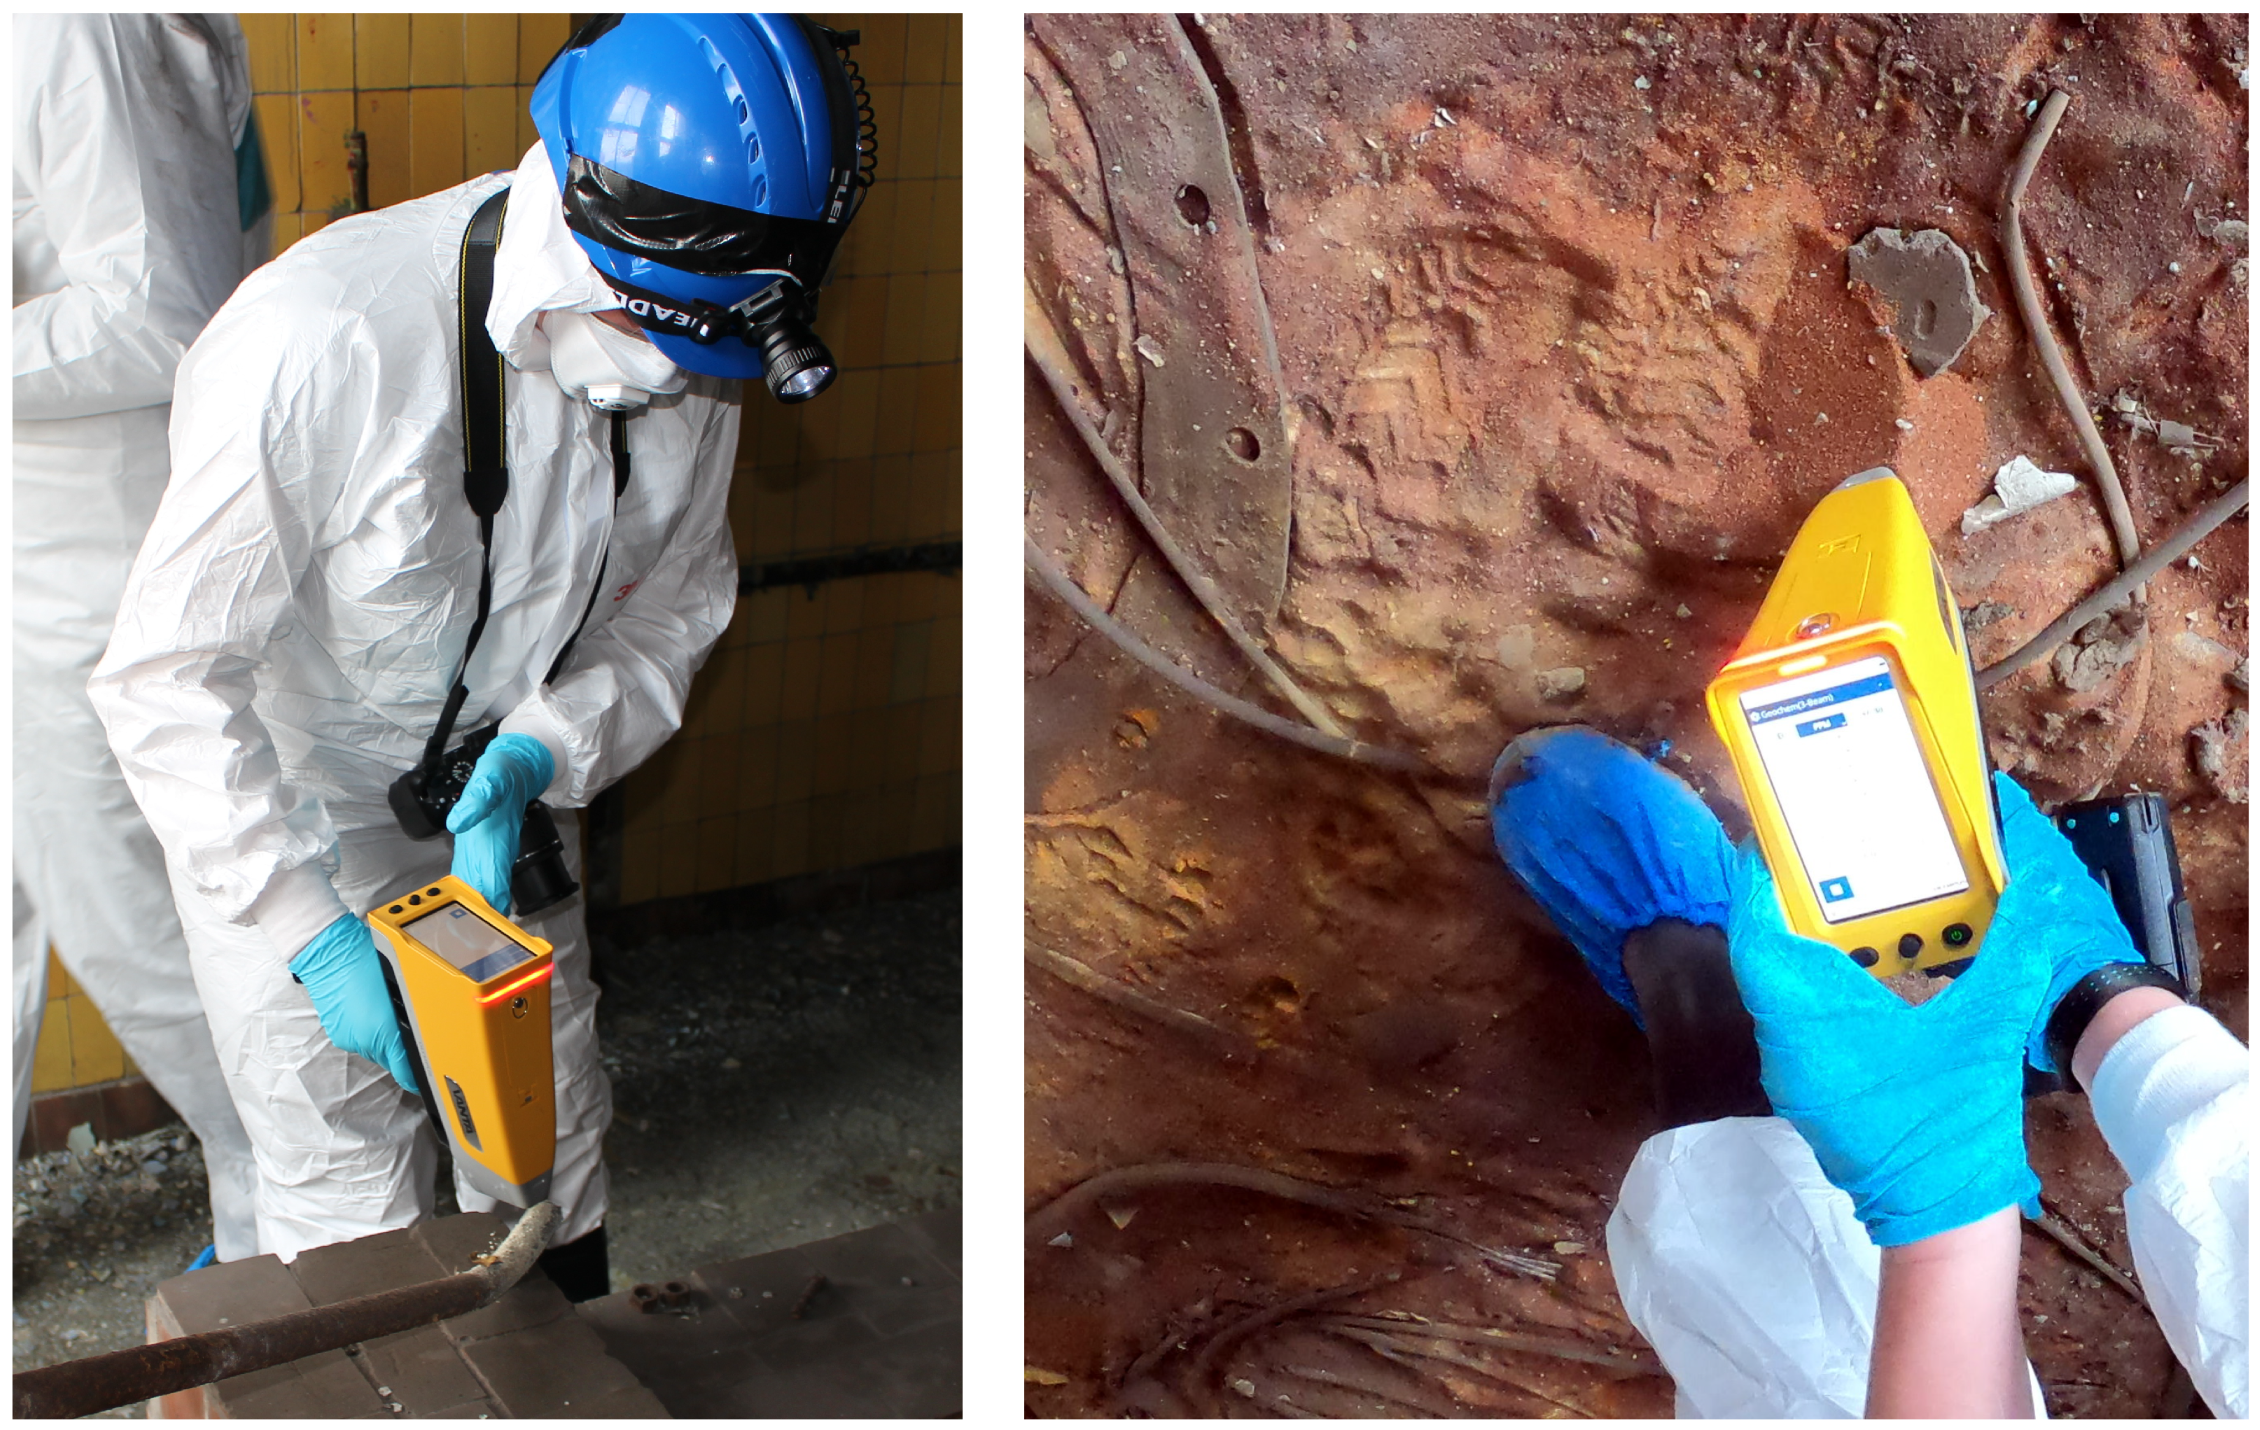
The capability of a pXRF to identify elemental presence from ppm to per cent concentrations makes it an attractive third nuclear industrial archaeology analysis tool in the field—after gamma spectroscopy and GM-counting. Depending on configuration and energy range, the preliminary elemental composition can be obtained after a few seconds, and quantitative analysis results after 1–3 min. Because operators can potentially accumulate a substantial and potentially harmful radiation dose in 1–3 min if the radiation flux is high enough, a preliminary sweep with other dosimetry, such as a GM counter, is a necessary first step to ensure dose rates are sufficiently low to allow further investigation. Handheld instruments such as the Olympus Vanta XRF or ThermoScientific Niton XL3T XRF are sealed instruments with an IP rating of 54 or higher, making them resistant to dust ingress and splashing liquids from all directions. This enables their use within contaminated environments with high dust or humidity levels. The Olympus Vanta XRF used in this study weighs 1.70 kg with battery installed and can be operated with one hand by an operator, as shown in Figure 2. Miniature X-ray tubes mean these instruments no longer contain radioisotopes such as 55Fe, 109Cd, or 241Am like their predecessors [58] (p. 94), [59]. Therefore, the produced excitation beam is an order of magnitude higher, reducing the time needed for analysis by an order of magnitude, but reducing the residual dose to 0 when the instrument is turned off. During operation, the dose is quite substantial, at ca. 18.5   mGy h 1 at 10 cm from the aperture, as opposed to only 267 μ Gy h 1 for the TN 9000 XRF analyzer from 1995 [58] (p. 94). The relatively high dose rate is accompanied by numerous safety features, such as a password-protected user interface, X-ray ON lights, proximity sensors, quick battery release, and dead man switch [58] (p. 95). The X-ray tube itself is capped in power to 4 W [60] (p. 2).
As in-situ measurements typically do not require sample preparation, there is no setup time needed before NIA measurements can commence. There are, however, several limitations. First, the fluorescence effect peaks at excitation energies slightly higher than electron binding energy levels. If the X-ray energy is either too high or too low, Compton or Rayleigh scattering are the dominant interaction modes for the X-rays [61]. In the case of Compton scattering, a lower energy X-ray will be scattered into the detector, and in the case of Rayleigh scattering, the scattered X-ray will have identical energy. These produce additional counts in the detector, swamping weak signals and lowering measurement results. If the density of the sample is unknown, or the sample contains both high- and low-density fractions, it is necessary to sweep the X-ray source between ca. 8 k e V and 50 k e V to enhance the measurement accuracy over a range of material densities.
Secondly, as the penetration power of the source X-rays is proportional to their energy and the sample’s composition, acquiring accurate data from in situ measurements requires samples of sufficient thickness to either absorb, fluoresce, or scatter the source X-rays completely. The minimum sample thickness to produce homogeneous results ranges from 55 μ m for solid Pb to 0.9   cm for sand [61] (p. 16, Table 1). When samples are insufficiently thick or heterogeneous in depth in comparison to the materials with which the instrument has been calibrated, the elemental composition reported by the instrument will be inaccurate. When measuring samples of insufficient thickness on a substrate, the elemental composition of the substrate will also be included in the measurement results, which is a drawback to the technique. This is inevitable for in situ measurements of crusts or oxidation on pipes or tanks, or thin layers of spilt substances in solid or liquid form. There are two ways around this issue that use postprocessing of data. One option is to measure the sample on its substrate or matrix, then measure the “clean” substrate or matrix separately and subtract them from each other. Doing so invalidates concentration data but allows for quick identification of foreign elements on common industrial surfaces such as 304L or 316L stainless steel [62]. The drawback is those sample elements present (including a variety of application-specific trace elements) in stainless steel are also removed. Another option is to measure samples on different substrates or matrix materials and use subtraction to find the elements both datasets have in common. The drawbacks of this method are identical.
As EDXRF instruments cannot detect LE, a way around the substrate problem is by measuring samples on a substrate that exclusively contains LE. An example of these is disposable cardboard plates or scoops, which can retain a small amount of material for analysis. As neither cardboard nor air induces X-ray fluorescence, measurements made this way will only show the sample’s elemental composition. Alternatively, Kapton tape [57], or mylar pouches and carry-straps can also be used [60]. The practical feasibility of each approach depends on the type of material and its specific activity. Tools such as files, paint knives, or scalpels may be needed to scrape off a small amount of material onto a cardboard holder for analysis.
Thirdly, a consequence of analysing radioactive materials that undergo alpha decay is that X-rays produced due to the alpha decay process can interfere with the EDXRF measurements. For isotopes undergoing gamma decay, this is usually not a problem because the gamma energies are beyond those of X-rays (over 100 k e V ). However, for isotopes undergoing alpha decay, this may lead to a more complex spectrum and therefore complicate the interpretation of the measurement results [57]. For example, 239 Pu exhibits a prominent uranium L X-ray emission peak series as a result of alpha decay into 235 U. The 235 U daughter nucleus has a probability of being left in an unstable state, transferring excess energy to an electron through internal conversion. This could lead to the ejection of the electron, just like it would have been ejected by a higher-energy X-ray originating from the XRF analyser source [63]. The secondary X-rays emitted by higher shell electrons filling the vacancy are therefore indistinguishable, and the XRF detector would interpret the additional counts as higher concentrations of the corresponding elements in the sample. This is a problem for radioactive samples containing Pu and Am, such as nuclear industrial archaeology of radioisotope thermoelectric generators, for which XRF analysis cannot accurately determine the elemental composition in a sample. High-resolution gamma-ray spectroscopy (HRGS) is the preferred technique for studying actinides [64]. This also allows the use of coincidence methods to enhance the signal-to-noise ratio. This is discussed in further detail in the Gamma Spectroscopy techniques section above.
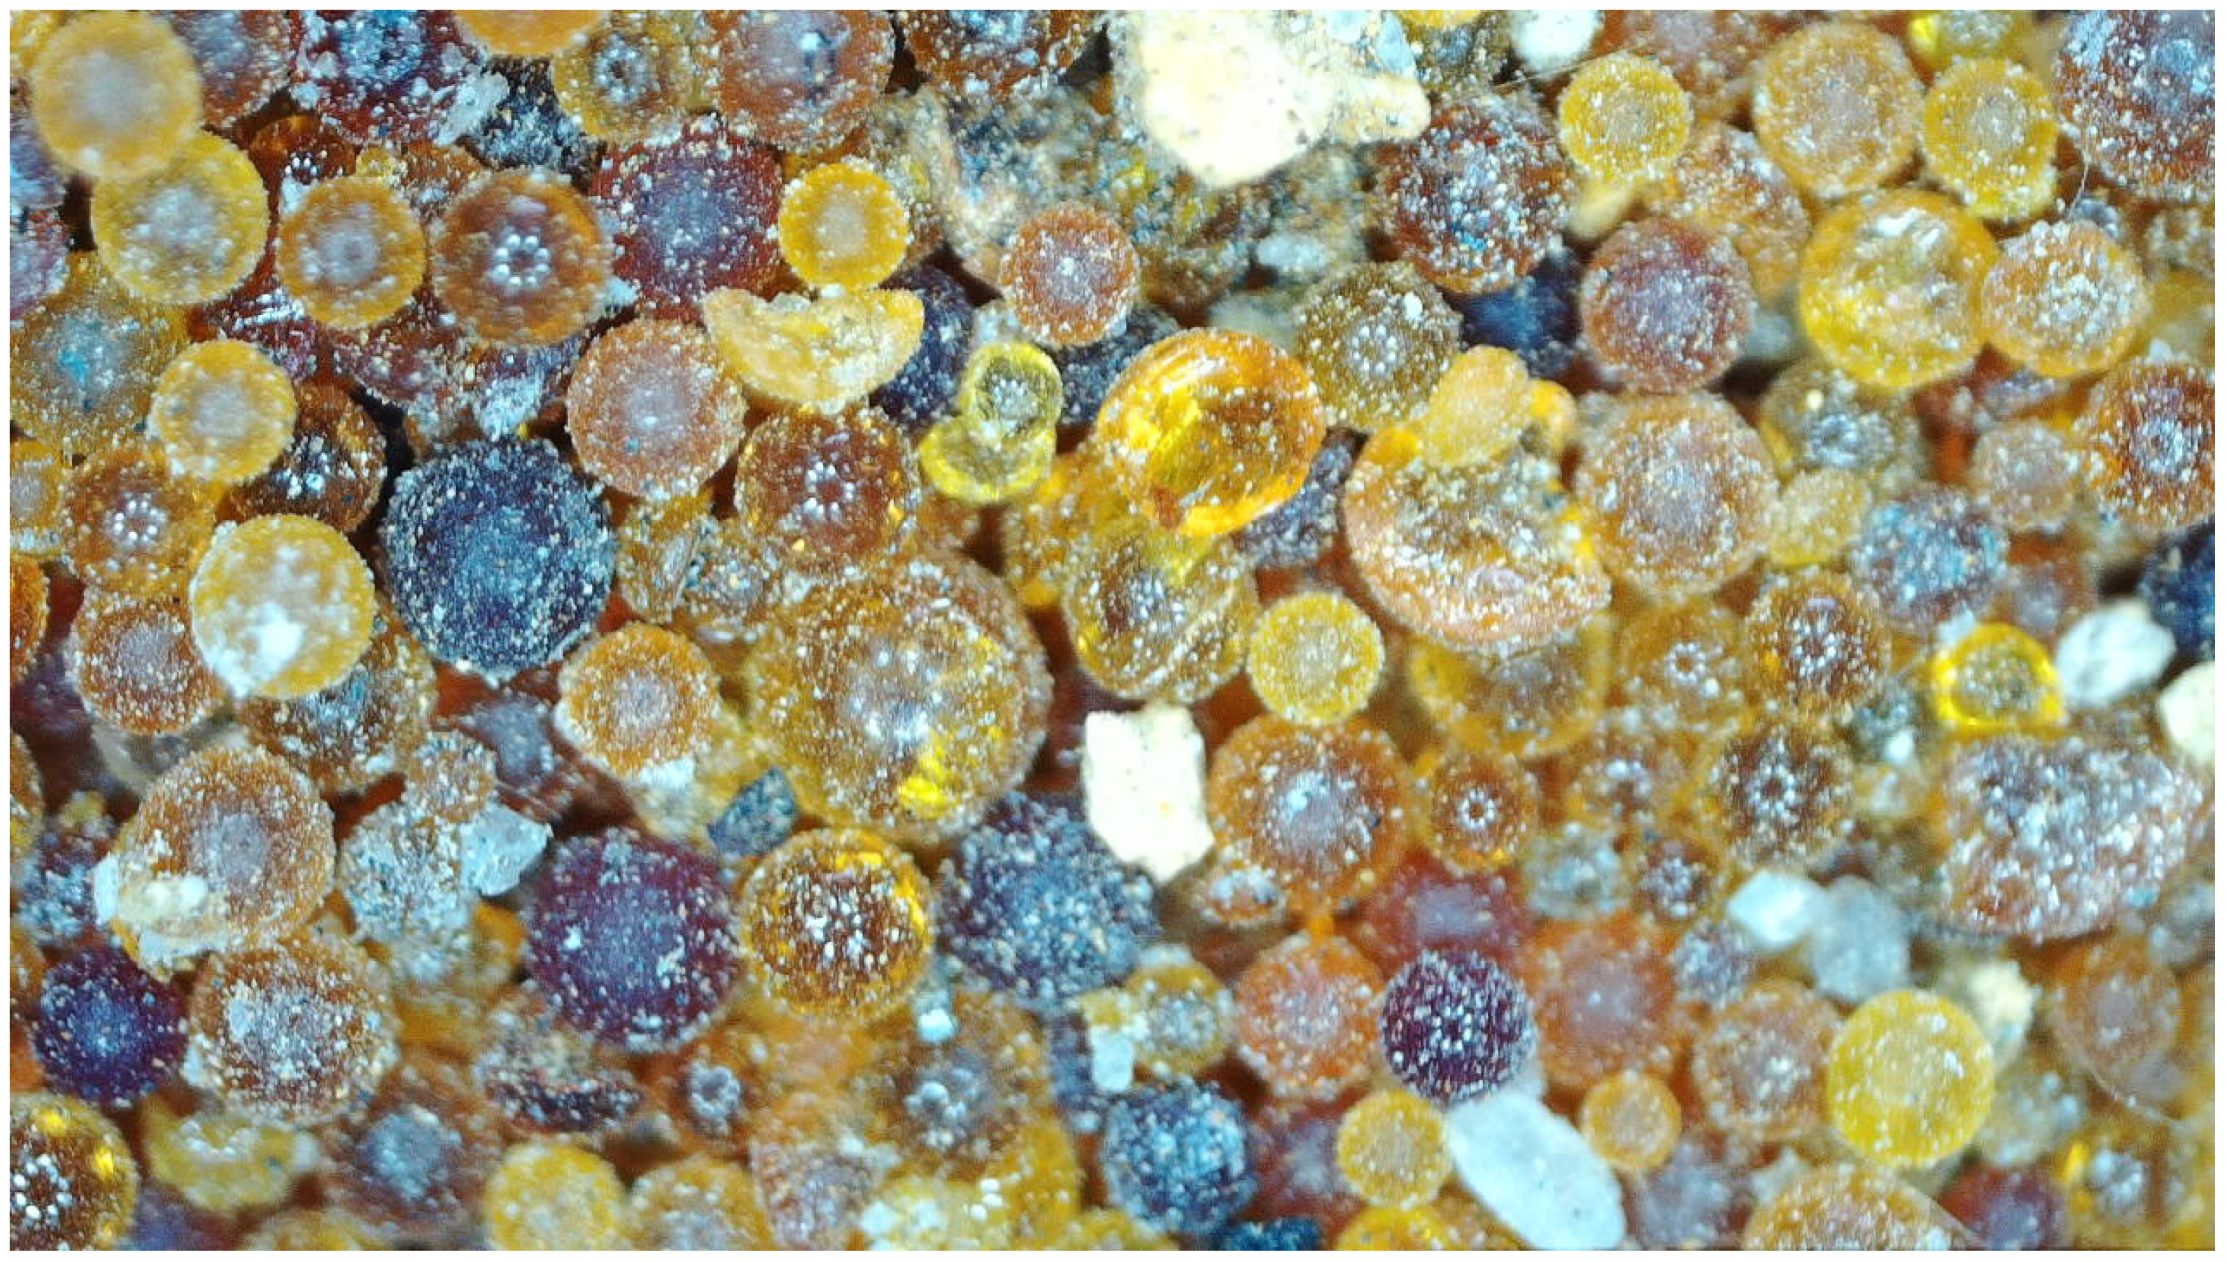
Finally, as portable XRF measurements for in situ nuclear industrial archaeology are made in the air rather than in vacuum or helium, absorption of low-energy fluorescence is inevitable, and elements with exclusively low electron binding energy can therefore not be measured. The XRF analyser instrument should ideally be brought in physical contact with the sample surface to eliminate as much air absorption as possible and, at the same time, maximise the detection of fluorescent X-rays. When measuring samples with both light and heavy elements, measurement results can be misleading. For example, an organic ionic exchange resin for separation of Th from REEs (shown in Figure 2) will typically be composed of over 95% resin, and only a few per cent heavy ions. However, because the XRF does not obtain a signal from the LE in the resin, it may falsely indicate disproportionally large concentrations of Th or REEs in such a sample. Some portable XRF analysers such as the Olympus Vanta mitigate this effect by comparing received X-ray intensity with emitted X-ray intensity, and assuming the difference is due to LE it cannot detect. In nuclear environments, it is not always possible or desirable to establish physical contact with a sample, as this could result in radiological contamination of the instrument itself. If prior GM-counter sweeps have established that a surface is contaminated with radioactive compounds or otherwise emitting ionising radiation, it is left to the operator’s judgement to decide whether or not physical contact with the sample is justified. Instruments such as the Olympus Vanta XRF have Kapton windows that can be replaced if they become contaminated, if necessary. The instrument is equipped with a proximity sensor that cuts off the X-ray beam if the aperture is further than 15 mm away from the sample. Standoff measurements take considerable practice from the operator to keep the instrument’s aperture suspended and steady for the measurement duration, which can be as long as 3 min.
Although it is possible to operate a portable XRF instrument as a single operator, it is instead advisable to opt for an operator pair instead for a nuclear deployment scenario. In such a team, one member can focus on identifying sample locations for in situ measurements or collecting samples on cardboard plates, whereas the other member can focus on performing the XRF measurements with the portable XRF analyser. To avoid contaminating the instrument, pouches are available to carry it hands-free. If a large number of samples are analysed, mounts are also available [65] (p. 4, Figure 1). It is possible to make up to 15–20 measurements per hour in handheld mode. A hard hat-mounted camera is recommended to facilitate documentation of the measurement conditions. Figure 2 is an example of a photograph made automatically with a GoPro Hero 8 camera mounted on a hard hat. The GoPro was configured in “photo” mode and set to take a photograph every 0.5   s .
Decontamination of the portable XRF analyser instrument is necessary between measurements in contact with samples. As XRF is a sensitive nuclear industrial archaeology technique, minor quantities of material in the order of a few grains of sand could result in the instrument falsely reporting elemental composition in the next sample due to contamination. Avoiding cross-contamination is therefore of extreme importance. The best way to avoid cross-contamination is to avoid physical contact with samples completely; if this is not possible or accidental contact was made with any surface, the instrument must be decontaminated meticulously. This can be done inside an active environment by wiping the instrument’s front with industrial wet wipes. Surfactants such as Decon-90 [66] may be used to remove more persistent contamination. After the survey, the portable XRF analyser must be inspected with a handheld GM counter for any residual contamination and decontaminated as deemed necessary.

4.5. Digital Optical Microscope

Although optical microscopy is one of the oldest experimental techniques, it is easily forgotten during investigations that have access to higher magnification and more advanced imaging instrumentation, such as scanning electron microscopes (SEMs). Even if it were possible to take a scanning electron microscope (SEM) into the field and get it to an appropriate level of vacuum, it would not be worth the effort to decontaminate it. However, digital microscopes for scientific applications are cheap, portable, and highly effective for field use. At a low cost, 200× magnification, 5+ megapixel digital microscopes designed for scientific use can be bought from commercial and scientific suppliers, with an example of a result captured in the field shown in Figure 3. Some come with a liquid crystal display (LCD), negating the need for laptops or external screens to be brought into the field. At this low price range, any microscopes that become contaminated or otherwise damaged during their duties can be disposed of with minimal loss.
Like photogrammetry, optical microscopy is not a resource-heavy technique. It requires minimal training, and micrometre calibration stages give images taken in the field precise and accurate measurements. Digital microscopes produce true-colour images, allowing a wide array of data to be taken in the field. These images can be quantitatively analysed in the lab postfieldwork, giving them broad scientific value beyond illustrative and metrological purposes [67].

Limitations of Optical Microscopy

Light conditions inside facilities (some of which have no electricity and therefore no built-in lighting, easily contaminated parts (especially lenses), the use of calibrated scale bars that can be bulky, requiring an LED screen or laptop into the area, are all limitations to the use of optical microscopes in the field.

4.6. Photogrammetric Survey

Photogrammetry is the trigonometric stitching together of photographs taken from one or multiple sources to recreate a 2D or 3D environment in digital form (coordinates and derived geometric elements) or graphical form (images, drawings and maps) [68]. Multiple research fields are involved, including optics, projective geometry and cloud computing.
One of the many benefits of photogrammetric models is that they allow 2D photo stills to be compiled into a 3D rendering, sometimes referred to as a digital twin, which enables researchers, workers, and other interested parties to easily visualise the layout and conditions within a contaminated building as a virtual walkthrough and without requiring PPE or exposure to a high radiation dose. It also allows precise measurements to be made of structures that would otherwise be difficult to reach or access. Anything that can be photographed can be rendered into a photogrammetric representation, from sand grains to landscapes.
Photogrammetry straddles the line between qualitative and quantitative data. Although its primary use is in recreating environments for users to explore safely, it can also determine some length measurements such as the height and width of infrastructure features such as tanks, furniture, and walkways. These are not as accurate as using a properly calibrated measurement tool but can be very helpful in obtaining approximate dimensions of internal and external structures. These digital twins, and the photographic records from which they are constructed, can be used to compare changes such as structural degradation, damage, and destabilisation over time in a quantifiable manner. They also enable the study of details which may have been missed in the field due to time constraints, poor lighting, or investigative priority decisions.
This has broad implications for inspection protocol and informed decision-making within hazardous facilities.

4.6.1. Analysis Principle

Image coordinates from n views, n exterior orientations, 3D coordinates, inner orientations of the camera, camera models, and other further observations such as measurements and pattern recognition all combine to produce a photogrammetric model.
Image coordinates define the locations of the object points’ images on the camera. The exterior orientation of a camera defines both its location in space and its view direction. The 3D coordinates define the locations of object points within the 3D space.
The inner orientation defines the geometric parameters of the imaging process. This is primarily the focal length and lens distortions.
These are especially seen in wide-angle lenses such as those used by consumer-grade “action cameras”, used commonly in the field due to their rugged build and ease of use, but every camera lens will have flaws.
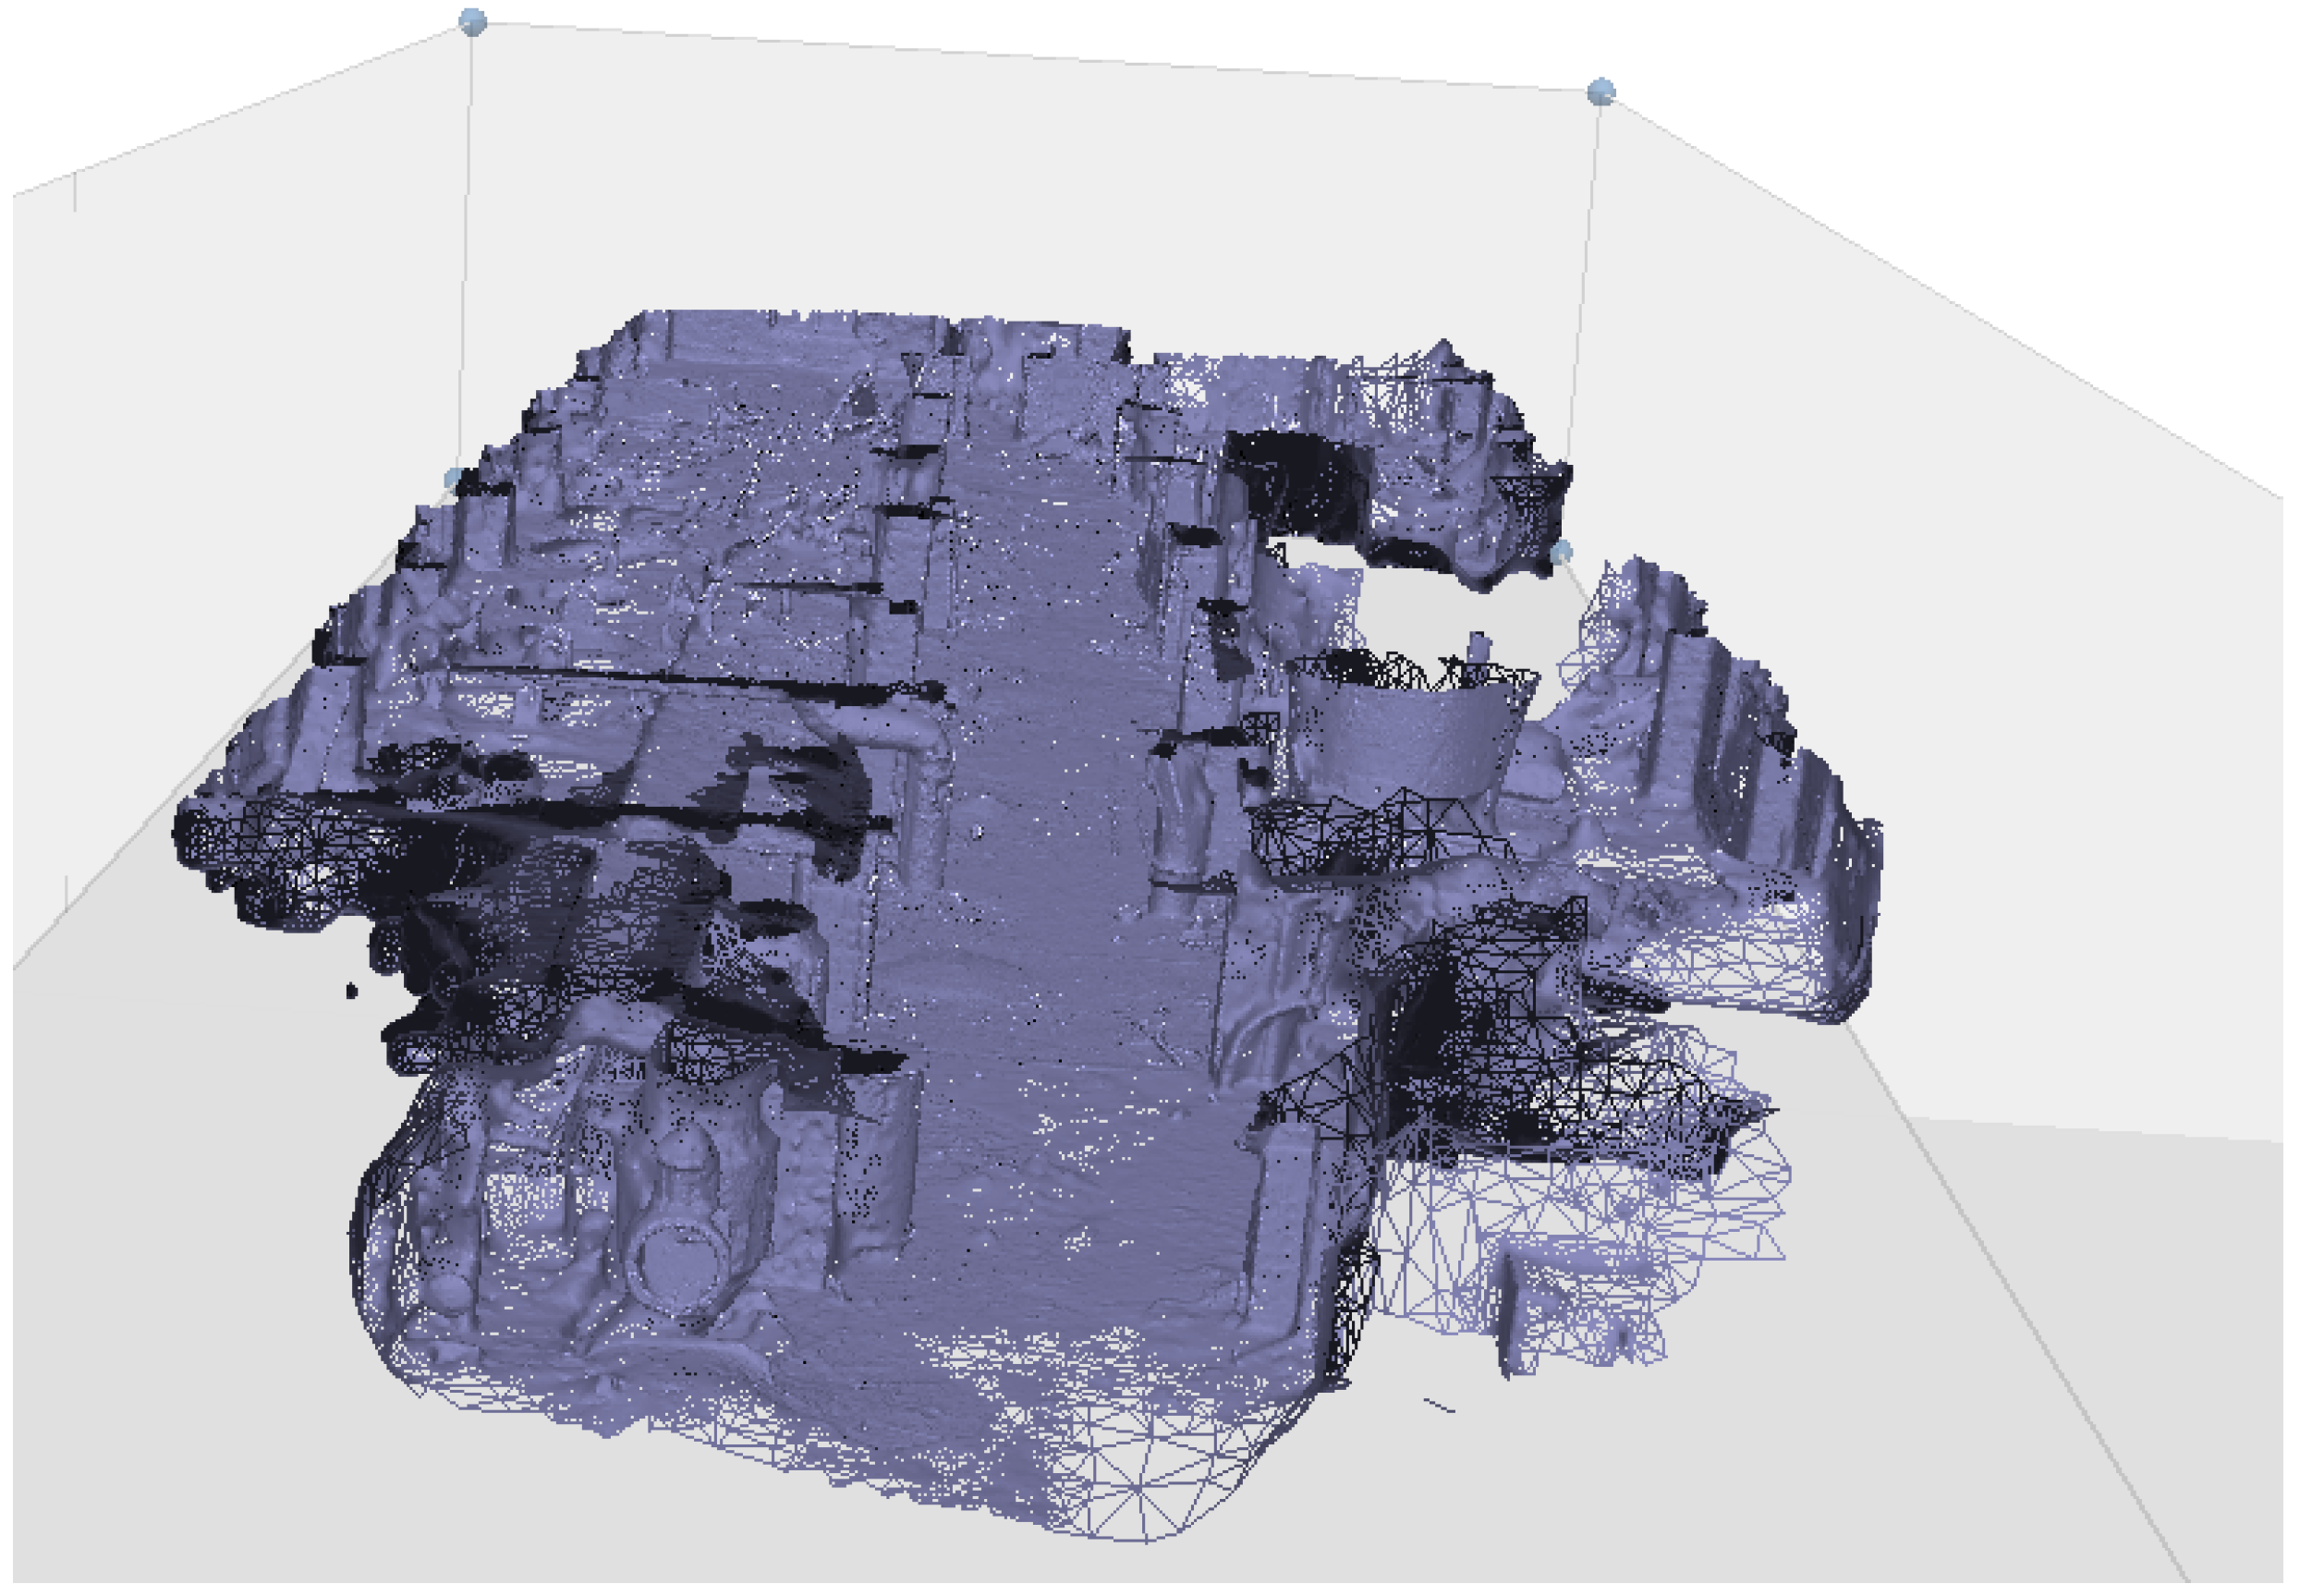
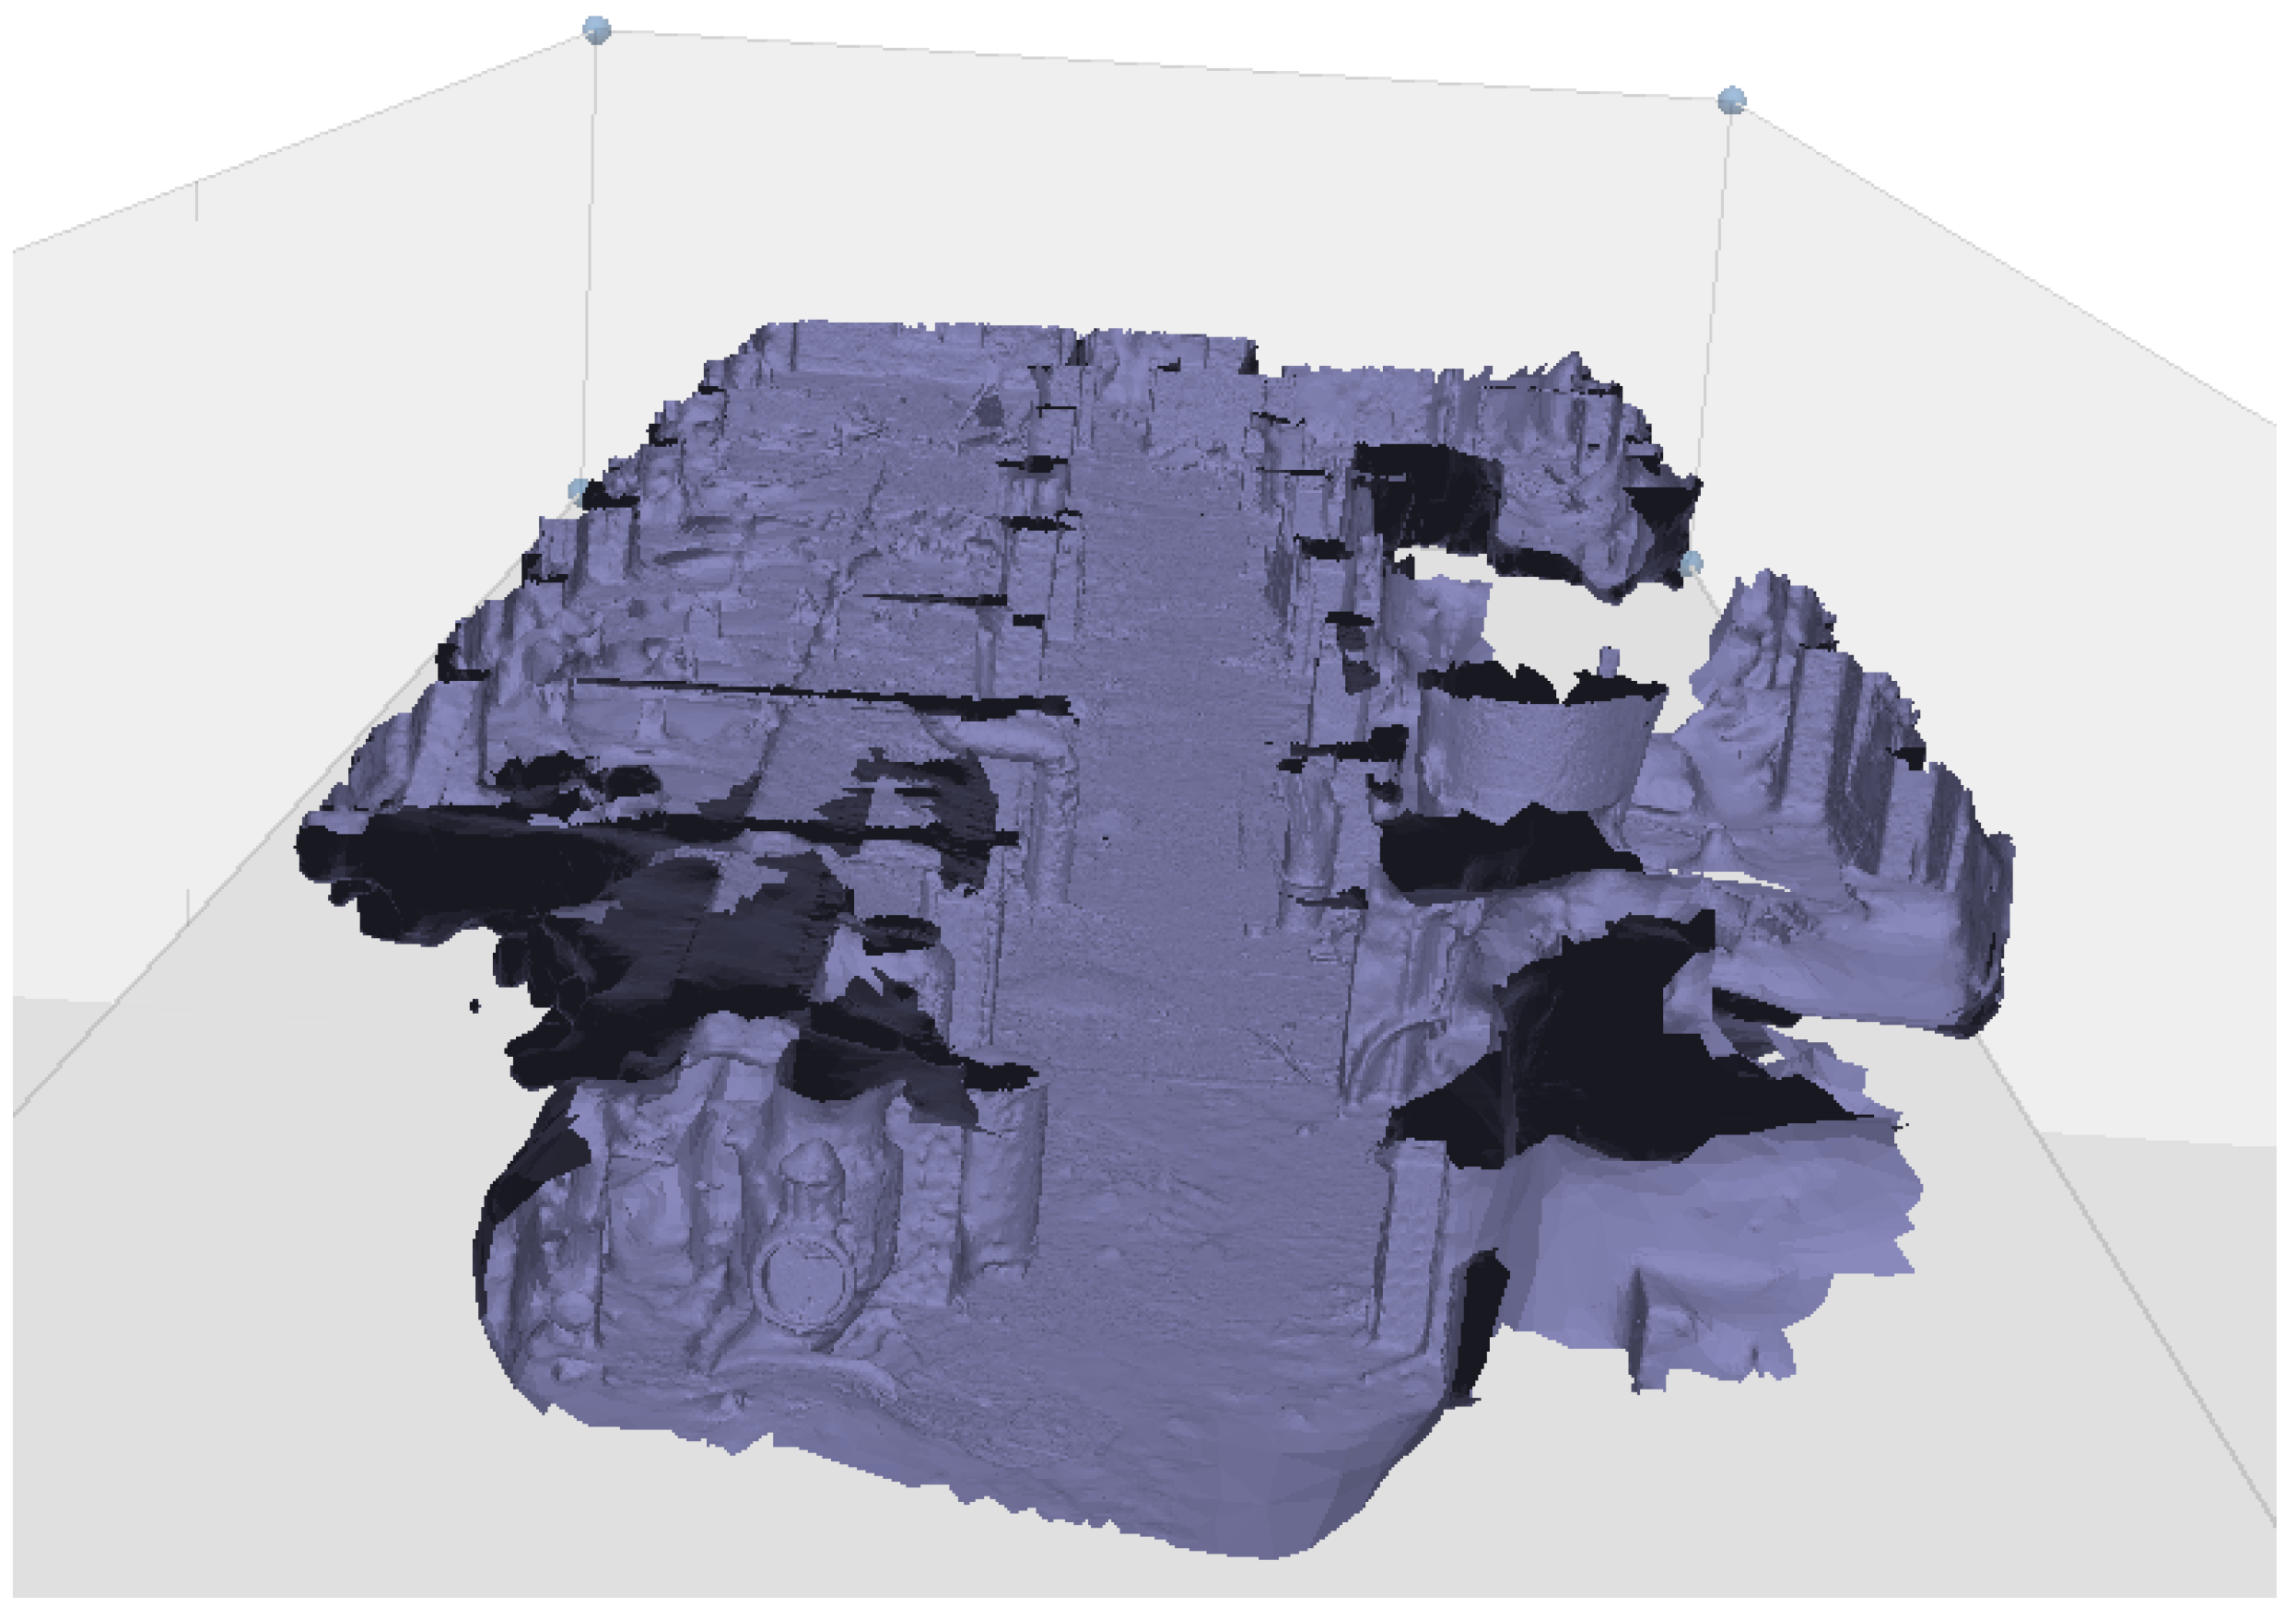
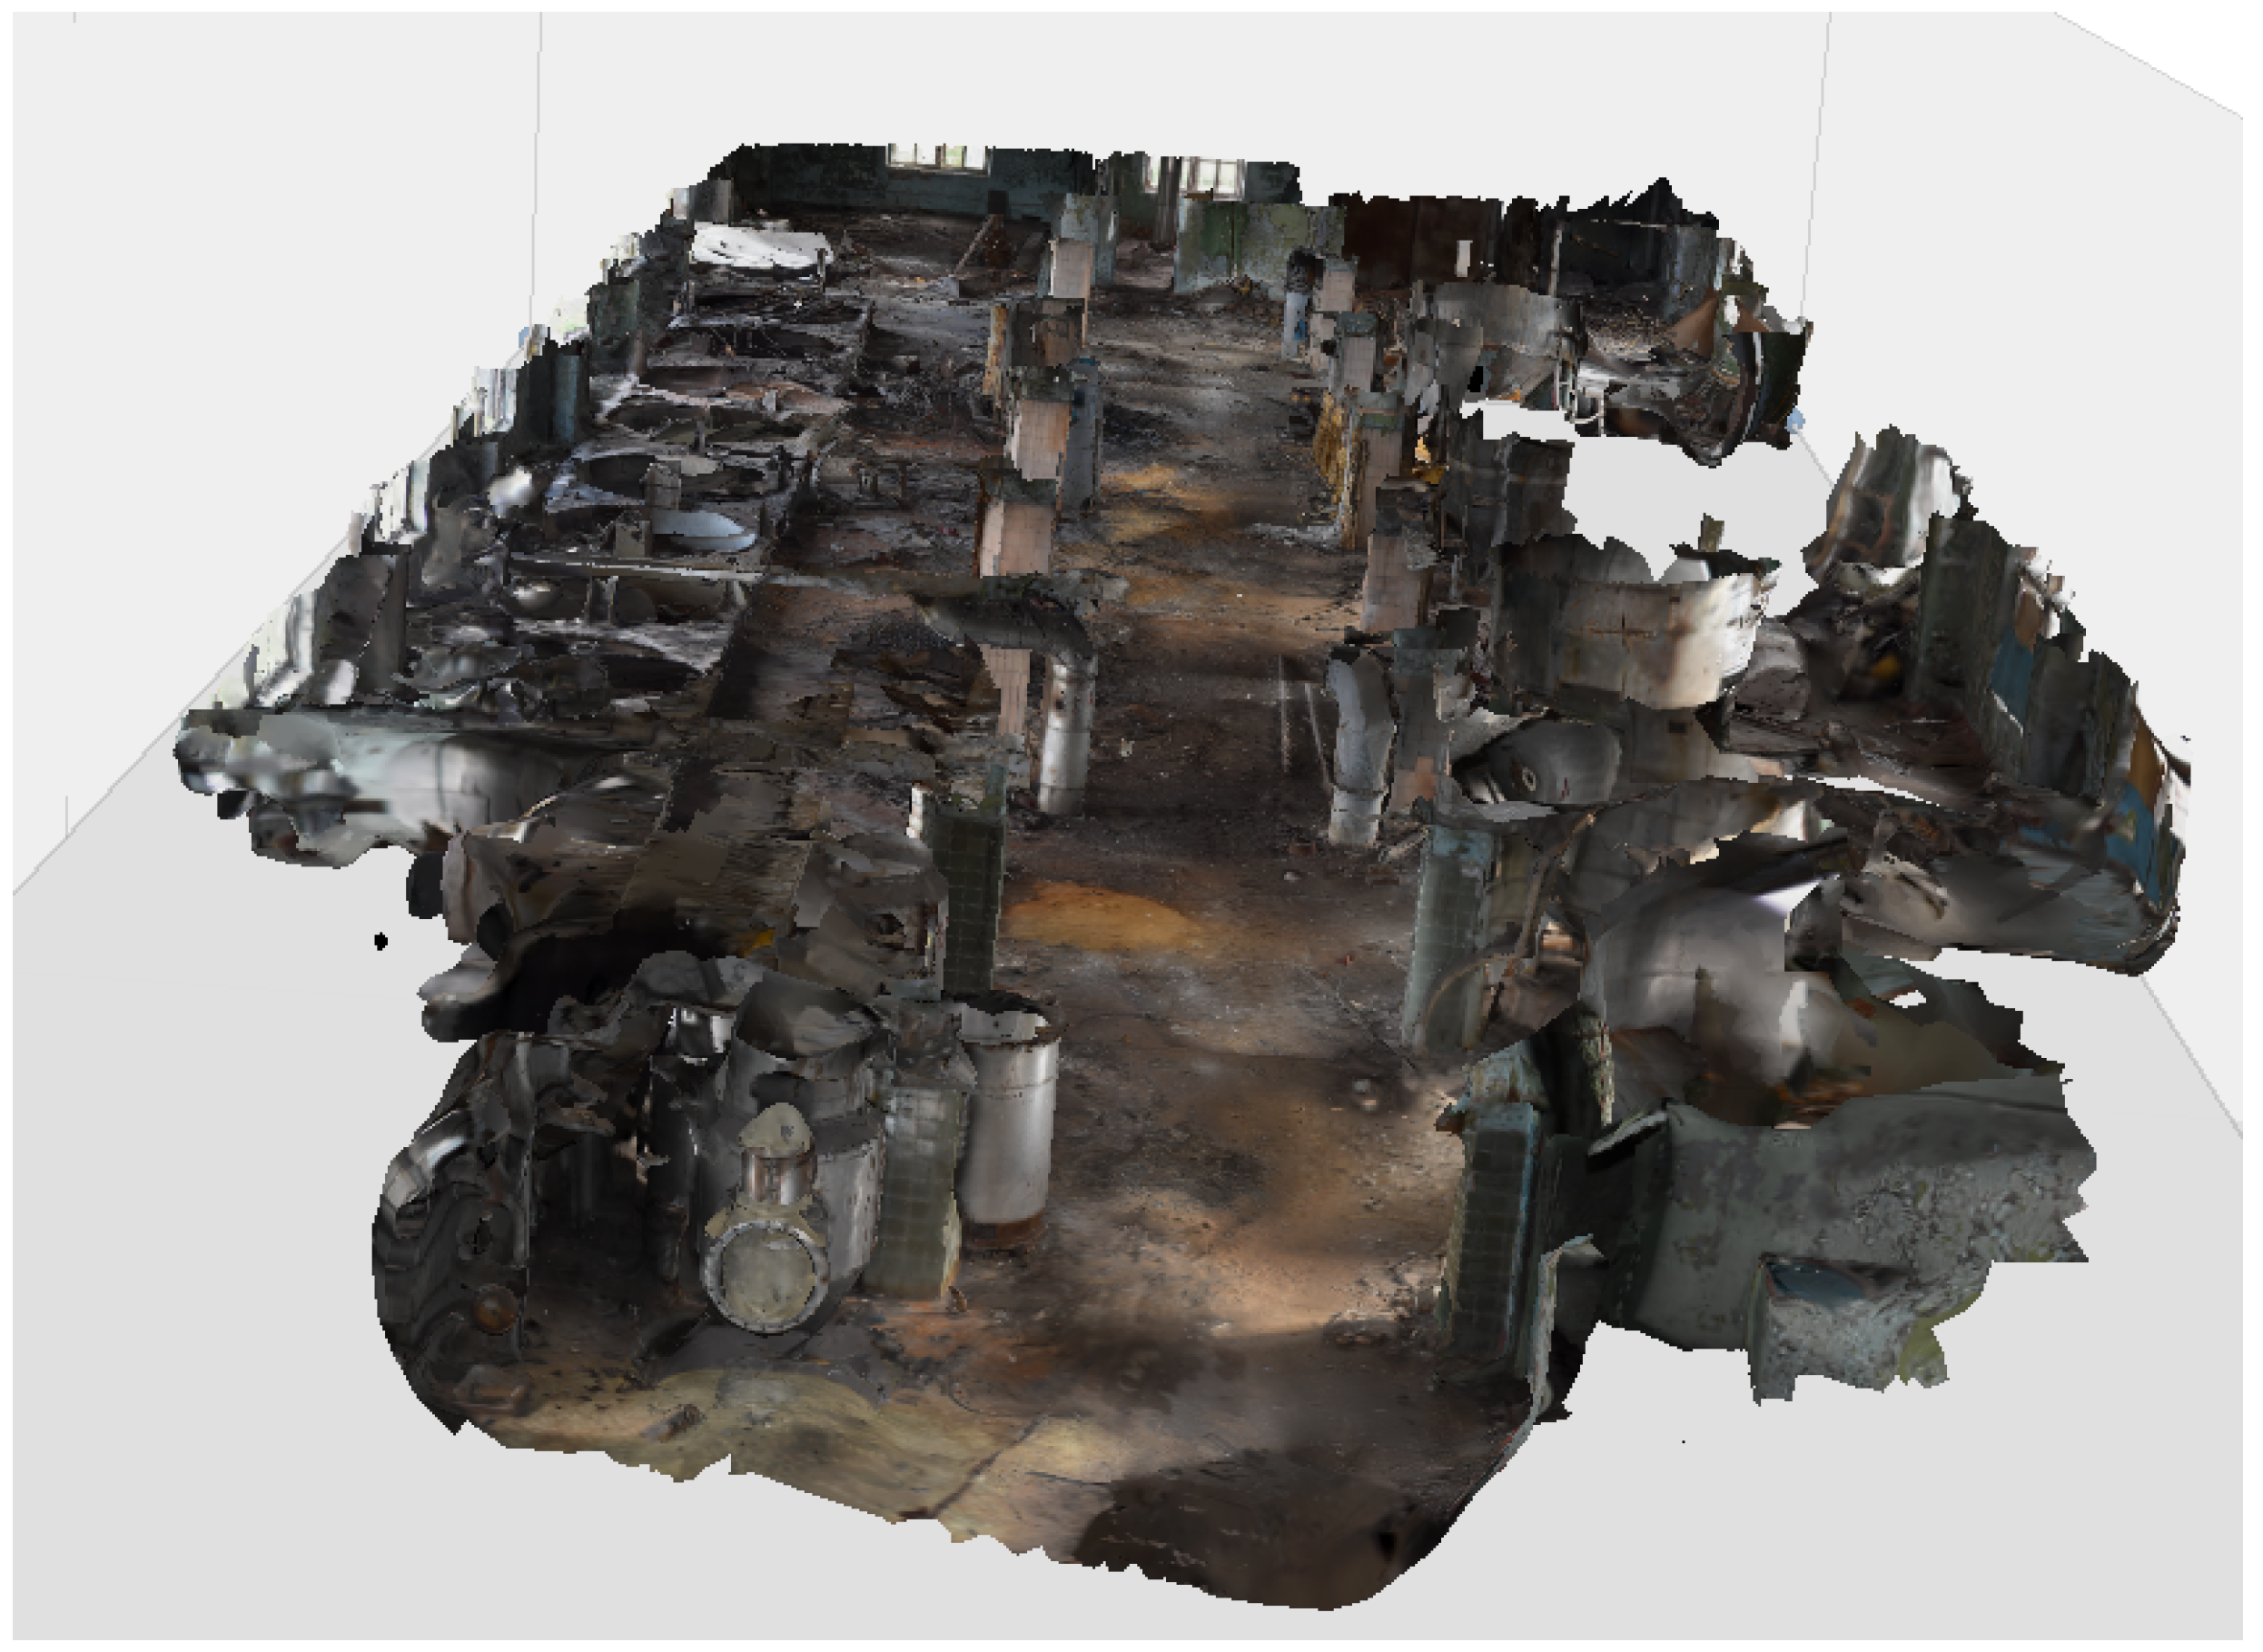
These sets of points are then processed within histogram software and analysed for similarities and combined into a point cloud showing the likely position of all photographs. This is then further analysed to produce a wireframe mesh, as seen in Figure 4. This mesh is then turned into a solid model, as seen in Figure 5. The texture is then mapped onto this mesh to create an image that a viewer can interpret, as seen in Figure 6.
Further additional observations play an essential role in adding value to photogrammetric models. For example, scale bars, annotated hazards, overlain radiation maps and marked sample locations vastly increase the amount of information shown in a model.
Photogrammetry is an excellent technique for use in the field because it requires no specialist equipment. Any modern smartphone with a camera can capture photos suitable for photogrammetry, as can any basic point-and-shoot/compact digital camera, bridge camera, digital single-lens reflex (DSLR) camera or image-capable robot or drone. It is easy for researchers to carry or pilot at least one of these devices into all but the most secure or sensitive environments, and minimal training is required to take photos in an efficient grid. Multiple heights, orientations, and positions add complexity and depth to a survey. Still, valuable results can be produced even when taken from a singular position at multiple heights and angles, such as on a gantry or accessway.
Photogrammetric models can be used to create animated “flythroughs” of hazardous sites, used to train new personnel on the layout and dangers ahead of them before undertaking an entry, thereby improving safety and reducing the amount of time personnel need to spend inside and therefore the dose they are exposed to.
Minor specialist training is required to establish a sampling grid method that increases the utility of photographs taken. Once trained, any member of a field-deployed nuclear industrial archaeology team wearing sufficient PPE and personal dosimetry can be entrusted with creating a photogrammetric record. The decision to carry it out should only be taken when dose rates are relatively well understood. It is a form of data collection that can be undertaken between other resource-heavy investigative methods—for example, while waiting for batteries to charge between robot deployments. Operator fatigue is minimal, although can become an issue during time-consuming investigations that involve large, multistorey buildings with complex internal features.
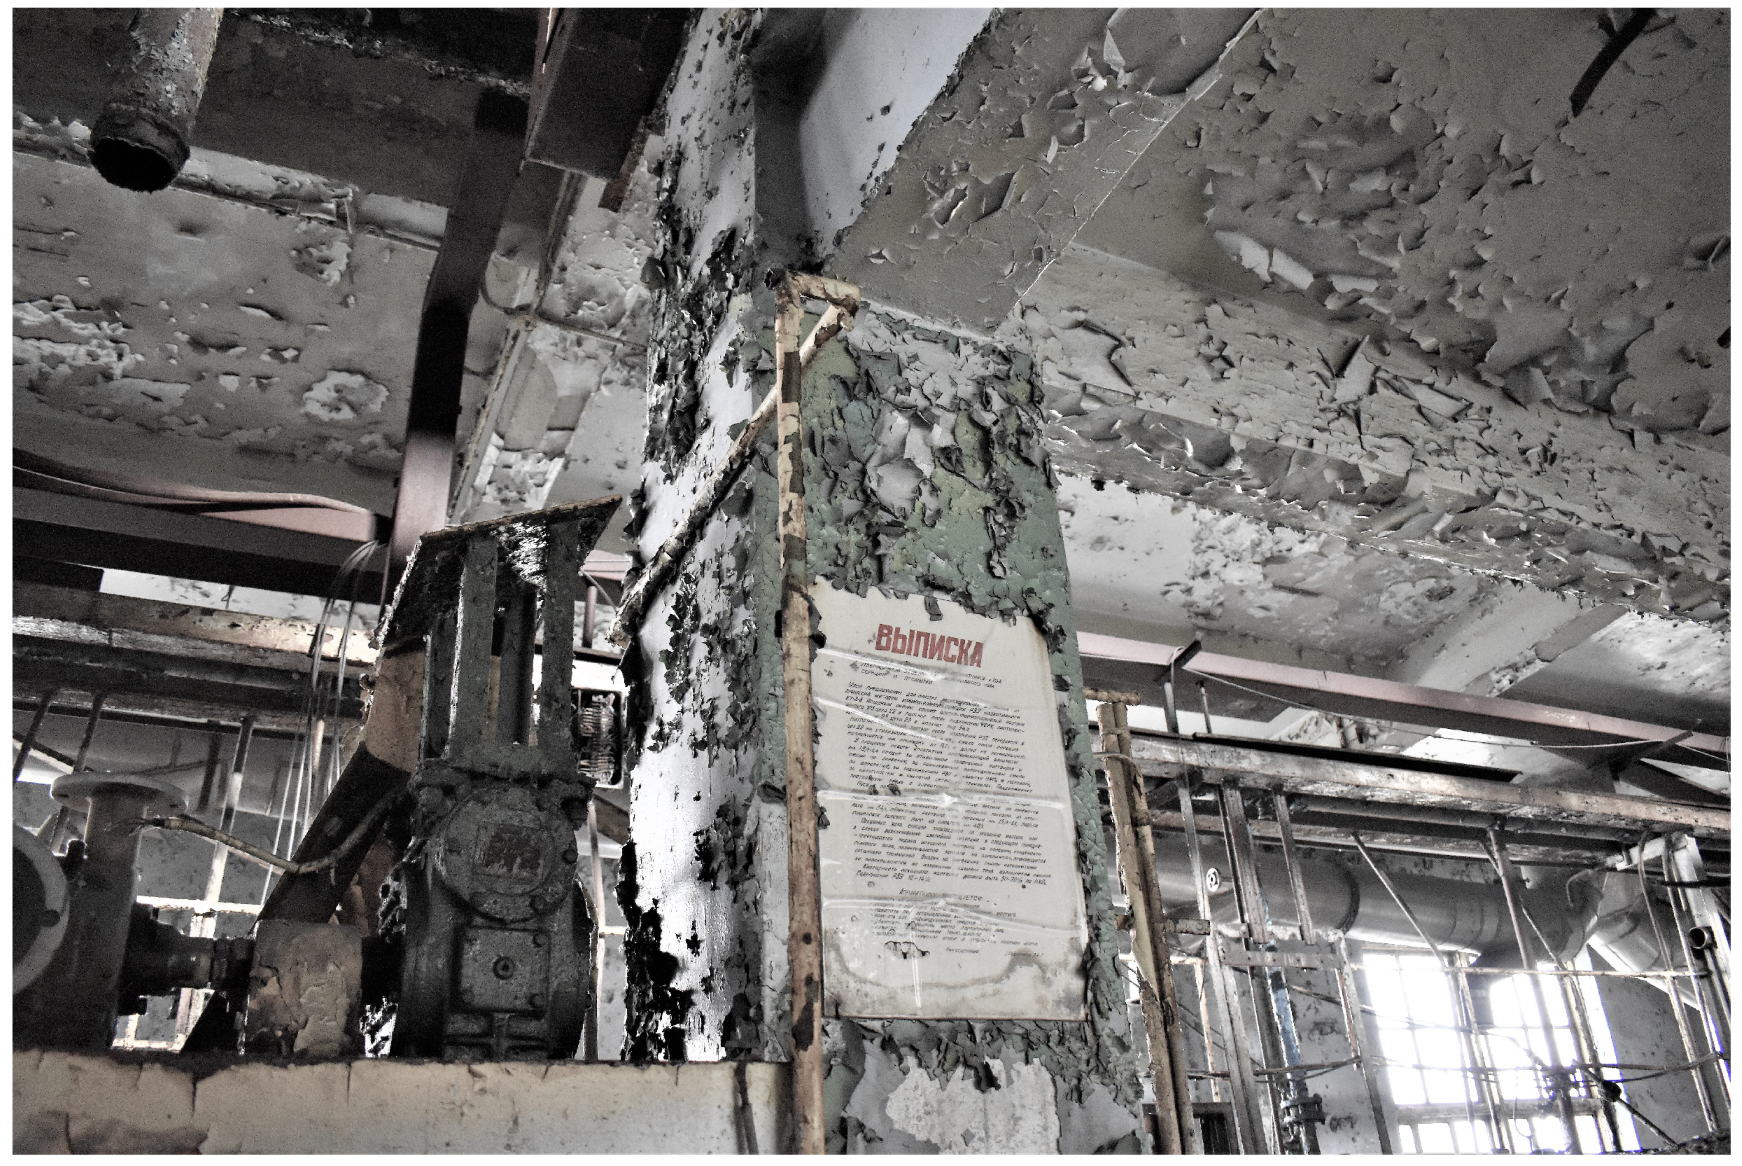
Photogrammetry can also yield evidence that was missed in the field due to poor lighting, time constraints, and other confounding factors. For example, Figure 7 shows a poster that was spotted during an examination of the 3D reconstruction of the site. This allowed a photo to be found retrospectively, which had sufficient clarity for some translation.

4.6.2. Limitations of Photogrammetric Surveys

Barriers to accurate photogrammetric processing include inconsistencies between frames. Within well-lit scenes, this can come from reflective surfaces and mobile surfaces (such as vegetation moving in the wind). Surfaces with limited texture cause reconstruction problems unless there are other observable features in the photographs. Within poorly lit scenes, low light, moving shadows, and variable lighting produced by head torches and camera flashes all have an impact. Camera blur, image exposure, and other internal inconsistencies also prevent appropriate matching on the ability of photogrammetry software to match images and place them accurately within the 3D model. The algorithms used can average out occasional photographs containing team members. Ideally, this will be eliminated by using clear communication and taking surveys while other members of the team are working elsewhere.
To create as static an environment as possible, floors were photographed by two analysts “back-to-back” around noon whenever sunlight can reach the scene. This ensured that lighting was as full and consistent as possible, facilitating the use of two different camera models. This method also enabled analysts to stay out of photographs.
The point cloud in photogrammetry derives from extra processing done after collection. In contrast, a LiDAR point cloud is a direct product, available in seconds when the position of the sensor is understood.

4.7. LiDAR Mapping

Using 3D scanning light detection and ranging (LiDAR) is increasingly commonplace in providing rapid measurements of complex 3D spaces such as building sites or civil engineering projects. In a nuclear industrial archaeology context, LiDAR provides an enhanced capability over photogrammetry in terms of accuracy (mm versus cm) and the ability to operate in very low (or nonexistent) external light conditions.
Photogrammetry can generate high-quality 3D maps, but one limiting factor is the computing power requirements for stitching together the images. This can be a time-consuming process and is difficult to perform accurately in real time; it is normally done in post-processing. A LiDAR unit uses the reflection of lasers to find the distance to the sensor’s surroundings and can use this data to perform simultaneous localisation and mapping (SLAM), where successive scans are compared to work out the location of the unit in space and build up a map. In this way, the position of radiation measurements can be ascertained in real time. A LiDAR unit can be carried by a human operator, mounted on an unmanned aerial vehicle (UAV) [69] or unmanned ground vehicle (UGV) [70], mounted on a robotic manipulator, or mounted to a human operator, and information from other coincident or adjoined sensors, e.g., gamma spectrometers, can be position stamped by the LiDAR [
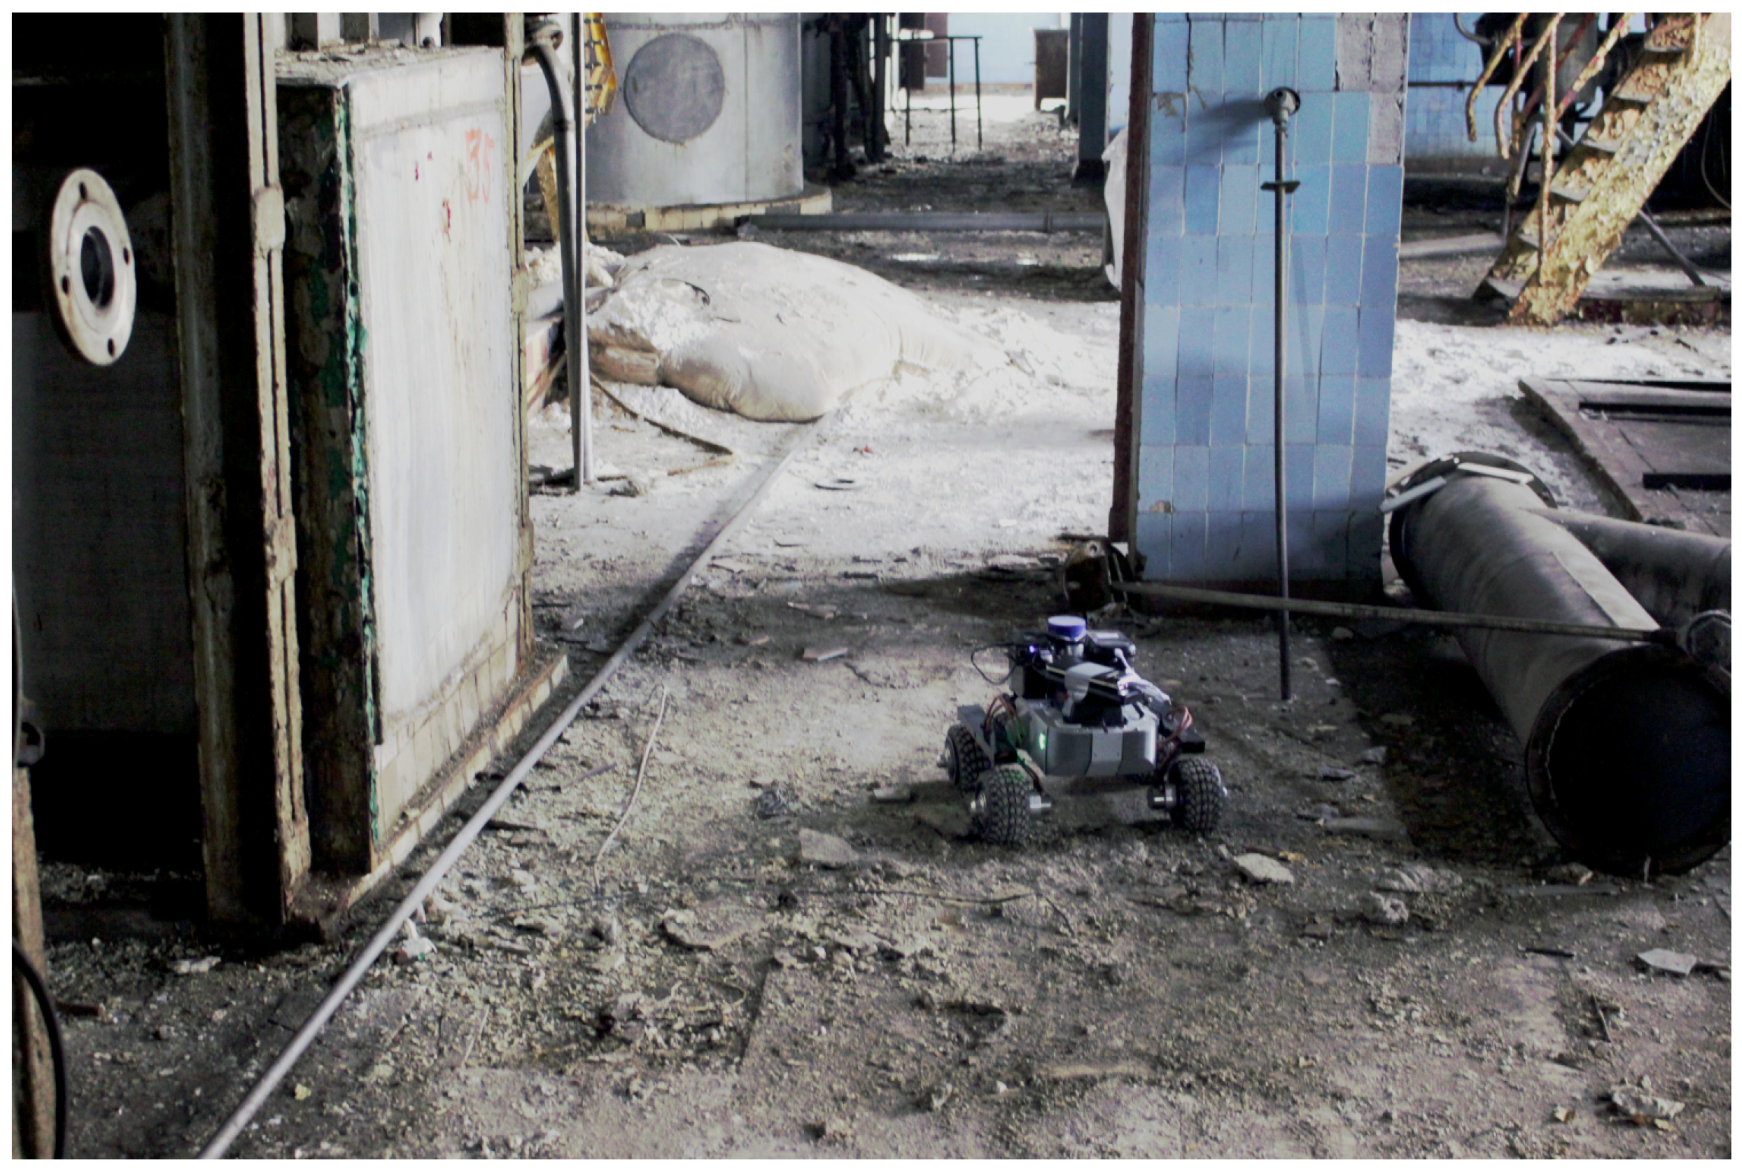
70]. An example of an UGV is shown in Figure 8.
If such a sensor is not used, the location of measurements would need to be manually recorded, increasing burdens on the operator in a hazardous environment and potential error. As the LiDAR mapping requires no input from the operator, they are free to perform other tasks if the LiDAR unit can be mounted appropriately on an operator or UAV/UGV, with the position of each task being accurately recorded.
Two-dimensional LiDARs are more cost effective, but a 3D LiDAR, which consists of multiple sets of lasers scanning at different angles, can generate a 3D point cloud of a space. This point cloud can be used to take accurate measurements, and sensor measurements can be expressed within it. As this is a real-time approach, it can be used to influence strategy and decision making immediately in the field, as compared to photogrammetry, which requires some postprocessing.
A LiDAR mapping unit can also be uploaded with existing maps, which the unit can then use to attempt to localise itself within its current environment. This means that measurements taken at multiple different times can share the same reference frame, and thus be directly compared to each other. Photogrammetry models will not have a consistent reference frame, meaning any comparisons must be done manually.

4.8. Unoccupied Aerial Vehicles and Unoccupied Ground Vehicles

Consumer drones are relatively cheap compared to some scientific instruments and can be modified for use in the field. Unoccupied vehicles, whether they are aerial or ground based, provide the possibility of delivering sensors into areas that would be unfavourable or hazardous to send a human operator. Depending on the variant of unoccupied vehicle chosen and its associated payload capacity, multiple sensor packages can be included to collect multiple data types simultaneously, allowing for real-time data fusion and near-immediate interpretation of the results. This can include sensors that are unsafe for human operators. Remote surveys and inspections carried out by aerial or ground-based robotic systems have become significantly more prevalent since 2005, partly due to the significant reduction in the cost of the robotic platforms themselves [71].
UAVs provide a terrain-independent method of collecting standoff measurements, allowing operators to access areas that would otherwise be inaccessible. Three primary types of UAV exist, consisting of multirotor, single-rotor, and fixed-wing, although a further subdivision can be made for vertical takeoff and landing (VTOL) vehicles that takeoff and land like a multirotor, but operate as a fixed wing in flight [72]. Most UAVs operated within a commercial environment are of the multirotor type, which is generally the easiest to pilot and offers the most stable platform for data collection, and so the following section will primarily focus on these systems [72].
There exists a large variation in total size and weight within the commercial offerings of UAVs on the market. These can range from as little as 250 g to more than 20 k g . However, the operation of vehicles with a takeoff weight (including batteries and payloads) above 20–25 kg are often more heavily restricted within aviation regulations throughout the world, making their operation more heavily regulated in many environments. Commercial UAVs with an overall mass at the lower end of this scale are generally equipped with a single, integrated camera as a payload, allowing for the collection of visual information through still images or video. As described above, these can be used for simple visual inspection or for being processed into photorealistic 3D models through photogrammetry [69]. Generally, as the UAV increases in size or mass, the weight of the payload that it can also carry increases. Larger UAVs, therefore, provide an increased capacity to collect data from multiple payloads simultaneously [73]. Common combinations within radiological and wider nuclear UAV surveys include the combination of a visual camera, some form of gamma spectrometer system and, often, a LiDAR scanning system [73,74,75,76].
UGVs, while more limited than UAVs in the areas they can cover, can detect low-level or diffuse sources that would have been invisible to a UAV due to the standoff distance and the inverse square law [70].
Although a large focus in nuclear industrial archaeology is placed on identifying the chemical or radiological nature of the material within a site, acquiring a contextual visual representation of the site and ensuring the continuing safety of operators should be one of the first objectives for operating workforces. UAVs and UGVs are crucial in this regard, as they can more easily reach and operate in locations that are physically problematic or dangerous for humans, and at the same time, offer greater repeatability and measurement reliability. When coincident radiometric and 3D data is recorded by using adequate methodologies, there is also an opportunity to postprocess the recorded data by using inversion techniques, which often utilise Kaczmarz methods [77] to provide a localisation calculation of possible “hot” emitters in the survey zone. Although this capability is currently performed in postprocessing, it is expected that near real-time localisations may be achieved in the near future in concert with advances in the computing power of microprocessors used in handheld field instrumentation.
Passing through airport security and customs is more straightforward when there is a basic understanding of the transported equipment, which is nowhere more acutely felt than in the recent rise of consumer-grade drones. Ten years ago, transporting a drone battery involved a discussion with security personnel regarding drones and why they need to be transported; these days, drone batteries and parts in hand luggage do not provoke much interest.

4.9. Discussion

In this work, we have delineated a toolkit of portable analysis technologies for NIA applications. As with any toolkit, tools can be added and taken out depending on the application scenario. The expectation is that the technologies we have outlined will, as a function of time, evolve to increase their effectiveness and useability, and decrease their size, energy consumption, and mass.
We expect that more portable analytical tools will become available within the next decade, for example, Raman, LIBS, and standoff alpha imagers.
In this work, we have put a series of NIA tools into a case study context. The buildings assessed in this work presented a series of challenges and hazards, ranging from the obvious (holes in the floor) to the subtle (doses of up to 8.2   mSv h 1 ). One of the reasons that this investigation is important and relevant is that many buildings on the PChP site are still in use, with complex ownership status leading to previously unknown issues being uncovered in recent years. For example, the designated outdoor smoking area for one of the factories was for many years situated next to a highly active, abandoned uranium leachate storage tank from the building next door. As a direct result of the NIA investigation, this situation has been resolved by management and the smoking area moved.
For this work at PChP, data from individual instruments was recorded and then later combined in postmortem analysis. This meant that there was a delay in the fusion of the data, and therefore a delay in fully understanding the disposition of materials and hazards within the facility. It is expected that within this decade, technological advancements will enable a combination of data streams in near real time and with advances in data transmission technology (5G), the ability to relay large sets of information to a central repository as it is collected. This will ensure that all data recovered is protected and archived. With advances in computing power, techniques such as photogrammetry will be compiled and outputted onsite in minutes, allowing more advanced visualisations of 3D datasets in real time. Advancements in real-time data visualisation will enhance the relay and explanation of important arising information to site stakeholders, decision makers, and workers operating in these environments. Importantly, it will enhance communal understanding of the whereabouts and significance of any residual radiological risks in a visually intuitive manner, which is independent of written or spoken language.
Over the next decade, with the continued sensorisation of the industrial world, it is expected that the field of NIA stands to continually benefit from advances that will be driven by technology development within other industrial fields of application. Equally, NIA methodologies could be beneficially applied to other relevant industrial areas, for example verification of NORM contamination of oil and gas/mining infrastructure.
Technological advances validated in the field of NIA will have downstream benefits for nuclear forensics applications of the same tools. Accordingly, as NIA technology advances, so does NF.
At present, there are many nuclear facilities worldwide reaching the end of their operational lifetimes, and many countries are planning substantial new nuclear energy infrastructure to contribute toward net zero carbon emissions targets by the middle of the century. This means that the field of NIA will apply to an increasing number of sites. These sites are known to be diverse and contain unique challenges and materials, as no two sites are the same. It is our assertion that by understanding and cataloguing the nuclear challenges of the past, it is possible to avoid the repetition of these issues in the development of this planned nuclear infrastructure. At the same time, NIA enables objective assessment of the historic value of nuclear industrial heritage, and NIA research provides the scientific foundations to initiate often much-needed protection and conservation work.

5. Conclusions

In this paper, we have established that NIA is a distinct and separate branch of science from nuclear forensics, although the two share a common history and set of techniques. This distinction has clear benefits for practitioners and clients. A toolkit of in situ analysis techniques has been presented for NIA applications, with the selection based on prior experience from field trips and industrial investigations.
A thorough technical plan is key to any scientific investigation, especially those under time pressure and weight limits. To that end, field NIA aims to provide a systematic, semistandardised approach to data collection within a complex radiological environment.
This paper defines a methodology for combined application of this toolkit of analysis techniques, which if applied to other sites in a standardised manner, will allow comparisons to be made between investigations.

Author Contributions

Conceptualisation, E.I.H. and Y.V.; methodology, E.I.H., Y.V. and T.B.S.; validation, E.I.H., Y.V. and T.B.S.; investigation; E.I.H., Y.V., D.T.C. and T.B.S.; data curation, E.I.H.; writing, E.I.H., Y.V., D.T.C. and T.B.S.; visualisation, E.I.H.; illustrations: E.I.H. and Y.V.; draft review: E.I.H., Y.V., D.T.C., T.M., M.H. and T.B.S.; project administration: T.B.S.; funding acquisition: T.M., M.H. and T.B.S. All authors have read and agreed to the published version of the manuscript.

Funding

D.T.C. acknowledges funding from UK Research and Innovation (UKRI) through the National Center for Nuclear Robotics (NCNR) (EP/R02572X/1) and from National Nuclear Laboratory (NNL) through the R&D Decontamination Science Core Science Theme and NNL Post-doctorate Programme. Y.V. acknowledges funding from UKRI though the NCNR and Robotics and Artificial Intelligence for Nuclear Applications (RAIN) research programs.

Data Availability Statement

The data presented in this study are available on request from the corresponding author. The data are not publicly available due to the sensitive nature of nuclear facilities where data was collected.

Acknowledgments

The authors wish to thank the Ukrainian Government and the management and staff of the Prydniprovksy Chemical Plant in Kamianske for their hospitality, and generously provided access to nuclear facilities on-site. Additionally, the authors thank Alex for the logistic support during field deployments in difficult circumstances. The authors thank Matthew Ryan Tucker of the University of Bristol Interface Analysis Centre for his input into the discussion on robot mounted LiDAR mapping. The authors also extend their gratitude to Sofia Leadbetter of the National Nuclear User Facility for Hot Robotics (NNUF-HR) for the administrative support and access to research tools such as the Vanta pXRF used in this study.

Conflicts of Interest

The authors declare no conflict of interest. The funders had no role in the design of the study; in the collection, analyses, or interpretation of data; in the writing of the manuscript; or in the decision to publish the results.

Abbreviations

The following abbreviations are used in this manuscript:
2D2-dimensional
3D3-dimensional
DSLRDigital single lens reflex camera
EDXRFEnergy dispersive X-ray fluorescence spectroscopy
GMGeiger-Müller
HPGeHigh-purity germanium detector
HRGSHigh-resolution gamma-ray spectroscopy
IAEAInternational Atomic Energy Agency
ICP-MSInductively coupled plasma mass spectroscopy
ITDBIncident and Trafficking Database
LCDLiquid crystal display
LELight elements
LIBSLaser induced breakdown spectroscopy
LiDARLight detection and ranging
NAANeutron activation analysis
NFNuclear forensics
NIANuclear industrial archaeology
NORMNaturally occurring radioactive materials
PChPPryniprovsky Chemical Plant
PEDPersonal electronic dosimeter
PPEPersonal protection equipment
pXRFPortable X-ray fluorescence spectroscopy
REERare earth element
SEMScanning electron microscope
SLAMSimultaneous localisation and mapping
UAVUnoccupied aerial vehicle
UGVUnoccupied ground vehicle
VTOLVertical take-off and landing
XRDX-ray diffraction
XRFX-ray fluorescence spectroscopy

References

  1. Mayer, K.; Wallenius, M.; Ray, I. Nuclear forensics–a methodology providing clues on the origin of illicitly trafficked nuclear materials. Analyst 2005, 130, 433–441. [Google Scholar] [CrossRef] [PubMed]
  2. Keegan, E.; Kristo, M.J.; Toole, K.; Kips, R.; Young, E. Nuclear Forensics: Scientific Analysis Supporting Law Enforcement and Nuclear Security Investigations. Anal. Chem. 2016, 88, 1496–1505. [Google Scholar] [CrossRef] [PubMed] [Green Version]
  3. Schmid, A.P.; Spencer-Smith, C. Illicit Radiological and Nuclear Trafficking, Smuggling and Security Incidents in the Black Sea Region since the Fall of the Iron Curtain—An Open Source Inventory. Perspect. Terror. 2012, 6, 117–157. [Google Scholar]
  4. Potter, W.C. Nuclear Smuggling from the Former Soviet Union 1. In Nuclear Energy and Security in the Former Soviet Union; Routledge: Oxfordshire, UK, 2018; pp. 139–165. [Google Scholar]
  5. Niemeyer, S.; Koch, L. The historical evolution of nuclear forensics: A technical viewpoint. In Proceedings of the International Conference on Advances in Nuclear Forensics, Vienna, Austria, 7 July 2014. [Google Scholar]
  6. International Atomic Energy Agency. Incident and Trafficking Database. 1995. Available online: https://www.iaea.org/sites/default/files/22/01/itdb-factsheet.pdf (accessed on 19 January 2023).
  7. Kristo, M.J. Chapter 13—Nuclear forensics. In Handbook of Radioactivity Analysis: Volume 2, 4th ed.; L’Annunziata, M.F., Ed.; Academic Press: Cambridge, MA, USA, 2020; pp. 921–951. [Google Scholar] [CrossRef]
  8. Grant, P.; Moody, K.; Hutcheon, I.; Phinney, D.; Whipple, R.; Haas, J.; Alcaraz, A.; Andrews, J.; Klunder, G.; Russo, R.; et al. Nuclear forensics in law enforcement applications. J. Radioanal. Nucl. Chem. 1998, 235, 129–132. [Google Scholar] [CrossRef] [Green Version]
  9. Leggitt, J.; Inn, K.; Goldberg, S.; Essex, R.; LaMont, S.; Chase, S. Nuclear forensics—metrological basis for legal defensibility. J. Radioanal. Nucl. Chem. 2009, 282, 997–1001. [Google Scholar] [CrossRef]
  10. Wallenius, M.; Mayer, K. Age determination of plutonium material in nuclear forensics by thermal ionisation mass spectrometry. Fresenius’ J. Anal. Chem. 2000, 366, 234–238. [Google Scholar] [CrossRef]
  11. Fedchenko, V. The New Nuclear Forensics: Analysis of Nuclear Materials for Security Purposes; Oxford University Press: Oxford, UK, 2015. [Google Scholar]
  12. Nitrean, A.I.; Stebelkov, V.A. Main Problems and Development Trends in Nuclear Forensics. Russ. J. Leg. Stud. 2022, 9, 97–106. [Google Scholar] [CrossRef]
  13. International Atomic Energy Agency. Nuclear Forensics Support, Reference Manual; IAEA: Vienna, Austria, 2006; p. 67. [Google Scholar]
  14. Choi, S.U.; Han, S.C.; Yun, J.I. In situ detection of neodymium isotopes using tunable diode laser absorption spectroscopy for nuclear forensic analysis. J. Anal. At. Spectrom. 2023, 38, 166–173. [Google Scholar] [CrossRef]
  15. Weller, A. Environmental Impact of Noble Metal Radionuclides and their use in Nuclear Forensics. Ph.D. Thesis, Leibniz Universität Hannover, Hannover, Germany, 2021. [Google Scholar] [CrossRef]
  16. Vesterlund, A.; Canaday, J.; Chamberlain, D.B.; Curry, M.R.; Sandström, B.; Schnaars, D.D.; Ramebäck, H. National nuclear forensics libraries: A case study on benefits and possibilities for identification of sealed radioactive sources. J. Radioanal. Nucl. Chem. 2022, 331, 639–643. [Google Scholar] [CrossRef]
  17. Palmer, M.; Neaverson, P. Industrial Archaeology Principles and Practice; Routledge: Oxfordshire, UK, 1998. [Google Scholar]
  18. Shaw, R.J. Activation analysis at the UMC Laboratory for nuclear archaeology. Newsl. Lithic Technol. 1974, 3, 61–64. [Google Scholar]
  19. Price, T.D.; Chappell, S.; Ives, D.J. Thermal alteration in Mesolithic assemblages. In Proceedings of the Prehistoric Society; Cambridge University Press: Cambridge, MA, USA, 1982; Volume 48, pp. 467–485. [Google Scholar]
  20. Neff, H. The present state of nuclear archaeology. Trans. Am. Nucl. Soc. 1994, 71. Available online: https://www.osti.gov/biblio/88951 (accessed on 19 January 2023).
  21. Neff, H.; Glascock, M.D. The state of nuclear archaeology in North America. J. Radioanal. Nucl. Chem. 1995, 196, 275–286. [Google Scholar] [CrossRef]
  22. Auxier, J.A.A. Physical Dose Estimates for A-bomb Survivors—Studies at Oak Ridge, USA. J. Radiat. Res. 1975, 16, 1–11. [Google Scholar] [CrossRef]
  23. Loewe, W. Initial Radiation Dosimetry at Hiroshima and Nagasaki; Technical Report; Lawrence Livermore National Lab: Livermore, CA, USA, 1983. [Google Scholar]
  24. Fetter, S. Nuclear archaeology: Verifying declarations of fissile-material production. Sci. Glob. Secur. 1993, 3, 237–259. [Google Scholar] [CrossRef] [Green Version]
  25. Gaines, L.L. Start II: Thinking One Move Ahead; Technical Report, Arms Control and Tready Verification Program; Argonne National Lab: Lemont, IL, USA, 1991. [Google Scholar]
  26. Kalinowski, M.B.; Liebert, W.; Scheffran, J. Beyond technical verification: Transparency, verification, and preventive control for the Nuclear Weapons Convention. In Proceedings of the NPT PrepCom Geneva, New York, NY, USA, 27 April–8 May 1998; p. 4. [Google Scholar]
  27. Dudar, T. Uranium Mining and Milling Facilities Legacy Sites: Ukraine Case Study. Environ. Probl. 2019, 4, 212–218. [Google Scholar] [CrossRef] [Green Version]
  28. Ivanchenko, A.; Yelatontsev, D.; Savenkov, A.; Nazarenko, O.; Kundirenko, V. Obtaining of complex mineral fertilizer by phosphogypsum conversion with ammonium nitrate. Chem. J. Mold. 2021, 1, 18–23. [Google Scholar] [CrossRef]
  29. Mukhachev, A.; Nefedov, V.; Yelatontsev, D. Physicochemical foundations of the pioneering technology for the carbonaceous uranium ore processing. IOP Conf. Ser. Earth Environ. Sci. 2022, 970, 012027. [Google Scholar] [CrossRef]
  30. Hughes, J.; Watson, S.; Jones, A.; Oatway, W. Review of the radiation exposure of the UK population. J. Radiol. Prot. 2005, 25, 493. [Google Scholar] [CrossRef]
  31. Voitsekhovych, O.; Lavrova, T. Remediation Strategy for Former PChP Uranium Production Site in Ukraine - 18217. In Proceedings of the Waste Management Symposia, Phoenix, AZ, USA, 18–22 March 2018. [Google Scholar]
  32. Drielak, S.C. Hot Zone Forensics: Chemical, Biological, and Radiological Evidence Collection; Charles C Thomas Publisher: St. Springfield, IL, USA, 2004. [Google Scholar]
  33. McDiarmid, M.A.; Gaitens, J.M.; Squibb, K.S. Uranium and Thorium. In Patty’s Toxicology; John Wiley & Sons: Hoboken, NJ, USA, 2012; pp. 769–816. [Google Scholar] [CrossRef]
  34. Bhatt, B.; Angeyo, K.H.; Dehayem-Kamadjeu, A. LIBS development methodology for forensic nuclear materials analysis. Anal. Methods 2018, 10, 791–798. [Google Scholar] [CrossRef]
  35. Moody, K.J.; Grant, P.M.; Hutcheon, I.D. Nuclear Forensic Analysis, 2nd ed.; CRC Press: Boca Raton, FL, USA, 2015. [Google Scholar]
  36. Manard, B.T.; Wylie, E.M.; Willson, S.P. Analysis of Rare Earth Elements in Uranium Using Handheld Laser-Induced Breakdown Spectroscopy (HH LIBS). Appl. Spectrosc. 2018, 72, 1653–1660. [Google Scholar] [CrossRef]
  37. Shampo, M.A.; Kyle, R.A.; Steensma, D.P. Hans Geiger—German Physicist and the Geiger Counter. Mayo Clin. Proc. 2011, 86, e54. [Google Scholar] [CrossRef] [PubMed] [Green Version]
  38. Papp, Z.; Daróczy, S. Measurement of radon decay products and thoron decay products in air by beta counting using end-window Geiger-Muller counter. Health Phys. 1997, 72, 601–610. [Google Scholar] [CrossRef] [PubMed]
  39. Ivasheva, A.Y.; Borisov, V.S.; Semenikhin, P.V. Adjusting of the detection efficiency of Geiger-Muller counters in the energy range of gamma radiation from 50 to 3000 keV. J. Physics Conf. Ser. 2018, 1135, 012042. [Google Scholar] [CrossRef]
  40. Arvela, H.; Markkanen, M.; Lemmelä, H. Mobile Survey of Environmental Gamma Radiation and Fall-Out Levels in Finland After the Chernobyl Accident. Radiat. Prot. Dosim. 1990, 32, 177–184. [Google Scholar] [CrossRef]
  41. Habrman, P. Directional Geiger-Müller Detector with Improved Response to Gamma Radiation. J. Instrum. 2019, 14, P09018. [Google Scholar] [CrossRef]
  42. McDicken, W.N. A position sensitive Geiger counter. Nucl. Instruments Methods 1967, 54, 157–158. [Google Scholar] [CrossRef]
  43. Maulany, G.J.; Manggau, F.X.; Jayadi, J.; Waremra, R.S.; Fenanlampir, C.A. Radiation Detection of Alfa, Beta, and Gamma Rays With Geiger Muller Detector. Int. J. Mech. Eng. Technol. 2018, 9, 21–27. [Google Scholar]
  44. Taamté, J.M.; Saïdou; Bodo, B.; Noubé, M.K.; Signing, V.R.F.; Younui, S.Y.N.; Yerima, A.H.; Iamsumang, C.; Massey, C. Low-cost wireless smart device design for radiation protection and nuclear security. J. Instrum. 2021, 16, T06011. [Google Scholar] [CrossRef]
  45. Becker, E.M.; Farsoni, A.T. Wireless, low-cost, FPGA-based miniature gamma ray spectrometer. Nucl. Instrum. Methods Phys. Res. Sect. A Accel. Spectrometers Detect. Assoc. Equip. 2014, 761, 99–104. [Google Scholar] [CrossRef]
  46. Neher, H.V.; Pickering, W.H. Modified High Speed Geiger Counter Circuit. Phys. Rev. 1938, 53, 316. [Google Scholar] [CrossRef] [Green Version]
  47. Eichholz, G.G. Principles of Nuclear Radiation Detection; CRC Press: Boca Raton, FL, USA, 2018. [Google Scholar]
  48. Silva, A.; Dinis, M.L. Assessment of the Indoor Gamma Dose Rates in 15 Portuguese Thermal Spas. In Occupational and Environmental Safety and Health; Springer: Berlin/Heidelberg, Germany, 2019; pp. 221–230. [Google Scholar] [CrossRef]
  49. Martin, A.; Harbison, S.A.; Beach, K.; Cole, P. An Introduction to Radiation Protection; CRC Press: Hoboken, NJ, USA, 2018. [Google Scholar]
  50. Rutherford, E.; Andrade, E.d. The wave-length of the soft γ rays from Radium B. Lond. Edinb. Dublin Philos. Mag. J. Sci. 1914, 27, 854–868. [Google Scholar] [CrossRef] [Green Version]
  51. Verbelen, Y.; Megson-Smith, D.; Russell-Pavier, F.; Martin, P.; Connor, D.; Tucker, M.R.; Scott, T.B. A Flexible Power Delivery System for Remote Nuclear Inspection Instruments. In Proceedings of the 2022 8th International Conference on Automation, Robotics and Applications (ICARA), Prague, Czech Republic, 18–20 February 2022; pp. 170–175. [Google Scholar] [CrossRef]
  52. Mirion Technologies. SPIR-Ace: Radio Isotope Identification Device (RIID). 2020. Available online: https://www.southernscientific.co.uk/products-by-manufacturer/mirion-technologies/spir-ace (accessed on 19 January 2023).
  53. Verbelen, Y.; Martin, P.G.; Ahmad, K.; Kaluvan, S.; Scott, T.B. Miniaturised Low-Cost Gamma Scanning Platform for Contamination Identification, Localisation and Characterisation: A New Instrument in the Decommissioning Toolkit. Sensors 2021, 21, 2884. [Google Scholar] [CrossRef]
  54. Blake, D.; Vaniman, D.; Achilles, C.; Anderson, R.; Bish, D.; Bristow, T.; Chen, C.; Chipera, S.; Crisp, J.; Des Marais, D.; et al. Characterization and calibration of the CheMin mineralogical instrument on Mars Science Laboratory. Space Sci. Rev. 2012, 170, 341–399. [Google Scholar] [CrossRef] [Green Version]
  55. Rampe, E.; Blake, D.; Sarrazin, P.; Bristow, T.; Gailhanou, M.; Lafuente, B.; Tu, V.; Zacny, K.; Downs, R. CheMinX: A Next Generation XRD/XRF for Quantitative Mineralogy and Geochemistry on Mars. 2020. Available online: https://ntrs.nasa.gov/api/citations/20205005011/downloads/Rampe_etal_CheMinX_DS_white_paper_2020.pdf (accessed on 19 January 2023).
  56. Izumoto, Y.; Fukutsu, K.; Takamura, K.; Sakai, Y.; Oguri, Y.; Yoshii, H. Rapid detection of plutonium contamination with and without uranium contamination in wounds by x-ray fluorescence. J. Radiol. Prot. 2020, 40, 692. [Google Scholar] [CrossRef]
  57. Worley, C.G. Analysis of nuclear materials by energy dispersive X-ray fluorescence and spectral effects of alpha decay. J. Radioanal. Nucl. Chem. 2009, 282, 539–542. [Google Scholar] [CrossRef]
  58. Brand, C. History of portable XRF and radiation safety issues. Are we keeping up with the times? In Proceedings of the Australasian Radiation Protection Society, Canberra, Australia, 6–9 October 2015; p. 102. [Google Scholar]
  59. Thomsen, V.; Schatzlein, D. Advances in Field-Portable XRF. Spectroscopy 2002, 17, 14–21. [Google Scholar]
  60. Fry, K.L.; Wheeler, C.A.; Gillings, M.M.; Flegal, A.R.; Taylor, M.P. Anthropogenic contamination of residential environments from smelter As, Cu and Pb emissions: Implications for human health. Environ. Pollut. 2020, 262, 114235. [Google Scholar] [CrossRef]
  61. Brouwer, P. Theory of XRF, 3rd ed.; PANalytical BV: Almelo, The Netherlands, 2010. [Google Scholar]
  62. Onoyama, M.; Nakata, M.; Hirose, Y.; Nakagawa, Y. Development of a high performance type 304L stainless steel for nuclear fuel reprocessing facilities. In Proceedings of the Third International Conference on Nuclear Fuel Reprocessing and Waste Management, RECOD’91, Sendai, Japan, 14–18 April 1991; pp. 1066–1071. [Google Scholar]
  63. Reilly, D.; Ensslin, N.; Smith, H.J.; Kreiner, S. Passive Nondestructive Assay of Nuclear Materials; Los Alamos National Laboratory: Los Alamos, NM, USA, 1991. [Google Scholar]
  64. Higginson, M.; Dawkins, B.; Shaw, T.; Taylor, F.; Ingman, L.; Dunn, S.; Thompson, P.; Kaye, P. Development of assay, isotopic and trace actinide measurements on solid plutonium and uranium samples by high resolution gamma spectrometry. J. Radioanal. Nucl. Chem. 2021, 330, 901–911. [Google Scholar] [CrossRef]
  65. McDowell, D.; Thurston, A. Screening of ceramic and leaded contaminants in glass recycling streams via handheld X-ray fluorescence (HHXRF) analyzers. In Proceedings of the 15th Asia Pacific Conference for Non-Destructive Testing (APCNDT2017), Singapore, 13–17 November 2017; p. 11. [Google Scholar]
  66. Fisher Scientific. Decon 90. 2018. Available online: https://decon.co.uk/wp-content/uploads/2018/11/Decon-90.pdf (accessed on 19 January 2023).
  67. Wolf, D.E.; Samarasekera, C.; Swedlow, J.R. Chapter 14—Quantitative Analysis of Digital Microscope Images. In Digital Microscopy; Methods in Cell, Biology; Sluder, G., Wolf, D.E., Eds.; Academic Press: Cambridge, MA, USA, 2013; Volume 114, pp. 337–367. [Google Scholar] [CrossRef]
  68. Luhmann, T.; Robson, S.; Kyle, S. Close Range Photogrammetry: Principles, Techniques and Applications; Whittles Publishing: Dunbeath, UK, 2006; pp. 2–8. [Google Scholar]
  69. Martin, P.; Scott, T. Glimpsing Chernobyl’s hidden hotspots. Phys. World 2019, 32, 29. [Google Scholar] [CrossRef]
  70. Banos, A.; Verbelen, Y.; Kaluvan, S.; Hutson, C.; Tucker, M.R.; Scott, T.B. Hexapod robotic system for indoor neutron and gamma radiation mapping and inspection. In Proceedings of the 2022 25th International Symposium on Design and Diagnostics of Electronic Circuits and Systems (DDECS), Prague, Czech Republic, 6–8 April 2022; pp. 48–53. [Google Scholar] [CrossRef]
  71. Tsitsimpelis, I.; Taylor, C.J.; Lennox, B.; Joyce, M.J. A review of ground-based robotic systems for the characterization of nuclear environments. Prog. Nucl. Energy 2019, 111, 109–124. [Google Scholar] [CrossRef]
  72. Connor, D.; Martin, P.G.; Scott, T.B. Airborne radiation mapping: Overview and application of current and future aerial systems. Int. J. Remote. Sens. 2016, 37, 5953–5987. [Google Scholar] [CrossRef] [Green Version]
  73. Connor, D.T.; Wood, K.; Martin, P.G.; Goren, S.; Megson-Smith, D.; Verbelen, Y.; Chyzhevskyi, I.; Kirieiev, S.; Smith, N.T.; Richardson, T.; et al. Radiological mapping of post-disaster nuclear environments using fixed-wing unmanned aerial systems: A study from Chornobyl. Front. Robot. 2020, 6, 149. [Google Scholar] [CrossRef] [PubMed] [Green Version]
  74. Hellfeld, D.; Barton, P.; Gunter, D.; Haefner, A.; Mihailescu, L.; Vetter, K. Real-time free-moving active coded mask 3D gamma-ray imaging. IEEE Trans. Nucl. Sci. 2019, 66, 2252–2260. [Google Scholar] [CrossRef]
  75. Vetter, K.; Barnowksi, R.; Haefner, A.; Joshi, T.H.; Pavlovsky, R.; Quiter, B.J. Gamma-Ray imaging for nuclear security and safety: Towards 3D gamma-ray vision. Nucl. Instrum. Methods Phys. Res. Sect. A Accel. Spectrometers Detect. Assoc. Equip. 2018, 878, 159–168. [Google Scholar] [CrossRef]
  76. Haefner, A.; Barnowski, R.; Luke, P.; Amman, M.; Vetter, K. Handheld real-time volumetric 3D gamma-ray imaging. Nucl. Instrum. Methods Phys. Res. Sect. A Accel. Spectrometers Detect. Assoc. Equip. 2017, 857, 42–49. [Google Scholar] [CrossRef] [Green Version]
  77. White, S.R.; Wood, K.T.; Martin, P.G.; Connor, D.T.; Scott, T.B.; Megson-Smith, D.A. Radioactive Source Localisation via Projective Linear Reconstruction. Sensors 2021, 21, 807. [Google Scholar] [CrossRef]
Figure 1. Gamma spectroscopy in field-deployed nuclear industrial archaeology. (Left) a portable NaI(Tl) gamma spectrometer of type Mirion SPIR-Ace [52] used to measure gamma radiation dose rates in excess of 1.0 mSv h 1 on the outside of a pipe connecting a mixer–settler tank in a legacy uranium ore processing facility. (Right) a collimated gamma spectrometer [53] mounted on a pan-tilt unit and suspended on a tripod to map contamination in an industrial environment [51].
Sustainability 15 06178 g001
Figure 2. A portable XRF analyser (type: Olympus Vanta) used for in situ nuclear industrial archaeology of samples in a legacy uranium ore processing facility. (Left) Nuclear industrial archaeology of contamination on construction material. (Right) Nuclear industrial archaeology of a spill of ionic exchange resins.
Sustainability 15 06178 g002
Figure 3. Optical microscopy of ion exchange resin spill, observed in situ. To the naked eye, this was indistinguishable from finely ground ore sand, but its real nature became clear under the microscope (see Figure 2) which also enabled a particle size distribution and morphology to be characterised.
Sustainability 15 06178 g003
Figure 4. A cross-section of the wireframe photogrammetry survey of floor two of one of the legacy ore processing buildings, PChP.
Sustainability 15 06178 g004
Figure 5. A cross-section of the solid model photogrammetry survey of floor two of one of the legacy ore processing buildings, PChP.
Sustainability 15 06178 g005
Figure 6. A cross-section of the textured photogrammetry survey of floor two of one of the legacy ore processing buildings, PChP.
Sustainability 15 06178 g006
Figure 7. A poster which was spotted after the fact, during an examination of the 3D reconstruction of the site. The image has been enhanced for clarity.
Sustainability 15 06178 g007
Figure 8. Deploying a remote-controlled wheeled ground vehicle equipped with gamma spectrometer and neutron detector in an environment with radioactive contamination.
Sustainability 15 06178 g008
Disclaimer/Publisher’s Note: The statements, opinions and data contained in all publications are solely those of the individual author(s) and contributor(s) and not of MDPI and/or the editor(s). MDPI and/or the editor(s) disclaim responsibility for any injury to people or property resulting from any ideas, methods, instructions or products referred to in the content.

