1. Introduction
Tourism is a vital, comprehensive, and supporting industry that has experienced sustained, high-speed, and stable growth in the global economic system [
1,
2]. With the deepening of economic globalization, the tourism industry has entered a golden age and has emerged as one of the fastest-growing sectors in the global economy [
3]. However, the rapid development of tourism has led to a range of social and environmental problems, including ecological damage and the erosion of cultural heritage [
4]. As a result, the development of sustainable tourism has become a crucial solution to address these issues and has drawn the attention of both the tourism industry and academia [
5].
Sustainable tourism is a new approach to tourism development that prioritizes the preservation of the ecological environment, the protection of cultural heritage, the advancement of community economies, and social development [
6]. This model requires careful consideration of the impacts on ecology, culture, and society in all aspects of tourism planning, management, and operation to achieve a harmonious balance between tourism development, ecological protection, cultural heritage preservation, and community development [
7,
8]. Sustainable tourism is not only a growing trend in the tourism industry but also an essential component of global economic sustainability.
Against the backdrop of economic globalization, resource depletion, environmental degradation, and population growth have become increasingly prominent issues, with ecological and environmental challenges posing significant obstacles to sustainable development [
9,
10]. The Hanjiang River Basin, known for its rich historical heritage and abundant tourism resources, is one of the most important tourist regions in China and a crucial economic support and ecological barrier in the Yangtze River Basin [
1]. However, excessive development and unreasonable utilization have led to varying degrees of damage to the tourism ecological environment in the area. According to multiple data sources, China welcomed 6.002 billion domestic tourists and 145.31 million inbound tourists and generated a total tourism revenue of 6.63 trillion yuan in 2019 [
1,
11]. The intensive human activities associated with tourism inevitably magnify the pressure on the ecological environment of the Hanjiang River Basin [
12,
13]. As a vital component of the tertiary industry, high-quality tourism development is an imperative requirement. Therefore, balancing the development of the tourism economy and ecological environmental protection has become a pressing issue that must be addressed in the Hanjiang River Basin [
14,
15].
Ecological efficiency refers to achieving maximum economic output while consuming the least amount of resources and incurring the least environmental cost under certain ecological conditions [
16]. This concept evaluates the relationship between economic development and resource utilization, and is commonly used to assess the degree of resource and environmental utilization [
17,
18]. In the tourism industry, which has both economic and ecological benefits, measuring tourism ecological efficiency is crucial to evaluate the impact on the local ecological environment while promoting economic development [
19]. Tourism ecological efficiency can be defined as the relationship between the economic value created by tourism activities and the utilization of ecological resources [
20,
21]. Optimizing tourism resource allocation, strengthening environmental protection management, and improving technology levels within the tourism industry can improve tourism ecological efficiency [
22]. By doing so, the tourism industry can achieve economic benefits while maximizing the protection of the ecological environment, laying a solid foundation for sustainable development [
23,
24,
25].
It is important to avoid prioritizing economic benefits over ecological environmental protection when improving tourism ecological efficiency [
26]. Thus, adhering to the concept of sustainable development, balancing economic development and ecological environment protection, and adopting effective measures to ensure the long-term sustainability of the tourism industry are crucial [
27]. By evaluating tourism ecological efficiency and implementing sustainable development practices, we can achieve economic growth while minimizing negative impacts on the environment. This will help ensure the long-term sustainability of the tourism industry and contribute to the protection of the ecological environment.
The development of sustainable tourism plans and policies has become crucial for the tourism industry in the Hanjiang River Basin [
28,
29]. Such plans and policies should prioritize protecting the ecological environment and promoting the economic and social development of local communities. However, few studies have focused on the tourism ecological efficiency of this important region that connects western and eastern China. To address this gap in the literature, this article explores the spatiotemporal evolution of tourism ecological efficiency in the Hanjiang River Basin. Our aim is to provide insights into the organic combination of tourism development, ecological protection, cultural heritage preservation, and community development in the region and to expand the application of the Super-Efficiency SBM model. This study provides a reference for promoting sustainable tourism in the area by analyzing the spatiotemporal evolution of tourism development. It also contributes theoretical analysis to the application of the A Super-Efficiency Slacks-Based Measure Model in the field of tourism eco-efficiency, offering valuable insights for policymakers and stakeholders.
2. Theoretical Background
2.1. Sustainable Tourism
The concept of sustainable tourism is derived from the broader theory of sustainable development, which prioritizes long-term, stable, and sustainable development while emphasizing fairness among contemporaries, future generations, countries, and ethnic groups [
30]. This theory reflects a growing recognition of the destructive impact of human activities on the ecological environment and underscores the importance of balancing efficiency and fairness goals [
31,
32].
Sustainable tourism aims to promote the sustainability of the tourism industry by reducing tension and conflict that may arise from the complex interactions between the industry, tourists, the environment, and local communities while maintaining the quality of natural and cultural resources [
33,
34]. Its central goal is to protect and enhance opportunities for future use while meeting the needs of tourists and local communities, ensuring the preservation of essential ecological processes and biodiversity, and supporting local livelihoods [
5,
35].
To achieve sustainable tourism development, several requirements must be met, including addressing the needs of local residents, meeting the growing demand for tourism, and protecting the environment [
8,
36]. Achieving this balance is essential for promoting sustainable tourism development, which can help to preserve natural and cultural resources, support local communities, and promote economic growth in a responsible and sustainable manner [
37,
38].
2.2. Ecological Efficiency
Ecological efficiency is a critical concept in ecology that measures the efficiency of energy, matter, and information use in an ecosystem [
39,
40]. It is crucial for the stability and sustainability of an ecosystem and its ability to respond to external disturbances [
41]. By understanding ecosystem function and implementing protection and restoration measures, we can strike a balance between environmental protection and healthy economic development [
42,
43]. This is essential to minimize negative environmental impact during rapid economic growth and to achieve ecological civilization [
44,
45].
Two key indicators of ecological efficiency are production efficiency and ecological efficacy [
46,
47,
48]. Production efficiency measures an ecosystem’s ability to produce biomass in a given unit of time [
49,
50], while ecological efficacy measures how well an ecosystem converts solar energy into useful chemical energy [
51,
52]. Improving ecological efficiency requires enhancing both production efficiency and ecological efficacy, which can be achieved by increasing nutrient input, reducing ecosystem losses, and improving material cycling and energy utilization efficiency [
53,
54].
Balancing economic development with environmental protection is crucial for achieving ecological efficiency, which can be seen as a means of achieving sustainable development [
55,
56]. By promoting ecological efficiency, we can support sustainable economic growth while minimizing negative environmental impacts [
57]. This requires a comprehensive and integrated approach that takes into account the economic, social, and environmental dimensions of sustainable development.
2.3. Tourism Ecological Efficiency
Tourism ecological efficiency is a critical branch of ecological efficiency research that explores the impact of tourism on the environment [
58]. To promote sustainable tourism development, it is essential to consider not only the economic and social benefits but also the environmental impact of tourism [
59,
60,
61]. The concept of tourism ecological efficiency aims to achieve a sustainable balance between ecology, society, and the economy by considering the development of the tourism industry from the perspective of ecological efficiency [
62,
63,
64].
Tourism ecological efficiency is based on the core concept of reducing the use of the environment and resources while producing goods and services [
65]. Various research methods can measure tourism ecological efficiency, including life cycle costs, life cycle assessment, and input-output analysis [
66,
67]. The study of tourism ecological efficiency is critical for achieving sustainable development in the tourism industry, protecting the environment and enhancing the economic benefits of tourism [
68,
69].
The goal of tourism ecological efficiency is to minimize tourism resource input while maximizing tourism economic benefits and minimizing negative impacts on the environment, thus achieving a friendly coexistence between the tourism economy and the ecological environment [
70,
71,
72,
73]. The evaluation criteria of tourism ecological efficiency can include multiple indicators, such as the efficient utilization of tourism resources, the quality of the ecological environment, and the economic benefits of tourism. By studying and evaluating tourism ecological efficiency, researchers can provide useful references and guidance for the sustainable development of the tourism industry.
3. Study Area Overview
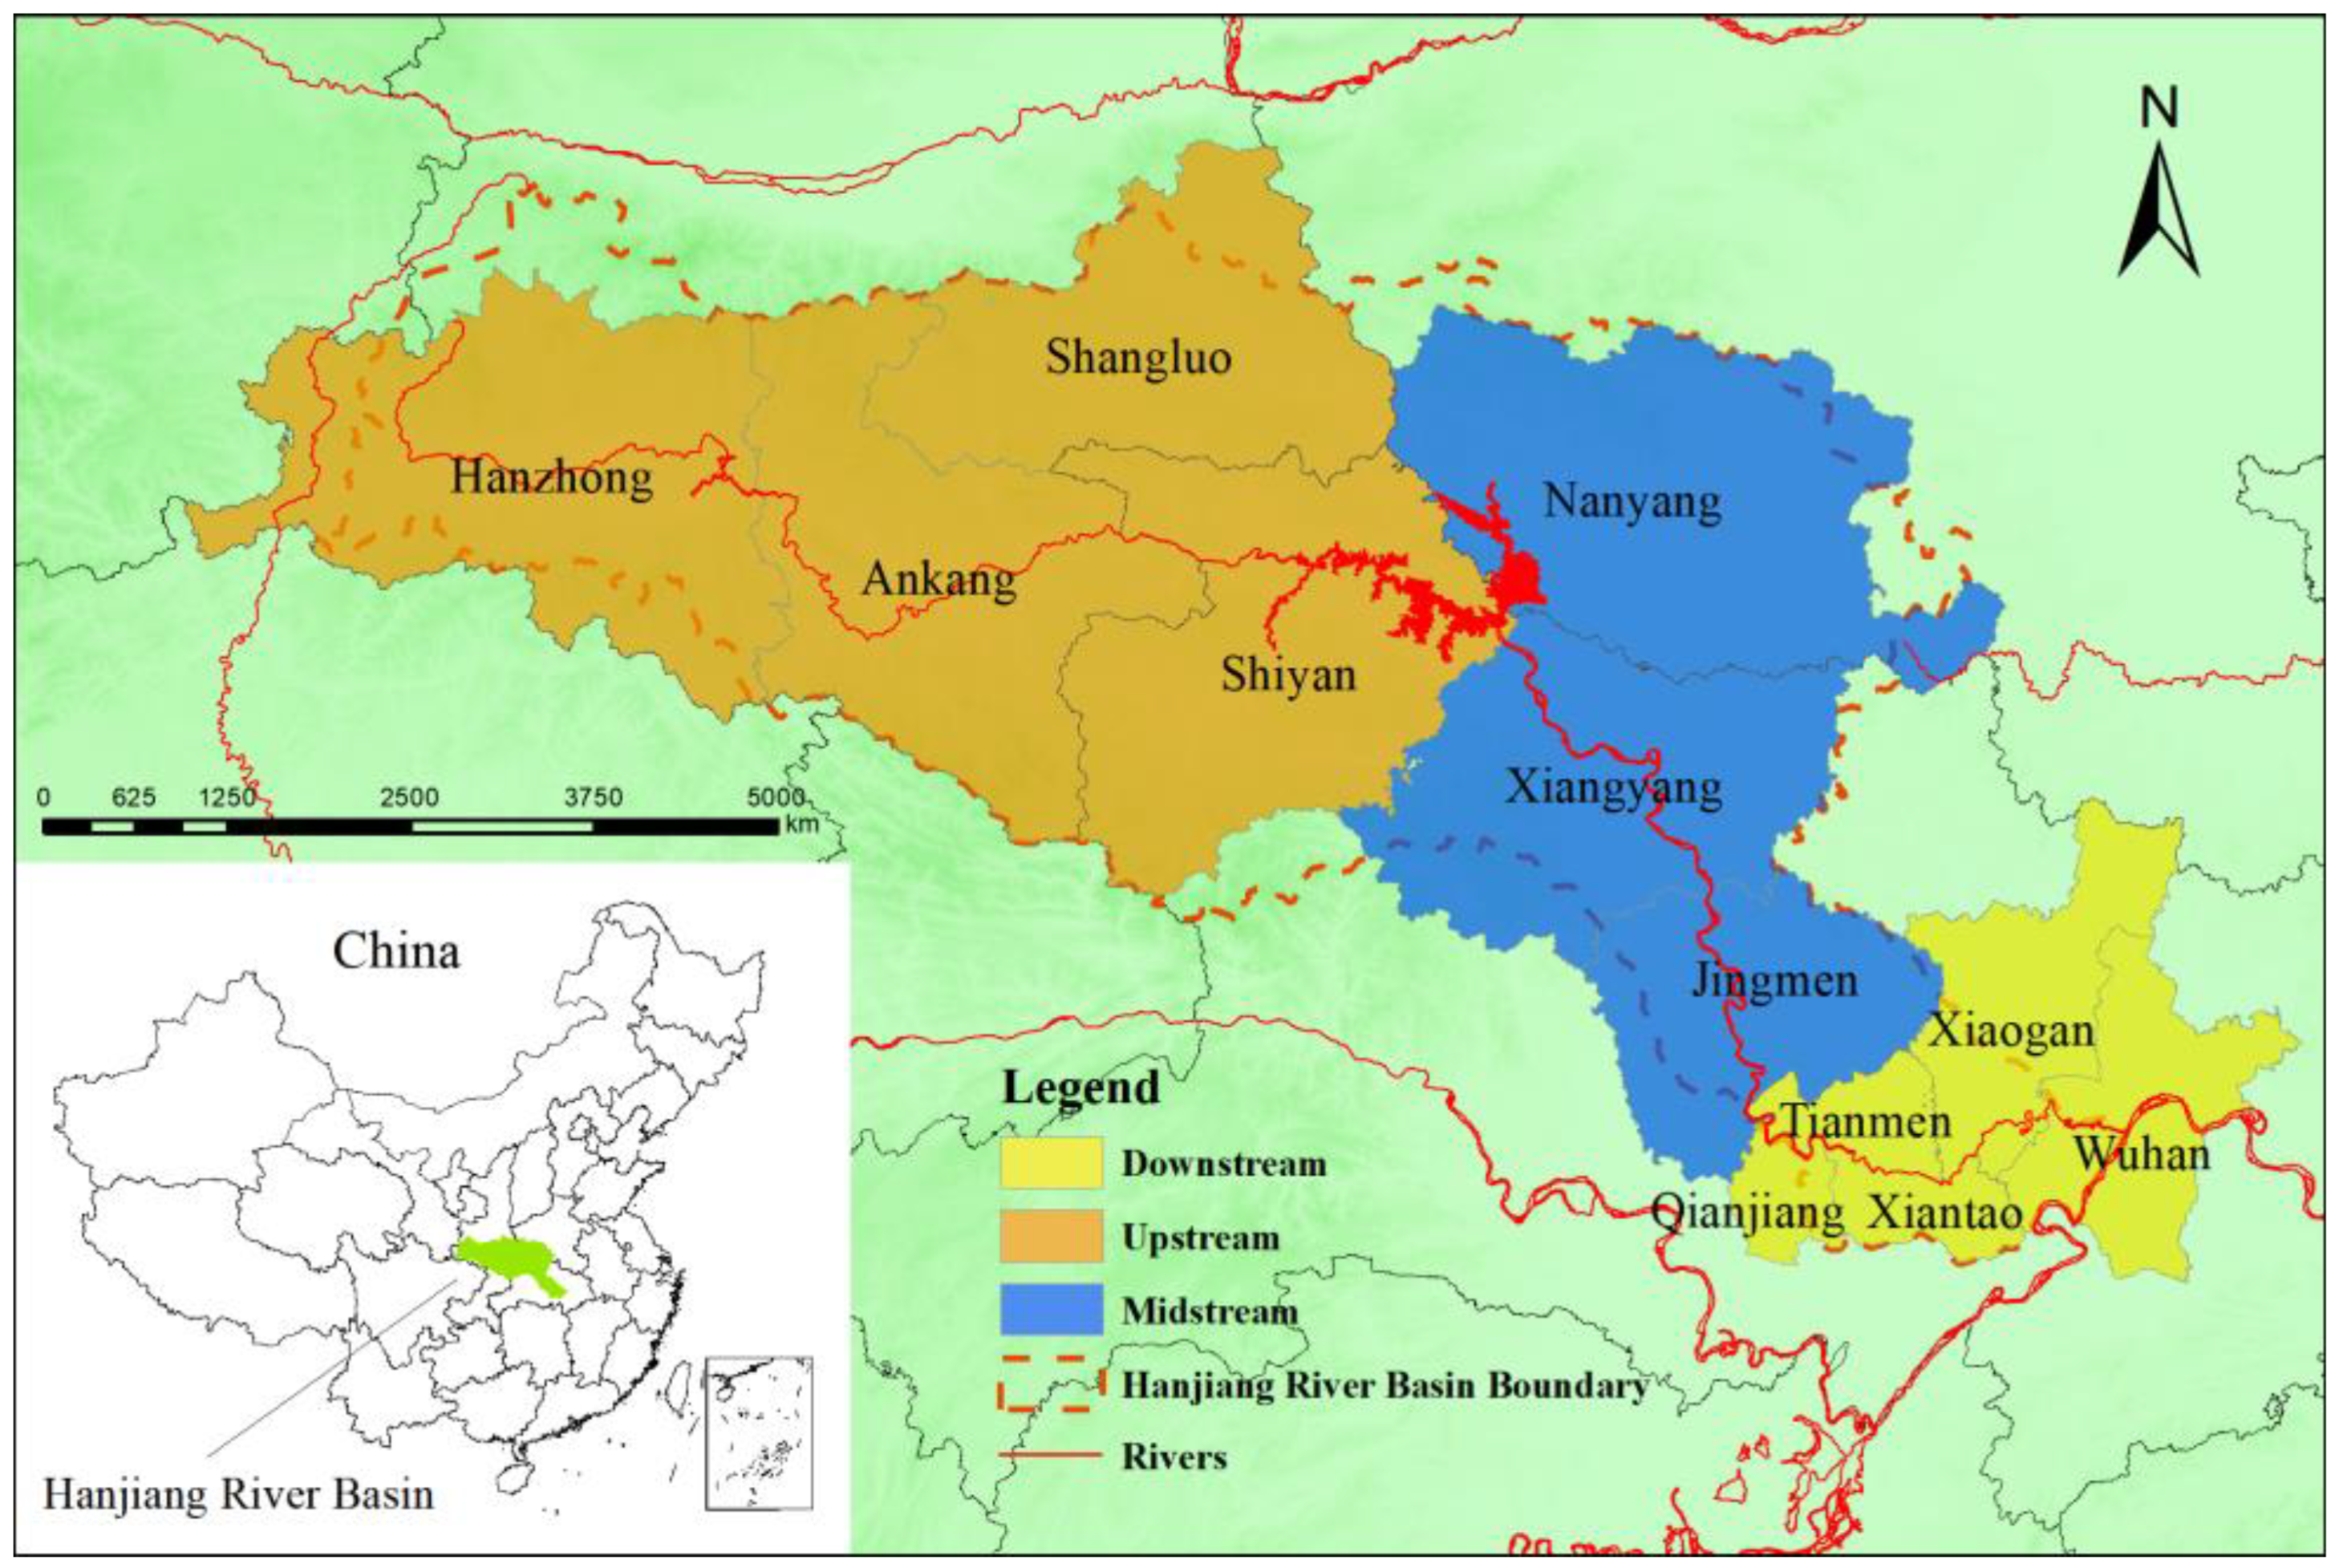
The Hanjiang River Basin is a geographically important area in central China, with a total length of 1577 km and a catchment area of approximately 159,000 square kilometers [
74], as shown in
Figure 1. The region spans six provinces and municipalities: Hubei, Shaanxi, Henan, Sichuan, Yunnan, and Gansu, covering a total of 20 cities and districts. Its geographic coordinates are 106°12′–114°35′ E, 30°6′–34°23′ N. The Hanjiang River Basin crosses the second and third geological structures in China from west to east, resulting in a complex and diverse landscape, including undulating mountainous terrain, gentle plains, and hilly terrain [
75].
The Hanjiang River Basin is one of China’s important grain-producing regions, with early agricultural development, a good industrial foundation, and abundant mineral resources, including gold, lead, nickel, and copper. In addition, the Danjiangkou Reservoir, which has been incorporated into the South-to-North Water Diversion Project, providing important water transfer and flood control functions and having a high ecological value [
76], is important in the Hanjiang River Basin.
However, with rapid economic development and accelerated urbanization, the Hanjiang River Basin is facing environmental pollution and ecological destruction. A large amount of untreated domestic and industrial wastewater is discharged into the Han River, exacerbating the problem of water pollution. Human activities such as sand and gravel mining, shore slope hardening, and overfishing have also had a certain impact on the ecosystem of the Hanjiang River Basin, threatening biodiversity and the sustainable development of the ecological environment.
From a tourism perspective, the Hanjiang River Basin also boasts rich natural landscapes and a historical and humanistic landscape, such as the Three Gorges, Shennongjia, Lushan Mountain, and Emei Mountain. Among them, the Three Gorges is one of China’s famous tourist attractions, attracting a large number of tourists with its spectacular natural scenery and unique cultural connotations [
1,
2]. However, the development of tourism has also brought a series of problems, such as excessive development of scenic areas and insufficient environmental protection awareness among tourists, conditions that need to be addressed.
In conclusion, the Hanjiang River Basin is not only an economically important region in China but also an area rich in ecological environment and tourism resources. It is necessary to strengthen environmental protection and sustainable development to achieve coordinated development of the economy, society, and environment.
4. Data and Methods
4.1. Construction of the Evaluation System
Based on previous literature [
77], this study has developed an evaluation index for the ecological efficiency of tourism in the Hanjiang River Basin. The index consists of two levels of indicators, namely input and output indicators, which are presented in
Table 1.
Regarding the input indicators, this article addresses the scores of A-level scenic spots, the number of star-rated hotels, fixed asset investment in tourism, and the number of tourism employees as indicators of tourism resources, services, capital, and labor input. Among them, the study employs the A-level scenic spot score to characterize resource input. Considering that different levels of scenic spots have different impacts, the study adopts a scoring method based on previous research [
77,
78], using a weighted sum of scores for each level of scenic spots to calculate the A-level scenic spot score. The scoring method used the landscape-quality scoring criteria specified in the “Classification and Evaluation of Tourist Scenic Area Quality Grades”: 1A—50 points; 2A—60 points; 3A—75 points; 4A—85 points; and 5A—90 points. The study takes the lowest score specified for the corresponding level of scenic spots as the value of the tourism resource input for that level. In addition, the study selects the number of star-rated hotels to represent service input and fixed asset investment in tourism to represent capital input. Since the data are not yet available for the city, the study refers to relevant research and converts it by multiplying the fixed asset investment in the tertiary industry by the proportion of tourism. For labor input, the study selects the number of tourism employees, and the calculation method is the same as above.
Regarding the output indicators, this article selects the total tourism revenue and total tourism reception as expected output indicators to measure tourism performance and attractiveness. In selecting ecological environment indicators, tourism carbon emissions are the most commonly used. However, due to the difficulty in obtaining government-protected data on the number of tourists for transportation, accommodation, and other activities, the study selects the discharge of tourism wastewater, sulfur dioxide, and smoke as indicators of unexpected output. Since cities do not separately account for the “three wastes” of the tourism industry, the study refers to previous research and converts it by using the ratio of tourism revenue to GDP [
79,
80]. The calculation of tourism wastewater discharge is wastewater discharge × (tourism revenue/GDP). The calculation process for tourism sulfur dioxide emissions and tourism smoke emissions is the same as above.
Based on the natural river basin as the basic support, considering the integrity of the geographical unit and the direct relationship between the regional economy and the Hanjiang River Basin, combined with data availability, the study area selected 12 prefecture-level cities, including the upstream areas of Hanzhong, Ankang, Shangluo, Shiyan, etc., the middle reaches of Nanyang, Xiangyang, Jingmen, etc., and the downstream areas of Qianjiang, Tianmen, Xiantao, Xiaogan, and Wuhan. Data sources include statistical yearbooks, tourism yearbooks, national economic and social development bulletins, and the website of the Ministry of Culture and Tourism from 2010 to 2019.
It should be noted that to eliminate the deviation caused by price fluctuations, this article uses 2010 as the base year to deflate tourism revenue and fixed asset investment. In addition, when a large amount of missing data arises, this article uses interpolation to supplement the data to ensure the evaluation effect.
4.2. Methods
4.2.1. Super-Efficiency SBM Model
The Super-Efficiency SBM (Slacks-Based Measure) model not only addresses the input–output slack and unexpected output problems but also ranks the efficiency values [
81,
82,
83]. In this study, the Super-Efficiency SBM model was used to measure the ecological efficiency of tourism in the Hanjiang River Basin, and the efficiency levels were divided into five grades based on previous research [
83,
84]: very high (
TE > 0.8), high (0.6 <
TE ≤ 0.8), moderate (0.4 <
TE ≤ 0.6), low (0.2 <
TE ≤ 0.4), and very low (
TE ≤ 0.2). The model construction is as follows:
where
n represents the decision-making unit, and
m,
r1, and
r2 represent input, expected output, and unexpected output, respectively.
x,
yd, and
yu represent the elements in the corresponding matrices, and
ρ represents tourism ecological efficiency.
4.2.2. Global Spatial Autocorrelation
Global spatial autocorrelation is a commonly used spatial analysis tool that describes spatial correlation from a global perspective [
85]. In geographic information systems and spatial statistics, global spatial autocorrelation is typically used to evaluate the degree of spatial clustering and dispersion of spatial data, as well as the strength and direction of spatial correlation [
86]. Moran’s
I index is commonly used to measure global spatial autocorrelation, with the following formula:
where
S2 represents the variance,
represents the mean,
xi and
xj represent the tourism ecological efficiency of the
i-th and
j-th cities, respectively,
n represents the total number of city units, and
Wij represents the spatial weight matrix. In this study, the researchers chose the geographic proximity weight matrix (
Wij = 1,
i ≠
j;
Wij = 0,
i =
j) as the base matrix, and for robustness considerations, the researchers used the geographic distance weight matrix (
W = 1/
dij,
i ≠
j;
W = 0,
i =
j;
dij represents the distance between cities) as a comparative test. Moran’s
I index is used to measure spatial autocorrelation, with values ranging from −1 to 1. When Moran’s
I > 0, it indicates that there is spatial positive correlation; when Moran’s
I < 0, it indicates that there is spatial negative correlation; and when Moran’s
I = 0, it indicates that there is no spatial autocorrelation. The calculation of Moran’s
I can help to reveal the spatial heterogeneity and correlation of tourism ecological efficiency among cities and provide support for the application of GIS and spatial statistics.
4.2.3. Local Spatial Autocorrelation
Local spatial autocorrelation is a spatial analysis tool that measures regional differences and clustering from a local perspective [
87]. Unlike global spatial autocorrelation, local spatial autocorrelation evaluates spatial differences and clustering among regions by calculating the spatial correlation between each region and its neighboring regions [
88,
89]. The specific formula for calculating local spatial autocorrelation is as follows:
The variables in the equation have the same meanings as in Equation (2). Ii represents Moran’s I index value for each region i, which ranges from −1 to 1. When Ii > 0, it indicates a spatial clustering phenomenon of high-high or low-low similarity attributes between the region and its neighboring regions. When Ii < 0, it indicates a spatial clustering phenomenon of high-low or low-high dissimilar attributes between the region and its neighboring regions. When Ii = 0, it indicates a random distribution of attributes between the region and its neighboring regions. Calculation of local spatial autocorrelation can help reveal spatial heterogeneity and clustering among regions, providing support for the application of geographic information systems and spatial statistics.
5. Results and Discussion
5.1. Temporal Changes in Tourism Ecological Efficiency
Figure 2 illustrates the temporal changes in tourism ecological efficiency in the Hanjiang River Basin from 2010 to 2019, calculated based on
Table 1 and Formula (1). The mean value of tourism ecological efficiency in the basin was 0.38 in 2010, and the overall trend showed fluctuations, with the highest value of 0.69 recorded in 2016 and the lowest value of 0.63 recorded in 2015. However, there was a significant increase in efficiency in 2019, reaching a peak of 0.73.
Regional differences in tourism ecological efficiency were observed in the basin. The upstream region consistently exhibited lower efficiency than the basin average throughout the study period but maintained an upward trend. In contrast, the middle and upper reaches of the basin showed a stable increase in efficiency from 2010 to 2014, followed by fluctuations and reversals from 2014 to 2017 and a subsequent upward trend. The efficiency values in the middle and upper reaches of the basin consistently exceeded the basin average, while the downstream region showed a slower rate of increase in efficiency compared to the upstream and middle reaches. The tourism ecological efficiency in the Hanjiang River Basin can be classified into three stages: growth stage (2010–2014), fluctuation stage (2014–2017), and growth stage (2017–2019). This classification reflects a fluctuating trend of first increasing, then decreasing, and then increasing again. Furthermore, the increase in efficiency in the upstream and middle reaches was significantly greater than that in the downstream reaches.
In conclusion, this study offers valuable insights into the temporal changes and regional differences in tourism ecological efficiency in the Hanjiang River Basin. Targeted policy interventions are necessary to improve tourism ecological efficiency in the downstream region while sustaining growth in the upstream and middle reaches. Implementing these measures can promote sustainable tourism development in the basin.
5.2. Spatial Distribution in Tourism Ecological Efficiency
Figure 3 illustrates the regional differences and spatial evolution characteristics of tourism ecological efficiency in the Hanjiang River Basin, which was divided into low, medium, and high levels according to the rule of “0-0.36-0.66-1”. In 2010, only Shiyan City in the upper reaches reached the medium level, while the other cities were at the low level. In contrast, the middle and lower reaches reached the medium level, with some cities even reaching the high level. This indicates that the tourism ecological efficiency in the western upper reaches is significantly lower than that in the eastern middle and lower reaches, with significant spatial differences and a staircase-like decreasing spatial pattern from the downstream to the upstream.
Over time, the number of low-level areas in the upper reaches decreased, while the number of medium- and high-level areas increased. In 2014, all cities in the upper reaches improved their tourism ecological efficiency to the medium level, and the first high-level area appeared in 2015 in Shiyan City. Ankang City was also upgraded to a high-level area in 2019. The middle reaches had the first high-level area in 2013 in Jingmen City, and all cities in the middle reaches were upgraded to high-level areas in 2016, with Nanyang City having the highest tourism ecological efficiency in 2019. The downstream had the highest average level of tourism ecological efficiency, and in 2013, all cities except Qianjiang City reached the high-level area. These findings indicate that the tourism ecological efficiency of the entire Hanjiang River Basin significantly improved during the study period, and the regional differences gradually narrowed.
The current study conducted a comparative analysis of the spatial distribution of effective decision-making units in the Hanjiang River Basin. Two cities in the upper reaches reached DEA effectiveness, with a mean of 1.074, and Shiyan City had the highest efficiency. Two cities in the middle reaches reached DEA effectiveness, with a mean of 1.232, and Xiangyang City had the highest efficiency. Four cities downstream reached DEA effectiveness, with a mean of 1.317, and Wuhan City had the highest efficiency. In terms of quantity, the downstream had the most cities that reached DEA effectiveness, while the middle and upper reaches had fewer. In terms of efficiency, the cities that reached DEA effectiveness downstream had higher efficiency levels, followed by those in the middle reaches, while the upper reaches had the lowest efficiency levels. Moreover, economically developed cities had higher efficiency levels than other cities, regardless of their position in the basin.
In conclusion, the spatial differences in tourism ecological efficiency in the Hanjiang River Basin are significant, showing a staircase-like decreasing spatial distribution pattern from downstream to upstream. While regional differences have gradually narrowed, there is still a need to strengthen the coordination and integration of ecological protection and tourism development. Among cities that reach the same effective decision-making unit, those in the downstream reaches show a higher efficiency level than those in the middle and upper reaches. Moreover, economically developed cities exhibit higher efficiency levels than other cities.
5.3. Global Spatial Autocorrelation Analysis
Table 2 shows that the global Moran’s
I index results for tourism ecological efficiency in the Hanjiang River Basin, considering geographical proximity and the geographical distance weight matrix, indicate significant positive spatial correlation in the region. This means that changes in tourism ecological efficiency in a certain area depend not only on their own intrinsic factors but also on the influence of neighboring areas. This spatial correlation may be related to the geographical environment and population distribution in the basin. For example, upstream areas may face challenges in developing and utilizing tourism resources due to high mountains, dangerous roads, and inconvenient transportation, affecting tourism ecological efficiency. In contrast, downstream areas with flat terrain, convenient transportation, and a large population may have more tourism resources and better tourism services, increasing tourism ecological efficiency [
1]. Moreover, the development of tourism may also be influenced by factors such as policies, economy, and culture, which may differ in different regions, further exacerbating the spatial correlation of tourism ecological efficiency in the Hanjiang River Basin.
Furthermore, the trend analysis indicates that the agglomeration intensity of tourism ecological efficiency in the Hanjiang River Basin shows a “reverse U-shaped” trend, increasing first and then decreasing. This suggests that there is a strong spatial dependence of tourism ecological efficiency in the early stage, where similar tourism ecological efficiency tends to be concentrated in adjacent areas, and this dependence gradually weakens over time. This trend may be related to the development stage of tourism and policy adjustments [
90]. In the early stage of tourism, there may be relatively few tourism resources and relatively single tourism products, leading to a more obvious spatial agglomeration of tourism ecological efficiency [
91,
92]. However, with the rapid development of tourism and continuous policy adjustments, tourism resources and products in different regions are better developed and utilized, and the spatial distribution of tourism ecological efficiency tends to be stable.
In conclusion, tourism ecological efficiency in the Hanjiang River Basin exhibits clear spatial agglomeration and dependence characteristics. Its formation mechanism may be related to various factors, including the geographical environment, population distribution, tourism development stage, and policy adjustments.
5.4. Local Spatial Autocorrelation Analysis
Figure 4 illustrates the local spatial correlation and agglomeration of tourism ecological efficiency in the Hanjiang River Basin, with four time points selected for analysis: 2010, 2013, 2016, and 2019. The number of high-high agglomerations was the highest and mainly distributed downstream of the Hanjiang River, shifting to the middle reaches in 2019. Cities with low-low agglomerations were mainly concentrated upstream of the Hanjiang River.
In terms of distribution patterns, high-high and low-low agglomerations showed a concentrated and contiguous distribution, while low-high and high-low agglomerations displayed a divergent distribution. This spatial agglomeration phenomenon indicates a significant spatial peer effect of tourism ecological efficiency in the Hanjiang River Basin, especially under the low-level homogenized agglomeration state. This may be related to the geographical environment and tourism resource distribution in the basin. For example, the downstream area of the Hanjiang River has abundant tourism resources and a high level of tourism services, leading to a strong correlation between the tourism ecological efficiency of adjacent cities. In contrast, the upstream area has scattered tourism resources and a relatively low level of tourism services, resulting in a weaker correlation with tourism ecological efficiency [
1,
93,
94].
Furthermore, it can be observed that the spatial agglomeration of tourism ecological efficiency in the Hanjiang River Basin presents a local spatial pattern characterized by “the low remain low and the high remain high”, that is, the low-level homogenized agglomeration state is relatively stable, and the high-level homogenized agglomeration state is also relatively stable. This local spatial pattern may be related to the market competition mechanism of the tourism industry. In the fiercely competitive tourism market, excellent tourism enterprises and destinations have strong competitive advantages, further exacerbating the high-level homogenized agglomeration state and making the differences in tourism ecological efficiency more pronounced [
95,
96].
In conclusion, the significant spatial agglomeration of tourism ecological efficiency in the Hanjiang River Basin holds great significance for sustainable tourism development and regional economic growth.
6. Limitations and Future Work
This study provides a detailed examination of tourism ecological efficiency at the city level, expands the application of the Super-Efficiency SBM model, and focuses on the Hanjiang River Basin, which connects western and eastern China. The findings are significant for the ecological protection and high-quality development of tourism in the basin.
Despite the progress made, we must acknowledge the limitations of this study. One limitation is the use of converted city-level environmental pollution data as a non-desirable output due to data availability issues, which may contain errors. In addition, the latest available data is from 2019, chosen to ensure data consistency and availability, but makes it difficult to fully consider the impact of COVID-19 on the tourism industry in the Hanjiang River Basin.
Future research can address these limitations by conducting field research to obtain tourism-related data for cities in the Hanjiang River Basin and analyzing the spatial differentiation of tourism ecological efficiency and the extent of spatial spillover effects. This will help reveal the driving mechanisms of spatial spillover in different areas of the basin (upstream and downstream). Additionally, data can be collected from multiple sources for the period 2019–2022 (during the COVID-19 pandemic) to study the impact of COVID-19 on tourism ecological efficiency in the Hanjiang River Basin and beyond in China.
We believe that this study’s contributions and limitations, along with future research directions, will advance the understanding of tourism ecological efficiency in the Hanjiang River Basin and facilitate sustainable tourism development in the region.
7. Conclusions
This study used panel data from 12 prefecture-level cities in the Hanjiang River Basin to measure tourism ecological efficiency and conducted spatiotemporal evolution and spatial clustering analysis. Through a dynamic perspective analysis, the current situation and trends of tourism ecological protection and high-quality development in the Hanjiang River Basin were revealed. The study found the following:
The tourism ecological efficiency in the Hanjiang River Basin from 2010 to 2019 showed a phased characteristic, with overall significant growth. Specifically, tourism ecological efficiency first rose and then fell. This phased change was due to the Chinese government’s issuance of a series of regulations from 2014 to 2017 to promote the improvement of tourism ecological efficiency [
13,
97,
98]. However, with the development of tourism, the accompanying environmental impact became increasingly prominent, and the bottleneck of tourism ecological resources became apparent, resulting in a decrease in efficiency values.
The horizontal comparison of tourism ecological efficiency values of the upstream, middle reaches, and downstream in the Hanjiang River Basin shows that the efficiency value of the upstream has always been below the basin average due to factors such as inconvenient location and transportation, fragile ecological environment, and weak economic foundation for tourism development. However, with the support of national policies, the upstream has accelerated its tourism development pace by taking advantage of its “latecomer advantage” while causing less ecological damage, resulting in a continuous increase in efficiency values [
11]. The efficiency values of the middle and downstream have remained stable above the basin average but have been fluctuating since 2014. This indicates that negative impacts accumulated from excessive development of tourism resources in the middle and downstream have become apparent, causing a decline in tourism ecological efficiency due to environmental pollution and ecological imbalance. Therefore, finding new growth points is necessary for high-quality tourism development.
The tourism ecological efficiency in the Hanjiang River Basin exhibits heterogeneity in spatial distribution, with a spatial pattern of decreasing efficiency values from downstream to upstream in a stepwise manner. Although the spatial differences are significant, they show a trend of narrowing. This spatial difference pattern is closely related to the level of economic development, tourism resource endowment, natural environment, and other factors. The relatively favorable economic foundation of the downstream provides financial support for tourism pollution control, and advanced technology provides technical support for tourism development and protection, leading to a leading level of efficiency. The efficiency value of the middle reaches is average due to the extensive development of resources causing damage to the ecological environment, and the growth of the tourism economy comes with a certain cost in resources and the environment. The efficiency value of the upstream is the lowest due to the relatively weak economic foundation, inconvenient transportation, backward environmental protection technology, and fragile ecological environment under natural constraints, resulting in lower efficiency values than with the middle and downstream.
The overall spatial agglomeration intensity in the Hanjiang River Basin exhibits a “U-shaped” trend of increasing and then decreasing, with spatial dependence also showing a similar trend. This process indicates that the distribution of tourism ecological efficiency in the basin has significant spatial agglomeration and dependence characteristics, with a significant spatial peer effect, especially under the low-level homogenized agglomeration state. Green, high-quality tourism development in the region needs to consider the impact of neighboring cities, and the tourism industry should adopt strategies to strengthen cooperation and coordination between surrounding cities to achieve more efficient resource utilization and better-quality tourism products.
This study analyzed the spatial agglomeration and dependency characteristics of tourism ecological efficiency in the Han River Basin, providing support for sustainable tourism management in the area. To achieve more efficient resource utilization and better tourism product development, regional governments should adopt strategies that strengthen cooperation and coordination among surrounding cities, promoting a fairer and more sustainable tourism industry. Moreover, this study expanded the application scope of the Super-Efficiency SBM model by evaluating tourism ecological efficiency and establishing an evaluation index system for regional tourism efficiency, making significant theoretical contributions to the field.
Overall, the findings of this study offer valuable insights for policymakers and stakeholders in the tourism industry. By highlighting the importance of sustainable tourism development and providing a framework for evaluating tourism ecological efficiency, this research can help guide future efforts to promote sustainable tourism in the Han River Basin and beyond.
Author Contributions
Conceptualization, K.Z.; methodology, K.Z. and Y.C.; software, K.Z. and Y.C.; validation, K.Z., Y.C. and Q.Z.; formal analysis, Y.E.A., M.K., B.R. and L.D.D.; investigation, K.Z., Y.C., Q.Z., Y.E.A., M.K., B.R. and L.D.D.; resources, K.Z.; data curation, K.Z. and Y.C.; writing—original draft preparation, K.Z. and Y.C.; writing—review and editing, K.Z. and Y.C.; visualization, K.Z., Y.C., Q.Z., Y.E.A., M.K., B.R. and L.D.D.; supervision, K.Z.; project administration, K.Z. and L.D.D.; funding acquisition, K.Z. and L.D.D. All authors have read and agreed to the published version of the manuscript.
Funding
This research received no external funding.
Institutional Review Board Statement
Not applicable.
Informed Consent Statement
Not applicable.
Data Availability Statement
Data developed in this study will be made available on request to the corresponding authors.
Acknowledgments
Yufeng Cheng would like to express his sincere gratitude to Xinyi Liu for her exceptional patience, care, and support over the past years.
Conflicts of Interest
The authors declare no conflict of interest. The funders had no role in the design of the study; in the collection, analyses, or interpretation of data; in the writing of the manuscript, or in the decision to publish the results.
References
- Zhu, K.; Zhou, Q.; Cheng, Y.; Zhang, Y.; Li, T.; Yan, X.; Alimov, A.; Farmanov, E.; Dávid, L.D. Regional Sustainability: Pressures and Responses of Tourism Economy and Ecological Environment in the Yangtze River Basin, China. Front. Ecol. Evol. 2023, 11, 168. [Google Scholar] [CrossRef]
- Zhou, Q.; Zhu, K.; Kang, L.; Dávid, L.D. Tea Culture Tourism Perception: A Study on the Harmony of Importance and Performance. Sustainability 2023, 15, 2838. [Google Scholar] [CrossRef]
- Godil, D.I.; Sharif, A.; Rafique, S.; Jermsittiparsert, K. The Asymmetric Effect of Tourism, Financial Development, and Globalization on Ecological Footprint in Turkey. Environ. Sci. Pollut. Res. 2020, 27, 40109–40120. [Google Scholar] [CrossRef] [PubMed]
- Han, H. Consumer Behavior and Environmental Sustainability in Tourism and Hospitality: A Review of Theories, Concepts, and Latest Research. J. Sustain. Tour. 2021, 29, 1021–1042. [Google Scholar] [CrossRef]
- Guo, Y.; Jiang, J.; Li, S. A Sustainable Tourism Policy Research Review. Sustainability 2019, 11, 3187. [Google Scholar] [CrossRef] [Green Version]
- Chang, C.-L.; McAleer, M.; Ramos, V. A Charter for Sustainable Tourism after COVID-19. Sustainability 2020, 12, 3671. [Google Scholar] [CrossRef]
- Sheller, M. Reconstructing Tourism in the Caribbean: Connecting Pandemic Recovery, Climate Resilience and Sustainable Tourism through Mobility Justice. J. Sustain. Tour. 2021, 29, 1436–1449. [Google Scholar] [CrossRef]
- Kim, S.; Whitford, M.; Arcodia, C. Development of Intangible Cultural Heritage as a Sustainable Tourism Resource: The Intangible Cultural Heritage Practitioners’ Perspectives. J. Herit. Tour. 2019, 14, 422–435. [Google Scholar] [CrossRef]
- Khalid, S.; Ahmad, M.S.; Ramayah, T.; Hwang, J.; Kim, I. Community Empowerment and Sustainable Tourism Development: The Mediating Role of Community Support for Tourism. Sustainability 2019, 11, 6248. [Google Scholar] [CrossRef] [Green Version]
- Serrano, L.; Sianes, A.; Ariza-Montes, A. Using Bibliometric Methods to Shed Light on the Concept of Sustainable Tourism. Sustainability 2019, 11, 6964. [Google Scholar] [CrossRef] [Green Version]
- He, L.; Zha, J.; Loo, H.A. How to Improve Tourism Energy Efficiency to Achieve Sustainable Tourism: Evidence from China. Curr. Issues Tour. 2020, 23, 1–16. [Google Scholar] [CrossRef]
- Xu, H.; Jiang, F.; Wall, G.; Wang, Y. The Evolving Path of Community Participation in Tourism in China. J. Sustain. Tour. 2019, 27, 1239–1258. [Google Scholar] [CrossRef]
- Zhang, J.; Zhang, Y. Tourism, Economic Growth, Energy Consumption, and CO2 Emissions in China. Tour. Econ. 2021, 27, 1060–1080. [Google Scholar] [CrossRef]
- Yang, X.; Jia, Y.; Wang, Q.; Li, C.; Zhang, S. Space–Time Evolution of the Ecological Security of Regional Urban Tourism: The Case of Hubei Province, China. Environ. Monit Assess 2021, 193, 566. [Google Scholar] [CrossRef] [PubMed]
- Su, M.M.; Wall, G.; Wang, Y. Integrating Tea and Tourism: A Sustainable Livelihoods Approach. J. Sustain. Tour. 2019, 27, 1591–1608. [Google Scholar] [CrossRef]
- Fennell, D.A. Technology and the Sustainable Tourist in the New Age of Disruption. J. Sustain. Tour. 2021, 29, 767–773. [Google Scholar] [CrossRef]
- Umar, M.; Ji, X.; Kirikkaleli, D.; Shahbaz, M.; Zhou, X. Environmental Cost of Natural Resources Utilization and Economic Growth: Can China Shift Some Burden through Globalization for Sustainable Development? Sustain. Dev. 2020, 28, 1678–1688. [Google Scholar] [CrossRef]
- Han, H.; Guo, L.; Zhang, J.; Zhang, K.; Cui, N. Spatiotemporal Analysis of the Coordination of Economic Development, Resource Utilization, and Environmental Quality in the Beijing-Tianjin-Hebei Urban Agglomeration. Ecol. Indic. 2021, 127, 107724. [Google Scholar] [CrossRef]
- Zhang, Y.; Khan, S.U.; Swallow, B.; Liu, W.; Zhao, M. Coupling Coordination Analysis of China’s Water Resources Utilization Efficiency and Economic Development Level. J. Clean. Prod. 2022, 373, 133874. [Google Scholar] [CrossRef]
- Gössling, S.; Peeters, P.; Ceron, J.-P.; Dubois, G.; Patterson, T.; Richardson, R.B. The Eco-Efficiency of Tourism. Ecol. Econ. 2005, 54, 417–434. [Google Scholar] [CrossRef]
- Qiu, X.; Fang, Y.; Yang, X.; Zhu, F. Tourism Eco-Efficiency Measurement, Characteristics, and Its Influence Factors in China. Sustainability 2017, 9, 1634. [Google Scholar] [CrossRef] [Green Version]
- Liu, J.; Zhang, J.; Fu, Z. Tourism Eco-Efficiency of Chinese Coastal Cities—Analysis Based on the DEA-Tobit Model. Ocean Coast. Manag. 2017, 148, 164–170. [Google Scholar] [CrossRef]
- Wang, R.; Xia, B.; Dong, S.; Li, Y.; Li, Z.; Ba, D.; Zhang, W. Research on the Spatial Differentiation and Driving Forces of Eco-Efficiency of Regional Tourism in China. Sustainability 2021, 13, 280. [Google Scholar] [CrossRef]
- Peng, H.; Zhang, J.; Lu, L.; Tang, G.; Yan, B.; Xiao, X.; Han, Y. Eco-Efficiency and Its Determinants at a Tourism Destination: A Case Study of Huangshan National Park, China. Tour. Manag. 2017, 60, 201–211. [Google Scholar] [CrossRef]
- Guo, L.; Li, P.; Zhang, J.; Xiao, X.; Peng, H. Do Socio-Economic Factors Matter? A Comprehensive Evaluation of Tourism Eco-Efficiency Determinants in China Based on the Geographical Detector Model. J. Environ. Manag. 2022, 320, 115812. [Google Scholar] [CrossRef]
- An, C.; Muhtar, P.; Xiao, Z. Spatiotemporal Evolution of Tourism Eco-Efficiency in Major Tourist Cities in China. Sustainability 2022, 14, 13158. [Google Scholar] [CrossRef]
- Sun, Y.; Hou, G. Analysis on the Spatial-Temporal Evolution Characteristics and Spatial Network Structure of Tourism Eco-Efficiency in the Yangtze River Delta Urban Agglomeration. Int. J. Environ. Res. Public Health 2021, 18, 2577. [Google Scholar] [CrossRef]
- Sun, Y.; Hou, G.; Huang, Z.; Zhong, Y. Spatial-Temporal Differences and Influencing Factors of Tourism Eco-Efficiency in China’s Three Major Urban Agglomerations Based on the Super-EBM Model. Sustainability 2020, 12, 4156. [Google Scholar] [CrossRef]
- Hao, Z.; Ye, D.; Hui, W.; Zenglin, H.; Hongye, W. An Empirical Analysis of Tourism Eco-Efficiency in Ecological Protection Priority Areas Based on the DPSIR-SBM Model: A Case Study of the Yellow River Basin, China. Ecol. Inform. 2022, 70, 101720. [Google Scholar] [CrossRef]
- Liu, Z. Sustainable Tourism Development: A Critique. J. Sustain. Tour. 2003, 11, 459–475. [Google Scholar] [CrossRef] [Green Version]
- Lu, J.; Nepal, S.K. Sustainable Tourism Research: An Analysis of Papers Published in the Journal of Sustainable Tourism. J. Sustain. Tour. 2009, 17, 5–16. [Google Scholar] [CrossRef]
- Clarke, J. A Framework of Approaches to Sustainable Tourism. J. Sustain. Tour. 1997, 5, 224–233. [Google Scholar] [CrossRef]
- Rasoolimanesh, S.M.; Ramakrishna, S.; Hall, C.M.; Esfandiar, K.; Seyfi, S. A Systematic Scoping Review of Sustainable Tourism Indicators in Relation to the Sustainable Development Goals. J. Sustain. Tour. 2020, 1–21. [Google Scholar] [CrossRef]
- Streimikiene, D.; Svagzdiene, B.; Jasinskas, E.; Simanavicius, A. Sustainable Tourism Development and Competitiveness: The Systematic Literature Review. Sustain. Dev. 2021, 29, 259–271. [Google Scholar] [CrossRef]
- Higgins-Desbiolles, F. The “War over Tourism”: Challenges to Sustainable Tourism in the Tourism Academy after COVID-19. J. Sustain. Tour. 2021, 29, 551–569. [Google Scholar] [CrossRef]
- Guaita Martínez, J.M.; Martín Martín, J.M.; Salinas Fernández, J.A.; Mogorrón-Guerrero, H. An Analysis of the Stability of Rural Tourism as a Desired Condition for Sustainable Tourism. J. Bus. Res. 2019, 100, 165–174. [Google Scholar] [CrossRef]
- Della Corte, V.; Del Gaudio, G.; Sepe, F.; Sciarelli, F. Sustainable Tourism in the Open Innovation Realm: A Bibliometric Analysis. Sustainability 2019, 11, 6114. [Google Scholar] [CrossRef] [Green Version]
- Sobaih, A.E.E.; Elshaer, I.; Hasanein, A.M.; Abdelaziz, A.S. Responses to COVID-19: The Role of Performance in the Relationship between Small Hospitality Enterprises’ Resilience and Sustainable Tourism Development. Int. J. Hosp. Manag. 2021, 94, 102824. [Google Scholar] [CrossRef]
- Saling, P.; Kicherer, A.; Dittrich-Krämer, B.; Wittlinger, R.; Zombik, W.; Schmidt, I.; Schrott, W.; Schmidt, S. Eco-Efficiency Analysis by Basf: The Method. Int. J. LCA 2002, 7, 203–218. [Google Scholar] [CrossRef]
- Archi, Y.E.; Benbba, B.; Nizamatdinova, Z.; Issakov, Y.; Vargáné, G.I.; Dávid, L.D. Systematic Literature Review Analysing Smart Tourism Destinations in Context of Sustainable Development: Current Applications and Future Directions. Sustainability 2023, 15, 5086. [Google Scholar] [CrossRef]
- Caiado, R.G.G.; de Freitas Dias, R.; Mattos, L.V.; Quelhas, O.L.G.; Leal Filho, W. Towards Sustainable Development through the Perspective of Eco-Efficiency-A Systematic Literature Review. J. Clean. Prod. 2017, 165, 890–904. [Google Scholar] [CrossRef] [Green Version]
- Hickel, J. The Sustainable Development Index: Measuring the Ecological Efficiency of Human Development in the Anthropocene. Ecol. Econ. 2020, 167, 106331. [Google Scholar] [CrossRef]
- Erdeli, G.; Dinca, A.I. Tourism–A Vulnerable Strength in the Protected Areas of the Romanian Carpathians. Procedia-Soc. Behav. Sci. 2011, 19, 190–197. [Google Scholar] [CrossRef] [Green Version]
- Huppes, G.; Ishikawa, M. A Framework for Quantified Eco-Efficiency Analysis. J. Ind. Ecol. 2005, 9, 25–41. [Google Scholar] [CrossRef]
- Huang, J.; Yang, X.; Cheng, G.; Wang, S. A Comprehensive Eco-Efficiency Model and Dynamics of Regional Eco-Efficiency in China. J. Clean. Prod. 2014, 67, 228–238. [Google Scholar] [CrossRef]
- Font, X.; English, R.; Gkritzali, A.; Tian, W. (Stella) Value Co-Creation in Sustainable Tourism: A Service-Dominant Logic Approach. Tour. Manag. 2021, 82, 104200. [Google Scholar] [CrossRef]
- Nepal, R.; Indra al Irsyad, M.; Nepal, S.K. Tourist Arrivals, Energy Consumption and Pollutant Emissions in a Developing Economy–Implications for Sustainable Tourism. Tour. Manag. 2019, 72, 145–154. [Google Scholar] [CrossRef]
- Zhang, T.; Chen, J.; Hu, B. Authenticity, Quality, and Loyalty: Local Food and Sustainable Tourism Experience. Sustainability 2019, 11, 3437. [Google Scholar] [CrossRef] [Green Version]
- Eslami, S.; Khalifah, Z.; Mardani, A.; Streimikiene, D.; Han, H. Community Attachment, Tourism Impacts, Quality of Life and Residents’ Support for Sustainable Tourism Development. J. Travel Tour. Mark. 2019, 36, 1061–1079. [Google Scholar] [CrossRef]
- Choi, H.-S.C.; Sirakaya, E. Measuring Residents’ Attitude toward Sustainable Tourism: Development of Sustainable Tourism Attitude Scale. J. Travel Res. 2005, 43, 380–394. [Google Scholar] [CrossRef]
- Mickwitz, P.; Melanen, M.; Rosenström, U.; Seppälä, J. Regional Eco-Efficiency Indicators—A Participatory Approach. J. Clean. Prod. 2006, 14, 1603–1611. [Google Scholar] [CrossRef]
- Bleischwitz, R. Cognitive and Institutional Perspectives of Eco-Efficiency. Ecol. Econ. 2003, 46, 453–467. [Google Scholar] [CrossRef] [Green Version]
- Coluccia, B.; Valente, D.; Fusco, G.; De Leo, F.; Porrini, D. Assessing Agricultural Eco-Efficiency in Italian Regions. Ecol. Indic. 2020, 116, 106483. [Google Scholar] [CrossRef]
- York, R.; Rosa, E.A. Key Challenges to Ecological Modernization Theory: Institutional Efficacy, Case Study Evidence, Units of Analysis, and the Pace of Eco-Efficiency. Organ. Environ. 2003, 16, 273–288. [Google Scholar] [CrossRef] [Green Version]
- Vogtländer, J.G.; Bijma, A.; Brezet, H.C. Communicating the Eco-Efficiency of Products and Services by Means of the Eco-Costs/Value Model. J. Clean. Prod. 2002, 10, 57–67. [Google Scholar] [CrossRef]
- Ren, S.; Li, X.; Yuan, B.; Li, D.; Chen, X. The Effects of Three Types of Environmental Regulation on Eco-Efficiency: A Cross-Region Analysis in China. J. Clean. Prod. 2018, 173, 245–255. [Google Scholar] [CrossRef]
- Yin, K.; Wang, R.; An, Q.; Yao, L.; Liang, J. Using Eco-Efficiency as an Indicator for Sustainable Urban Development: A Case Study of Chinese Provincial Capital Cities. Ecol. Indic. 2014, 36, 665–671. [Google Scholar] [CrossRef]
- Mousazadeh, H.; Ghorbani, A.; Azadi, H.; Almani, F.A.; Zangiabadi, A.; Zhu, K.; Dávid, L.D. Developing Sustainable Behaviors for Underground Heritage Tourism Management: The Case of Persian Qanats, a UNESCO World Heritage Property. Land 2023, 12, 808. [Google Scholar] [CrossRef]
- Cheung, K.S.; Li, L.-H. Understanding Visitor–Resident Relations in Overtourism: Developing Resilience for Sustainable Tourism. J. Sustain. Tour. 2019, 27, 1197–1216. [Google Scholar] [CrossRef] [Green Version]
- MacKenzie, N.; Gannon, M.J. Exploring the Antecedents of Sustainable Tourism Development. Int. J. Contemp. Hosp. Manag. 2019, 31, 2411–2427. [Google Scholar] [CrossRef] [Green Version]
- Roxas, F.M.Y.; Rivera, J.P.R.; Gutierrez, E.L.M. Framework for Creating Sustainable Tourism Using Systems Thinking. Curr. Issues Tour. 2020, 23, 280–296. [Google Scholar] [CrossRef]
- Haibo, C.; Ke, D.; Fangfang, W.; Ayamba, E.C. The Spatial Effect of Tourism Economic Development on Regional Ecological Efficiency. Env. Sci Pollut Res 2020, 27, 38241–38258. [Google Scholar] [CrossRef] [PubMed]
- Castilho, D.; Fuinhas, J.A.; Marques, A.C. The Impacts of the Tourism Sector on the Eco-Efficiency of the Latin American and Caribbean Countries. Socio-Econ. Plan. Sci. 2021, 78, 101089. [Google Scholar] [CrossRef]
- Choi, Y.E.; Oh, C.-O.; Chon, J. Applying the Resilience Principles for Sustainable Ecotourism Development: A Case Study of the Nakdong Estuary, South Korea. Tour. Manag. 2021, 83, 104237. [Google Scholar] [CrossRef]
- Zhang, W.; Zhan, Y.; Yin, R.; Yuan, X. The Tourism Eco-Efficiency Measurement and Its Influencing Factors in the Yellow River Basin. Sustainability 2022, 14, 15654. [Google Scholar] [CrossRef]
- Liu, Q.; Song, J.; Dai, T.; Xu, J.; Li, J.; Wang, E. Spatial Network Structure of China’s Provincial-Scale Tourism Eco-Efficiency: A Social Network Analysis. Energies 2022, 15, 1324. [Google Scholar] [CrossRef]
- Ogutu, H.; Adol, G.F.C.; Bujdosó, Z.; Andrea, B.; Fekete-Farkas, M.; Dávid, L.D. Theoretical Nexus of Knowledge Management and Tourism Business Enterprise Competitiveness: An Integrated Overview. Sustainability 2023, 15, 1948. [Google Scholar] [CrossRef]
- Xia, B.; Dong, S.; Li, Z.; Zhao, M.; Sun, D.; Zhang, W.; Li, Y. Eco-Efficiency and Its Drivers in Tourism Sectors with Respect to Carbon Emissions from the Supply Chain: An Integrated EEIO and DEA Approach. Int. J. Environ. Res. Public Health 2022, 19, 6951. [Google Scholar] [CrossRef]
- Wang, C.; Xu, L.; Huang, M.; Su, X.; Lai, R.; Xu, A. Research on the Evolution of Spatial Network Structure of Tourism Eco-Efficiency and Its Influencing Factors in China’s Provinces Based on Carbon Emission Accounting. PLoS ONE 2022, 17, e0272667. [Google Scholar] [CrossRef]
- Kelly, J.; Williams, P. Tourism Destination Water Management Strategies: An Eco-efficiency Modelling Approach. Leis./Loisir 2007, 31, 427–452. [Google Scholar] [CrossRef]
- Han, J. Carrying Capacity of Low Carbon Tourism Environment in Coastal Areas from the Perspective of Ecological Efficiency. J. Coast. Res. 2018, 199–203. [Google Scholar] [CrossRef]
- Li, S.; Ren, T.; Jia, B.; Zhong, Y. The Spatial Pattern and Spillover Effect of the Eco-Efficiency of Regional Tourism from the Perspective of Green Development: An Empirical Study in China. Forests 2022, 13, 1324. [Google Scholar] [CrossRef]
- Li, D.; Zhai, Y.; Tian, G.; Mendako, R.K. Tourism Eco-Efficiency and Influence Factors of Chinese Forest Parks under Carbon Peaking and Carbon Neutrality Target. Sustainability 2022, 14, 13979. [Google Scholar] [CrossRef]
- Zhu, K.; Zhang, Y.; Wang, M.; Liu, H. The Ecological Compensation Mechanism in a Cross-Regional Water Diversion Project Using Evolutionary Game Theory: The Case of the Hanjiang River Basin, China. Water 2022, 14, 1151. [Google Scholar] [CrossRef]
- Zhu, K.; Liu, Q.; Xiong, X.; Zhang, Y.; Wang, M.; Liu, H. Carbon Footprint and Embodied Carbon Emission Transfer Network Obtained Using the Multi–Regional Input–Output Model and Social Network Analysis Method: A Case of the Hanjiang River Basin, China. Front. Ecol. Evol. 2022, 10, 941520. [Google Scholar] [CrossRef]
- Wang, Y.; Zhu, K.; Xiong, X.; Yin, J.; Yan, H.; Zhang, Y.; Liu, H. Assessment of the Ecological Compensation Standards for Cross-Basin Water Diversion Projects from the Perspective of Main Headwater and Receiver Areas. Int. J. Environ. Res. Public Health 2023, 20, 717. [Google Scholar] [CrossRef]
- Yang, Y.; Yan, J.; Yang, Y.; Yang, Y. The spatio-temporal evolution and spatial spillover effect of tourism eco-efficiency in the Yellow River Basin:based on data from the 73 cities. Acta Ecol. Sin. 2022, 42, 8202–8212. [Google Scholar] [CrossRef]
- Qiu, Y.; Yin, J.; Zhang, T.; Du, Y.; Zhang, B. Spatiotemporal Dynamic Analysis of A-Level Scenic Spots in Guizhou Province, China. ISPRS Int. J. Geo-Inf. 2021, 10, 568. [Google Scholar] [CrossRef]
- Zhong, Y.; Shi, S.; Li, S.; Luo, F.; Luo, W.; Xiao, Q. Empirical Research on Construction of a Measurement Framework for Tourism Carbon Emission in China. Chin. J. Popul. Resour. Environ. 2015, 13, 240–249. [Google Scholar] [CrossRef]
- Mishra, H.G.; Pandita, S.; Bhat, A.A.; Mishra, R.K.; Sharma, S. Tourism and Carbon Emissions: A Bibliometric Review of the Last Three Decades: 1990–2021. Tour. Rev. 2021, 77, 636–658. [Google Scholar] [CrossRef]
- Tian, N.; Tang, S.; Che, A.; Wu, P. Measuring Regional Transport Sustainability Using Super-Efficiency SBM-DEA with Weighting Preference. J. Clean. Prod. 2020, 242, 118474. [Google Scholar] [CrossRef]
- Zhong, K.; Wang, Y.; Pei, J.; Tang, S.; Han, Z. Super Efficiency SBM-DEA and Neural Network for Performance Evaluation. Inf. Process. Manag. 2021, 58, 102728. [Google Scholar] [CrossRef]
- Huang, Y.; Huang, X.; Xie, M.; Cheng, W.; Shu, Q. A Study on the Effects of Regional Differences on Agricultural Water Resource Utilization Efficiency Using Super-Efficiency SBM Model. Sci. Rep. 2021, 11, 9953. [Google Scholar] [CrossRef] [PubMed]
- Khan, S.U.; Cui, Y.; Khan, A.A.; Ali, M.A.S.; Khan, A.; Xia, X.; Liu, G.; Zhao, M. Tracking Sustainable Development Efficiency with Human-Environmental System Relationship: An Application of DPSIR and Super Efficiency SBM Model. Sci. Total Environ. 2021, 783, 146959. [Google Scholar] [CrossRef] [PubMed]
- Ord, J.K.; Getis, A. Testing for Local Spatial Autocorrelation in the Presence of Global Autocorrelation. J. Reg. Sci. 2001, 41, 411–432. [Google Scholar] [CrossRef]
- Koo, H.; Wong, D.W.S.; Chun, Y. Measuring Global Spatial Autocorrelation with Data Reliability Information. Prof. Geogr. 2019, 71, 551–565. [Google Scholar] [CrossRef]
- Fotheringham, A.S. “The Problem of Spatial Autocorrelation” and Local Spatial Statistics. Geogr. Anal. 2009, 41, 398–403. [Google Scholar] [CrossRef]
- Sokal, R.R.; Oden, N.L.; Thomson, B.A. Local Spatial Autocorrelation in a Biological Model. Geogr. Anal. 1998, 30, 331–354. [Google Scholar] [CrossRef]
- Ord, J.K.; Getis, A. Local Spatial Autocorrelation Statistics: Distributional Issues and an Application. Geogr. Anal. 1995, 27, 286–306. [Google Scholar] [CrossRef]
- Krutwaysho, O.; Bramwell, B. Tourism Policy Implementation and Society. Ann. Tour. Res. 2010, 37, 670–691. [Google Scholar] [CrossRef]
- Estol, J.; Font, X. European Tourism Policy: Its Evolution and Structure. Tour. Manag. 2016, 52, 230–241. [Google Scholar] [CrossRef]
- Stevenson, N.; Airey, D.; Miller, G. Tourism Policy Making:: The Policymakers’ Perspectives. Ann. Tour. Res. 2008, 35, 732–750. [Google Scholar] [CrossRef] [Green Version]
- Wang, P.; Zhang, L.; Li, Y.; Jiao, L.; Wang, H.; Yan, J.; Lü, Y.; Fu, B. Spatio-Temporal Variations of the Flood Mitigation Service of Ecosystem under Different Climate Scenarios in the Upper Reaches of Hanjiang River Basin, China. J. Geogr. Sci. 2018, 28, 1385–1398. [Google Scholar] [CrossRef] [Green Version]
- Peng, X.Z.; Yu, Q.; Yuan, C. Countermeasure Research of Urban Water Resources Protection and Tourism Development and Utilization of Wuhan. Appl. Mech. Mater. 2014, 675–677, 892–895. [Google Scholar] [CrossRef]
- Risteskia, M.; Kocevskia, J.; Arnaudov, K. Spatial Planning and Sustainable Tourism as Basis for Developing Competitive Tourist Destinations. Procedia-Soc. Behav. Sci. 2012, 44, 375–386. [Google Scholar] [CrossRef] [Green Version]
- Tfaily, R.A. E-Tourism and the Competitiveness of Tourism Products in the Context of the Global Tourism and Travel Industry Market. Rev. De Manag. Comp. Int. 2018, 19, 187–195. [Google Scholar] [CrossRef]
- Sharif, A.; Godil, D.I.; Xu, B.; Sinha, A.; Rehman Khan, S.A.; Jermsittiparsert, K. Revisiting the Role of Tourism and Globalization in Environmental Degradation in China: Fresh Insights from the Quantile ARDL Approach. J. Clean. Prod. 2020, 272, 122906. [Google Scholar] [CrossRef]
- Wang, J.; Huang, X.; Gong, Z.; Cao, K. Dynamic Assessment of Tourism Carrying Capacity and Its Impacts on Tourism Economic Growth in Urban Tourism Destinations in China. J. Destin. Mark. Manag. 2020, 15, 100383. [Google Scholar] [CrossRef]
| Disclaimer/Publisher’s Note: The statements, opinions and data contained in all publications are solely those of the individual author(s) and contributor(s) and not of MDPI and/or the editor(s). MDPI and/or the editor(s) disclaim responsibility for any injury to people or property resulting from any ideas, methods, instructions or products referred to in the content. |
© 2023 by the authors. Licensee MDPI, Basel, Switzerland. This article is an open access article distributed under the terms and conditions of the Creative Commons Attribution (CC BY) license (https://creativecommons.org/licenses/by/4.0/).

 ,
, 


