
Edge Computing Data Optimization for Smart Quality Management: Industry 5.0 Perspective
 , , ,
, , ,
Abstract
:1. Introduction
2. Background
2.1. Smart Quality Management in Industry 5.0
- individualised human–machine interaction (including artificial intelligence robotics, and augmented and virtual reality);
- manufacturing system simulation (including CPS, digital twins of products, processes, and entire systems); and
- data transmission, storage, and analysis technologies (including IIoT, cyber-security, big data analytics, and edge computing).
2.2. Manufacturing Data
2.3. Edge Computing
3. Research Method
4. Results
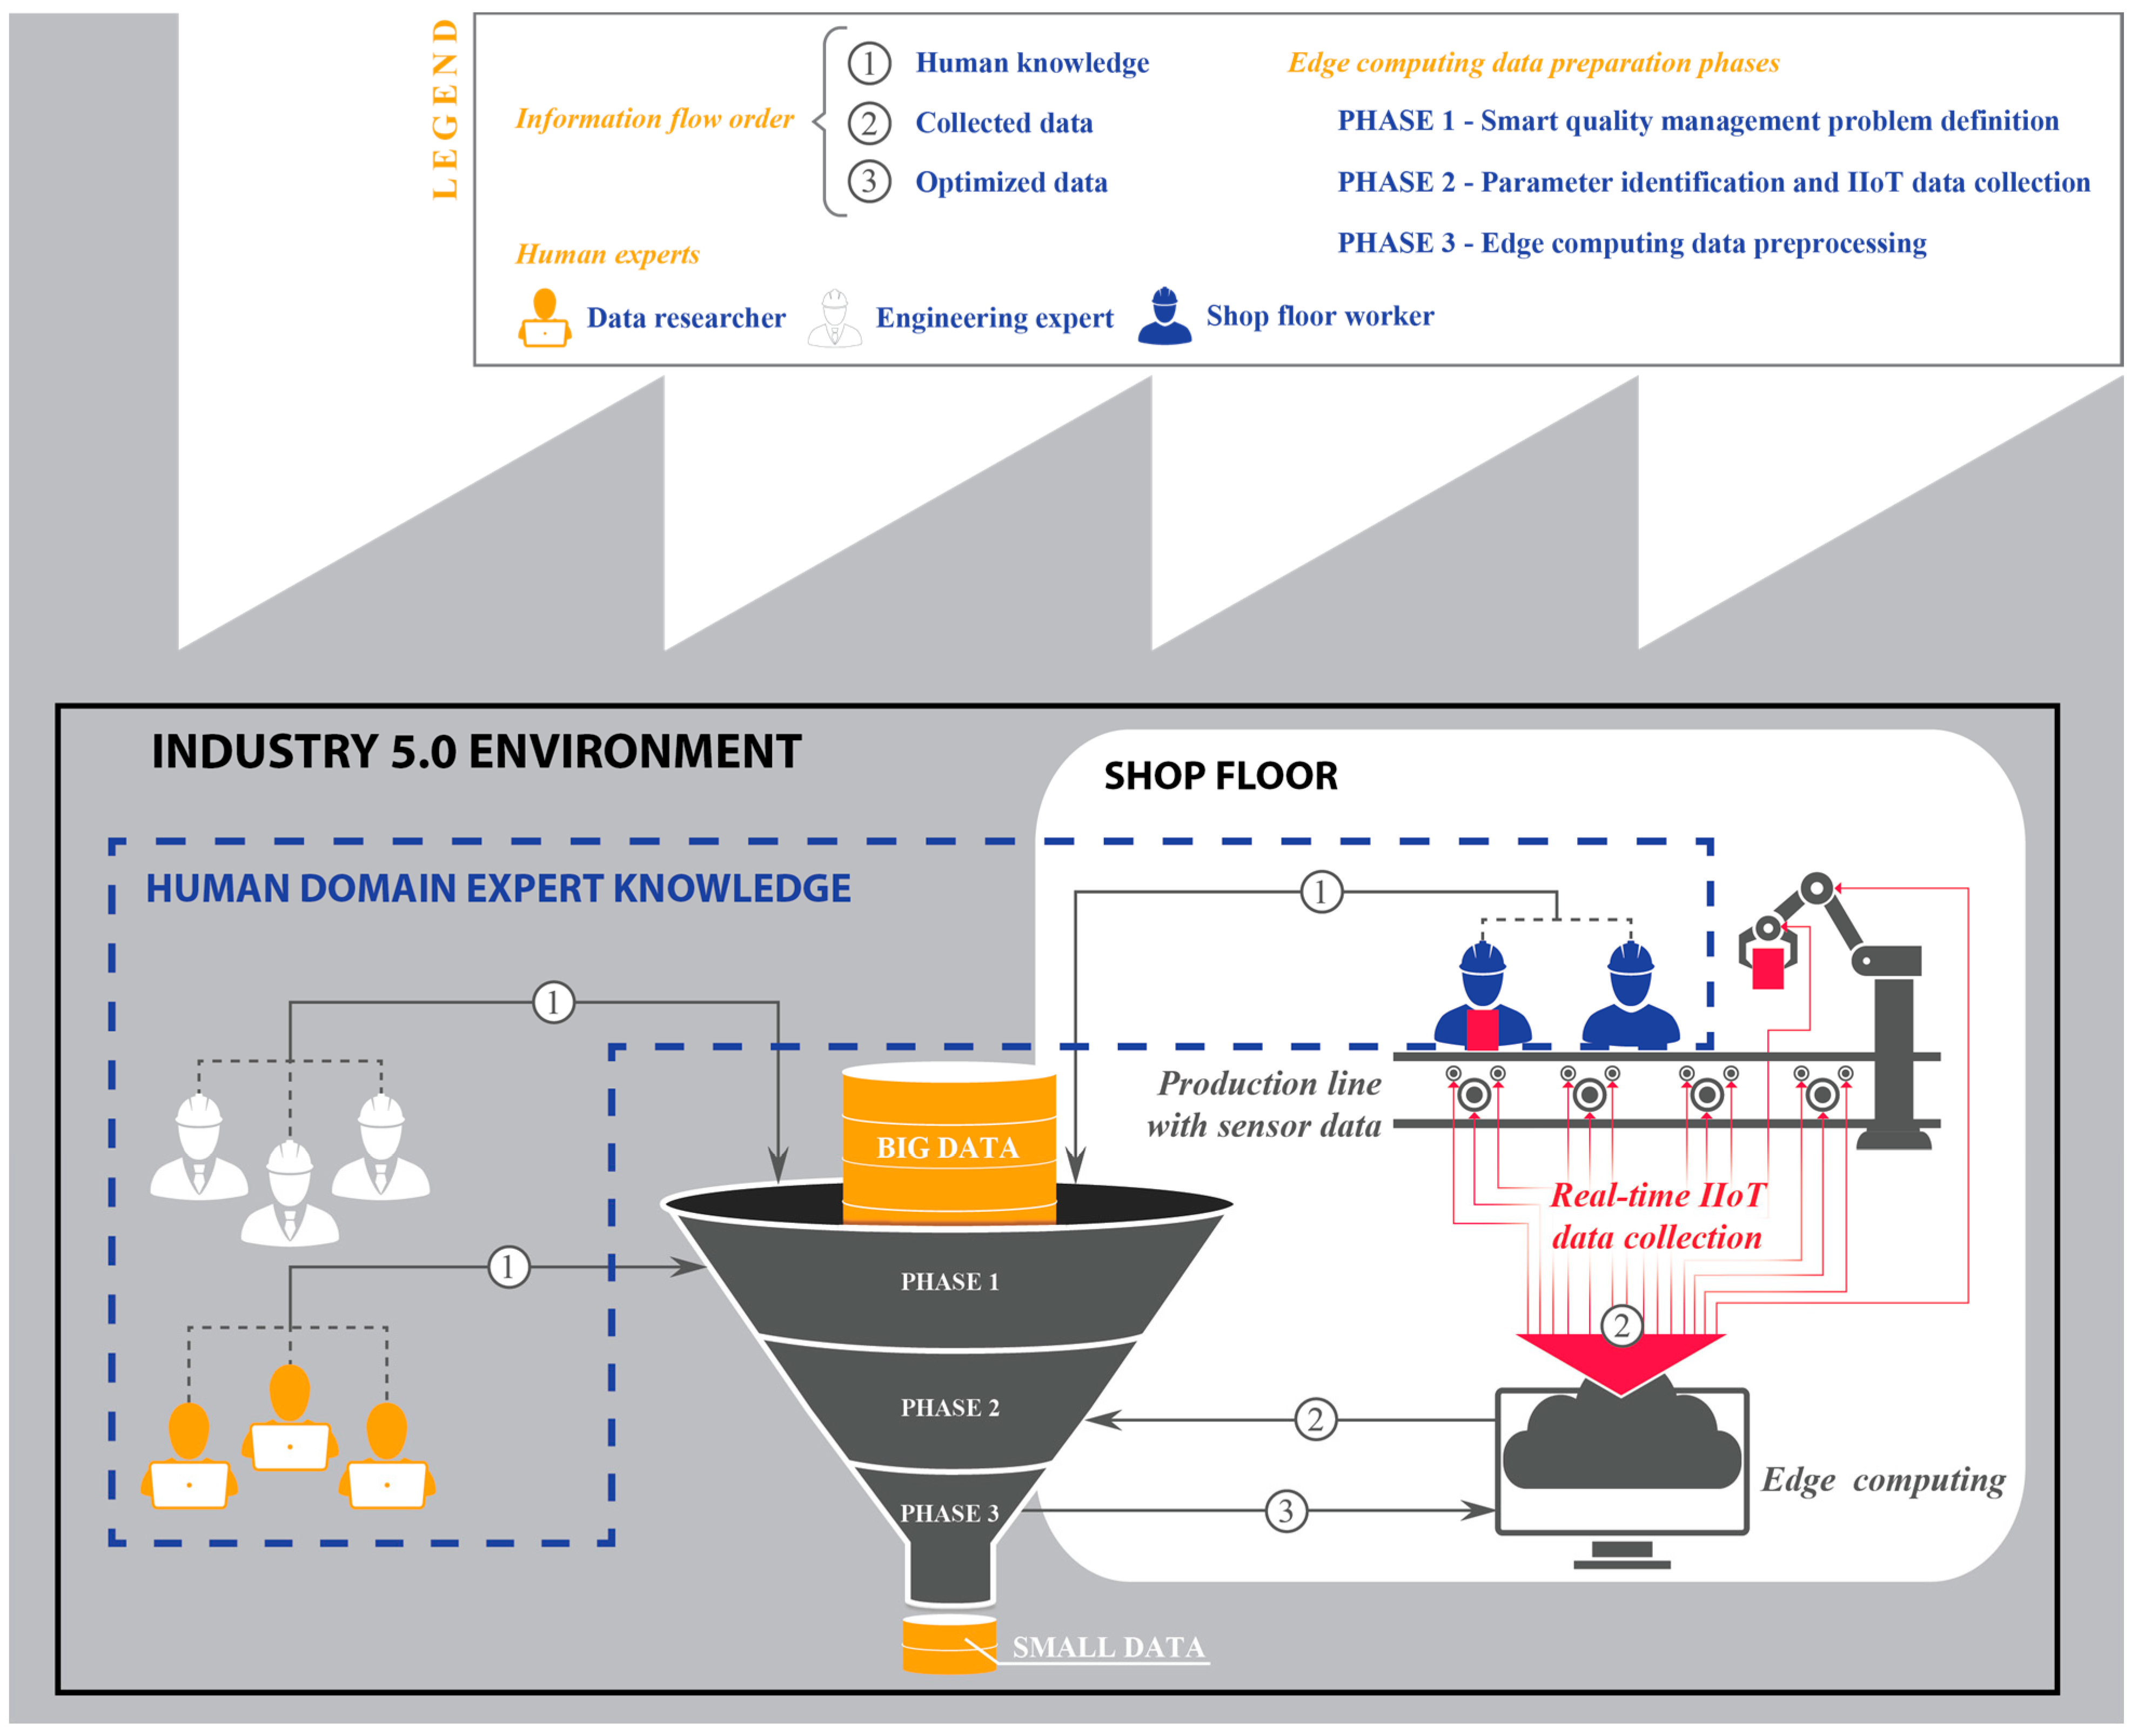
4.1. Conceptual Model Development
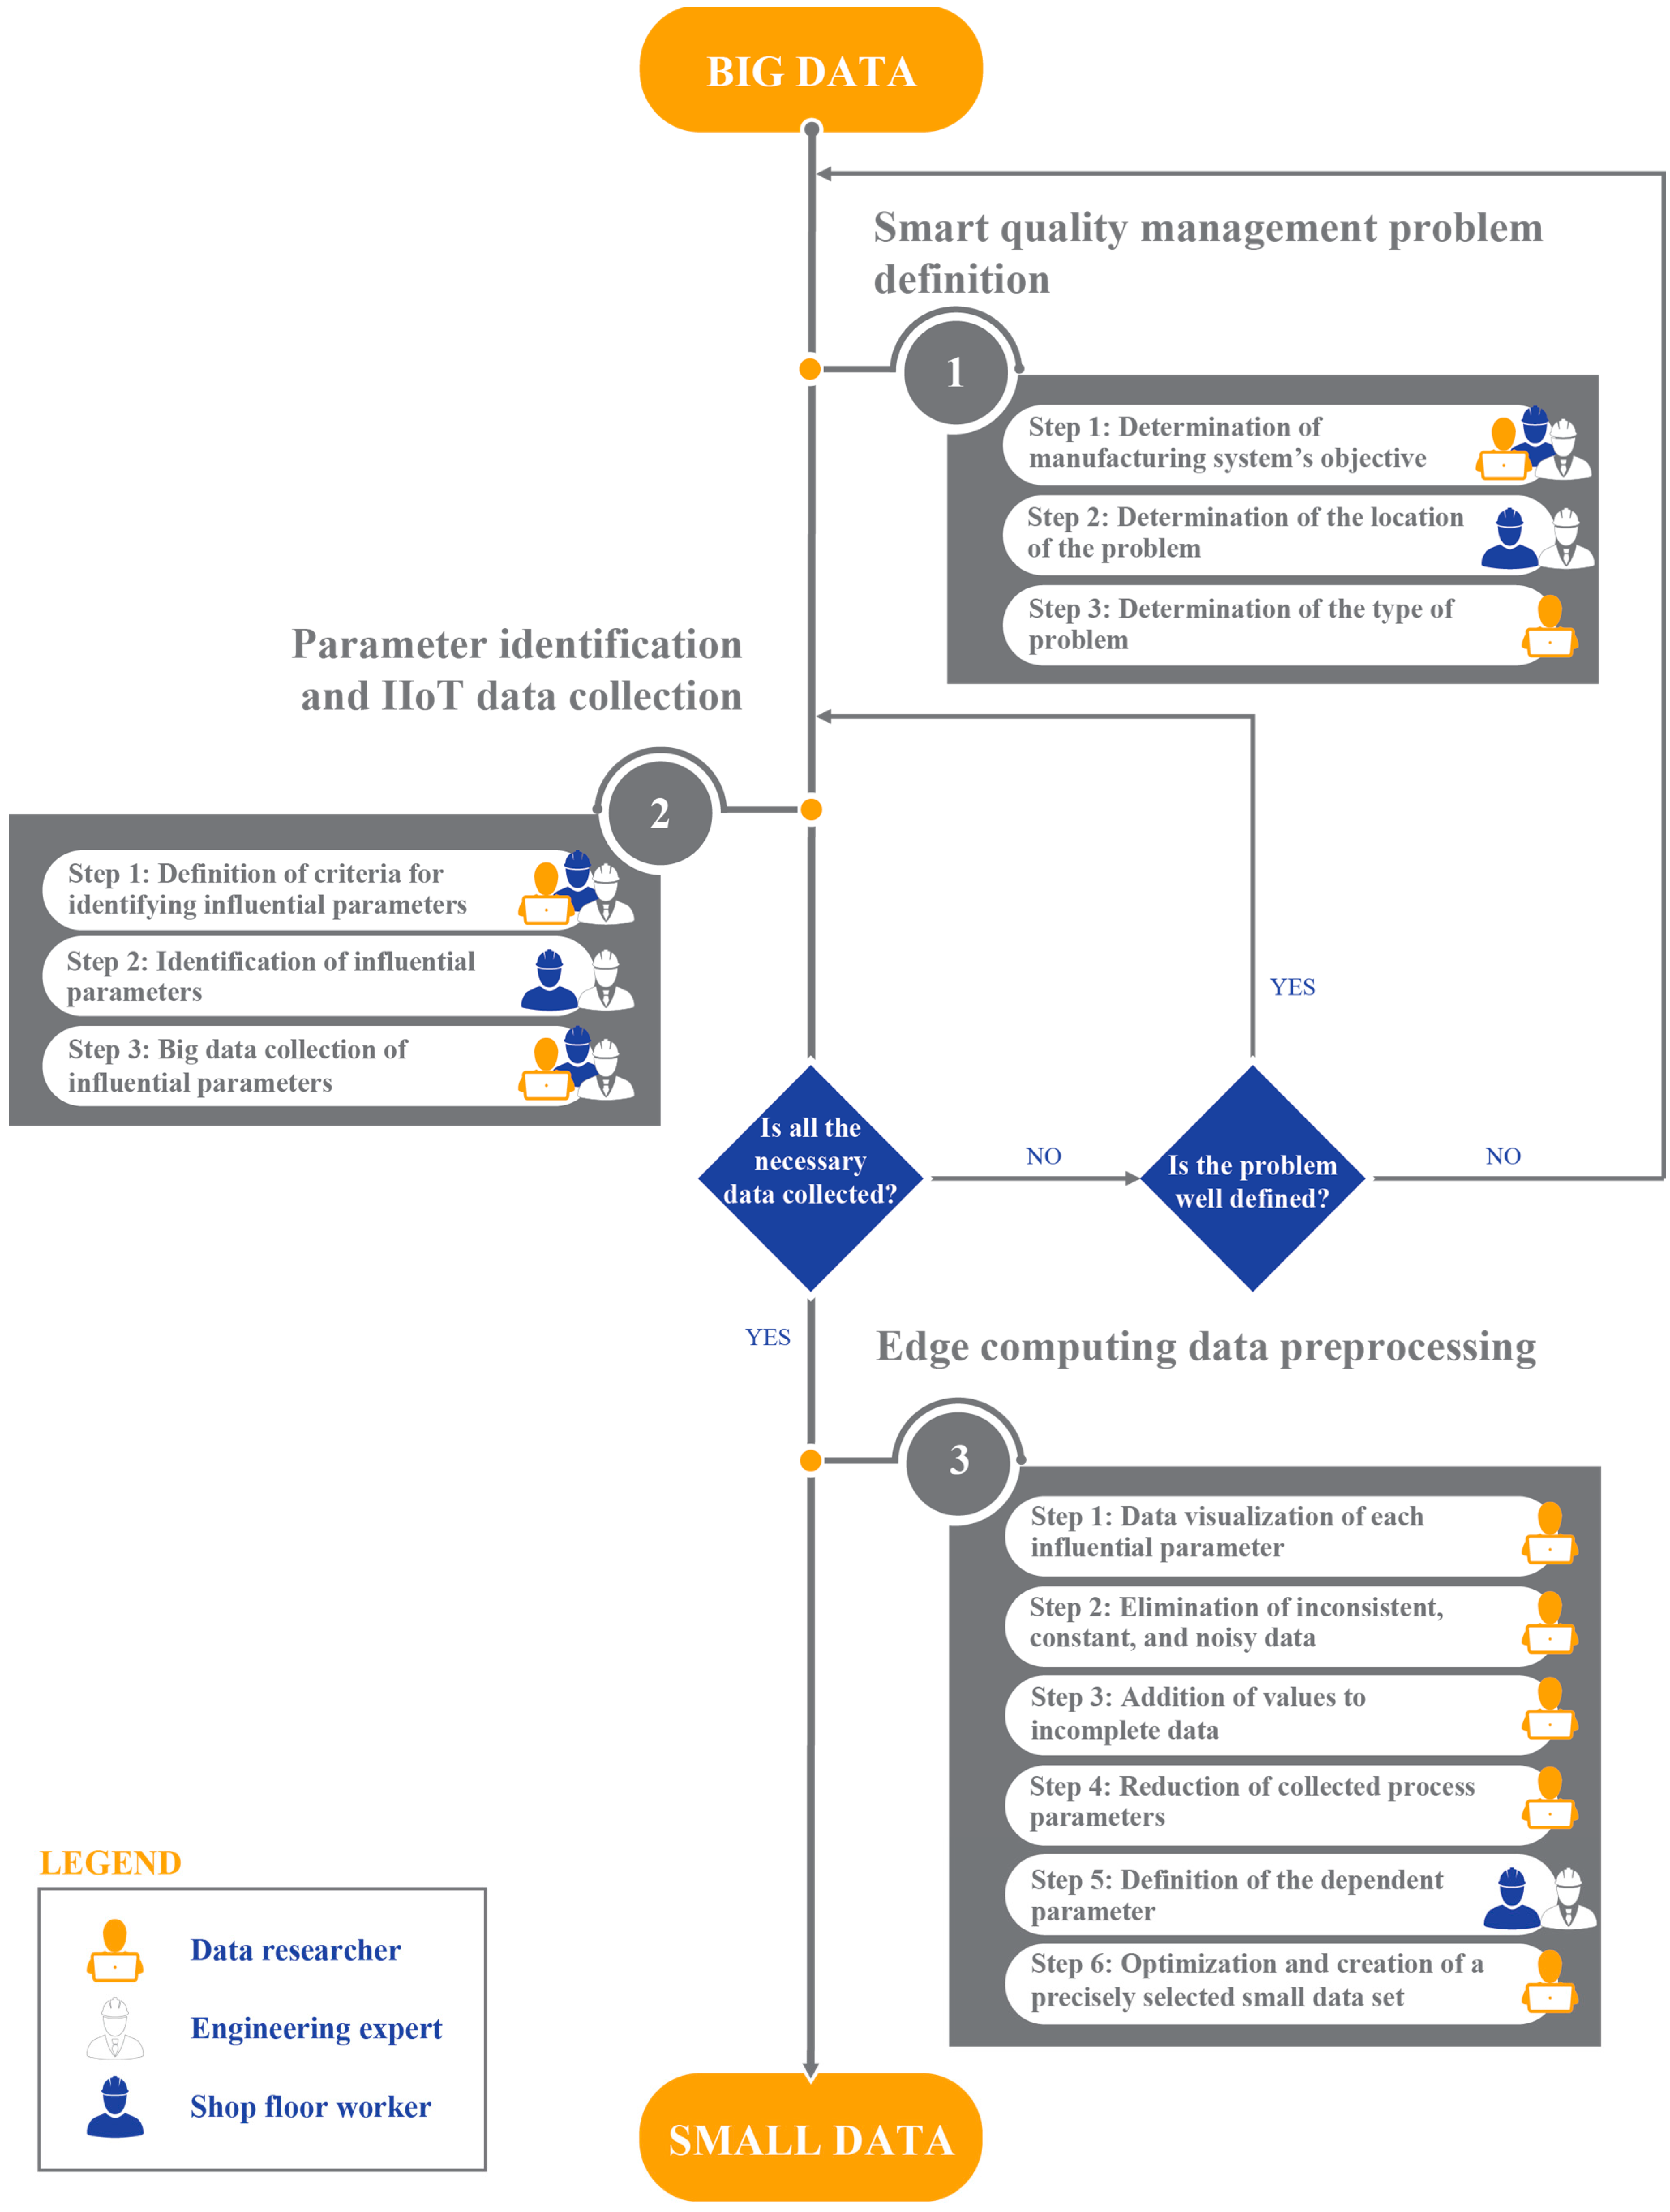
4.1.1. Phase 1—Smart Quality Management Problem Definition
4.1.2. Phase 2—Parameter Identification and IIoT Data Collection
4.1.3. Phase 3—Edge Computing Data Preprocessing
4.2. Proof-of-Concept
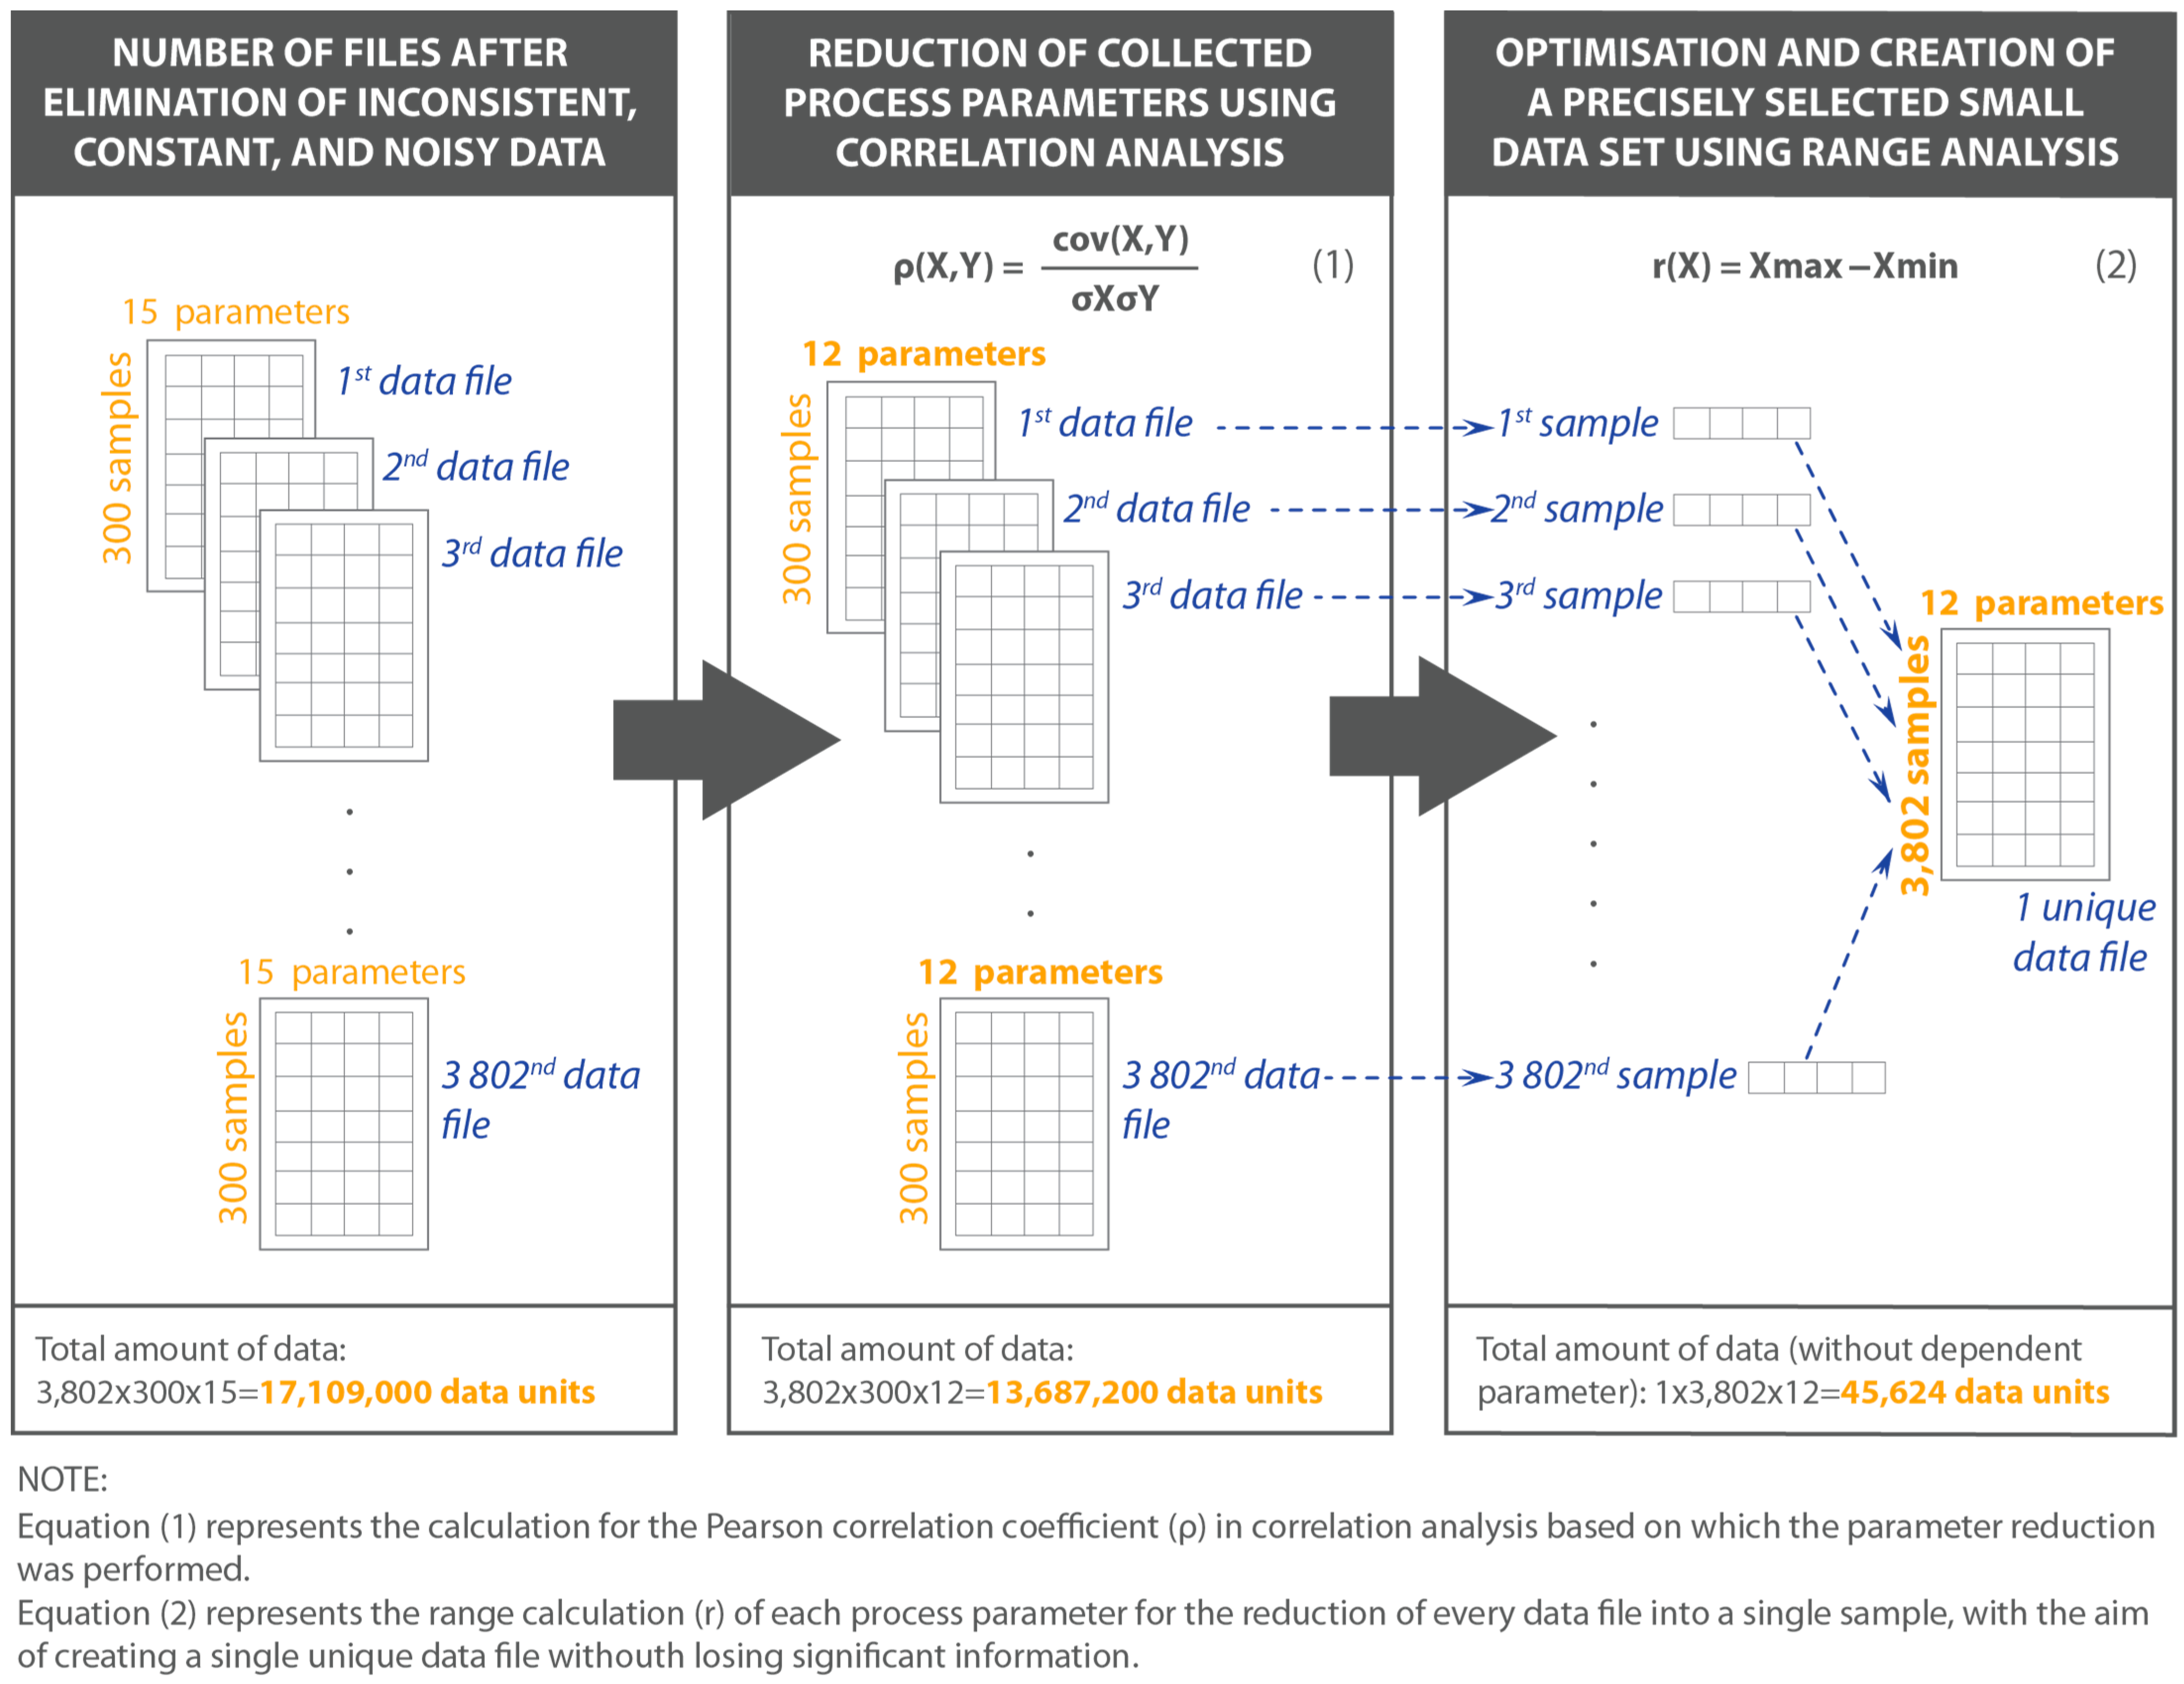
- elimination of inconsistent, constant, and noise data was done based on expert knowledge which included the manual rows deletion of timestamp data. That led to a reduction in the total number of data units collected by approximately 50%, leaving a total amount of 17,109,000 data units (see Figure 4 and Table 2); and
- reduction of the number of collected process parameters using correlation analysis, which led to a decrease in the total number of influential process parameters, from 15 to 12, based on the Pearson correlation coefficient [56,57] (Table 2), by ejecting parameters that are highly correlated (ρ exceeds the value of 0.8 and −0.8, respectively, where values are calculated based on Equation (1) from Figure 4).
5. Discussion and Conclusions
Author Contributions
Funding
Institutional Review Board Statement
Informed Consent Statement
Data Availability Statement
Acknowledgments
Conflicts of Interest
References
- Khalid, A.; Khan, Z.H.; Idrees, M.; Kirisci, P.; Thoben, K.; Pannek, J. Understanding vulnerabilities in cyber physical production systems. Int. J. Comput. Integr. Manuf. 2022, 35, 569–582. [Google Scholar] [CrossRef]
- Xu, X.; Lu, Y.; Vogel-heuser, B.; Wang, L. Industry 4.0 and Industry 5.0—Inception, conception and perception. J. Manuf. Syst. 2021, 61, 530–535. [Google Scholar] [CrossRef]
- Saniuk, S.; Saniuk, A.; Cagáňová, D. Cyber Industry Networks as an environment of the Industry 4.0 implementation. Wirel. Netw. 2021, 27, 1649–1655. [Google Scholar] [CrossRef] [Green Version]
- Nikolic, B.; Ignjatic, J.; Suzic, N.; Stevanov, B.; Rikalovic, A. Predictive manufacturing systems in industry 4.0: Trends, benefits and challenges. In Proceedings of the Annals of DAAAM and International DAAAM Symposium, Zadar, Croatia, 8–11 November 2017; pp. 796–802. [Google Scholar]
- European Commission. Industry 5.0—Towards a Sustainable, Human-Centric and Resilient European Industry; European Commision: Brussels, Belgium, 2021.
- Bajic, B.; Rikalovic, A.; Suzic, N.; Piuri, V. Industry 4.0 Implementation Challenges and Opportunities: A Managerial Perspective. IEEE Syst. J. 2021, 15, 546–559. [Google Scholar] [CrossRef]
- Zizic, M.C.; Mladineo, M.; Gjeldum, N.; Celent, L. From Industry 4.0 towards Industry 5.0: A Review and Analysis of Paradigm Shift for the People, Organization and Technology. Energies 2022, 15, 5221. [Google Scholar] [CrossRef]
- Rikalovic, A.; Suzic, N.; Bajic, B.; Piuri, V. Industry 4.0 Implementation Challenges and Opportunities: A Technological Perspective. IEEE Syst. J. 2022, 16, 2797–2810. [Google Scholar] [CrossRef]
- European Commission. Industry 5.0: A Transformative Vision for Europe; European Commision: Brussels, Belgium, 2022.
- Wang, B.; Zheng, P.; Yin, Y.; Shih, A.; Wang, L. Toward human-centric smart manufacturing: A human-cyber-physical systems (HCPS) perspective. J. Manuf. Syst. 2022, 63, 471–490. [Google Scholar] [CrossRef]
- Nahavandi, S. Industry 5.0—A Human-Centric Solution. Sustainability 2019, 11, 4371. [Google Scholar] [CrossRef] [Green Version]
- Zhou, J.; Zhou, Y.; Wang, B.; Zang, J. Human–Cyber–Physical Systems (HCPSs) in the Context of New-Generation Intelligent Manufacturing. Engineering 2019, 5, 624–636. [Google Scholar] [CrossRef]
- Maddikunta, P.K.R.; Pham, Q.-V.; Prabadevi, B.; Deepa, N.; Dev, K.; Gadekallu, T.R.; Ruby, R.; Liyanage, M. Industry 5.0: A survey on enabling technologies and potential applications. J. Ind. Inf. Integr. 2022, 26, 100257. [Google Scholar] [CrossRef]
- Jabrane, K.; Bousmah, M. A New Approach for Training Cobots from Small Amount of Data in Industry 5.0. Int. J. Adv. Comput. Sci. Appl. 2021, 12, 634–646. [Google Scholar] [CrossRef]
- Sisinni, E.; Han, S.; Jennehag, U.; Gidlund, M. Industrial Internet of Things: Challenges, Opportunities, and Directions. IEEE Trans. Ind. Inform. 2018, 14, 4724–4734. [Google Scholar] [CrossRef]
- Kovacic, M.; Buntak, K.; Forjan, E. Intelligent quality management system. In Proceedings of the IX International Confernce: Quality System Conditions for Successful Business and Competitiveness, Kopaonik, Serbia, 26–28 May 2021; pp. 11–19. [Google Scholar]
- Müller, T.; Kamm, S.; Löcklin, A.; White, D.; Mellinger, M.; Jazdi, N.; Weyrich, M. Architecture and knowledge modelling for self- organized reconfiguration management of cyber- physical production systems. Int. J. Comput. Integr. Manuf. 2022, 1–22. [Google Scholar] [CrossRef]
- Francalanza, E.; Borg, J.; Constantinescu, C. A knowledge-based tool for designing cyber physical production systems. Comput. Ind. 2017, 84, 39–58. [Google Scholar] [CrossRef]
- Qiao, F.; Liu, J.; Ma, Y.; Liu, J. Industrial big-data-driven and CPS-based adaptive production scheduling for smart manufacturing Industrial big-data-driven and CPS-based adaptive production scheduling for. Int. J. Prod. Res. 2021, 59, 7139–7159. [Google Scholar] [CrossRef]
- Raut, R.D.; Yadav, V.S.; Cheikhrouhou, N.; Narwane, V.S.; Narkhede, B.E. Big data analytics: Implementation challenges in Indian manufacturing supply chains. Comput. Ind. 2021, 125, 103368. [Google Scholar] [CrossRef]
- Li, C.; Chen, Y.; Shang, Y. A review of industrial big data for decision making in intelligent manufacturing. Eng. Sci. Technol. Int. J. 2022, 29, 101021. [Google Scholar] [CrossRef]
- Sadat Lavasani, M.; Raeisi Ardali, N.; Sotudeh-Gharebagh, R.; Zarghami, R.; Abonyi, J.; Mostoufi, N. Big data analytics opportunities for applications in process engineering. Rev. Chem. Eng. 2021; in press. [Google Scholar] [CrossRef]
- Yan, J.; Meng, Y.; Lu, L.; Li, L. Industrial Big Data in an Industry 4.0 Environment: Challenges, Schemes, and Applications for Predictive Maintenance. IEEE Access 2017, 5, 23484–23491. [Google Scholar] [CrossRef]
- Iliashenko, O.; Iliashenko, V.; Lukyanchenko, E. Big Data in Transport Modelling and Planning. In Transportation Research Procedia; Elsevier B.V.: Amsterdam, The Netherlands, 2021; Volume 54, pp. 900–908. [Google Scholar]
- Li, X.; Song, J.; Huang, B. A scientific workflow management system architecture and its scheduling based on cloud service platform for manufacturing big data analytics. Int. J. Adv. Manuf. Technol. 2016, 84, 119–131. [Google Scholar] [CrossRef]
- Sulieman, N.A.; Celsi, L.R.; Li, W.; Zomaya, A.; Villari, M. Edge-Oriented Computing: A Survey on Research and Use Cases. Energies 2022, 15, 452. [Google Scholar] [CrossRef]
- Bajic, B.; Cosic, I.; Katalinic, B.; Moraca, S.; Lazarevic, M.; Rikalovic, A. Edge Computing vs. Cloud Computing: Challenges and Opportunities in Industry 4.0. In Proceedings of the 30th Daaam International Symposium on Intelligent Manufacturing and Automation, Zadar, Croatia, 23–26 October 2019; pp. 864–871. [Google Scholar]
- Laroui, M.; Nour, B.; Moungla, H.; Cherif, M.A.; Afifi, H. Edge and fog computing for IoT: A survey on current research activities & future directions. Comput. Commun. 2021, 180, 210–232. [Google Scholar]
- Gremyr, I.; Lenning, J.; Elg, M.; Martin, J. Increasing the value of quality management systems systems. Int. J. Qual. Serv. Sci. 2021, 13, 381–394. [Google Scholar] [CrossRef]
- Lu, Y.; Zheng, H.; Chand, S.; Xia, W.; Liu, Z.; Xu, X.; Wang, L.; Qin, Z.; Bao, J. Outlook on Human-Centric Manufacturing towards Industry 5.0. J. Manuf. Syst. 2022, 62, 612–627. [Google Scholar] [CrossRef]
- Li, J.; Zhan, G.; Dai, X.; Qi, M.; Liu, B. Innovation and Optimization Logic of Grassroots Digital Governance in China under Digital Empowerment and Digital Sustainability. Sustainability 2022, 14, 16470. [Google Scholar] [CrossRef]
- Longo, F.; Padovano, A.; Umbrello, S. Value-oriented and ethical technology engineering in industry 5.0: A human-centric perspective for the design of the factory of the future. Appl. Sci. 2020, 10, 4182. [Google Scholar] [CrossRef]
- Humayun, M. Industrial Revolution 5.0 and the Role of Cutting Edge Technologies. Int. J. Adv. Comput. Sci. Appl. 2021, 12, 605–615. [Google Scholar] [CrossRef]
- Manghisi, V.M.; Wilhelm, M.; Uva, A.; Fiorentino, M.; Schmitt, J.; Modesto, V.; Wilhelm, M.; Uva, A.; Engelmann, B. Towards gestured-based technologies for human-centred Smart Factories. Int. J. Comput. Integr. Manuf. 2022, 36, 110–127. [Google Scholar] [CrossRef]
- European Commission. Enabling Technologies for Results of a Workshop with Europe’s Technology Leaders; European Commision: Brussels, Belgium, 2020.
- Ming, N.K.; Philip, N.; Sahlan, S. Proactive and predictive maintenance strategies and application for instrumentation & control in oil & gas industry. Int. J. Integr. Eng. 2019, 11, 119–130. [Google Scholar]
- Gupta, V.; Rusmevichientong, P. Small-Data, Large-Scale Linear Optimization with Uncertain Objectives. Manage. Sci. 2021, 67, 220–241. [Google Scholar] [CrossRef]
- Jung, W.K.; Kim, D.R.; Lee, H.; Lee, T.H.; Yang, I.; Youn, B.D.; Zontar, D.; Brockmann, M.; Brecher, C.; Ahn, S.H. Appropriate Smart Factory for SMEs: Concept, Application and Perspective. Int. J. Precis. Eng. Manuf. 2021, 22, 201–215. [Google Scholar] [CrossRef]
- Hafeez, T.; Xu, L.; McArdle, G. Edge intelligence for data handling and predictive maintenance in IIoT. IEEE Access 2021, 9, 49355–49371. [Google Scholar] [CrossRef]
- Nain, G.; Pattanaik, K.K.; Sharma, G.K. Towards edge computing in intelligent manufacturing: Past, present and future. J. Manuf. Syst. 2022, 62, 588–611. [Google Scholar] [CrossRef]
- Bajic, B.; Suzic, N.; Simeunovic, N.; Moraca, S.; Rikalovic, A. Real-time Data Analytics Edge Computing Application for Industry 4.0: The Mahalanobis-Taguchi Approach. Int. J. Ind. Eng. Manag. 2020, 11, 146–156. [Google Scholar] [CrossRef]
- Premsankar, G.; Di Francesco, M.; Taleb, T. Edge Computing for the Internet of Things: A Case Study. IEEE Internet Things J. 2018, 5, 1275–1284. [Google Scholar] [CrossRef] [Green Version]
- Fatima, Z.; Tanveer, M.H.; Zardari, S.; Naz, L.F.; Khadim, H.; Ahmed, N.; Tahir, M. Production Plant and Warehouse Automation with IoT and Industry 5.0. Appl. Sci. 2022, 12, 2053. [Google Scholar] [CrossRef]
- Phaal, R.; Farrukh, C.J.P.; Probert, D.R. A framework for supporting the management of technological knowledge. In Proceedings of the Future of Innovation Studies, Eindhoven, The Netherlands, 20–23 September 2001; Volume 27, pp. 1–15. [Google Scholar]
- Mayr, H.C.; Thalheim, B. The triptych of conceptual modeling A framework for a better understanding of conceptual modeling. Softw. Syst. Model. 2021, 20, 7–24. [Google Scholar] [CrossRef]
- Mylopoulos, J. Conceptual Modelling and Telos. In Conceptual Modeling, Databases, and CASE: An Integrated View of Information Systems Development; John Wiley & Sons: New York, NY, USA, 1992; pp. 49–68. [Google Scholar]
- Lindland, O.; Sindre, G.; Sølvberg, A. Understanding Quality in Conceptual Modeling. IEEE Softw. 1994, 11, 42–49. [Google Scholar] [CrossRef]
- Wand, Y.; Weber, R. Research commentary: Information systems and conceptual modeling—A research agenda. Inf. Syst. Res. 2002, 13, 363–376. [Google Scholar] [CrossRef] [Green Version]
- Moody, D.L. Theoretical and practical issues in evaluating the quality of conceptual models: Current state and future directions. Data Knowl. Eng. 2005, 55, 243–276. [Google Scholar] [CrossRef]
- Rohanizadeh, S.S.; Moghadam, M.B. A Proposed Data Mining Methodology and its Application to Industrial Procedures. J. Ind. Eng. 2009, 4, 37–50. [Google Scholar]
- Wiemer, H.; Drowatzky, L.; Ihlenfeldt, S. Data Mining Methodology for Engineering Applications (DMME)—A Holistic Extension to the CRISP-DM Model. Appl. Sci. 2019, 9, 2407. [Google Scholar] [CrossRef] [Green Version]
- Shahbaz, M.; Masood, S.A.; Shaheen, M.; Khan, A. Data mining methodology in perspective of manufacturing databases. Life Sci. J. 2010, 6, 999–1012. [Google Scholar]
- Kendig, C.E. What is Proof of Concept Research and How Does It Generate Epistemic and Ethical Categories for Future Scientific Practice? Sci. Eng. Ethics 2016, 22, 735–753. [Google Scholar] [CrossRef] [PubMed]
- Elliott, S. Proof of Concept Research. Philos. Sci. 2021, 88, 258–280. [Google Scholar] [CrossRef]
- Jose, A.; Neto, R.; Borges, M.M. A Preliminary Study of Proof of Concept Practices and Their Connection with Information Systems and Information Science. In Proceedings of the TEEM’18, Salamanca, Spain, 24–26 October 2018; pp. 1–6. [Google Scholar]
- Chen, S.; Xu, K.; Yao, X. Empirical study of employee loyalty and satisfaction in the mining industry using structural equation modeling. Sci. Rep. 2022, 12, 1158. [Google Scholar] [CrossRef]
- Song, D.; Hong, S.; Seo, J.; Lee, K.; Song, Y. Correlation Analysis of Noise, Vibration, and Harshness in a Analysis Technique. Sensors 2022, 22, 2226. [Google Scholar] [CrossRef]
- Li, C.; Xiao, Q.; Tang, Y.; Li, L. A method integrating Taguchi, RSM and MOPSO to CNC machining parameters optimization for energy saving. J. Clean. Prod. 2016, 135, 263–275. [Google Scholar] [CrossRef]
- Shu, C.; Hou, S.; Zhang, Y.X.; Luo, Y. Crashworthiness analysis and optimization of different configurations multi-layered corrugated sandwich panels under crush loading. J. Sandw. Struct. Mater. 2021, 23, 2901–2922. [Google Scholar] [CrossRef]
- Avetisyan, S. Philosophy of Small Data. SSRN Electron. J. 2018. [Google Scholar] [CrossRef]
- Feng, S.; Zhou, H.; Dong, H. Using deep neural network with small dataset to predict material defects. Mater. Des. 2019, 162, 300–310. [Google Scholar] [CrossRef]
- Tirpak, T. Small Data: The Tiny Clues That Uncover Huge Trends; St. Martin’s Press: New York, NY, USA, 2017. [Google Scholar]
- Zhang, S.; Zhang, C.; Yang, Q. Data preparation for data mining. Appl. Artif. Intell. 2003, 17, 375–381. [Google Scholar] [CrossRef]
- Alexandropoulos, S.A.N.; Kotsiantis, S.B.; Vrahatis, M.N. Data preprocessing in predictive data mining. Knowl. Eng. Rev. 2019, 34, 1–33. [Google Scholar] [CrossRef] [Green Version]
- Xiao, X.; Xiao, Y.; Zhang, Y.; Qiu, J.; Zhang, J.; Yildirim, T. A fusion data preprocessing method and its application in complex industrial power consumption prediction. Mechatronics 2021, 77, 102520. [Google Scholar] [CrossRef]
- Emmanuel, T.; Maupong, T.; Mpoeleng, D.; Semong, T.; Mphago, B. A survey on missing data in machine learning. J. Big Data 2021, 8, 140. [Google Scholar] [CrossRef]
- Shearer, C. The CRISP-DM Model: The New Blueprint for Data Mining. J. Data Warehous. 2000, 5, 13–22. [Google Scholar]
- Abasova, J.; Tanuska, P.; Rydzi, S. Big data-knowledge discovery in production industry data storages-implementation of best practices. Appl. Sci. 2021, 11, 7648. [Google Scholar] [CrossRef]
- Li, F.; Li, X.; Yang, Y.; Xu, Y.; Zhang, Y. Collaborative Production Task Decomposition and Allocation among Multiple Manufacturing Enterprises in a Big Data Environment. Symmetry 2021, 13, 2268. [Google Scholar] [CrossRef]
- Chang, K.H.; Sun, Y.J.; Lai, C.A.; Chen, L.D.; Wang, C.H.; Chen, C.J.; Lin, C.M. Big data analytics energy-saving strategies for air compressors in the semiconductor industry–an empirical study. Int. J. Prod. Res. 2021, 60, 1782–1794. [Google Scholar] [CrossRef]
- Kumar, A.; Shankar, R.; Choudhary, A.; Thakur, L.S. A big data MapReduce framework for fault diagnosis in cloud-based manufacturing. Int. J. Prod. Res. 2016, 54, 7060–7073. [Google Scholar] [CrossRef] [Green Version]
- Flick, D.; Thiede, S.; Filz, M.-A.; Ji, L.; Thiede, S.; Herrmann, C. Conceptual Framework for manufacturing data preprocessing of diverse input sources. In Proceedings of the IEEE 17th International Conference on Industrial Informatics (INDIN), Helsinki, Finland, 22–25 July 2019; pp. 1–7. [Google Scholar]
- Nagashima, H.; Kato, Y. APREP-DM: A Framework for Automating the Pre-Processing of a Sensor Data Analysis based on CRISP-DM. In Proceedings of the 2019 IEEE International Conference on Pervasive Computing and Communications Workshops (PerCom Workshops), Kyoto, Japan, 11–15 March 2019; pp. 555–560. [Google Scholar]
- Da Silva, V.L.; Kovaleski, J.L.; Pagani, R.N.; Silva, J.D.M.; Corsi, A. Implementation of Industry 4.0 concept in companies: Empirical evidences. Int. J. Comput. Integr. Manuf. 2020, 33, 325–342. [Google Scholar] [CrossRef]
- Vuksanović Herceg, I.; Kuč, V.; Mijušković, V.M.; Herceg, T. Challenges and Driving Forces for Industry 4.0 Implementation. Sustainability 2020, 12, 4208. [Google Scholar] [CrossRef]
- Adebanjo, D.; Laosirihongthong, T.; Samaranayake, P.; Teh, P. Key Enablers of Industry 4.0 Development at Firm Level: Findings from an Emerging Economy. IEEE Trans. Eng. Manag. 2021, 70, 1–17. [Google Scholar] [CrossRef]
- Frank, A.G.; Dalenogare, L.S.; Ayala, N.F. Industry 4.0 technologies: Implementation patterns in manufacturing companies. Int. J. Prod. Econ. 2019, 210, 15–26. [Google Scholar] [CrossRef]
- Maritz, J. Implementation Considerations for Big Data Analytics (BDA): A Benefit Dependency Network Approach. In International Federation for Information Processing IFIP; Springer International Publishing: New York, NY, USA, 2020; pp. 481–492. [Google Scholar]
- Tabesh, P.; Mousavidin, E.; Hasani, S. Implementing big data strategies: A managerial perspective. Bus. Horiz. 2019, 62, 347–358. [Google Scholar] [CrossRef]
- Wang, D.; Liu, Q.; Wu, D.; Wang, L. Meta domain generalization for smart manufacturing: Tool wear prediction with small data. J. Manuf. Syst. 2022, 62, 441–449. [Google Scholar] [CrossRef]
- He, Y.; Hua, Q.; Zhu, Q.; Lu, S. Enhanced virtual sample generation based on manifold features: Applications to developing soft sensor using small data. ISA Trans. 2021, 126, 398–406. [Google Scholar] [CrossRef]


| Phase | Step | Step Definition | Step Execution Method | Participants | ||
|---|---|---|---|---|---|---|
| Data Researchers | Engineering Experts | Shop Floor Workers | ||||
| 1—Smart quality management problem definition | 1. Determination of manufacturing system’s objective | Establishment of the manufacturing system’s objective based on the established business goal of the company | Interviews with engineering experts and shop floor workers | X | X | X |
| 2. Determination of the location of the problem | Consideration of all potential locations of the problem (with the possibility that the problem location may include one or more machines in the manufacturing system) | Experts’ and workers’ analysis | X | X | ||
| 3. Determination of the type of problem | Establishment of the data mining goal based on the company’s business goal, with an emphasis on data mining methodology (data mining problem type, namely, classification or regression) | Data mining | X | |||
| 2—Parameter identification and IIoT data collection | 1. Definition of criteria for identifying influential parameters | Definition of the criteria for process parameter identification based on the company’s business goal | Interviews with engineering experts and shop floor workers | X | X | X |
| 2. Identification of influential parameters | Selection of the influential process parameters on the basis of defined criteria | Experts’ and workers’ analysis | X | X | ||
| 3. Big data collection of influential parameters | Collection of data for identified process parameters in a standardized format (TXT, XLS, CSV, JSON, XML, etc.) in real–time for a defined period of time via IIoT network | Edge computing | X | X | X | |
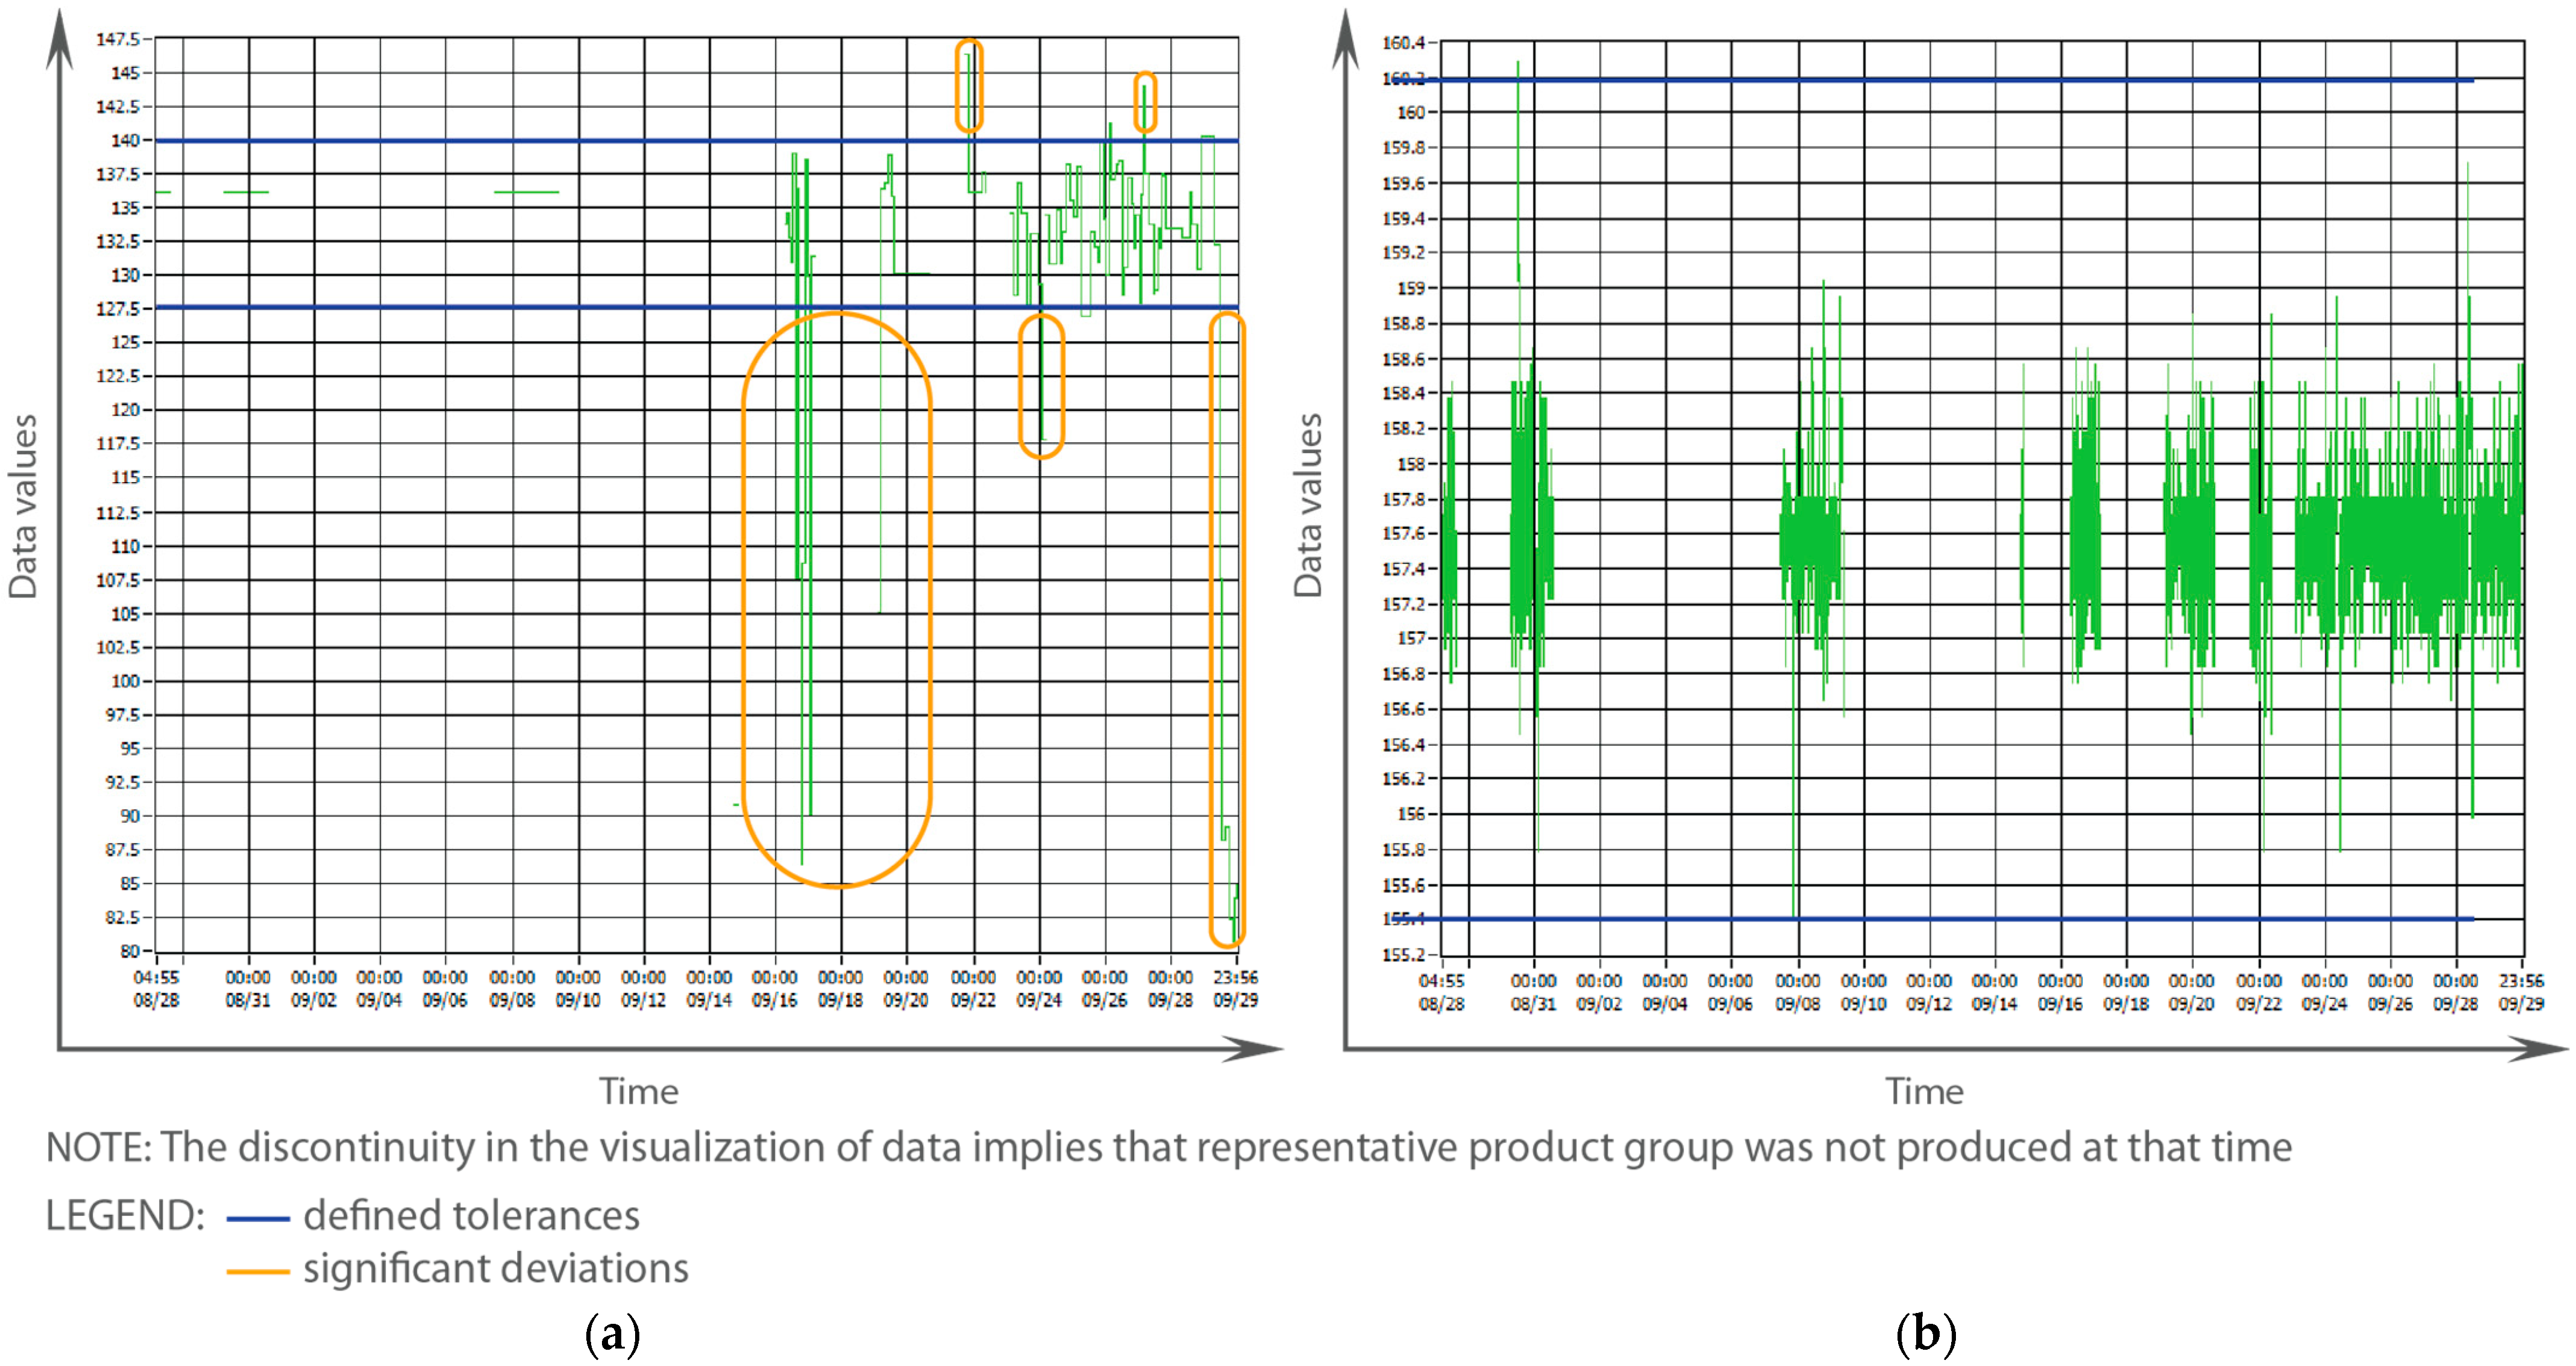
| 3—Edge computing data preprocessing | 1. Data visualization of each influential parameter | Visual presentation of the collected data for influential process parameters that provides information about their nature (significant deviations exist [Figure 3a]) or no significant deviations [Figure 3b]) from the usual values of process parameters generated during the manufacturing process) | Visual analysis | X | ||
| 2. Elimination of inconsistent, constant, and noisy data | Manual removal of data that are considered to have significant defects (constants or noisy values of data due to malfunctions in the measuring instruments) | Manual rows deletion—timestamp data OR Manual columns deletion—numerical or categorical data Note: The method is chosen depending on the type of data | X | |||
| 3. Addition of values to incomplete data | Data insertion of missing values in the empty spaces in a two–dimensional matrix by applying appropriate analytical methods for value addition based on data type | Mean/median/mode—missing values of numeric data OR Multiple imputation—missing values of numerical or categorical data OR Seasonal adjustment + linear interpolation—timestamp data with both trend and seasonality Note: The method is chosen depending on the type of data | X | |||
| 4. Reduction of collected process parameters | Reduction of data dimensionality using correlation analysis or multiple linear regression to decrease the number of independent process parameters and simplify the data set | Correlation analysis—classification data mining type OR Multiple linear regression—regression data mining type Note: The method is chosen depending on the data mining type | X | |||
| 5. Definition of the dependent parameter | Selection of the output value of process parameters based on the established data mining goal | Experts’ and workers’ analysis | X | X | ||
| 6. Optimization and creation of a precisely selected small data set | Preprocessing of the collected data set consists of influential process parameters using range analysis to calculate the difference between the maximum and minimum values by reducing all collected files to one file with the same dimension. This is followed by linking the preprocessed data set to the dependent parameter | Range analysis | X | |||
| Phase | Step | Step Execution Method | Results |
|---|---|---|---|
| 1—Smart quality management problem definition | 1. Determination of manufacturing system’s objective | Interviews with engineering experts and shop floor workers |
|
| 2. Determination of the location of the problem | Experts’ and workers’ analysis |
| |
| 3. Determination of the type of problem | Data mining |
| |
| 2—Parameter identification and IIoT data collection | 1. Definition of criteria for identifying influential parameters | Interviews with engineering experts and shop floor workers |
|
| 2. Identification of influential parameters | Experts’ and workers’ analysis |
| |
| 3. Big data collection of influential parameters | Edge computing |
| |
| 3—Edge computing data preprocessing | 1. Data visualization of each influential parameter | Visual analysis |
|
| 2. Elimination of inconsistent, constant, and noisy data | Manual rows deletion of timestamp data |
| |
| 3. Addition of values to incomplete data | Visual analysis |
| |
| 4. Reduction of collected process parameters | Correlation analysis |
| |
| 5. Definition of the dependent parameter | Experts’ and workers’ analysis |
| |
| 6. Optimization and creation of a precisely selected small data set precisely selected | Range analysis |
|
Disclaimer/Publisher’s Note: The statements, opinions and data contained in all publications are solely those of the individual author(s) and contributor(s) and not of MDPI and/or the editor(s). MDPI and/or the editor(s) disclaim responsibility for any injury to people or property resulting from any ideas, methods, instructions or products referred to in the content. |
© 2023 by the authors. Licensee MDPI, Basel, Switzerland. This article is an open access article distributed under the terms and conditions of the Creative Commons Attribution (CC BY) license (https://creativecommons.org/licenses/by/4.0/).
Share and Cite
Bajic, B.; Suzic, N.; Moraca, S.; Stefanović, M.; Jovicic, M.; Rikalovic, A. Edge Computing Data Optimization for Smart Quality Management: Industry 5.0 Perspective. Sustainability 2023, 15, 6032. https://doi.org/10.3390/su15076032
Bajic B, Suzic N, Moraca S, Stefanović M, Jovicic M, Rikalovic A. Edge Computing Data Optimization for Smart Quality Management: Industry 5.0 Perspective. Sustainability. 2023; 15(7):6032. https://doi.org/10.3390/su15076032
Chicago/Turabian StyleBajic, Bojana, Nikola Suzic, Slobodan Moraca, Miladin Stefanović, Milos Jovicic, and Aleksandar Rikalovic. 2023. "Edge Computing Data Optimization for Smart Quality Management: Industry 5.0 Perspective" Sustainability 15, no. 7: 6032. https://doi.org/10.3390/su15076032