Article

Exploring Gender Differences in the Role of Trait Preferences among Stakeholders in the Rice Value Chain in Ghana

by
Bright Owusu Asante
1,*,
Benedicta Nsiah Frimpong
2,
Maxwell Darko Asante
2,3,
Stephen Prah
1,
Stephen John Ayeh
2,
Bernard Sakyiamah
2,
Negussie Zenna
4,
Gaudiose Mujawamariya
5 and
Hale Ann Tufan
6
1
Department of Agricultural Economics, Agribusiness and Extension, Kwame Nkrumah University of Science and Technology, Kumasi P.O. Box 1279, Ghana
2
CSIR–Crops Research Institute, Kumasi P.O. Box 3785, Ghana
3
Department of Plant Resources Development, College of Science and Technology, Fumesua P.O. Box 3785, Ghana
4
Africa Rice Center (AfricaRice), Dar es Salaam P.O. Box 33581, Tanzania
5
Africa Rice Center (AfricaRice), Antananarivo P.O. Box 1690, Analamanga, Madagascar
6
School of Integrative Plant Science, Cornell University, Ithaca, NY 14850, USA
*
Author to whom correspondence should be addressed.
Sustainability 2023, 15(7), 6026; https://doi.org/10.3390/su15076026
Submission received: 12 December 2022 / Revised: 11 March 2023 / Accepted: 20 March 2023 / Published: 30 March 2023

Abstract

:
This paper examines the gendered trait preferences for rice and their role in the adoption of improved rice varieties among men and women rice farmers in Ghana. Four hundred rice farm households and 261 consumers were surveyed across 20 communities using a simple random sampling technique. Kendall’s coefficient of concordance, Tobit, and the multivariate probit regressions were used in the analyses. The results show differences in preferences for cooking quality traits and postharvest traits among men and women farmers. There was also a gender differential in the intensity of purchasing rice among men and women consumers. The results show that rice farmers’ decisions to adopt any of the four varieties—AGRA rice, Jasmine, Togo Marshall, or Amankwatia—are influenced by age, being married or indigenous, years of schooling, off-farm activities, farming experience, household size, farm size, FBO membership, extension contact, market proximity, and access to credit. To improve the rice value chain in Ghana, rice breeding efforts should consider varieties with trait preferences such as being tolerant of pest and diseases, aromatic, early maturing, and tolerance to shattering. However, to enhance the consumption of improved rice varieties, breeding efforts should target varieties that are aromatic, good textured, and have medium-sized grains for female consumers, while for male consumers preferred varieties would be less easily broken, white grain color, translucent, and with short cooking time.
JEL Classification:
J16; Q1; Q12; Q15; Q1

1. Introduction

Sustainability is threatened by a range of interconnected factors that require a concerted effort to address. Climate change, deforestation, pollution, and unsustainable agriculture are some of the factors threatening sustainability [1]. The 21st century has seen a dramatic increase in the complexity and interconnectedness of the food system. The world has become more aware of the issues of food insecurity and poverty [2,3,4,5]. The number of people suffering from hunger globally has increased due to a number of factors, including population growth, climate change, and economic inequality [6,7]. Africa’s agricultural systems have faced rising difficulties for decades due to increasing food demand fueled by rapid population growth and inadequate food output [3,4]. According to research, soil infertility and continuous cropping systems, coupled with constraints in promoting improved agricultural technologies, are some of the numerous contributing factors to low food production in sub-Saharan Africa [6,8,9]. Food insecurity remains an issue in West Africa [10]. About 14.7% of the West African population is undernourished [11]. Staples such as cereals, roots, and tubers are the foundation of food security and account for about 67% of the daily caloric intake in West Africa, a region with a relatively low diversity of plant-based foods [7,12,13]. The rice value chain has been identified as a strategic commodity for food security in sub-Saharan and West Africa [10,14]. For instance, rice production across West Africa has been rising gradually, from 3.2 million tons in 1980 to 18.5 million tons in 2018 [7]. In addition, over the past decades, there has been a steady trend in the importance of rice in West African diets, so that it now accounts for about 36% of all the cereal consumed [7,15]. However, expansion of agricultural land for rice production has been the main precursor of an average annual increase in harvested areas by 7.5% in Nigeria, Senegal, Mali, Ghana, and Cote d’Ivoire [10,16]. In addition, between 2020 and 2021, Africa produced about 24 million metric tons of rice. However, projections indicated that rice production may slightly decline to about 23 million metric tons in 2021–2022 [17]. This situation is caused by a variety of contextual factors. For instance, population growth and rapid urbanization, fluctuating global food prices, unfavorable biotic and abiotic conditions, climate variability and change, and political unrest or wars all have an impact on both food access and availability.
In Ghana, rice is a crucial strategic crop that is grown for both food and cash. The rise in population, urbanization, and shifting consumer preferences all contribute to the ongoing rise in rice consumption. According to Ministry of Food and Agriculture [18], paddy rice production between 2008 and 2020 ranged between 302,000 metric tons and 987,000 metric tons out of which milled rice accounted for between 181,000 and 622,000 metric tons with significant annual fluctuations [18]. Nevertheless, average rice yields in Ghana are significantly lower compared to those of other countries. For instance, the current national average rice yield is estimated to be 5.2 million tonnes [7]. Comparing Ghana’s rice yield with that of other countries, such as Nigeria (29.5 million tonnes), Egypt (6.2 million tonnes), Mali (8.8 million tonnes), Japan (10.5 million tonnes), Thailand (33.2 million tonnes) and Pakistan (14.0 million tonnes), it is apparent that the performance of rice in Ghana is relatively low [7,19,20]. Low rice yields stem from a variety of contextual elements. Under continuously rising demand, factors such as population growth and rapid urbanization, fluctuating global food prices, unfavorable biotic and abiotic conditions, climate variability, and political unrest affect both food availability and accessibility [21,22,23].
To address this challenge, new technological innovations have been developed and adopted by farmers. Stakeholder perceptions and experiences with the potential benefits of the new variety will determine whether they choose to switch from an existing rice variety to a new one [24,25]. Definition of new variety product profiles with higher adoption potential is made possible by knowledge of the trait characteristics preferred by both men and women farmers as well as other actors in the value chain. According to Laborte et al. [26], the market is appealing in terms of quantifiable customers, profitability, response to differentiated products, and stable returns that can support investment.
Key productive resources that are essential to agriculture’s success are not equally accessible to or controlled by men and women. Additionally, gender differences have an impact on how new varieties are used, how these varieties are marketed, and how different farmers and other value chain actors value these varieties [21]. Farmers’ preferences for traits vary depending on factors such as farm characteristics, production systems, and farmers’ production goals (see [21,22,23,26,27]). The same crop varieties can be chosen and grown by men and women in the same conditions or in different ones for a variety of reasons [21]. Men and women have different trait preferences when they are subjected to various constraints, have various roles and responsibilities within the production and consumption systems, and have various crop production objectives [28]. Women’s preferences for particular varietal traits such as early maturity, postharvest processing, and food preparation (including storability, grain color, and texture), are more frequently associated with food security traits [21]. Additionally, women are drawn to certain essential aspects of family food security such as early harvests, multiple harvests, production potential during full growing seasons, and productivity in the presence of poor soil fertility [28].
Various studies have examined trait preferences in rice variety adoption [29,30,31,32,33,34,35,36,37]. However, in spite of the critical relevance of trait preference in the choice and uptake of improved rice varieties, most of these studies failed to examine the difference in trait preference and on adoption variants between men and women stakeholders in the rice value chain. Only a few studies have compared trait differences in consumer and producer studies across Africa. For instance, Bairagi et al. [38], investigated consumer preferences for rice attributes in seven South and Southeast Asian countries, using predefined characteristics of rice, and found a positive correlation between consumer preference and the fact that women were the principal grocery shopping decision-makers in the household. Addison et al. [39] examined the constraints and differences in varietal preferences among men and women rice farmers in lowland rice ecosystem in the Ashanti Region of Ghana and identified specific varietal preferences among men and women rice farmers.
These studies underscore the importance of gender in eliciting trait preferences and its role in varietal adoption among stakeholders in the rice value chain. Hence, developing crop varieties while considering trait preferences among men and women is found to increase the adoption of improved crop varieties and hence these need to be incorporated into national breeding policies [38,39]. This paper examines the role of trait preferences among men and women stakeholders in the rice value chain in Ghana. The focus is on the identification of preferred traits that will improve the development of better rice varieties for farmers and other actors in the rice value chain. Breeding programs have long understood the significance of taking into account and incorporating gender differences in trait preferences.
This paper contributes in the following ways. Firstly, to the best of our knowledge, this the first to provide empirical evidence of the distinct trait preferences of men and women stakeholders in the rice value chain, which is lacking in most studies on gender preference and adoption. Secondly, unlike previous studies, we employed multivariate regression models to investigate the role of trait preference in the adoption of improved rice varieties among men and women rice farmers. The study provides useful insights for enhancing the uptake of improved rice varieties across major stakeholders in the rice value chain, as well as promoting the development of demand-driven rice varieties with specific desired traits suitable for utilization by men and women stakeholders across the rice value chain. The rest of the paper is structured as follows. Next is the methodology section, which includes a description of the study area, sampling, analytical procedure, and empirical specifications. This is followed by the results and discussion, and the final section presents the conclusions and policy recommendations.

2. Materials and Methods
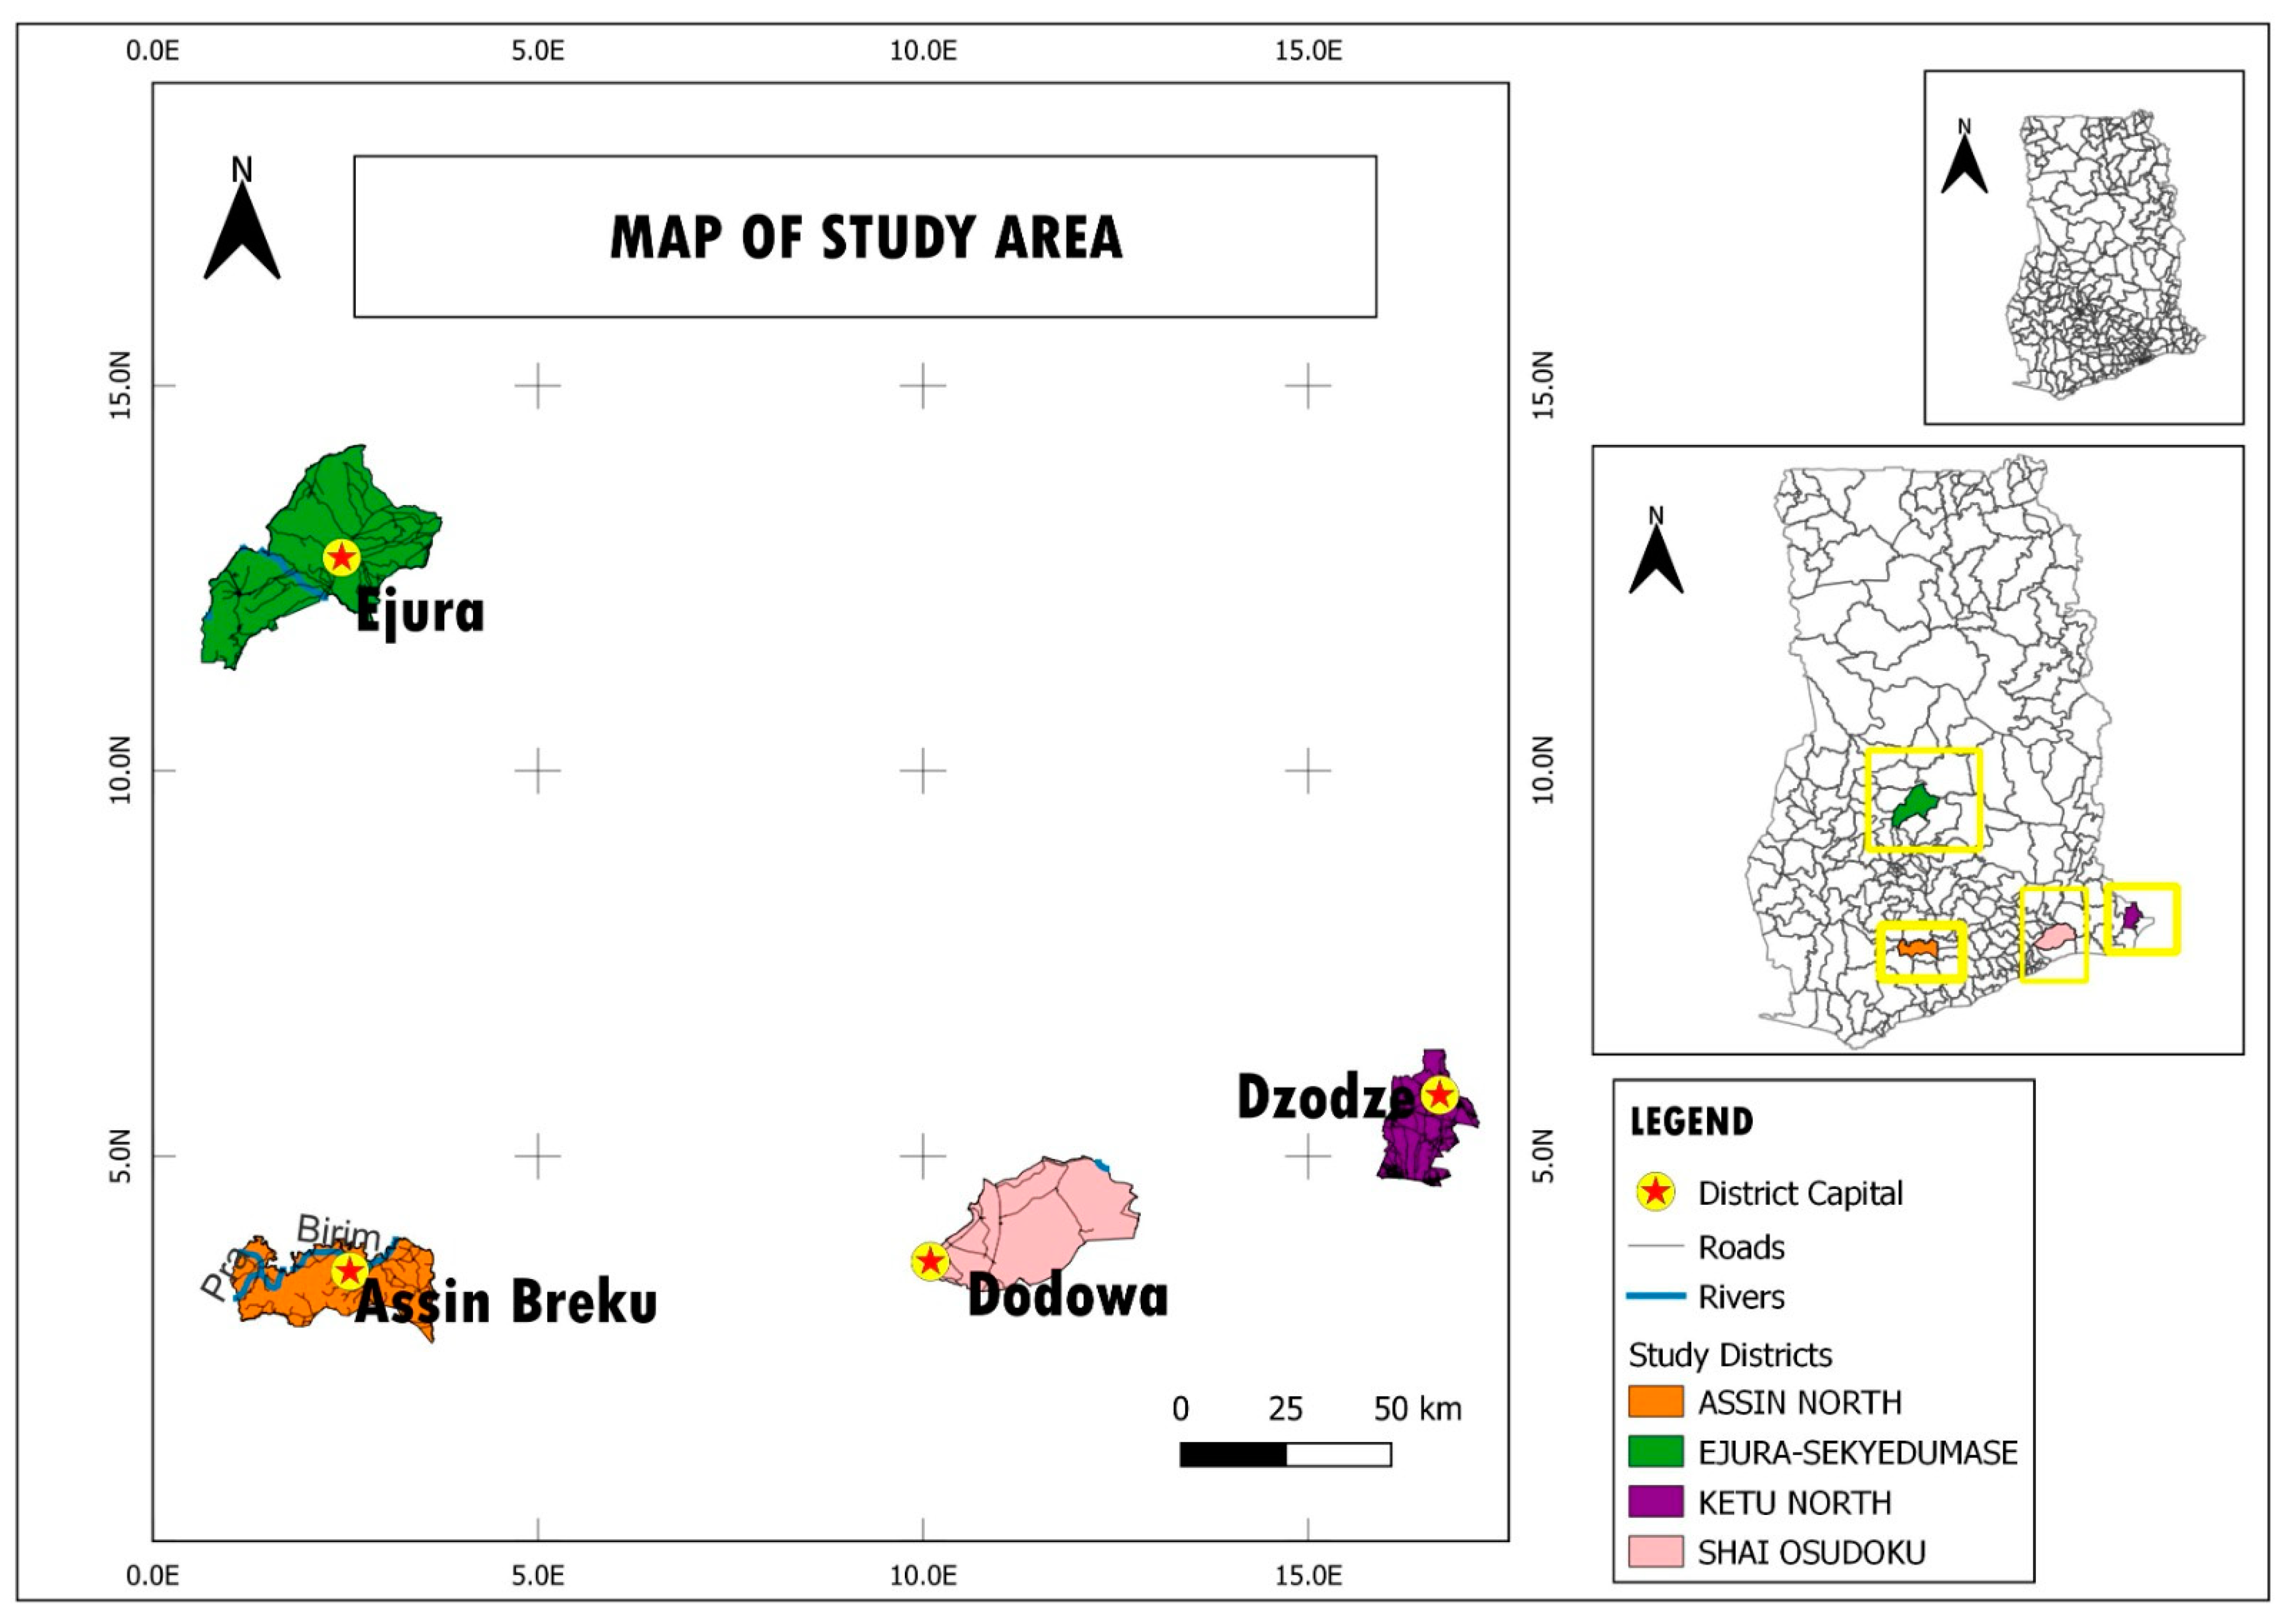
2.1. Study Area

The study was conducted in four rice-producing regions in southern Ghana: the Ashanti, Central, Greater Accra, and Volta regions. We selected one administrative district from each region. Ejura₋Sekyeredumase District (Ashanti), Assin North District (Central), Shai Osudoku Municipal Assembly (Greater Accra), and Ketu North District (Volta) were purposively selected due to massive production of rice. The Ejura-Sekyedumasi District is located in the northern part of Ashanti Region and is bounded to the north by Nkroanza North and the Atebutu District of the Brong Ahafo Region. To the east is the Sekyere Central area, to the south Sekyere West and Mampong, and to the west the Offinso North District, and Nkoranza North and Nkoranza South Districts. The district covers an area of 1782.2 sq km, which is about 7.3% of the total land area of the Ashanti Region. Ejura, the district capital, is 106 km from Kumasi, the regional capital. Soils in the district are good for cultivation of a variety of crops such as yams, rice, maize, groundnuts, cowpea, cassava and plantain.
The Ketu North District was one of the seventeen districts in the Volta Region of the Republic of Ghana with its administrative capital as Dzodze. The district is noted widely in the West African subregion for its production and marketing of exclusive quality palm oil, gari, and the famous Afife rice (Togo Marshal). The district is located at the southeastern corner of the Volta Region of Ghana and lies between latitudes 6°03′ N and 6°20′ N and longitudes 0°49′ E and 1°05′ E. It shares boundaries to the north with Akatsi District, to the east with the Republic of Togo, to the south with the Ketu South, and Keta District to the west. The soil type in the area supports the cultivation of agricultural crops such as maize, groundnut, cowpea, cassava, rice plantain, oil palm, mango, pear, and most vegetables.
The Assin North District forms part of the 22 Municipal and District Assemblies (MMDAs) in the Central Region. Is situated between longitudes 10°05′ E and 10°25′ W and latitudes 60°05′ N and 60°4′ S. The district is bounded to the north by the Adansi South District in the Ashanti Region, to the south by the Assin Foso Municipal, to the east by the Birim South District in the Eastern Region, and to the west by the Twifo Atti-Morkwa District. The Assin North District is committed to prioritizing the cultivation of hybrid rice under the Special Rice Initiative (SRI).
The Shai Osudoku District (formerly Dangme West) is situated in the southeastern part of Ghana, lying between latitude 5°45′ S and 6°05′ N and longitude 0°05′ E and 0°20′ W. The administrative capital of the district is Dodowa. The Shai Osudoku District shares boundaries with Yilo Krobo Municipal, Lower Manya Krobo Municipal, and Asuogyaman District to the north, respectively, to the east with Ada West District, to the south with Ningo Prampram District, and to the west with Akuapem North Municipal and Tema Metropolitan, respectively (Figure 1).

2.2. Data, Sampling, and Sample Size

Primary data and secondary information were solicited for the study. A structured questionnaire was designed to collect the primary data. Qualitative data were collected through key informant interviews (KIIs) and focus group discussion (FGD) using a carefully designed checklist. Data collected comprised socioeconomic information, production data, gendered adoption data, and gendered trait preference data in the rice value chain. Secondary information was sourced from the Council of Scientific Research, MoFA, journals, and FAO website.
The multi-stage sampling technique was used to select respondents for the study. A purposive sampling technique was foremost used to select major rice-growing districts. From each district/municipality, five communities were randomly selected, resulting in twenty communities selected from the four regions. From each district, 100 rice producing households were randomly selected. In all, 400 rice farmers were sampled in the study. After segregating the farmers, 266 and 134 were men and women involved in rice production, respectively. For the consumers, a total of 261 were sampled, 188 women and 73 men.

2.3. Theoretical Framework and Empirical Specification

Data were collected and analyzed using Stata version 16 and SPSS software version 25. All socioeconomic and institutional factors were summarized using descriptive statistics such as frequency tables and charts. We examined the trait preferences by adopting a 4-point scale in which 1 = required, 2 = important, 3 = nice to have, and 4 = neutral. Further, the Kendall’s coefficient of concordance (W) as described by [40] was used to rank improved varietal attribute preferences of farmers. The rank ranged from 1 = required, to 2 = important, 3 = nice to have, and 4 = neutral. The Kendall’s W was estimated as:
W = 12 R ¯ i 2 3 N ( N 1 ) 2 N ( N 1 )
where W = Kendall’s value
N = total sample size
R = mean of the rank
The Kendall’s W indicates the level of agreement among the farmers of the rankings obtained. Appropriately, a higher Kendall’s W denotes high level of agreement on the rankings.

2.4. Tobit Model for Estimating the Intensity of Rice Purchasing by Consumers

We estimated the intensity of rice purchasing among men and women rice consumers using the Tobit regression model. This is because this paper assumes that consumers’ instantaneous decisions to adopt and the decision on frequency of rice purchasing are made jointly. Based on this assumption, a randomly selected consumer who purchases rice is assigned a value of 1. A non-consumer will not purchase rice, hence assigned a value of 0. We denote the frequency of purchase by y . Therefore, y = 0 , 1 , 2 , 3 , ... , N and is defined as number of times a consumer purchases rice.
Following [41], we express the association between the observed y and the unobserved latent variable y i * as:
y i * = X i β + φ i ,   i = 1 ,   2 ,   3 ,   ...... N
where φ i N ( 0 , σ 2 ) , and X i denotes the ( K × 1 ) vector of exogenous and fully observed regressors. If y * were observed, we would estimate ( β , σ 2 ) by OLS in the usual way; however, this is not the case. The relationship between he observed variable y i and the latent variable y i * is specified as:
y = { y * if   y * > L L if   y *   L  
The probability of an observation being censored is given by:
Pr (   y *   L ) = Pr ( X i β + φ i   L ) = Φ { L X i β / σ } ,
where Φ   ( . ) is the standard normal cumulative distribution function. The truncated mean of expected value of the y for noncensored observations is thus presented as:
E ( y i | X i   y i ) = X i β + σ ϕ { ( X i β L ) / σ } Φ { ( L X i β ) / σ }
where ϕ ( . ) is the standard normal density.
Following Asante et al. [42], the Tobit model for examining the intensity of rice purchasing among men and women rice consumers is empirically specified as:
E P F = η + X i β + γ i
where E P F is the frequency of rice purchase by a consumer and X i is a vector of individual-, household- and farm-level determinants of rice purchasing frequency. γ i is a random error term.

2.5. Multivariate Probit for Estimating the Adoption of Improved Rice Varieties by Farmers

To understand farmers’ decisions to adopt a rice trait, adoption and diffusion theories provide a methodical and comprehensive analytical approach. The choice to adopt a specific technology is influenced by a number of factors, including technical, economic, and social factors based on previous adoption literature [43,44,45,46]. Undoubtedly, a combination of these factors could have an influence on whether or not rice trait technology is adopted. There is an ongoing, intensified campaign about the necessity of raising adoption of rice trait technologies throughout the developing world as an adaptation measure to mitigate the impact of climate change on farm yield in the current era of changing climate. A different proposal has been made, urging a combined strategy of integrating native farming innovations with contemporary production methods as an adaptation measure to diminish the impact of climate change on food production [47].
Adoption decisions regarding rice traits are not mutually exclusive. These decisions are subject to adopting more than rice traits. More specifically, a rice farmer can choose to adopt as many among the rice traits as he/she wants to adopt. A randomly selected farmer is likely to adopt a particular rice trait only if the benefits obtained from adopting is greater than non-adoption. We assumed that the adoption decision followed a random utility framework [48,49]. The ith rice farmer face with the decision to adopt a jth rice trait where i = 1, 2, 3…, n; and j = 1, 2, 3…, n, thus, j = AGRA (A), jasmine (J), Togo Marshall (TM), and Amankwatia (AK). Let y * denote the difference between the utility from adoption ( U i A ) and the utility from non-adoption ( U i N A ) of rice trait, such that ith rice farmer will choose to adopt the rice trait if y * = U i A U i N A > 0 . The net benefit from the adoption of rice trait is a latent variable determined by observed socioeconomic and institutional factors (Xi), and the error term (ɛi) specified as:
y * i j = X i ψ j + ω i
Again, the two utilities are unobservable; however, they can be expressed for each rice trait as a function of observable components in the latent variable specified as:
y i j = { 1 = y * i j > 0 0 = o t h e r w i s e }
where y * i j = latent variable which represents the observed and unobserved preferences associated with the jth rice trait, and y i j = binary dependent variables. X j k = set of socioeconomic and institutional factors. ψ k = parameters to be estimated and ω k = multivariate normally distributed stochastic error term. In the MVP estimations, there is a possibility of adopting multiple rice traits, the error terms jointly follow a multivariate normal distribution (MVN) with zero conditional mean and variance normalized to unity; that is, (UA, UTM, UAK, UJ) ≈ MVN (0, Ω), which is specified as:
Ω = [ 1 ρ J . ρ A K ρ A 1 . . . . 1 ρ T M ρ A K . ρ T M 1 ]
where ρ represents the pairwise correlation coefficient of the error terms with regards to any two of the estimated adoption equations of the safety practices. Subsequently, the off-diagonal elements (e.g., ρAK, ρTM) in the covariance matrix indicate the correlation between the stochastic components of the different rice trait adopted [49]. The non-zero value of these correlations in the off-diagonal elements supports the appropriateness of the use of the multivariate probit model.

3. Results and Discussion

3.1. Socioeconomics Characteristics of Rice Producers

Table 1 presents the summary statistics of the socioeconomic characteristics of rice farmers. The differences between men and women based on socioeconomic characteristics using the t-test indicates a great number of variables such as years of education, residential status, marital status, off-farm income, rice-farming experience, household head, farm size, extension access, farmer-based organization membership, and frequency of rice cultivation were statistically significant, suggesting differences in these variables for men and women. For instance, it was evident that men (66.5%) dominated rice production more than women (33.5%). The implication of this finding reflects the deeply rooted cultural settings of most typical Ghanaian rural communities, where the men are thus the owners of the farms and, hence, tend to participate in more activity concerning the farm than women. In other words, women farmers tend to assist their men counterparts to undertake farming activities. On average, women farmers (46.5 years) were older than men (45.5 years). This implies that both groups fall within the agricultural productive age range of 30–50 years [7]. This result confirms the findings of [50], who reported 45 years as the average age of a typical Ghanaian rice farmer.
The average rice farmer is educated up to a basic level. The men rice farmers, on average, spent 9 years in schooling, whereas their women counterparts spent an average of 6 years in schooling, and the difference was statistically significant at the 1% level. The higher number of years of education of rice farmers was more likely to encourage adoption of rice traits because educated farmers appreciate sophisticated technologies more than uneducated farmers. The residential status of respondents shows that a greater proportion (58%) of the rice farmers are indigenes. Generally, about 83% of the respondents were married, with an average household size of six members, and cultivated an average of 4.8 acres. Additionally, close to 39% of the rice farmers engaged in off-farm income activities, with an average annual off-farm income of GHS 4941.76. Among the groups, majority of the women rice farmers (34%) engaged in off-farm activities with an average annual off-farm income of GHS 2582.9. Compared to the men rice farmers, they recorded an average annual off-farm income of GHS 5928.18 with 41% engaged in income-generating activities. Generally, a typical rice farmer had an average of 14 years of experience in rice farming, suggesting farmers’ ability to have observed similar rice traits before, and thus stimulate adoption. Furthermore, about 58% and 61% of the women and men rice farmers had access to agricultural extension services. The results show that in a year, the sampled farmers received an average of 12 extension visits. About 46% of the sampled rice farmers belonged to a farmer-based organization; 40% and 49% of women and men respondents indicated FBO membership, respectively. Lack of access to credit is a major constraint bedeviling the agricultural sector in Ghana. The results show that only 34% of the sampled respondents had access to credit and received an average amount of GHS 2546.79 as credit.

3.2. Socioeconomic Characteristics of Rice Consumers

Table 2 presents the summary statistics of men and women rice consumers. The results show differences in characteristics of men and women rice consumers, such as residential status, household head, number of women customers who purchased price for home consumption, and ecological zone (transition). A typical rice consumer was on average 35 years old, indicating that rice was mainly consumed by the youth. However, only 28% of the sampled consumers were men. This does not necessarily imply that most men did not consume or like rice. Instead, it depicts the deeply ingrained cultural practice in the Ghanaian society where women are often responsible for purchasing foodstuffs and preparing food for the household. The sampled rice consumer had an average of ten years of formal schooling. Again, the results show that about 55% of the respondents were indigenes, with women constituting 52% and men constituting 64%. Generally, about 60% of the respondents were married, with an average household size of four, with at least one economically active household member. About 84% of the households were headed by their men counterparts. This again demonstrates the deeply rooted cultural practice in Ghanaian society where men are often the household head and key decision-makers in the household. The mean monthly income (GHS) for women rice consumers was GHS 1229.73 and GHS 1590.25 for men. The average rice consumer in the study area usually consumed rice five times a week. About 35% of the rice consumed in the house was often purchased from women rice traders.

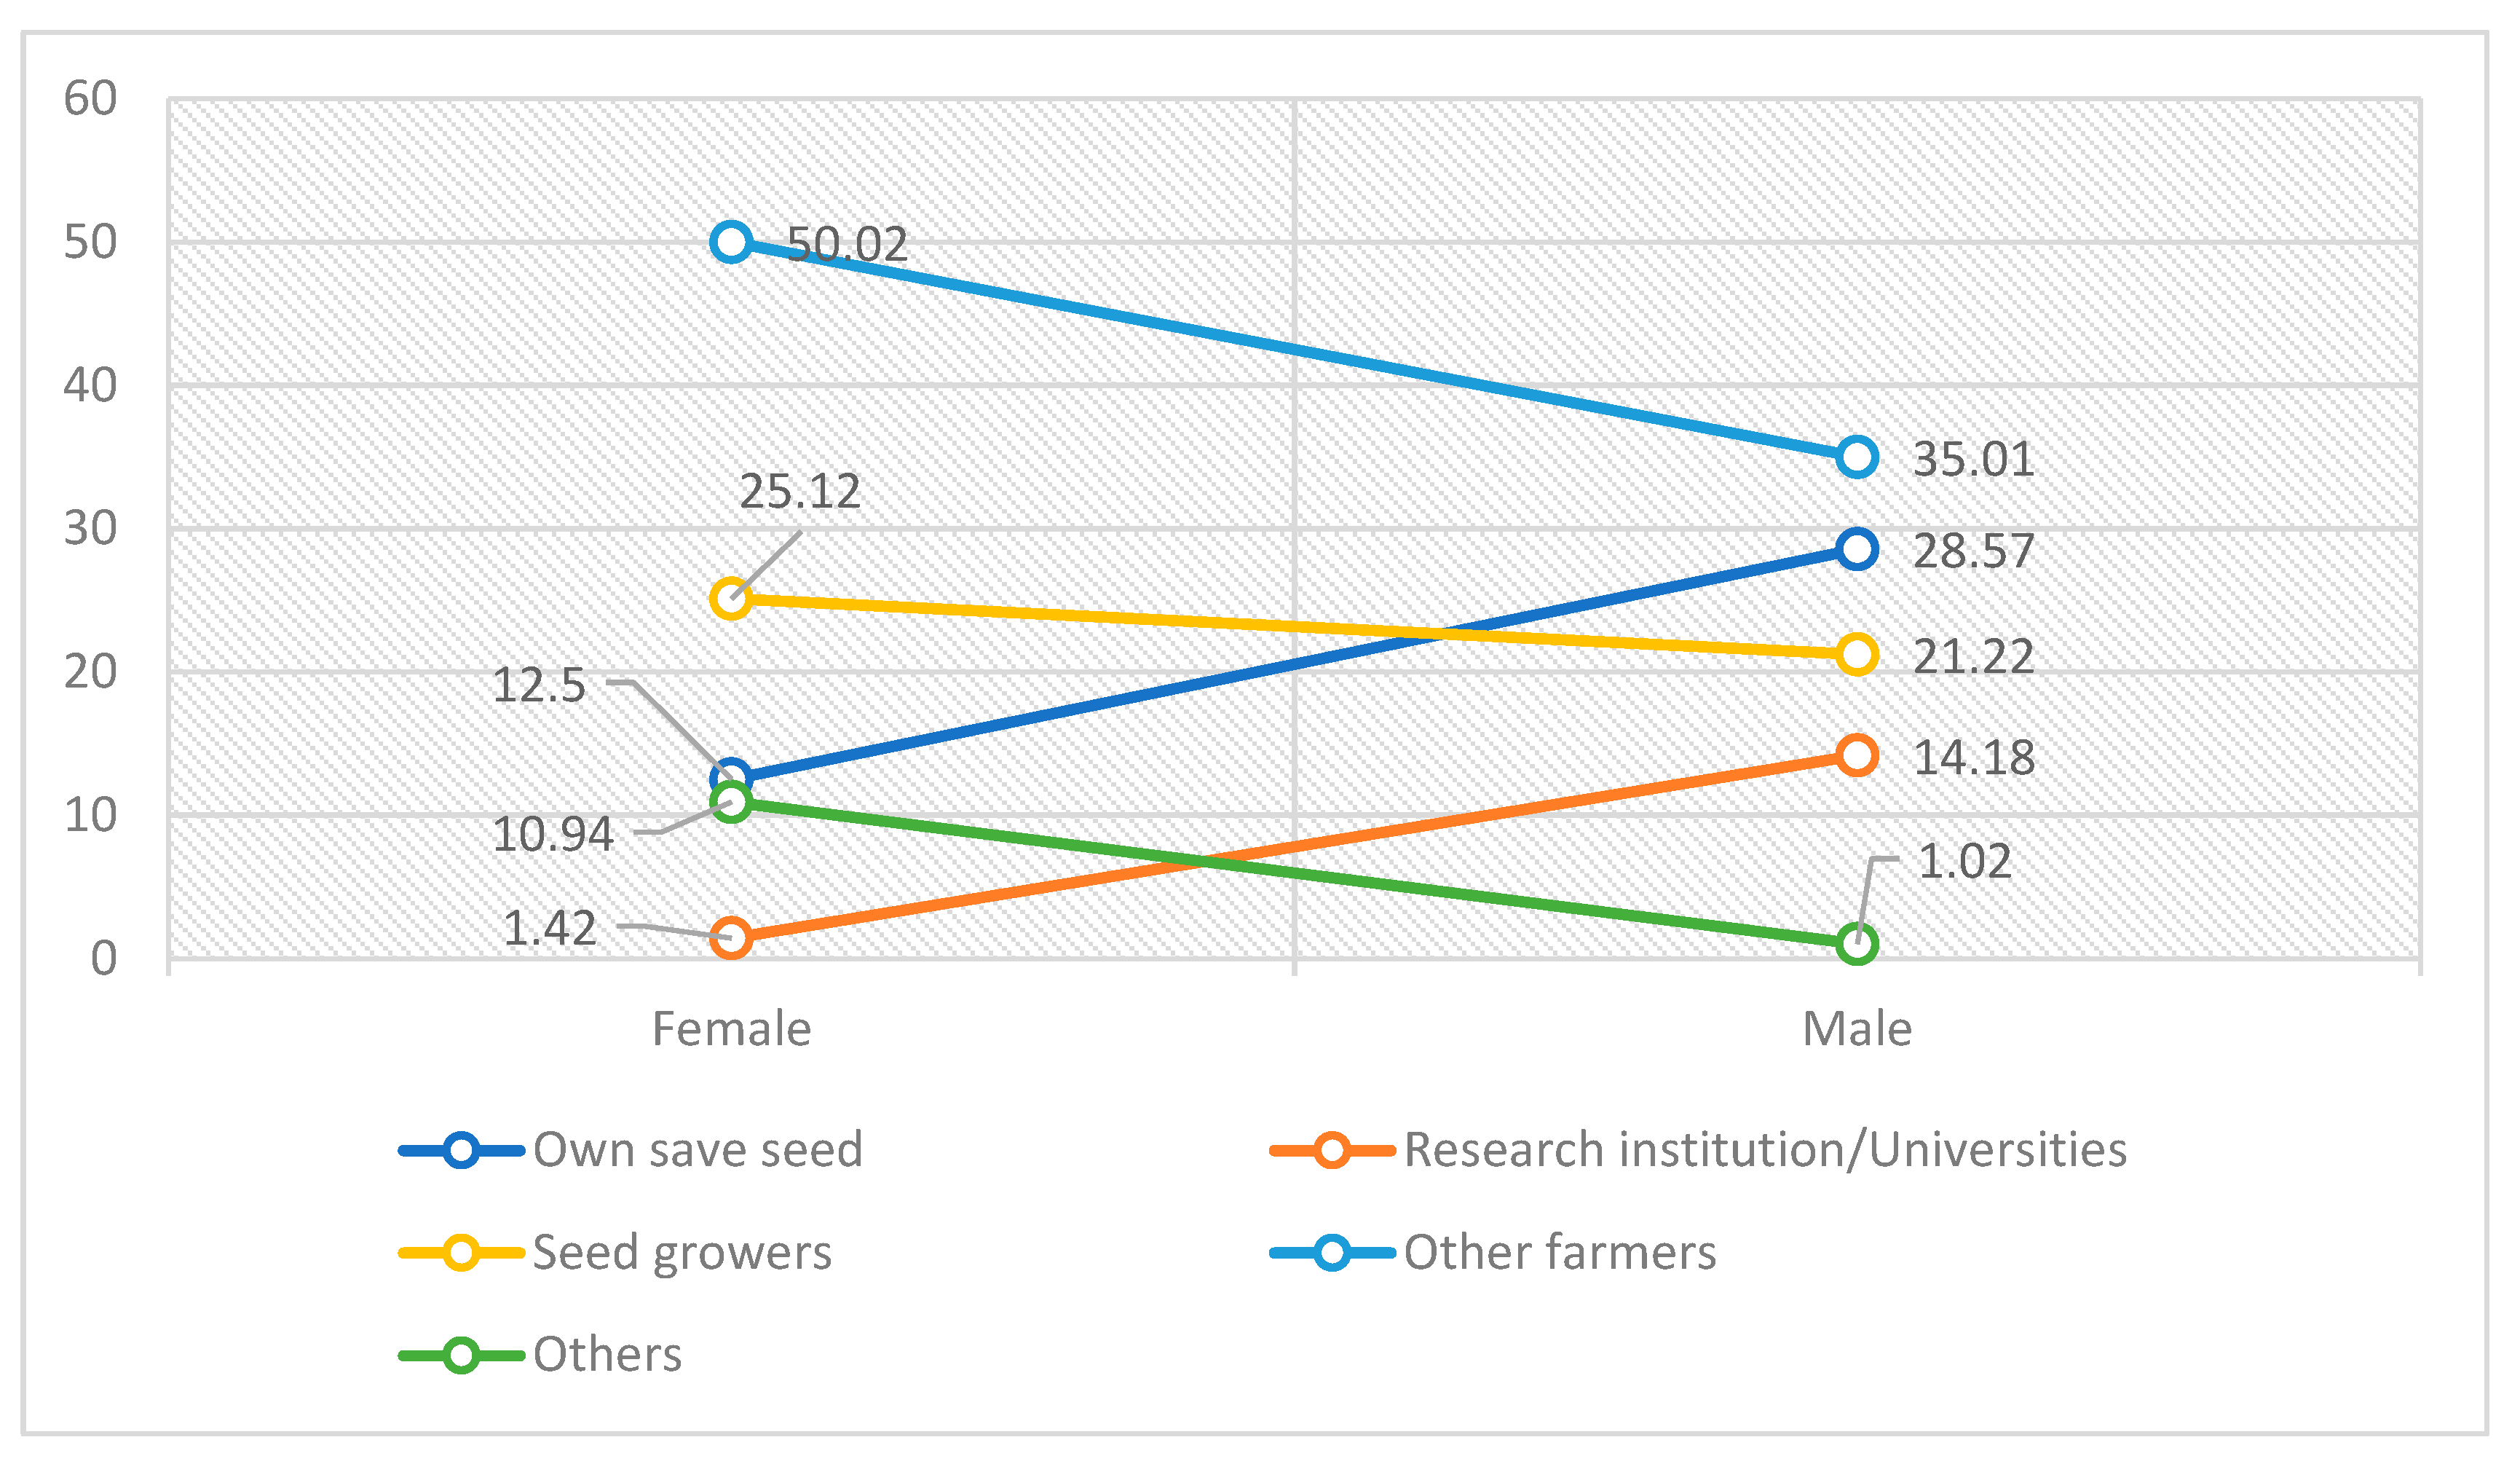
3.3. Distribution of Main Source of Rice Seed among Men and Women Farmers

We identified five main sources of rice seed used by rice farmers, illustrated by Figure 2. It was obvious half of the women rice farmers (50%) obtained rice seeds from other farmers. While 25% of women farmers obtained seeds from seed growers, about 11% purchased rice seeds from the market. Surprisingly, only 1.4% of the women rice farmers obtained seeds from research institutions/universities. In contrast, 14% of the men rice farmers obtained rice seeds from research institutions/universities, while 35% of farmers saved seed and 1% of the men farmers purchased seeds from the market. About 21% and 14% of the men farmers indicated sourcing rice seeds from seed growers and other farmers, respectively. The explanation to these findings could possibly because farmers usually obtain seeds from colleague farmers who have harvested a high yield of rice during production, hence encouraging farmers to solicit from nearby or colleague farmers.

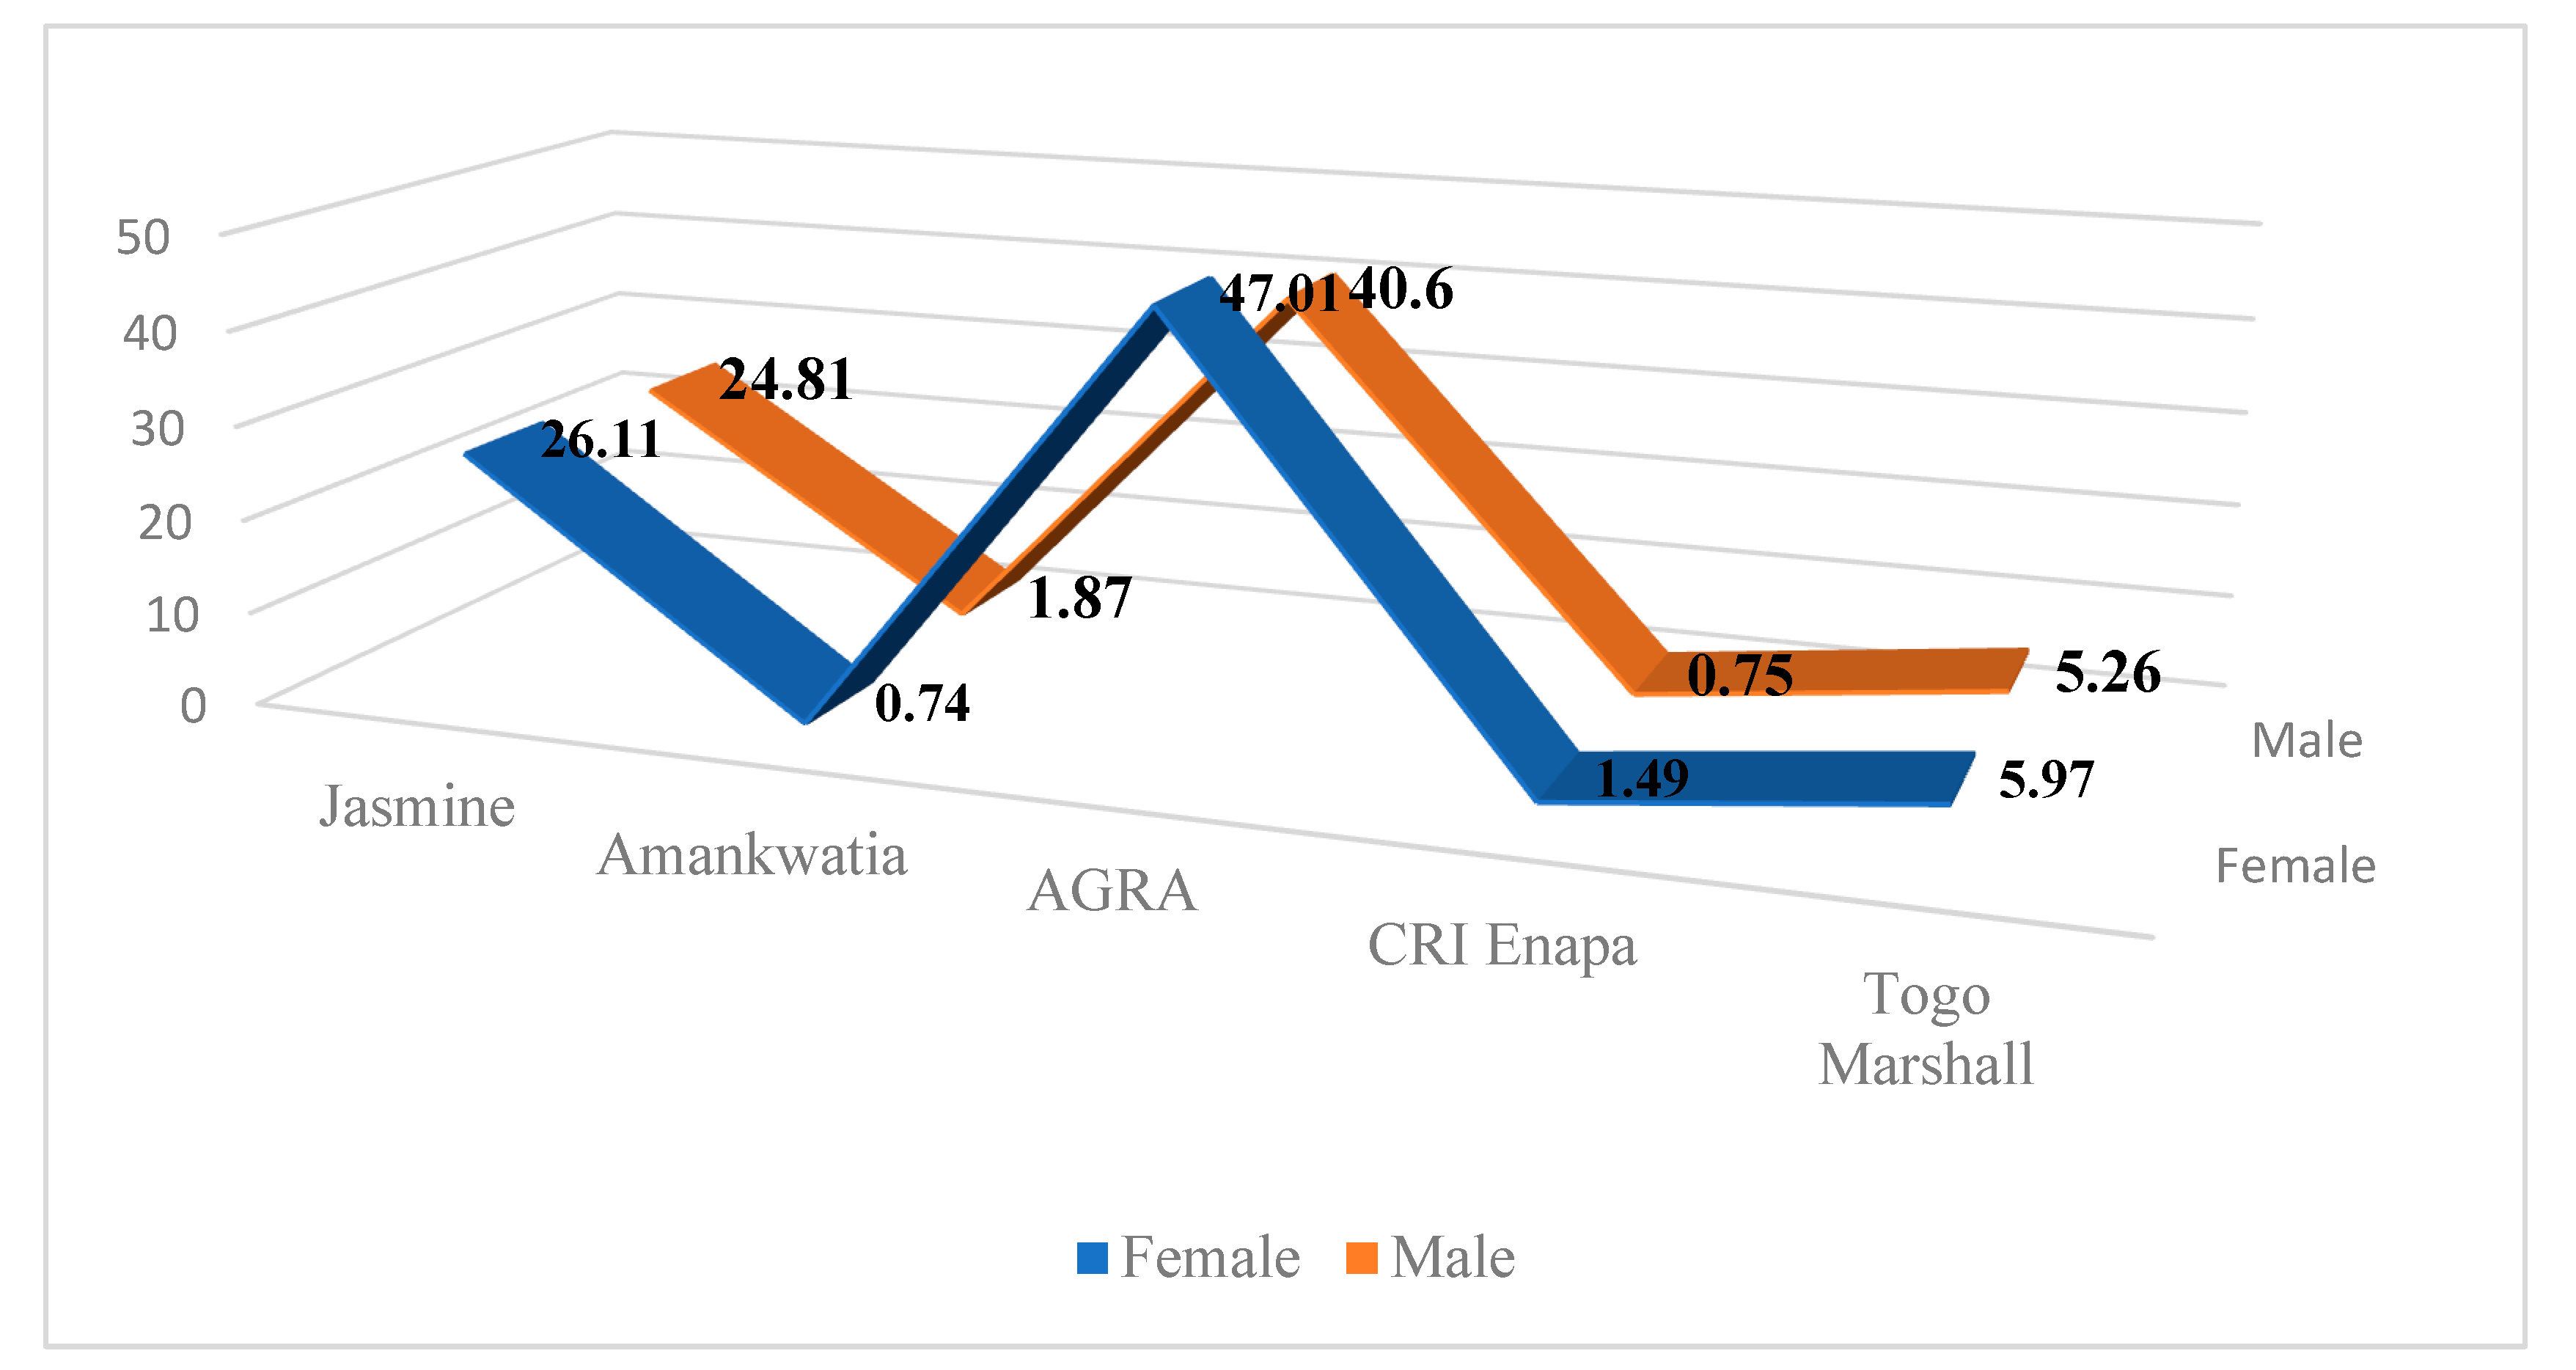
3.4. Distribution of Rice Varieties among Men and Women Farmers

Figure 3 illustrates the distribution of rice varieties cultivated among men and women farmers. The results show that AGRA rice and jasmine rice were the most widely adopted improved rice varieties. AGRA rice recorded a 47% adoption rate for women rice farmers, followed by jasmine rice with an adoption rate of 26%. Among the men farmers, there was about a 40% adoption rate for AGRA rice whereas jasmine rice recorded a 25% rate of adoption. Togo Marshall was the next rice variety most adopted by farmers, with an adoption level of 5.97% and 5.26% among women and men, respectively. CRI–Enapa and Amankwatia rice varieties were the least adopted varieties. Only 0.74% and 1.87% of women and men cultivated the Amankwatia variety, respectively, while 1.49% and 0.75% of women and men also cultivated the CRI–Enapa variety of rice, respectively.

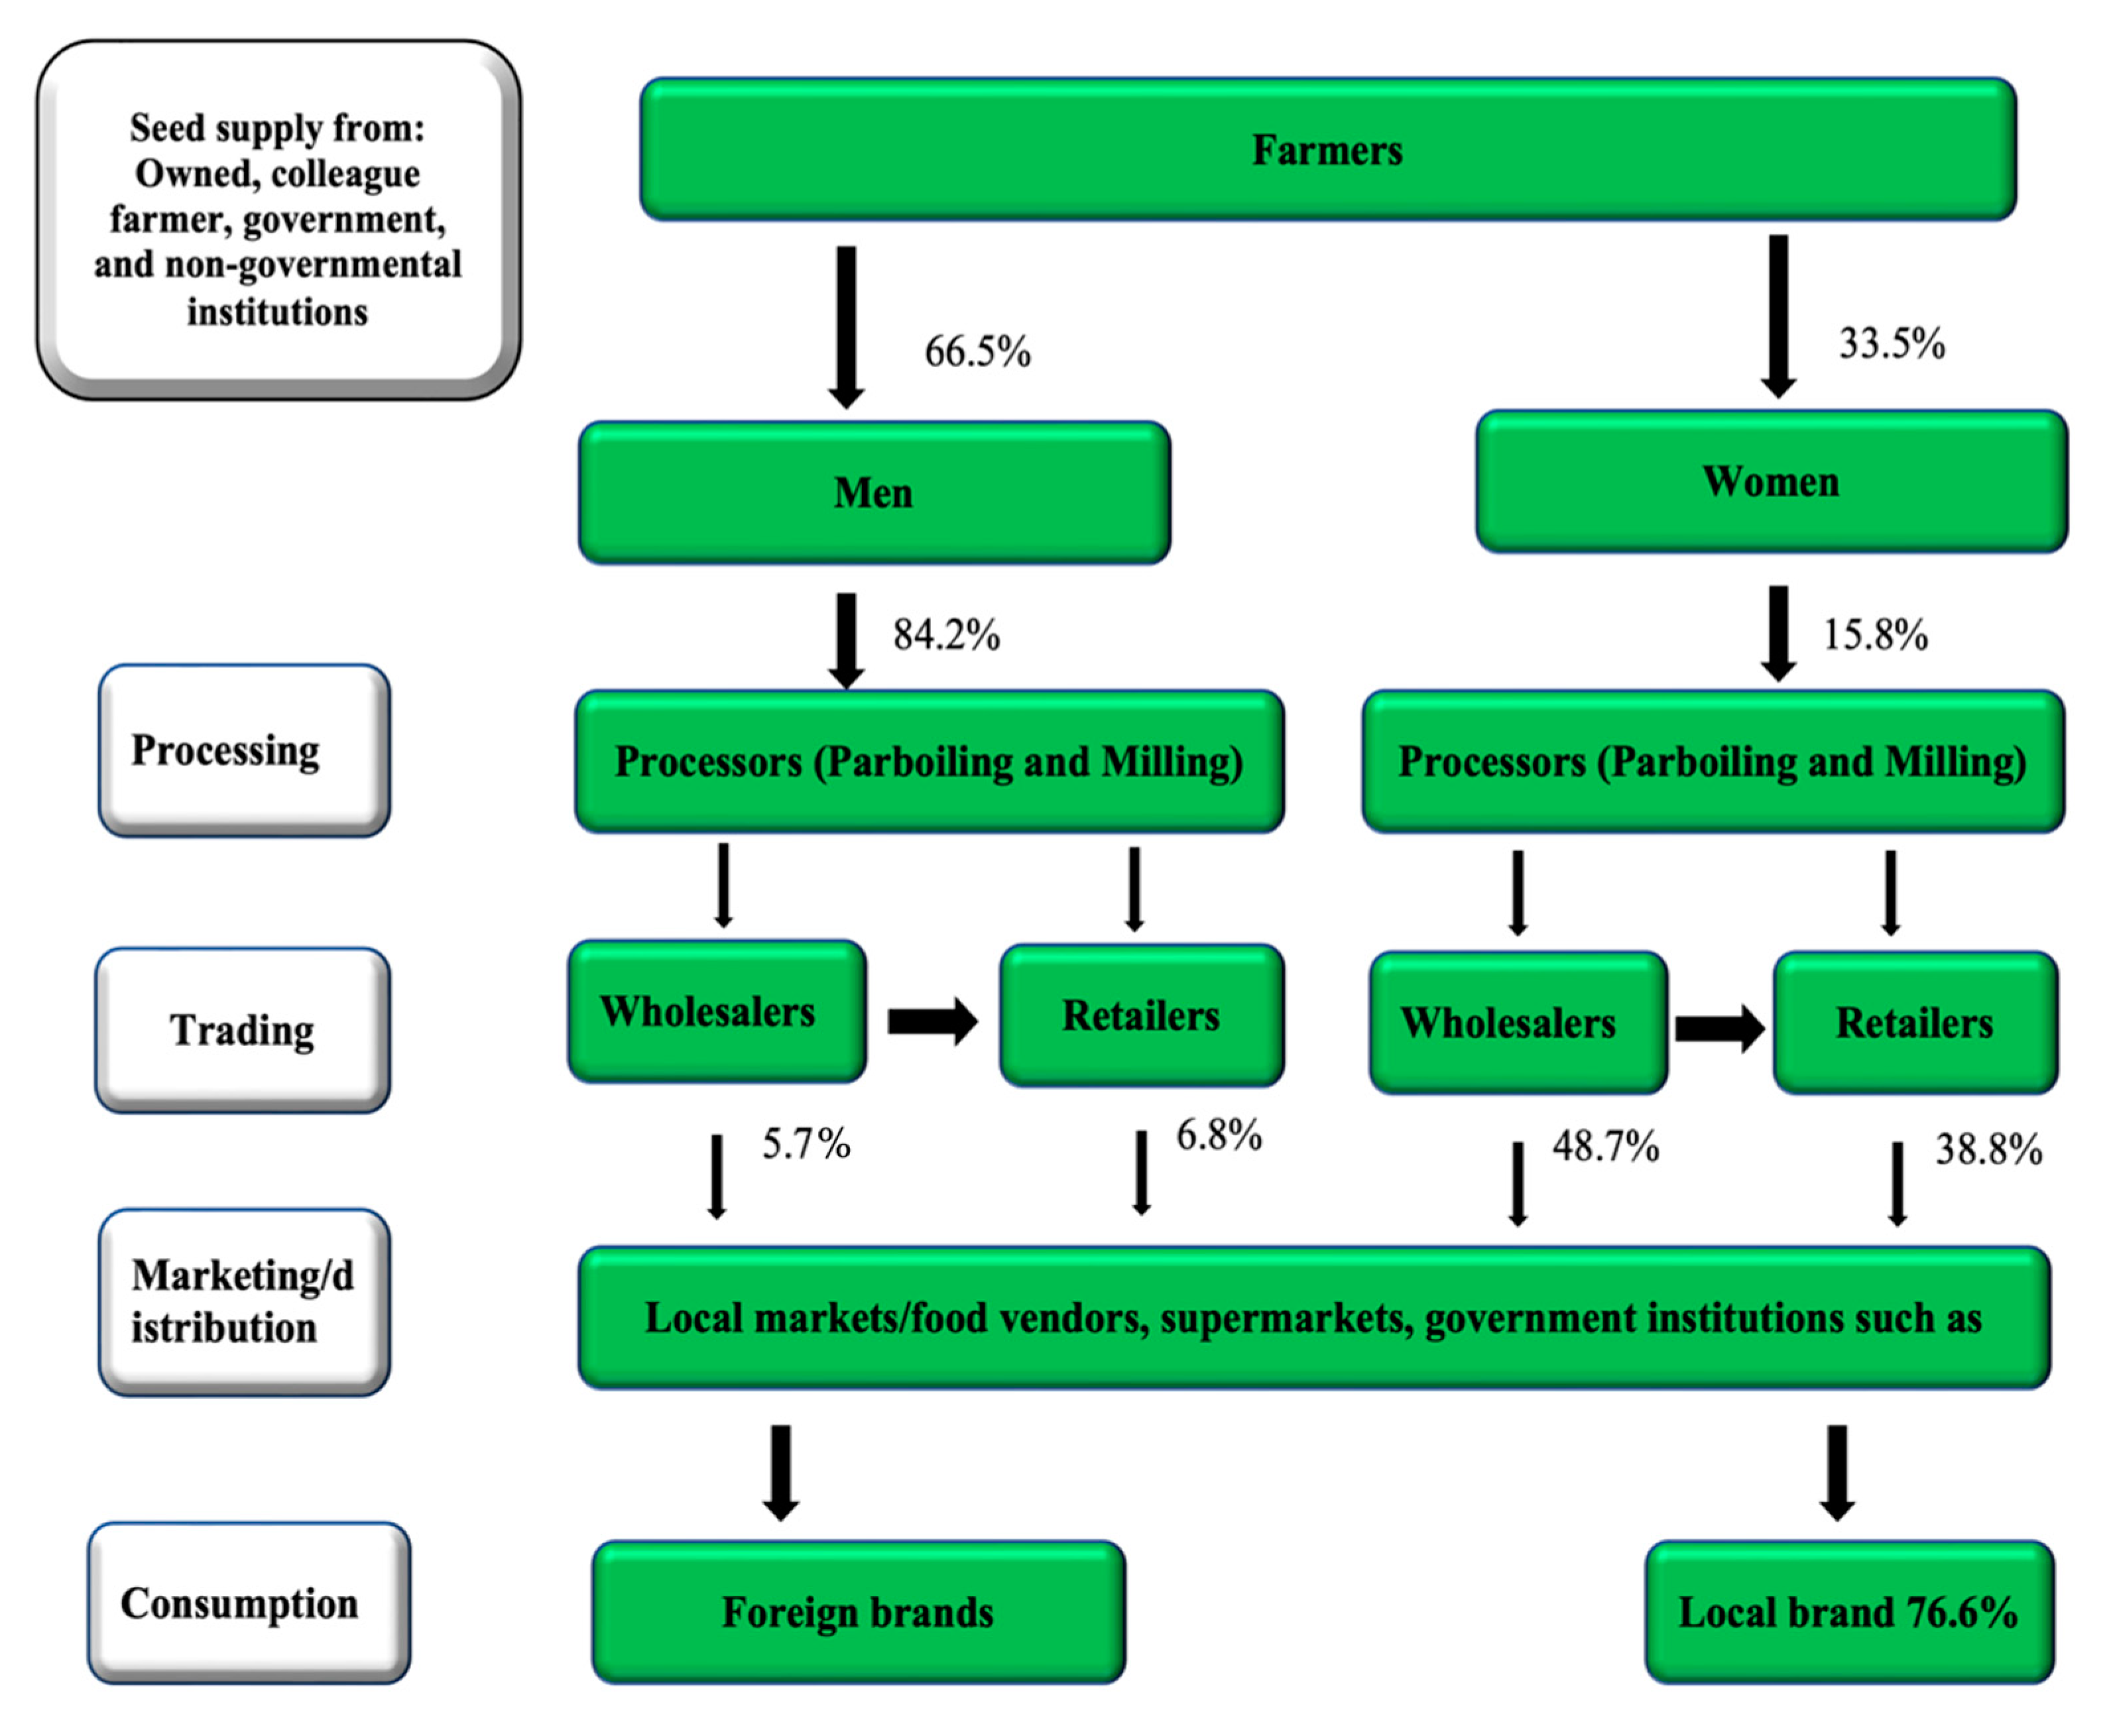
3.5. Gendered Value Chain for Rice in Ghana

Overall, the rice value chain went through five stages. It began with seed supply from either research institutions or own saved/colleague farmer, where farmers planted seeds, performed good agricultural practices and finally harvested the rice for processing. After processing, farmers packaged the rice sell to traders; these traders distributed it to consumers for final consumption.
The gendered value chain map in Ghana is presented in Figure 4. The figure shows that men constituted a greater proportion of rice farmers in Ghana (66.7% of farmers); however, among the processors, more than 96% of them were women while 82% of rice traders were women. The sampled traders equally traded their products with similar customers (i.e., other traders who were men, other traders who were women, men and women food vendors, men and women household consumers, and women household consumers). Only a few women rice traders (14.2%) dealt with institutions, and similarly, only a few men (27.2%) also traded rice with institutions. There were similar proportions of men and women rice traders across the three agro-ecological zones (i.e., forest zone, coastal savanna, and the transition zone) of Ghana. In the coastal and forest zones, however, the proportions of men rice traders (45.4% and 18.1%, respectively) were slightly higher than the proportion of women rice traders. Further, more men engaged in rice production than women farmers; however, twice as many of the women farmers were involved in trading activities such as retailing and wholesaling higher than men farmers. Interestingly, actors in the value chain sold more of the foreign rice brands than local rice brands to local market, supermarkets, and government institutions.

3.6. Trait Preferences for Rice Farmers by Gender

Table 3 shows the trait preferences of rice farmers by gender. As indicated earlier, a 4-point scale was adopted to examine the varietal attributes preferred among rice farmers. Rice varietal attributes were categorized into high yield, biotic, agronomic, cooking, and postharvest qualities. Our results indicate that early maturity, long grain, short and medium growth cycles, heavy panicles, and medium plant height were the first five rated agronomic traits in order of importance by both genders. Green leaves and tall plant height were the least preferred traits, recording a total mean rank of 2.16 and 3.17, respectively. The relatively low preference for tall plant height is a result of its easy lodging abilities, which may result in production losses. Hence, for food security reasons, both genders consider varieties that are of medium plant height, early maturing, with a heavy panicle. About 81.6% of the men respondents and 83.3% of the women respondents ranked early maturity as the most required trait. Interestingly, most farmers are often concerned with the food security of their families, so planting early maturing varieties and being able to start harvesting something early will help curb the hunger season early. Again, 63.4%, 64.9%, and 61.9% of the women rice farmers respectively ranked long grain, short and medium growth cycles, and heavy panicles as the most important traits to look for when making adoption decisions. Similarly, 66%, 62.4%, and 57.8% of the men rice farmers also ranked the abovementioned traits as the next most required traits after early maturity. Future gender-sensitive breeding work should consider these agronomics traits of high importance.
As expected, specific preferences for crop varietal traits may arise as a result of gendered roles or responsibilities in various stages of the agricultural production cycle. The ranking of traits by women and men presented in Table 3 indicates a diverse pattern with respect to traits related to cooking qualities and postharvest processing, although both genders indicated preference for cooking and postharvest traits, with differing weights in the ranking of some of the traits. Both men and women rice farmers in the study area ranked aromatics and taste as the most highly rated and most preferred traits. Short cooking time and white grain color were rated as the third and fourth most preferred traits by women rice farmers. Translucence was ranked fifth, followed by good grain swelling capacity. In reverse, the men counterparts ranked good grain swelling capacity as third, with a mean rank of 1.48. The white grain color recorded a mean rank of 1.49, representing the fourth preferred trait among the men respondents. Short cooking time, which was ranked the third preferred trait among women farmers, was ranked the fifth preferred trait among the men respondents, and translucence was ranked the sixth preferred trait by the men rice farmers in the study area. Brown grain color, however, was the trait least preferred by both genders. As indicated earlier in this report, women in most Ghanaian societies are responsible for food preparation for household consumption. It is thus not surprising that women tend to pay close attention to all rice traits that contribute to efficient processing and preparation of high-quality foods from the products harvested in the field.
With respect to postharvest traits, similarly, because men and women have different responsibilities for the functioning of their farms and household operations, they sometimes value certain traits differently. For instance, parboiling is mostly a women’s responsibility, as reflected in the result in Table 3, where women rice farmers ranked mill without parboiling as the first postharvest trait with a mean rank of 1.48 and a lower percentage of brokenness and ease of dehulling being the second and third preferred traits, respectively. However, their men counterparts ranked mill without parboiling as their second preferred trait, with a lower percentage of brokenness and ease of dehulling being ranked second and third, respectively.

3.7. Factors Influencing the Intensity of Rice Purchasing among Women and Men Consumers

Table 4 presents the Tobit regression estimates of the factors influencing the intensity of purchasing rice among women and men consumers. The intensity of purchasing was captured by the frequency of purchase per month. The significant LR statistic (39.47) with p-value of 0.000 and 46.40 with p-value of 0.000 for women and men models, respectively, indicates that the explanatory variables, which include the trait preference, jointly influence the intensity of purchasing rice among men and women consumers in Ghana. The results show that factors such as age, purchase price per 5 kg bag, aromatics, texture, medium-sized grain, and translucence significantly influenced the intensity of purchasing rice among women consumers. However, among the men, the intensity of purchasing was influenced by household size, monthly income, marital status, less than 5% brokenness, white colored grain, short grain, and short cooking time. These results are consistent with [35,51], who opined that aside from price and grain characteristics, other socioeconomic factors such as age, household size, and marital status affect rice consumers’ preferences in Ghana. The results further suggest that indeed, besides these socioeconomic factors, among both men and women consumers, trait characteristics such as grain size, aroma, and color are crucial in determining the consumption patterns of consumers [35].
With regards to women rice consumers, the positive effect of age indicates that an additional year of age for women rice consumers decreases the intensity of rice purchasing. This is consistent with [32], who reported a negative relationship between rice purchases and age. The price per 5 kg bag had a negative significant effect on the intensity of purchasing rice among women consumers, suggesting that women rice consumers are less likely to purchase rice if the price of the 5 kg bag increases by an additional Ghanaian cedi. A higher price reduced the purchasing capacity of these women, hence reducing their intensity of purchasing the 5 kg bag. Similar findings by [52] indicated that consumers are more concerned about the quality and price of the rice when purchasing rice.
The aroma of the rice was also positively related with the intensity of purchasing rice for women consumers. This implies that women consumers have a higher probability of purchasing rice when the rice is aromatic. Interestingly, this variable was not significant for men consumers, which implies that commonly, women prefer aromatic rice compared to their men consumers. Another important rice trait, which is the texture, was found to have a positive influence on the intensity of rice purchasing. This implies that the good texture of rice increases the frequency of purchasing and consuming rice among women rice consumers. Consistent with [30], women usually preferred good texture, size, and aromatic rice of higher quality and good visual appearance.
Furthermore, the probability of purchasing rice increased with translucent rice available for women consumers. Translucence increases the shininess of the rice, which enhances the appearance and attractiveness of the grains, hence improving attractiveness of the rice to women consumers and increasing the intensity of purchasing such rice. However, medium-sized grain rice had a negative influence on the intensity of purchasing rice by women consumers, which implies that generally women consumers usually gravitate towards long grain rice.
For the men consumers, the negative effect of household size on the intensity of purchasing rice implies that the frequency of purchase declines with large households for men rice consumers; those with large households were less likely to purchase rice. This could be because, with large households, men consumers need to purchase more rice at a time which will impact on their household expenses, hence reducing the intensity of purchasing.
The monthly income of men rice consumers had a positive influence on the intensity of purchasing rice. Monthly income increased the intensity of purchasing rice as it increases the disposable income and ultimately the purchasing power of men consumers. Higher income earners have high purchasing power, with which they tend to switch their consumption patterns and ensure food availability in the household including the intensity of purchasing rice. Being married increased men rice consumers’ frequency of purchasing rice. Married men tend to have additional responsibilities of providing for their spouse and children, hence increasing the intensity of purchasing rice in order to meet the food needs of the entire family. Consistent with [53], being a married couple had a higher influence on purchasing rice for consumption in the household. This is contrary to the findings of [54], who indicated a negative relationship between marriage and the intensity of rice consumption in Nigeria. The positive effect of the short cooking time of rice on the intensity of purchasing rice suggests that, all things being equal, the shorter the cooking time of rice, the higher the likelihood of purchasing rice.
Generally, rice consumers were inclined to have busy schedules and tended to prefer short cooking times of rice to long cooking times of rice. Again, men consumers preferred short grain rice thus, having a positive significant influence on the intensity of purchasing rice and implying that, generally, men consumers preferred short grain rice. The general perception in Ghana that short grain rice swells better, hence increasing the quantity of cooked rice, could explain this finding. However, other rice traits, such as a lower percentage of brokenness and white grain color, reduced intensity of purchasing rice by men consumers. Men generally were not keen on these traits in terms of cooking quality as they are more interested in the quantity than women, hence influencing the role of these traits on frequency of purchasing rice.

3.8. Factor Influencing the Adoption of Rice Varieties among Women and Men Rice Farmers

The study further analyzed the factors influencing the adoption of rice varieties by gender (Table 5). Multivariate probit (MVP) regression was applied with the Wald χ2 testing hypothesis (p = 0) and suggests the high significance of joint influence on the dependent variable. The likelihood ratio test statistic rho is also highly significant (p-value = 0.000), indicating that a multivariate probit specification fits the data. These diagnostic tests further support the use of multivariate probit regression and indicate that use of simple probit will result in inconsistent estimates. The results show differences in the factors influencing the adoption of various improved varieties among women and men farmers. Age negatively and positively influenced the adoption of jasmine and Amankwatia varieties at 1% and 5% significance levels among women farmers, respectively. However, it negatively influenced the adoption of only the AGRA rice variety at a 5% significance level among the men farmers. At a 5% significance level, being married influenced the adoption of jasmine varieties among men and women rice farmers. Additionally, being an indigene had a negative and positive effect on the adoption of Togo Marshall and Amankwatia for women rice farmers, respectively, but only influenced the adoption of the AGRA rice variety positively for men farmers.
Education only influenced the adoption of AGRA rice positively among women farmers, while among men it had a positive effect on the adoption of AGRA rice and jasmine, and a negative effect on Togo Marshall. Education empowered farmers to appreciate the importance of improved technologies [42,55] and hence increased the rate of uptake of these improved rice varieties. Engagement in an off-farm activity was found to influence adoption decisions for jasmine and Amankwatia varieties among women rice farmers, but not among men rice farmers. This result corresponds with findings of [42], who found non-farm income to influence technology adoption decisions among women farmers. However, farming experience was significant among men farmers with positive and negative effects on AGRA rice and Amankwatia but insignificant among women farmers. Furthermore, household size also had a negative influence on the decision to adopt the AGRA rice variety among men farmers. Similar findings have been found in previous studies where the adoption of improved technologies correlated with household size [42,48]. Frequency of cultivation had a positive influence on adoption of the Amankwatia variety among women and men farmers, but had a negative effect on the Togo Marshall variety among men rice farmers only. It was evident that a unit increase in farm size was more likely to increase men farmers’ decision to adopt AGRA rice, jasmine, and the Amankwatia varieties among women farmers, however, had a negative influence on decisions to adopt the Togo Marshall variety.
Participation in a farmer-based organization (FBO) had a positive influence on the adoption of the AGRA rice variety and a negative effect on the adoption of the Togo Marshall rice variety among the women farmers. Generally, farmers’ groups such as FBO tended to train and motivate farmers to adopt modern productivity-enhancing technologies [42]. The market proximity variable had a positive influence on the adoption of the AGRA rice variety for men and women rice farmers but a negative effect on the adoption of the Togo Marshall variety for women farmers alone. These results could be explained as that greater distance to the nearest market discourages adoption decisions thus, farmers are discouraged in adoption due to high transaction costs. Farmers’ contact with an extension service had a significant effect on all four varieties among women farmers and a positive effect on the jasmine variety and the Amakwatia variety. Frequent contact has been found to positively influence technology adoption among farmers [56,57,58]. While access to credit had a negative effect on the adoption of AGRA rice and a positive on the adoption of Amankwatia among women, the credit variable was only significant in the adoption of the Togo Marshall variety among the men smallholder rice farmers. Credit is regarded as one of most important factors in encouraging the adoption of new technologies in agricultural production. Variables such as coastal and savanna had a positive effect on the adoption of jasmine and Amankwatia varieties but had a negative effect on the adoption of AGRA rice among women rice farmers. Among men rice farmers, the coastal savanna variable had a positive effect on the adoption of Togo Marshall but a negative effect on the adoption of AGRA rice varieties.
Among varietal trait variables, being tolerant to pests, high yielding, early maturing, aromatic, and tolerant to shattering had a significant effect on both men and women rice farmer adoption decisions. These results further show that being tolerant to pests significantly influenced the adoption of AGRA rice, Togo Marshall, and Amankwatia varieties among women farmers, whereas among men farmers, the variable tolerant to pests negatively influenced the adoption of Togo Marshall, and Amankwatia varieties at a 1% significance level. Studies have shown that resistance to pests increases the area under the improved variety [59,60]. Being high yielding positively influenced adoption of the jasmine variety but negatively influenced adoption of Togo Marshall and Amankwatia varieties among the women farmers, but had a significant and negative effect on adoption of Togo Marshall and Amankwatia varieties among the men farmers.
Early maturity had a negative and significant effect on the adoption of Amankwatia rice varieties among women farmers but had a positive effect on the same variety among men farmers. Whereas aromatic traits had a positive effect on the adoption of AGRA and jasmine varieties, they had a negative effect on Togo Marshall among the women farmers. Among the men farmers, being aromatic positively influenced adoption of the AGRA rice variety and was statistically significant at a 5% significance level. The variable tolerant to shattering positively influenced the adoption of Togo Marshall at a 1% significance level among the women farmers, but had a positive effect on the adoption of AGRA rice and Amankwatia varieties at a 1% significance level among the men farmers.

4. Conclusions and Policy Recommendations

We examined the influence of trait preferences on the adoption of improved rice varieties among men and women rice farmers and consumers in Ghana. Using data from 134 men and 266 women rice farmers, and 188 women and 73 men consumers, descriptive statistics, Tobit, and multivariate probit models were employed to investigate the determinants of frequency of rice purchasing and factors influencing the adoption of improved rice varieties. Among the trait variables, being tolerant to pests, high yielding, early maturing, aromatic, and tolerant to shattering influenced the decision to adopt improved rice varieties. However, no gender-based differences were found for traits relating to abiotic and biotic stresses, such as tolerance to pests and disease, which were rated as the most required traits by both men and women. The results also did not show any difference in the ranking of the preferred agronomic traits by both genders. Both men and women agreed that early maturity, long grain, short to medium growth cycles, heavy panicles, and medium plant height were the five most important agronomic traits.
The results further show a clear gender differential in the intensity of purchasing rice among men and women consumers. For instance, while the frequency of purchasing rice was influenced by age, purchase price per 5 kg bag (GHC), aromatics, texture, and medium-sized grain among women consumers, major determinants for men consumers were household size, monthly income, marital status (married), lower percentage of brokenness, white grain color, translucence, and short cooking time. The results further revealed AGRA rice, jasmine, Togo Marshall, and Amankwatia as the most widely cultivated improved rice varieties in Ghana. The results show that rice farmers’ decisions to adopt any of the four varieties were influenced by age, being married and indigene, years of schooling, off-farm activities, farming experience, household size, frequency of cultivation, farm size, FBO membership, extension contact, market proximity, and access to credit.
To improve the rice value chain in Ghana, rice development efforts should consider varieties which are tolerant to pests and diseases, aromatic, early maturing, and tolerant to shattering. However, to enhance the consumption of improved rice varieties, breeding efforts should target varieties which are aromatic, good textured, medium-sized grains for women consumers, while for men consumers such varieties would be less broken, white in grain color, translucent, and with short cooking time.

Author Contributions

Conceptualization, B.O.A., B.N.F., H.A.T. and S.P.; methodology, B.O.A. and S.P.; software, B.O.A.; validation, H.A.T., M.D.A., N.Z. and G.M.; formal analysis, S.P., B.O.A. and S.J.A.; investigation, M.D.A., B.N.F., B.O.A. and B.S.; curation, S.P. and S.J.A.; resources, H.A.T.; writing—original draft preparation, S.P., B.O.A. and B.S., writing—review and editing, M.D.A., B.N.F. and B.S.; supervision, H.A.T. and M.D.A.; project administration, M.D.A.; funding acquisition, M.D.A., B.O.A., B.N.F., B.S., N.Z. and G.M. All authors have read and agreed to the published version of the manuscript.

Funding

This research was funded by the Bill and Melinda Gates Foundation through the Gender-Responsive Researchers Equipped for Agriculture Transformation (GREAT) in Africa’ Cluster Initiative project, which is implemented by Cornell University in the USA and Makerere University in Uganda with grant number (559912802), and which agreed to bear the cost of the APC for this submission.

Institutional Review Board Statement

The necessary consent was sought for in engaging the respondents for the study, however, ethics approval for the study was not required in accordance with local/national legislation in Ghana particularly concerning survey data collection.

Informed Consent Statement

Informed consent was obtained from all subjects involved in the study.

Data Availability Statement

The data from which the study was conducted are available from the corresponding author upon request.

Acknowledgments

The authors would like to express their gratitude to the Gender-Responsive Researchers Equipped for Agriculture Transformation (GREAT) in Africa Cluster Initiative project for providing funding for this study. We would also like to thank the rice stakeholders who shared their time and information with us, as well as the technicians and research assistants at the CSIR–Crops Research Institute and the Department of Agricultural Economics Agribusiness and Extension who assisted with data collection.

Conflicts of Interest

The authors declare that there is no known conflict of interest associated with this submission.

References

  1. Qaim, M. Role of new plant breeding technologies for food security and sustainable agricultural development. Appl. Econ. Perspect. Policy 2020, 42, 129–150. [Google Scholar] [CrossRef]
  2. Berners-Lee, M.; Kennelly, C.; Watson, R.; Hewitt, C.N. Current global food production is sufficient to meet human nutritional needs in 2050 provided there is radical societal adaptation. Elem. Sci. Anth. 2018, 6, 52. [Google Scholar] [CrossRef]
  3. Onyango, A.O. Exploring options for improving rice production to reduce hunger and poverty in Kenya. World Environ. 2014, 4, 172–179. [Google Scholar]
  4. Schut, M.; van Asten, P.; Okafor, C.; Hicintuka, C.; Mapatano, S.; Nabahungu, N.L.; Kagabo, D.; Muchunguzi, P.; Njukwe, E.; Dontsop-Nguezet, P.M.; et al. Sustainable intensification of agricultural systems in the Central African Highlands: The need for institutional innovation. Agric. Syst. 2016, 145, 165–176. [Google Scholar] [CrossRef]
  5. Valin, H.; Sands, R.D.; Van der Mensbrugghe, D.; Nelson, G.C.; Ahammad, H.; Blanc, E.; Bodirsky, B.; Fujimori, S.; Hasegawa, T.; Havlik, P.; et al. The future of food demand: Understanding differences in global economic models. Agric. Econ. 2014, 45, 51–67. [Google Scholar] [CrossRef]
  6. Coulibaly, Y.M.; Havard, M. The rice processing units at the Niger Office in Mali. CIGR J. 2015, 17, 176–184. Available online: http://www.cigrjournal.org (accessed on 10 October 2022).
  7. FAOSTAT. New Food Balances. 2021. Available online: https://www.fao.org/faostat/en/#data/FBS (accessed on 1 February 2021).
  8. Mgumia, A.H. Transformation of Agricultural Technology Development Approaches in Tanzania. Doctoral Dissertation, Sokoine University of Agriculture, Morogoro, Tanzania, 2015. [Google Scholar]
  9. Loko, Y.L.E.; Gbemavo, C.D.; Djedatin, G.; Ewedje, E.E.; Orobiyi, A.; Toffa, J.; Tchakpa, C.; Sedah, P.; Sabot, F. Characterization of rice farming systems, production constraints and determinants of adoption of improved varieties by smallholder farmers of the Republic of Benin. Sci. Rep. 2022, 12, 3959. [Google Scholar] [CrossRef]
  10. Soullier, G.; Demont, M.; Arouna, A.; Lançon, F.; Del Villar, P.M. The state of rice value chain upgrading in West Africa. Glob. Food Secur. 2020, 25, 100365. [Google Scholar] [CrossRef]
  11. Food and Agriculture Organization (FAO). Crop Prospects and Food Situation–Quarterly Global Report No. 3 September 2022. Rome. Available online: https://www.fao.org/documents/card/en/c/cc2300en (accessed on 1 November 2022).
  12. Dury, S.; Bocoum, I. The Sikasso paradox: Why does higher production fail to feed farmers’ children? Cah. Agric. 2012, 21, 324–336. [Google Scholar]
  13. Dabalen, A.L.; Paul, S. Effect of conflict on dietary diversity: Evidence from Cˆote d’Ivoire. World Dev. 2014, 58, 143–158. [Google Scholar] [CrossRef]
  14. Macauley, H.; Ramadjita, T. Les Cultures Céréalières: Riz, Maïs, Millet, Sorgho et Blé; Africa Rice: Bouaké, Ivory Coast, 2015. [Google Scholar]
  15. Fabien, T.; D’Alessandro, C.; Ibrahima, H.; Clarisse, B. Commerce du riz et Développement de la Filière riz en Afrique de l’Ouest: Une Approche Pour des Politiques Publiques Plus Cohérentes (Ecdpm/Ipar); ECDPM: Maastricht, The Netherlands, 2020. [Google Scholar]
  16. Le Mouël, C.; de Lattre-gasquet, M.; Mora, O. The GlobAgri-Agrimonde-Terra Database and Model Land Use and Food Security in 2050: A Narrow Road; Quae: Versailles, France, 2018; Volume 9. [Google Scholar]
  17. Statista. Production Volume of Rice in Africa 2017–2022. 2022. Available online: https://www.statista.com/statistics/1294234/production-volume-of-rice-in-africa/ (accessed on 1 November 2022).
  18. Ministry of Food and Agriculture (MoFA). Rice Production: A Priority to Ghana. 2022. Available online: https://mofa.gov.gh/site/media-centre/agricultural-articles/393-rice-production-a-priority-to-ghana (accessed on 1 November 2022).
  19. Donkoh, S.A.; Awuni, J.A. Adoption of farm management practices in lowland rice production in Northern Ghana. J. Agric. Biol. Sci. 2011, 2, 84–93. [Google Scholar]
  20. Oladele, O.I.; Kolawole, A.; Wakatsuki, T. Land tenure, investment and adoption of Sawah rice production technology in Nigeria and Ghana: A qualitative approach. Afr. J. Agric. Res. 2011, 6, 1519–1524. [Google Scholar]
  21. Weltzien, E.; Rattunde, F.; Christinck, A.; Isaaca, K.; Ashby, J. Gender and Farmer Preferences for Varietal Traits: Evidence and Issues for Crop Improvement. In Plant Breeding Reviews, 1st ed.; Goldman, I., Ed.; John Wiley & Sons, Inc.: Hoboken, NJ, USA, 2020; Volume 43, pp. 243–278. [Google Scholar]
  22. Niang, A.; Becker, M.; Ewert, F.; Dieng, I.; Gaiser, T.; Tanaka, A.; Senthilkumar, K.; Rodenburg, J.; Johnson, J.-M.; Akakpo, C.; et al. Variability and determinants of yields in rice production systems of West Africa. Field Crop. Res. 2017, 207, 1–12. [Google Scholar] [CrossRef]
  23. Wossen, T.; Berger, T.; Haile, M.G.; Troost, C. Impacts of climate variability and food price volatility on household income and food security of farm households in East and West Africa. Agric. Syst. 2018, 163, 7–15. [Google Scholar] [CrossRef]
  24. Sewell, A.M.; Hartnett, M.K.; Gray, D.I.; Blair, H.T.; Kemp, P.D.; Kenyon, P.R. Using educational theory and research to refine agricultural extension: Affordances and barriers for farmers’ learning and practice change. J. Agric. Educ. Ext. 2017, 23, 313–333. [Google Scholar] [CrossRef]
  25. Wheeler, T.; von Braun, J. Climate change impacts on global food security. In Toward Climate Resilient Food Systems and Europe’s Roles; Center for Development Research (ZEF), University of Bonn: Bonn, Germany, 2016. [Google Scholar]
  26. Laborte, A.G.; Paguirigan, N.C.; Moya, P.F.; Nelson, A.; Sparks, A.H.; Gregorio, G.B. Farmers’ preference for rice traits: Insights from farm surveys in Central Luzon, Philipines, 1966–2012. PLoS ONE 2015, 10, e0136562. [Google Scholar] [CrossRef]
  27. Slagboom, M.; Kargo, M.; Edwards, D.; Sørensen, A.C.; Thomasen, J.R.; Hjortø, L. Organic dairy farmers put more emphasis on production traits than conventional farmers. J. Dairy. Sci. 2016, 99, 9845–9856. [Google Scholar] [CrossRef]
  28. Anja, C.; Weltzien, E.; Rattunde, F.; Ashby, J.A. Gender differentiation of farmer preferences for varietal traits in crop improvement: Evidence and issues. In Plant Breeding Reviews; John Wiley & Sons, Inc.: Hoboken, NJ, USA, 2017. [Google Scholar]
  29. Asante, M.D.; Asante, B.O.; Acheampong, G.K.; Offei, S.K.; Gracen, V.; Adu-Dapaah, H.; Danquah, E.Y. Farmer and consumer preferences for rice in the Ashanti region of Ghana: Implications for rice breeding in West Africa. J. Plant Breed. Crop Sci. 2013, 5, 229–238. [Google Scholar] [CrossRef]
  30. Sedem Ehiakpor, D.; Apumbora, J.; Danso-Abbeam, G.; Adzawla, W. Households’ preference for local rice in the upper east region, Ghana. Adv. Agric. 2017, 2017, 1812975. Available online: https://www.hindawi.com/journals/aag/2017/1812975/ (accessed on 15 November 2022). [CrossRef]
  31. Hagan, M.A.S.; Acheampong, A.G.; Awunyo-Vitor, D. Factors Driving Farm Gate Price of Tomatoes in Ghana: An Application of Hedonic Model. South Asian J. Soc. Stud. Econ. 2020, 6, 51–61. [Google Scholar] [CrossRef]
  32. Danso-Abbeam, G.; Bosiako, J.A.; Ehiakpor, D.S.; Mabe, F.N. Adoption of improved maize variety among farm households in the northern region of Ghana. Cogent Econ. Financ. 2017, 5, 1416896. [Google Scholar] [CrossRef]
  33. Piao, S.; Wang, X.; Park, T.; Chen, C.; Lian, X.U.; He, Y.; Bjerke, J.W.; Chen, A.; Ciais, P.; Tømmervik, H.; et al. Characteristics, drivers and feedbacks of global greening. Nat. Rev. Earth Environ. 2020, 1, 14–27. [Google Scholar] [CrossRef]
  34. Anang, B.T.; Adjetey, S.N.A.; Abiriwe, S.A. Consumer preferences for rice quality characteristics and the effects on price in the Tamale Metropolis, Northern Region, Ghana. Int. J. AgriScience 2011, 1, 67–74. [Google Scholar]
  35. Abubakar, H.N.; Kolo, I.N.; Yabagi, A.A.; Garba, Y. Adoption of production technologies by lowland rice farmers in Lavun local government areas of Niger State, Nigeria. Int. J. Agric. Ext. 2016, 4, 49–56. [Google Scholar]
  36. Danquah, I.B.; Egyir, I.S. Factors that influence household demand for locally produced brown rice in Ghana. J. Econ. Sustain. Dev. 2014, 5, 14–24. [Google Scholar]
  37. Ayeduvor, S. Assessing Quality Attributes That Drive Preference and Consumption of Local Rice in Ghana; International Food Policy Research Institute: Washington, DC, USA, 2018; Volume 48. [Google Scholar]
  38. Bairagi, S.; Mohanty, S.; Custodio, M.C. Consumers’ preferences for rice attributes in Cambodia: A choice modeling approach. J. Agribus. Dev. Emerg. Econ. 2019, 9, 94–108. [Google Scholar] [CrossRef]
  39. Addison, M.; Edusah, S.E.; Sarfo-Mensah, P. Gender constraints and rice varietal characteristics preferences in lowland rice ecosystem in Ghana. Dev. Ctry. Stud. 2014, 4, 92–98. [Google Scholar]
  40. Mattson, D. E Statistics-Difficult Concept of Understanding Explanations; Bolchanzy Carducci Publishers Inc.: Wauconda, IL, USA, 1986; pp. 281–423. [Google Scholar]
  41. Cameron, A.C.; Trivedi, P.K. Microeconometrics Using Stata (5:706); Stata Press: College Station, TX, USA, 2010. [Google Scholar]
  42. Asante, B.O.; Adabah, R.; Agyeman, K.; Ayeh, S.J.; Aidoo, R.; Afona, D. Preference for improved varietal attributes of Bambara groundnut among smallholder farmers in Ghana. Afr. J. Agric. Resour. Econ. Vol. 2021, 16, 155–168. [Google Scholar] [CrossRef]
  43. Doss, C.R.; Morris, M.L. How does gender affect the adoption of agricultural innovations? The case of improved maize technology in Ghana. Agric. Econ. 2001, 25, 27–39. [Google Scholar] [CrossRef]
  44. Doss, C.R. Analyzing technology adoption using microstudies: Limitations, challenges, and opportunities for improvement. Agric. Econ. 2006, 34, 207–219. [Google Scholar] [CrossRef]
  45. Morris, M.L.; Doss, C.R. How does gender affect the adoption of agricultural innovations? The case of improved maize technology in Ghana (No. 371-2016-19355). In Proceedings of the Agricultural and Applied Economics Association (AAEA) Conferences 1999 Annual Meeting, Nashville, TN, USA, 8–11 August 1999. [Google Scholar]
  46. Morris, W.; Henley, A.; Dowell, D. Farm diversification, entrepreneurship and technology adoption: Analysis of upland farmers in Wales. J. Rural. Stud. 2017, 53, 132–143. [Google Scholar] [CrossRef]
  47. Cairns, J.E.; Hellin, J.; Sonder, K.; Araus, J.L.; MacRobert, J.F.; Thierfelder, C.; Prasanna, B.M. Adapting maize production to climate change in sub-Saharan Africa. Food Secur. 2013, 5, 345–360. [Google Scholar] [CrossRef]
  48. Kassie, M.; Jaleta, M.; Shiferaw, B.; Mmbando, F.; Mekuria, M. Adoption of interrelated sustainable agricultural practices in smallholder systems: Evidence from rural Tanzania. Technol. Forecast. Soc. Chang. 2013, 80, 525–540. [Google Scholar] [CrossRef]
  49. Mulwa, C.; Marenya, P.; Kassie, M. Response to climate risks among smallholder farmers in Malawi: A multivariate probit assessment of the role of information, household demographics, and farm characteristics. Clim. Risk Manag. 2017, 16, 208–221. [Google Scholar] [CrossRef]
  50. Tasila Konja, D.; Mabe, F.N.; Alhassan, H. Technical and resource-use-efficiency among smallholder rice farmers in Northern Ghana. Cogent Food Agric. 2019, 5, 1651473. [Google Scholar] [CrossRef]
  51. Danso-Abbeam, G.; Armed, M.; Baidoo, F. Determinants of consumer preference for local rice in Tamale Metropolis, Ghana. Int. J. Educ. Soc. Sci. 2014, 1, 13–34. [Google Scholar]
  52. Diako, C.; Sakyi-Dawson, E.; Bediako-Amoa, B.; Saalia, F.K.; Manful, J.T. Consumer perceptions, knowledge and preferences for aromatic rice types in Ghana. Nat. Sci. 2010, 8, 12–19. [Google Scholar]
  53. Alhassan, H.; Frimpong, T.; Mohammed, A.S. Do Ghanaian rural consumers prefer imported rice to local rice? Appl. Res. J. 2016, 1, 3. [Google Scholar]
  54. Ogundele, O. Factors influencing consumers’ preference for local rice in Nigeria. Afr. J. Mark. Manag. 2014, 6, 49–55. [Google Scholar]
  55. Mponela, P.; Tamene, L.; Ndengu, G.; Magreta, R.; Kihara, J.; Mango, N. Determinants of integrated soil fertility management technologies adoption by smallholder farmers in the Chinyanja Triangle of Southern Africa. Land Use Policy 2016, 59, 38–48. [Google Scholar] [CrossRef]
  56. Akudugu, M.A.; Guo, E.; Dadzie, S.K. Adoption of modern agricultural production technologies by farm households in Ghana: What factors influence their decisions. J. Biol. Agric. Healthc. 2012, 2, 1–14. [Google Scholar]
  57. Nguezet, P.M.D.; Diagne, A.; Okoruwa, O.V.; Ojehomon, V.; Manyong, V. Estimating the actual and potential adoption rates and determinants of NERICA rice varieties in Nigeria. J. Crop Improv. 2013, 27, 561–585. [Google Scholar] [CrossRef]
  58. Mignouna, D.B.; Manyong, V.M.; Mutabazi, K.D.; Senkondo, E.M. Determinants of adopting imazapyr-resistant maize for Striga control in Western Kenya: A double-hurdle approach. J. Dev. Agric. Econ. 2011, 3, 572–580. [Google Scholar]
  59. Timu, A.G.; Mulwa, R.; Okello, J.; Kamau, M. The role of varietal attributes on adoption of improved seed varieties: The case of sorghum in Kenya. Agric. Food Secur. 2014, 3, 9. [Google Scholar] [CrossRef]
  60. Asante, B.O.; Osei-Adu, J.; Bonsu, K.O.; Osei, M.K.; Adabah, R.; Ayeh, S.J.; Okyere, J.; Gyoungrae, C.; Hakyung, J.; Soonsung, H. Farmers’ Perceptions and Preferences for Improved Varietal Traits in the Wenchi and Offinso North Municipalities of Ghana. J. Korean Soc. Int. Agric. 2020, 32, 81–91. [Google Scholar] [CrossRef]
Figure 1. Map of Ghana showing the study area. Source: CERGIS, University of Ghana.
Sustainability 15 06026 g001
Figure 2. Distribution of main source of rice seed among men and women farmers.
Sustainability 15 06026 g002
Figure 3. Distribution of rice varieties among men and women farmers.
Sustainability 15 06026 g003
Figure 4. Gendered value chain map for rice in Ghana.
Sustainability 15 06026 g004
Table 1. Socioeconomics characteristics of farmers by gender.
VariableWomen (n = 134)Men (n = 266)Pooled (n = 400)t-Stat
Age46.52 (12.2)45.29 (12.3)45.70 (12.4)0.94
Education years5.55 (5.2)8.6 (4.8)7.59 (5.1)−5.80 ***
Residential status (indigene) a0.485 (0.5)0.624 (0.48)0.577 (0.4)−2.67 ***
Marital status (married) a0.731 (0.44)0.88 (0.25)0.832 (0.37)−3.90 ***
Household size5.97 (2.76)6.57 (3.53)6.37 (3.30)−1.73 *
Off-farm activity (Yes = 1) a0.343 (0.47)0.413 (0.49)0.39 (0.48)−1.35
Off-farm income (GHS)2582.93 (325.0)5928.18 (597.6)4941.76 (694.8)−3.57 ***
Rice-farming experience (year)11.58 (9.0)14.87 (10.8)13.77 (10.3)−3.02 ***
Farm size (acre)4.12 (3.85)5.11 (5.25)4.79 (4.8)−1.88 *
Extension contacts (Yes = 1) a0.582 (0.49)0.616 (0.48)0.605 (0.48)−0.66
Times of visit by extension agent15.78 (10.3)9.67 (7.27)11.67 (3.8)0.57
FBO membership (Yes = 1) a0.402 (0.49)0.492 (0.50)46.25 (49.7)−1.69 *
Credit access (Yes = 1) a0.343 (0.47)0.338 (0.47)0.34 (0.47)0.09
Frequency of rice cultivation 1.51 (0.50)1.52 (0.54)1.52 (0.5)−0.06 ***
Distance to market (km)18.48 (8.77)12.79 (6.23)14.69 (7.1)0.73
Amount of cash received (GHS)2653.98 (706.6)2489.15 (345.6)2546.79 (500.1)0.20
Coastal savanna 0.41 (0.49)0.493 (0.50)0.497 (0.50)−2.48 **
Transition0.589 (0.49)0.458 (0.49)0.502 (0.50)2.48 ***
Figures in parenthesis ( ) are standard deviation. The asterisks, *, ** and *** indicate the differences in means across the agroecological zones are significant at 1%, 5%, and 10% levels, respectively. a = binary variable.
Table 2. Socioeconomics characteristics of consumers by gender.
VariableWomen (n = 188)Men (n = 73)Pooled (n = 261)t-Stat
Age34.78 (11.4)35.23 (10.6)34.90 (11.1)−0.29
Education years9.73 (7.1)10.89 (5.3)10.05 (6.6)−1.26
Residential status (indigene) a0.521 (0.5)0.644 (0.48)0.555 (0.4)−1.79 *
Marital status (married) a0.590 (0.49)0.616 (0.48)0.597 (0.49)−0.38
Household head (Yes = 1) a0.175 (0.38)0.849 (0.36)0.364 (0.48)−13.0 ***
Household size4.65 (2.8)4.32 (2.7)4.56 (2.8)0.85
Number of economic active member1.03 (0.2)1.39 (0.87)1.13 (0.21)−1.27
Monthly income (GHS)1229.73 (698.8)1590.25 (260.6)1329.56 (609.5)−0.42
Frequency of consumption (within one week)5.04 (2.1)5.12 (2.5)5.06 (2.2)−0.25
Number of men customers you buy rice from for home consumption3.68 (1.9)3.11 (1.05)3.52 (1.13)0.35
Number of women customers you buy rice from for home consumption38.78 (26.8)21.34 (11.7)35.41 (22.6)3.15 ***
Agroecological zones
Coastal savanna0.308 (0.46)0.236 (0.42)0.288 (0.45)1.15
Transition0.463 (0.49)0.611 (0.49)0.503 (0.50)−2.15 **
Forest0.228 (0.42)0.152 (0.36)0.207 (0.40)1.35
Figures in parenthesis ( ) are standard deviation. The asterisks, *, ** and *** indicate the differences in means across the agroecological zones are significant level at 1%, 5%, and 10%, respectively. a = binary variable.
Table 3. Trait preferences for rice producers by gender.
Varietal AttributeWomen (n = 134) Men (n = 266)
Required (1)Important (2)Nice to Have (3)Neutral (4)MeanRankRequired (1)Important (2)Nice to Have (3)Neutral (4)MeanRank
High yielding131 (97.7%)1 (0.8%)1 (0.8%)1 (0.8%)1.041st 250 (93.9%)9 (3.4%)5 (1.8%)2 (0.5%)1.091st
Biotic stress
Tolerance to pests92 (68.7%)29 (21.6%)10 (7.5%)3 (2.2%)1.341st190 (71.4%)52 (19.6%)19 (7.2%)5 (1.9%)1.381st
Tolerance to diseases87 (64.9%)39 (29.1%)5 (3.7%)3 (2.2%)1.432nd182 (68.4%)65 (24.4%)16 (6%)3 (1.1%)1.402nd
Kendall’s W 0.663 0.681
Chi-square 121.88 157.80
df 1 1
Asymptotic
significance
0.000 0.000
Abiotic stress
Tolerance to lodging90 (67.2%)35 (26.1%)6 (4.5%)3 (2.2%)1.411st179 (67.3%)65 (24.4%)19 (7.1%)3 (1.1%)1.391st
Tolerance to drought stress87 (64.9%)35 (26.1%)7 (5.2%)5 (3.7%)1.472nd184 (69.2%)59 (22.2%)20 (7.5%)3 (1.1%)1.402nd
Tolerant to poor soil condition82 (61.2%)33 (24.6%)16 (11.9%)3 (2.2%)1.553rd166 (62.4%)68 (25.6%)24 (9%)8 (3%)1.523rd
Tolerance to shattering62 (46.3%)41 (30.6%)16 (11.9%)15 (11.2%)1.884th154 (57.8%)71 (26.7%)22 (8.3%)19 (7.1%)1.644th
Ease of threshing49 (36.6%)41 (30.6%)20 (14.9%)24 (17.9%)2.145th104 (39.1%)79 (29.7%)53 (19.9%)30 (11%)2.035th
Kendall’s W 0.602 0.698
Chi-square 166.75 206.53
df 4 4
Asymptotic
significance
0.000 0.000
Agronomic traits
Early maturity112 (83.5%)17 (12.7%)4 (2.9%)1 (0.8%)1.201st217 (81.6%)35 (13.2%)9 (3.4%)5 (1.9%)1.251st
Long grain87 (64.9%)29 (21.6%)13 (9.7%)5 (3.7%)1.523rd176 (66.1%)55 (20.7%)31 (11.7%)4 (1.5%)1.482nd
Short and medium growth cycle (108–120 days)85 (63.4%)35 (26.1%)8 (5.9%)6 (4.5%)1.512nd166 (62.4%)64 (24.1%)23 (8.7%)13 (4.9%)1.563rd
Heavy panicles79 (58.9%)36 (26.9%)8 (5.9%)11 (8.2%)1.635th154 (57.8%)78 (29.3%)19 (7.1%)15 (5.6%)1.614th
Medium height83 (61.9%)32 (23.9%)12 (8.9%)7 (5.2%)1.574th154 (57.8%)65 (24.4%)29 (10.9%)18 (6.8%)1.665th
Profuse tillering76 (56.7%)39 (29.1%)8 (5.9%)11 (8.2%)1.656th141 (53%)81 (30.5%)28 (10.5%)16 (6%)1.696th
Thick tillers65 (48.5%)39 (29.1%)16 (11.9%)14 (10.5%)1.847th136 (51.1%)87 (32.7%)32 (12%)11 (4.1%)1.717th
Green leaves41 (30.6%)38 (28.4%)22 (16.4%)33 (24.6%)2.358th104 (39.1%)79 (29.7%)43 (16.2%)40 (15%)2.078th
Tall height11 (8.2%)26 (19.4%)33 (24.6%)64 (47.8%)3.119th34 (12.7%)33 (12.4%)44 (16.5%)155 (58.3%)3.209th
Kendall’s W 0.702 0.741
Chi-square 339.91 391.01
df 8 8
Asymptotic significance 0.000 0.000
Cooking qualities 220 (55%)85 (21.3%)62 (15.5%)33 (8.3%)1.776th
Taste122 (91%)10 (7.5%)1 (0.8%)1 (0.8%)1.111st233 (87.5%)26 (9.8%)3 (1.1%)4 (1.5%)1.161st
Aromatic121 (90.3%)10 (7.5%)2 (1.5%)1 (0.8%)1.122nd229 (86%)26 (9.8%)6 (2.3%)5 (1.9%)1.192nd
Nutrient content92 (68.7%)25 (18.7%)7 (5.2%)10 (7.5%)1.513rd139 (52.2%)70 (26.3%)32 (12%)25 (9.4%)1.797th
White grain color88 (65.7%)22 (16.4%)7 (5.2%)17 (12.7%)1.644th176 (66.1%)60 (22.6%)18 (6.8%)12 (4.5%)1.494th
Good grain-swelling capacity68 (50.7%)37 (27.6%)13 (9.7%)16 (11.9%)1.826th193 (72.5%)34 (12.8%)22 (8.3%)17 (6.4%)1.483rd
Translucence75 (55.9%)32 (23.9%)10 (7.5%)17 (12.7%)1.765th145 (54.5%)53 (19.9%)52 (19.5%)16 (6%)1.776th
Short cooking time72 (53.7%)31 (23.1%)12 (8.9%)19 (14.2%)1.858th143 (53.7%)72 (27.1%)31 (11.7%)20 (7.5%)1.725th
Texture66 (49.3%)42 (31.3%)8 (5.7%)18 (13.4%)1.837th127 (47.7%)84 (31.6%)30 (11.3%)25 (9.4%)1.828th
Brown grain color19 (14.2%)24 (17.9%)38 (28.4%)53 (39.6%)2.939th28 (10.5%)40 (15%)93 (34.9%)105 (39%)3.039th
Kendall’s W 0.699 0.719
Chi-square 403.01 493.94
df 8 8
Asymptotic significance 0.000 0.000
Postharvest
Less % brokenness 81 (60.5%)41 (30.6%)9 (6.7%)3 (2.2%)1.501st175 (65.7%)61 (22.9%)25 (9.4%)5 (1%)1.471st
Ease of dehulling44 (32.8%)45 (33.6%)18 (13.4%)27 (20.2%)2.203rd123 (46.2%)49 (18.4%)56 (21.1%)38 (14%)2.032nd
Mill without
parboiling
57 (42.5%)35 (26.1%)14 (10.5%)28 (20.9%)2.092nd84 (31.6%)76 (28.6%)62 (23.3%)44 (16.5%)2.243rd
Kendall’s W 0.571 0.599
Chi-square 211.2 282.98
df 2 2
Asymptotic
significance
0.000 0.000
Table 4. Tobit estimates of factors influencing the intensity of purchasing rice among women and men consumers.
VariablesWomen (n = 188)Men (n = 73)
Marginal EffectsStd. ErrorMarginal EffectsStd. Error
Age (years)−0.006 *0.0030.0040.005
Residence status (indigene = 1)0.0040.0710.5100.401
Years of schooling0.0070.0050.0130.008
Household size−0.0030.013−0.052 *0.027
Monthly income (GHS)−0.0450.0850.379 ***0.115
Marital status (married) 0.0480.0740.217 *0.112
Purchase price per 5kg bag (GHS)−0.165 *0.087−0.0350.095
Brand of rice (foreign = 1) −0.0280.0900.1670.102
Aromatic (yes = 1)0.321 *0.1650.3130.250
Less % brokenness (yes = 1)0.0070.107−0.920 ***0.271
White grain color (yes = 1)−0.0750.145−0.608 **0.290
Texture (yes = 1)0.182 *0.0990.1130.148
Medium-sized grain (yes = 1)−0.170 *0.086−0.0850.103
Short grain (yes = 1)−0.0840.0730.192 *0.099
Translucent shining (yes = 1)0.173 *0.088−0.2550.152
Short cooking time (yes)0.1720.1440.602 **0.230
LR χ239.47 46.40
Prob > χ20.000 0.000
Pseudo R20.566 0.771
*** p < 0.01, ** p < 0.05, * p < 0.1 at 1%, 5%, and 10%, respectively.
Table 5. Multivariate probit estimates of the factors influencing adoption of improved rice varieties.
VariablesWomen (n = 134)Men (n = 266)
AGRA RiceJasmineTogo MarshallAmankwatiaAGRA RiceJasmineTogo MarshallAmankwatia
Age (years)−0.011−0.026 ***0.0050.018 **−0.015 **0.002−0.0060.014
(0.009)(0.008)(0.009)(0.009)(0.007)(0.008)(0.008)(0.009)
Married0.236−0.437 **−0.1130.058−0.177−0.537 **0.2490.311
(0.184)(0.1947)(0.174)(0.179)(0.227)(0.249)(0.219)(0.261)
Indigene−0.197−0.167−0.725 ***0.615 ***0.530 ***0.118−0.1670.159
(0.180)(0.185)(0.179)(0.180)(0.146)(0.155)(0.145)(0.163)
Years of schooling 0.075 ***0.012−0.0210.0050.035 **0.047 ***−0.045 ***0.014
(0.018)(0.018)(0.016)(0.019)(0.015)(0.015)(0.015)(0.017)
Off-farm activity −0.2790.452 **−0.1620.628 ***−0.1580.190−0.092−0.076
(0.178)(0.192)(0.166)(0.176)(0.148)(0.152)(0.142)(0.159)
Farming experience (years) 0.0150.0020.005−0.0030.020 **0.006−0.002−0.029 ***
(0.011)(0.010)(0.011)(0.018)(0.008)(0.008)(0.008)(0.009)
Household size0.040−0.023−0.023−0.017−0.044 *−0.024−0.0090.013
(0.032)(0.027)(0.028)(0.030)(0.024)(0.026)(0.026)(0.033)
Frequency of cultivation 0.003−0.219−0.1340.353 **0.0400.131−0.217 *0.639 ***
(0.166)(0.176)(0.161)(0.165)(0.135)(0.146)(0.125)(0.167)
Farm size (acre)−0.018−0.005−0.045 **0.066 **0.058 ***0.020 *0.0090.036
(0.019)(0.021)(0.020)(0.028)(0.014)(0.011)(0.011)(0.015)
FBO participants 0.292 *0.219−0.713 ***−0.133−0.0820.1590.1200.074
(0.177)(0.188)(0.158)(0.183)(0.147)(0.156)(0.146)(0.175)
Extension contacts−0.023 ***−0.021 *0.054 ***0.055 ***−0.0110.025 *0.0110.063 ***
(0.009)(0.011)(0.008)(0.012)(0.007)(0.015)(0.010)(0.016)
Market proximity (km)0.025 ***−0.012−0.051 ***−0.0030.013 *0.009−0.021−0.027
(0.008)(0.009)(0.008)(0.014)(0.007)(0.008)(0.025)(0.076)
Access to credit−0.305 *−0.011−0.0680.345 *−0.0170.2400.276 *0.165
(0.176)(0.188)(0.178)(0.202)(0.158)(0.155)(0.148)(0.167)
Coastal savanna0.2140.397 *0.2520.393 *−0.374 **0.2430.0090.111 ***
(0.215)(0.210)(0.212)(0.226)(0.163)(0.157)(0.159)(0.019)
Tolerance to pests−0.712 *0.418−0.109 ***0.196 ***0.4170.439−0.107 ***−0.101 ***
(0.372)(0.326)(0.038)(0.041)(0.337)(0.323)(0.317)(0.036)
High yielding0.4780.135 ***−0.116 ***−0.634 ***0.060−0.131−0.119 **−0.608 ***
(0.574)(0.047)(0.036)(0.0733)(0.313)(0.395)(0.055)(0.058)
Early maturity−0.2800.3110.087−0.864 **−0.101−0.349−0.2860.753 ***
(0.351)(0.329)(0.358)(0.439)(0.244)(0.254)(0.245)(0.272)
Aromatic0.959 *0.448 ***−0.108 **−0.2561.199 **0.3340.609−0.811
(0.576)(0.027)(0.053)(0.620)(0.518)(0.472)(0.499)(0.511)
Tolerance to shattering0.154−0.2040.700 ***0.2370.595 ***−0.078−0.1050.128 ***
(0.213)(0.240)(0.219)(0.250)(0.200)(0.210)(0.197)(0.019)
Wald χ2440.17 198.02
Prob > χ20.000 0.000
rho210.372 0.133
(0.092) (0.081)
rho310.175 0.188
(0.093) (0.084)
Likelihood ratio test of rho21 = rho31 = rho41 = rho32 = rho42 = rho43 = 0: chi2(6) = 38.014 Prob > χ2 = 0.0000. *** p < 0.01, ** p < 0.05, * p < 0.1. at 1%, 5%, and 10%, respectively.
Disclaimer/Publisher’s Note: The statements, opinions and data contained in all publications are solely those of the individual author(s) and contributor(s) and not of MDPI and/or the editor(s). MDPI and/or the editor(s) disclaim responsibility for any injury to people or property resulting from any ideas, methods, instructions or products referred to in the content.

