
Monitoring of Subsurface Emissions and the Influence of Meteorological Factors on Landfill Gas Emissions: A Case Study of a South African Landfill


Abstract
:1. Introduction
LFG Monitoring
- Soil gas monitoring:
- Near-surface monitoring:
- Atmospheric monitoring
2. Methodology
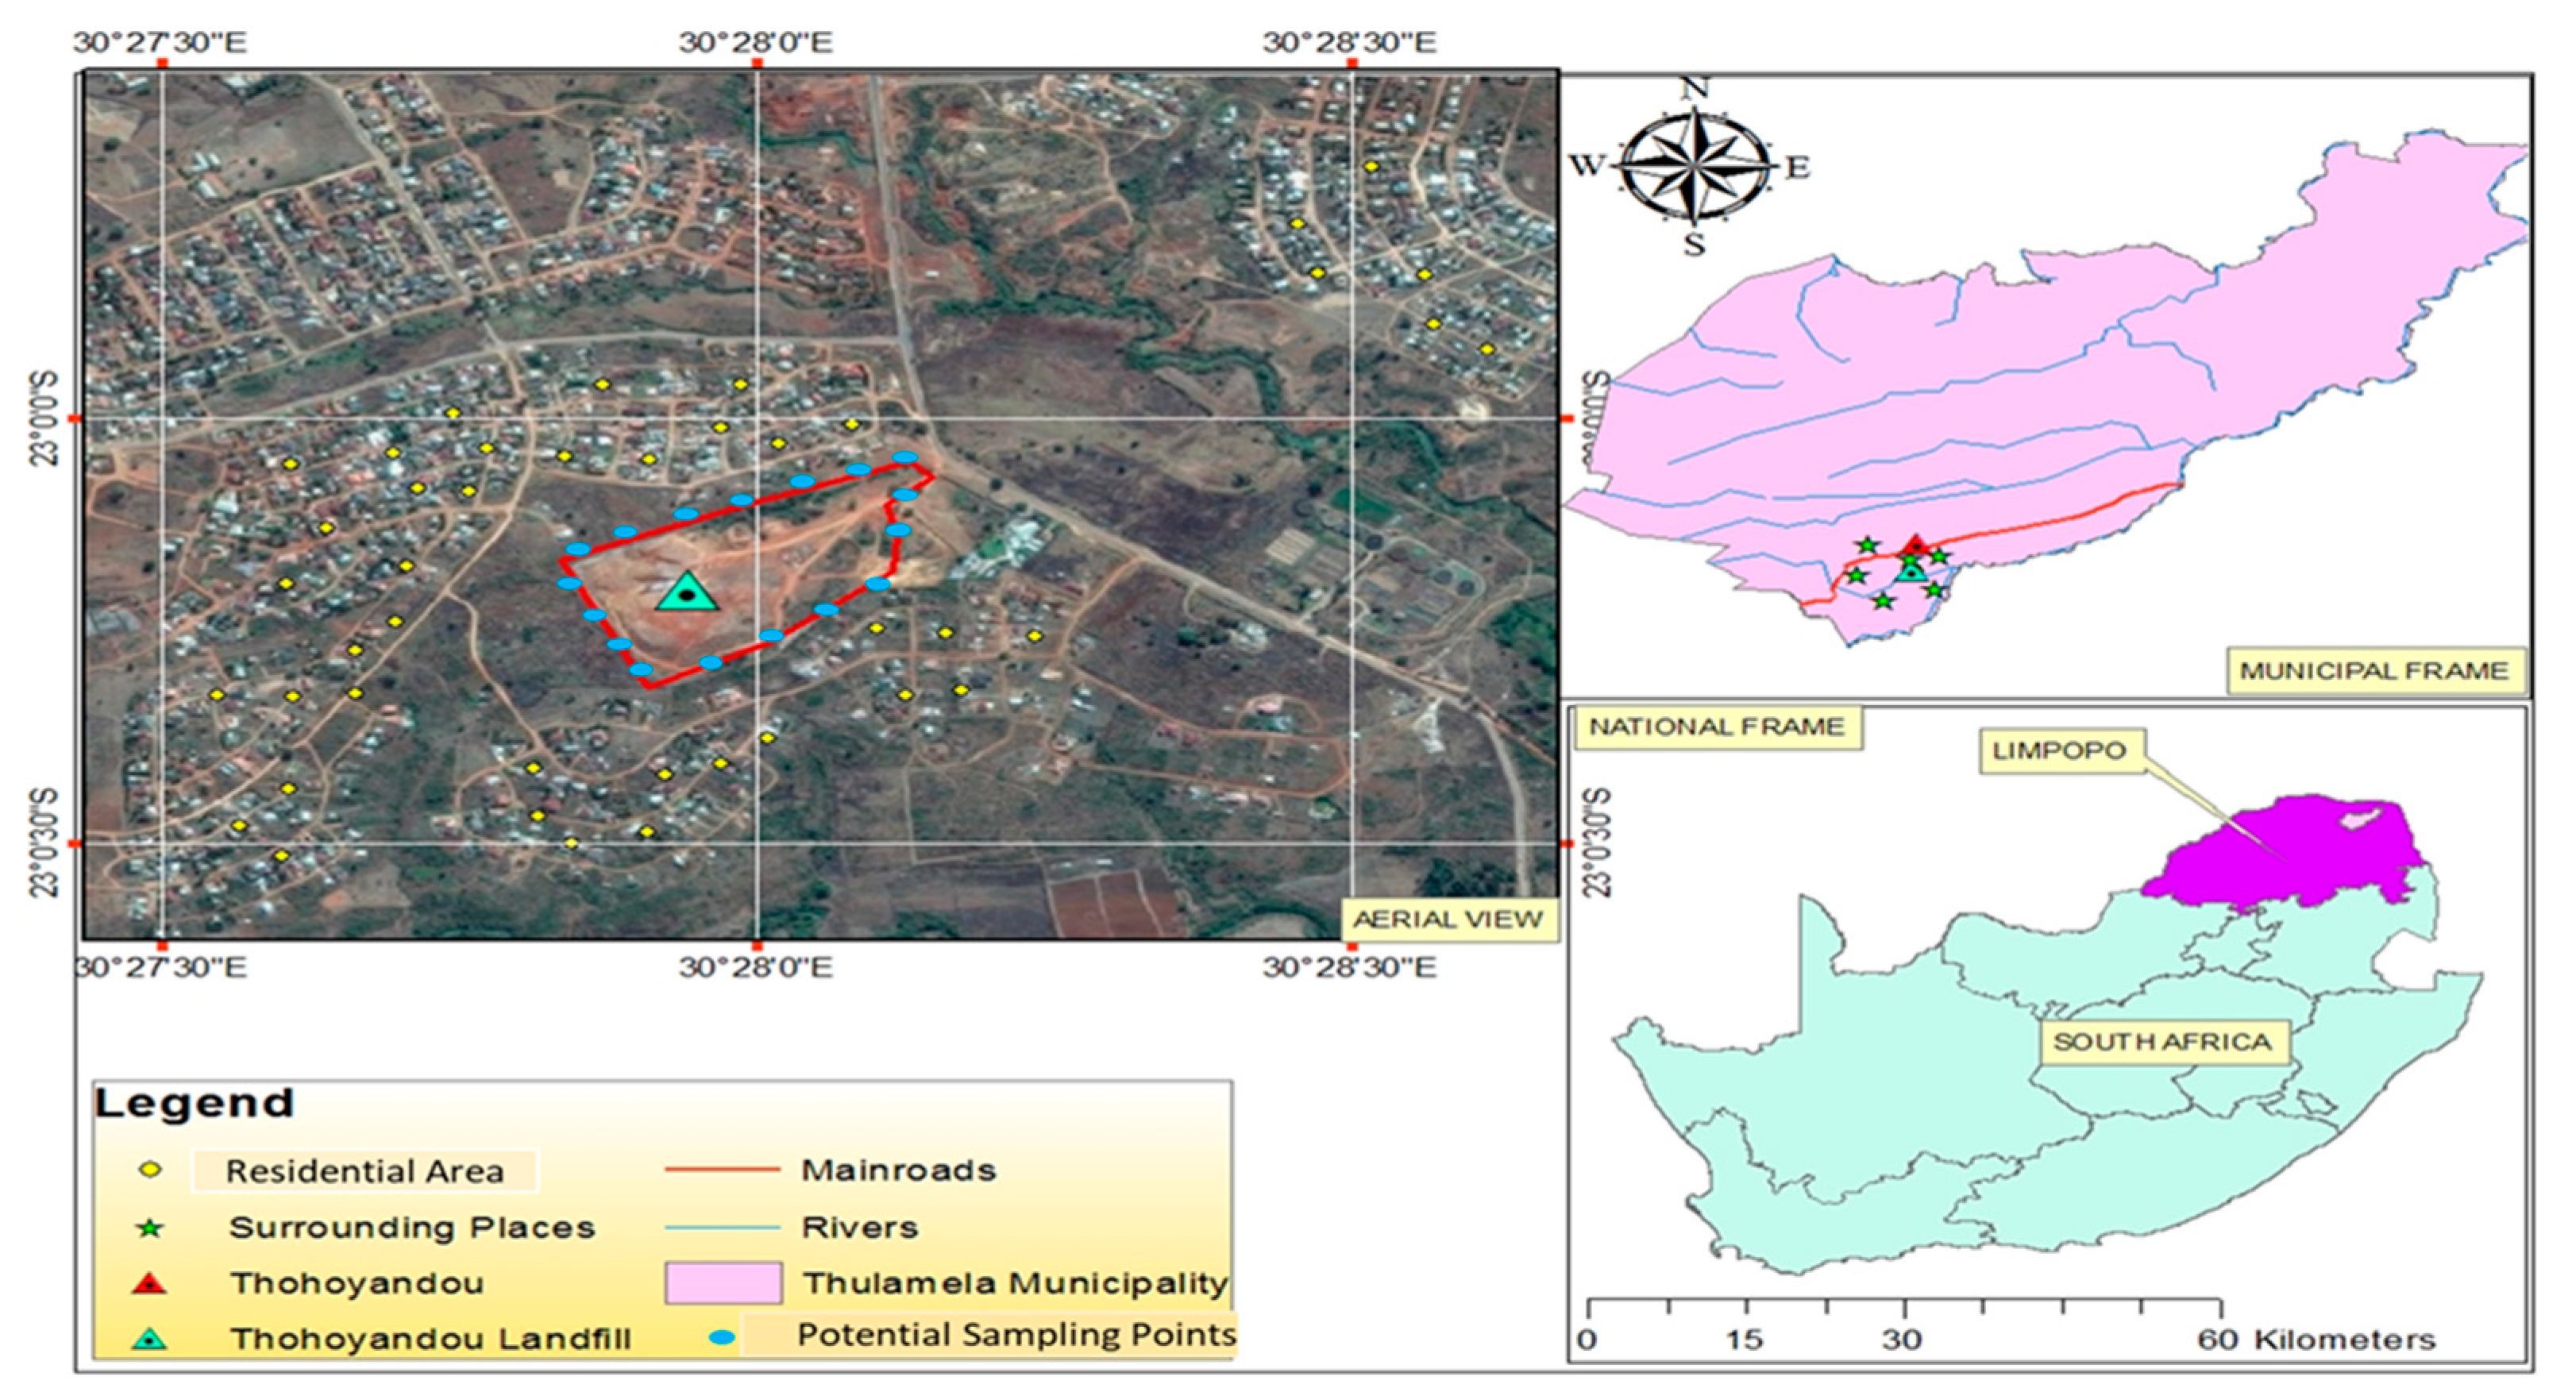
2.1. Study Area
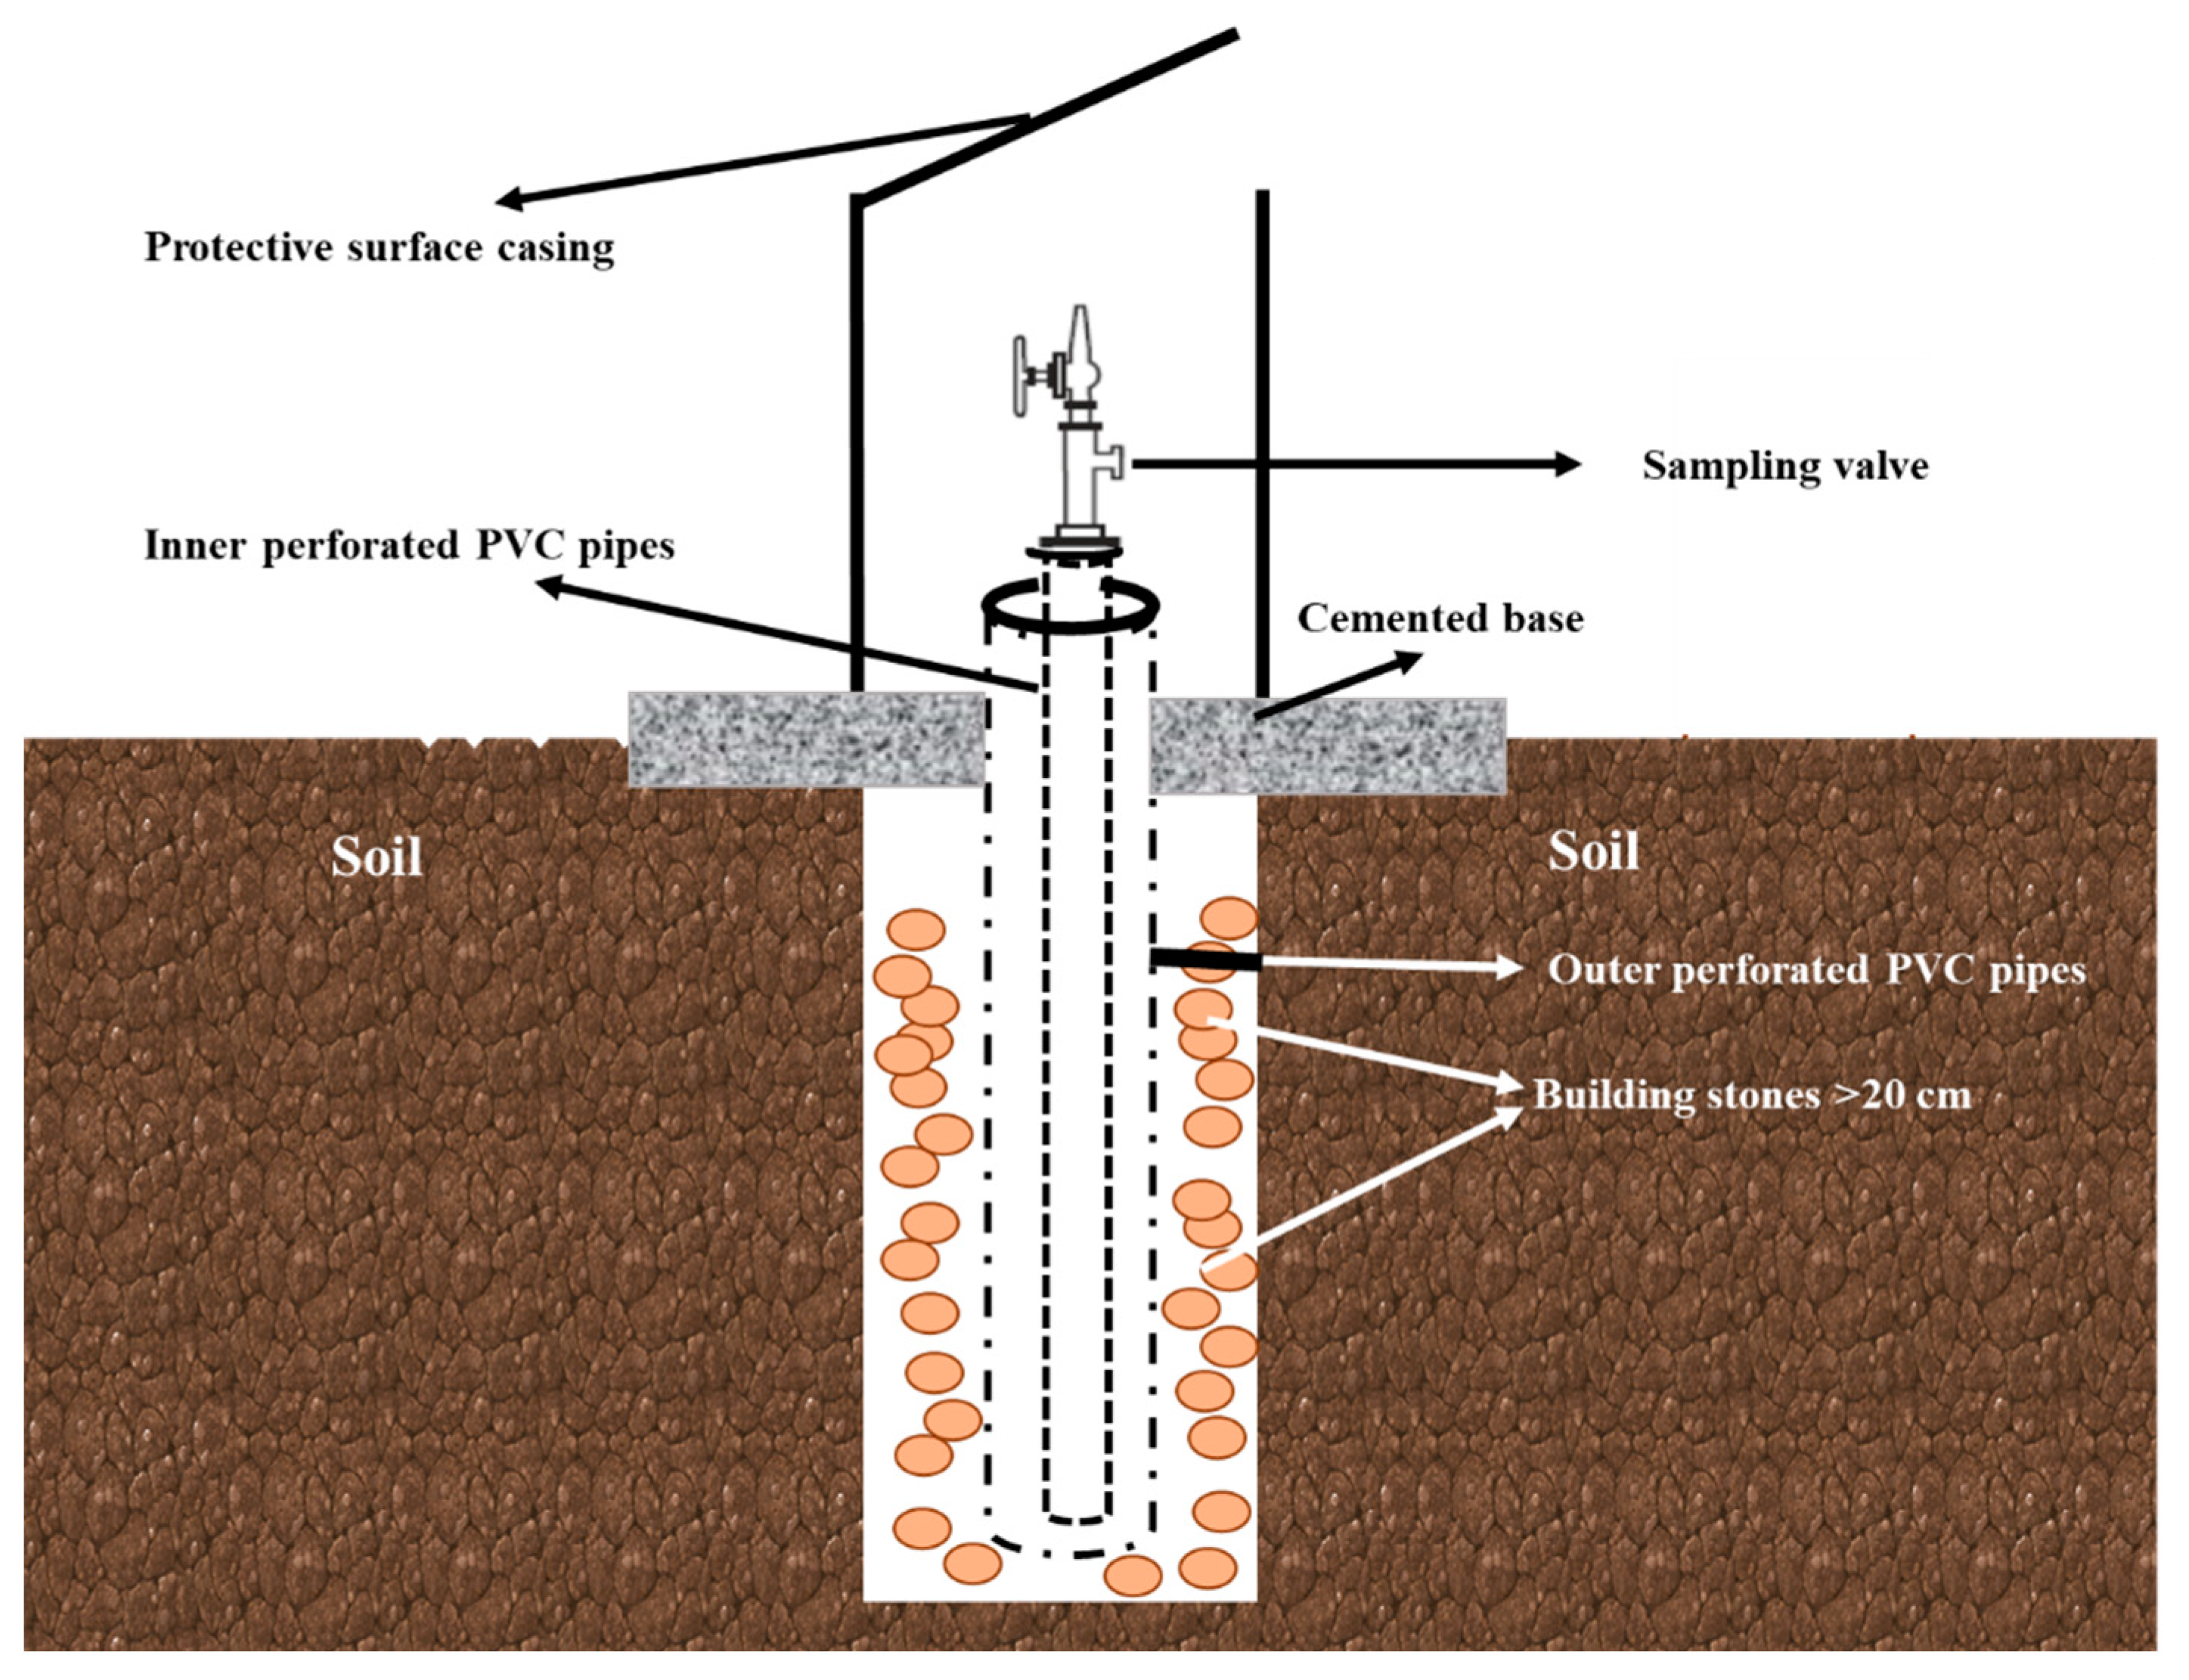
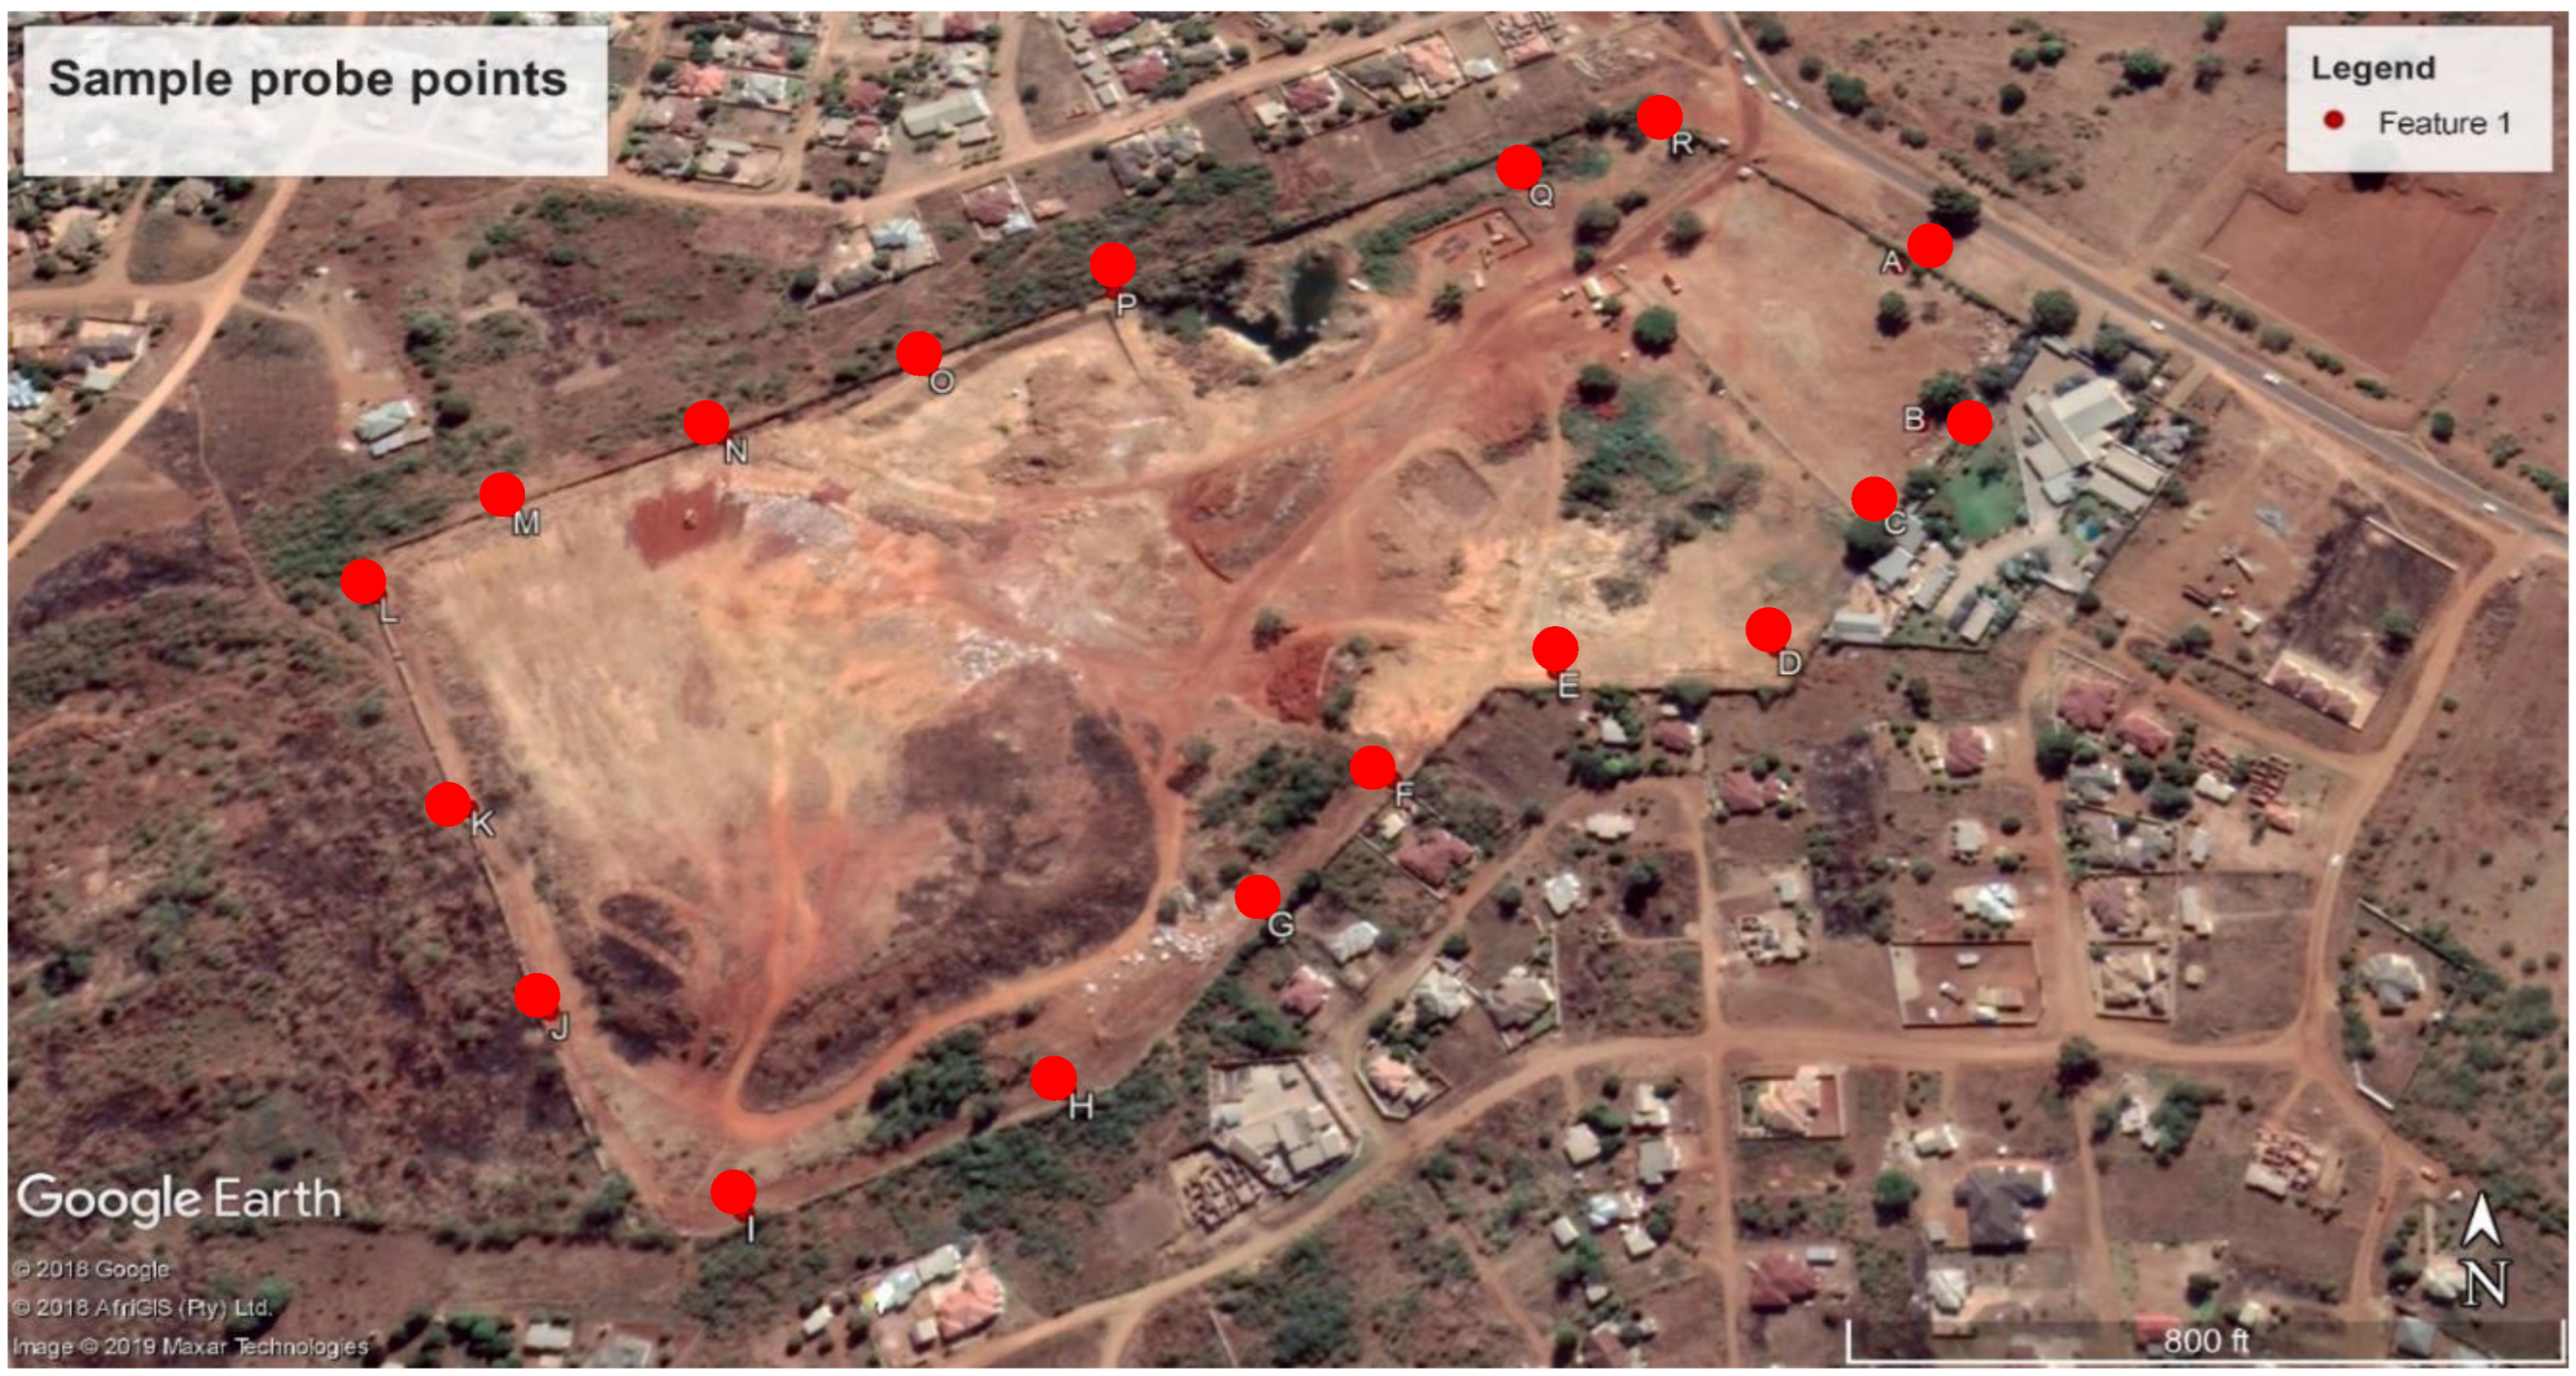
2.2. Design and Installation of Monitoring Probes
2.3. Data Collection
2.4. Data Analysis for the Influence of Meteorological Factors on CH4 and CO2 Emissions
3. Results and Discussion
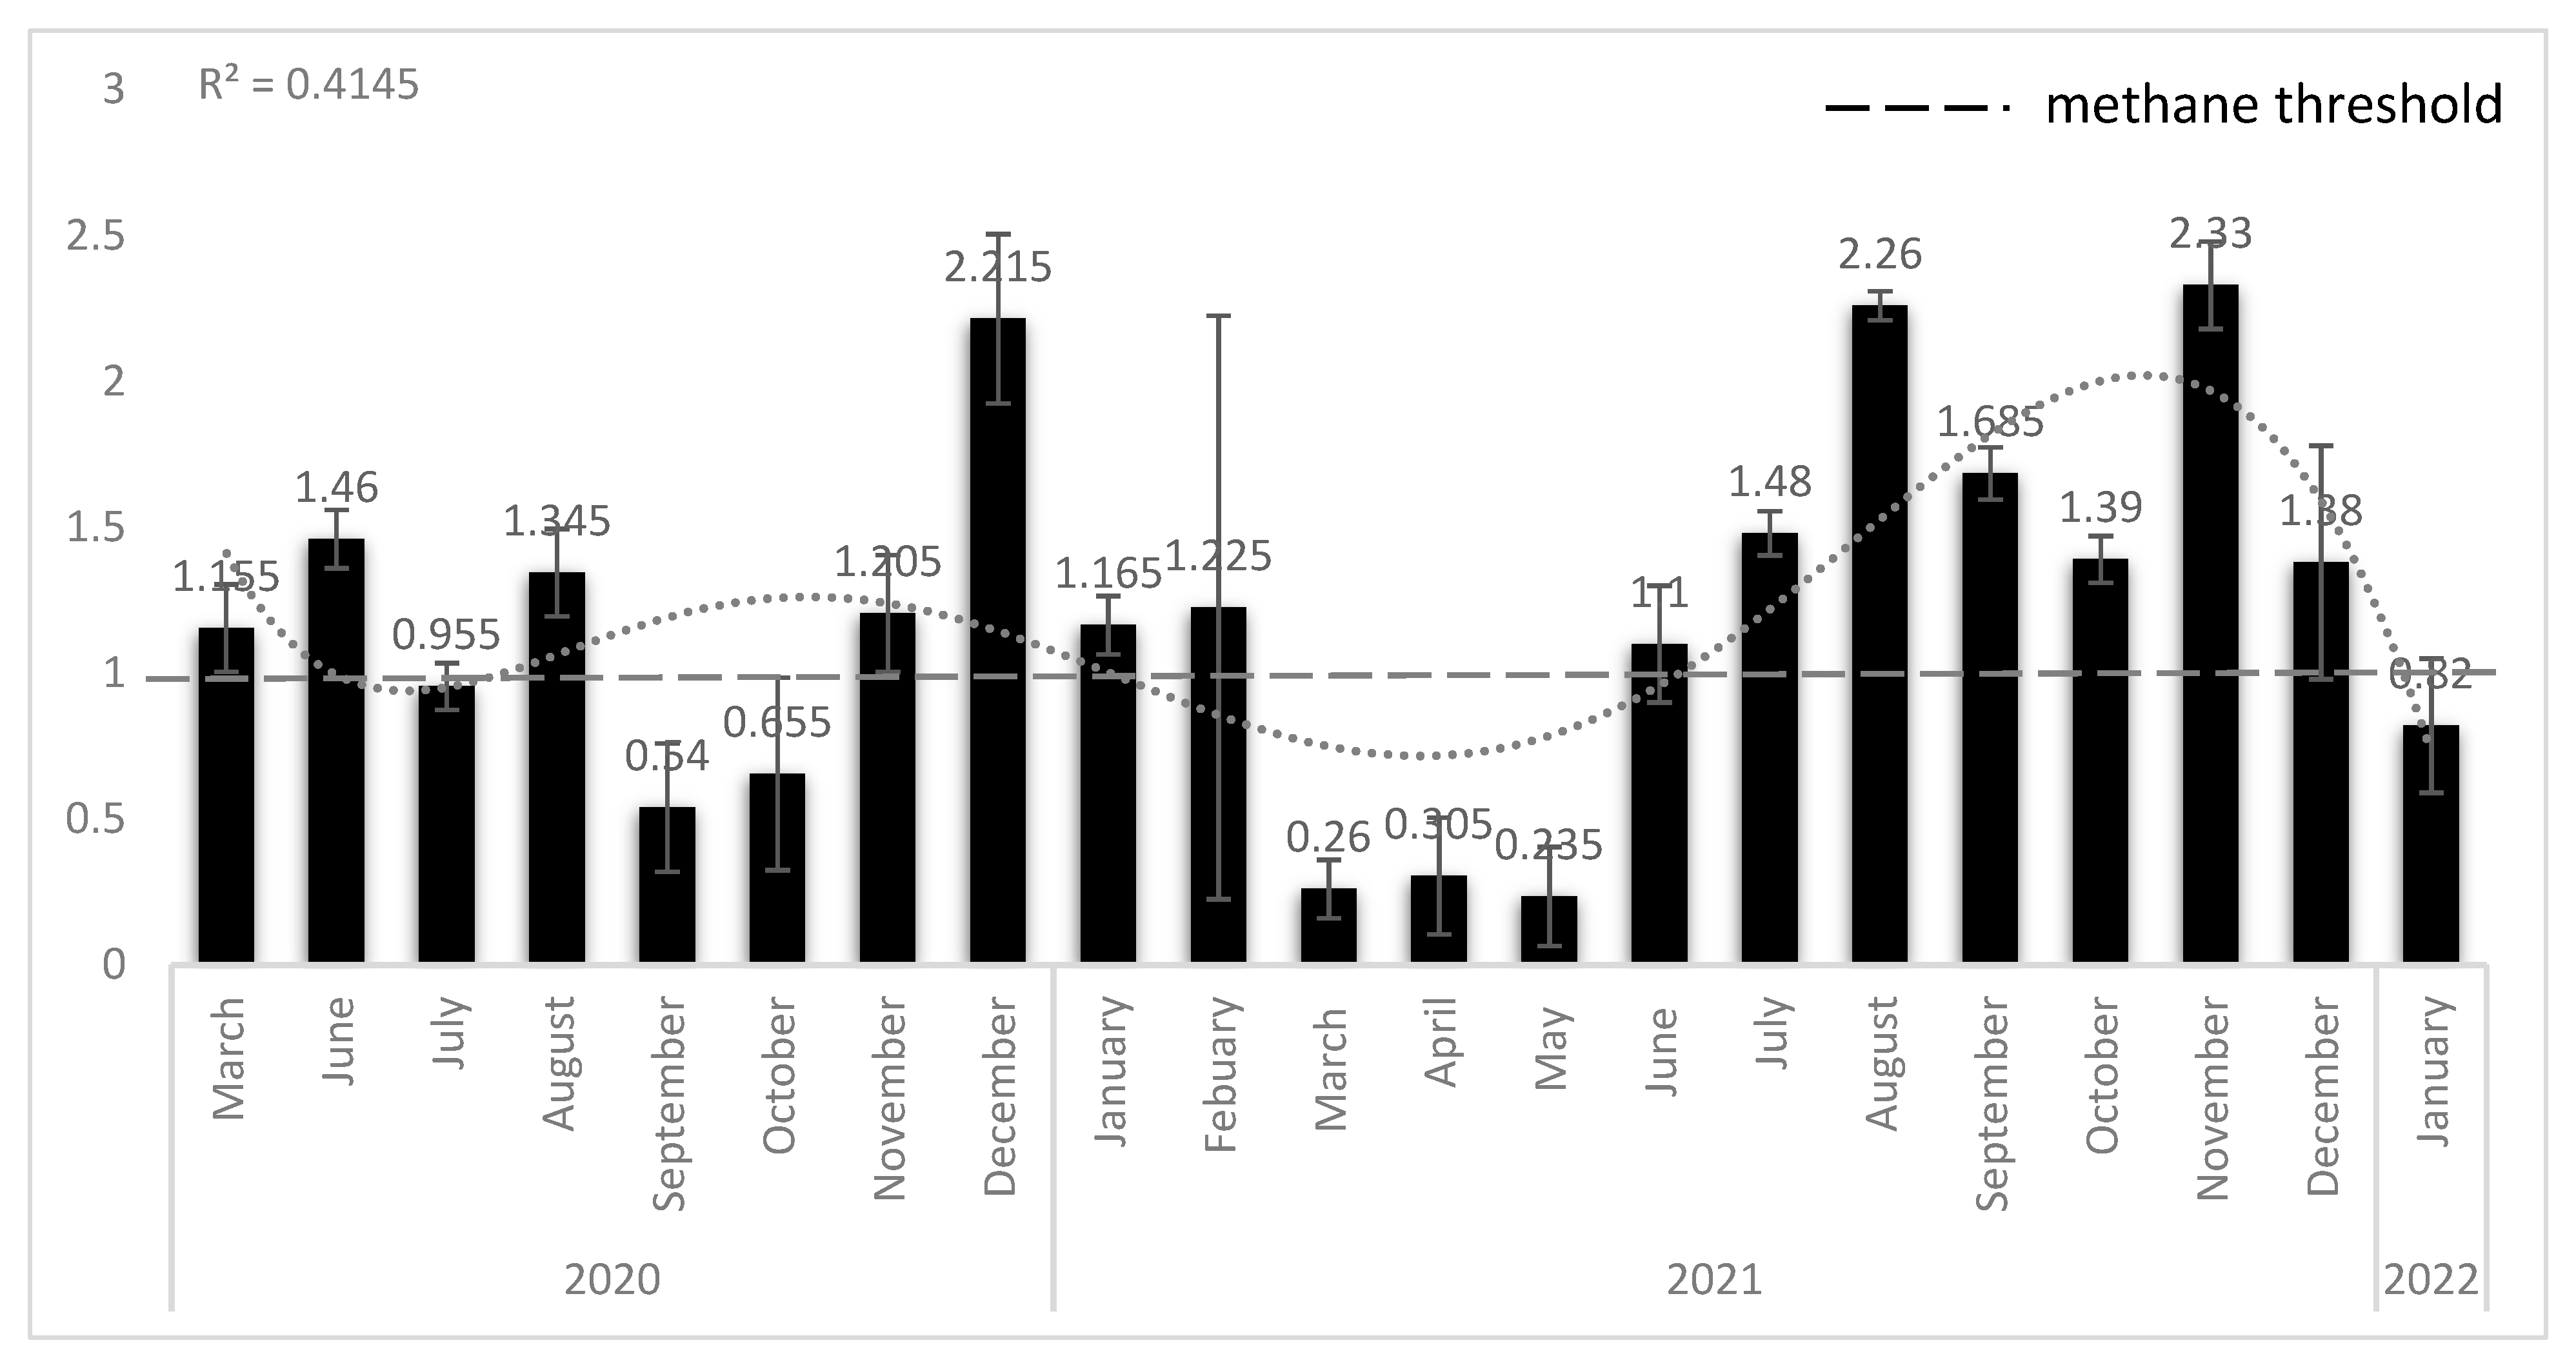
3.1. Methane Generation from Thohoyandou Landfill
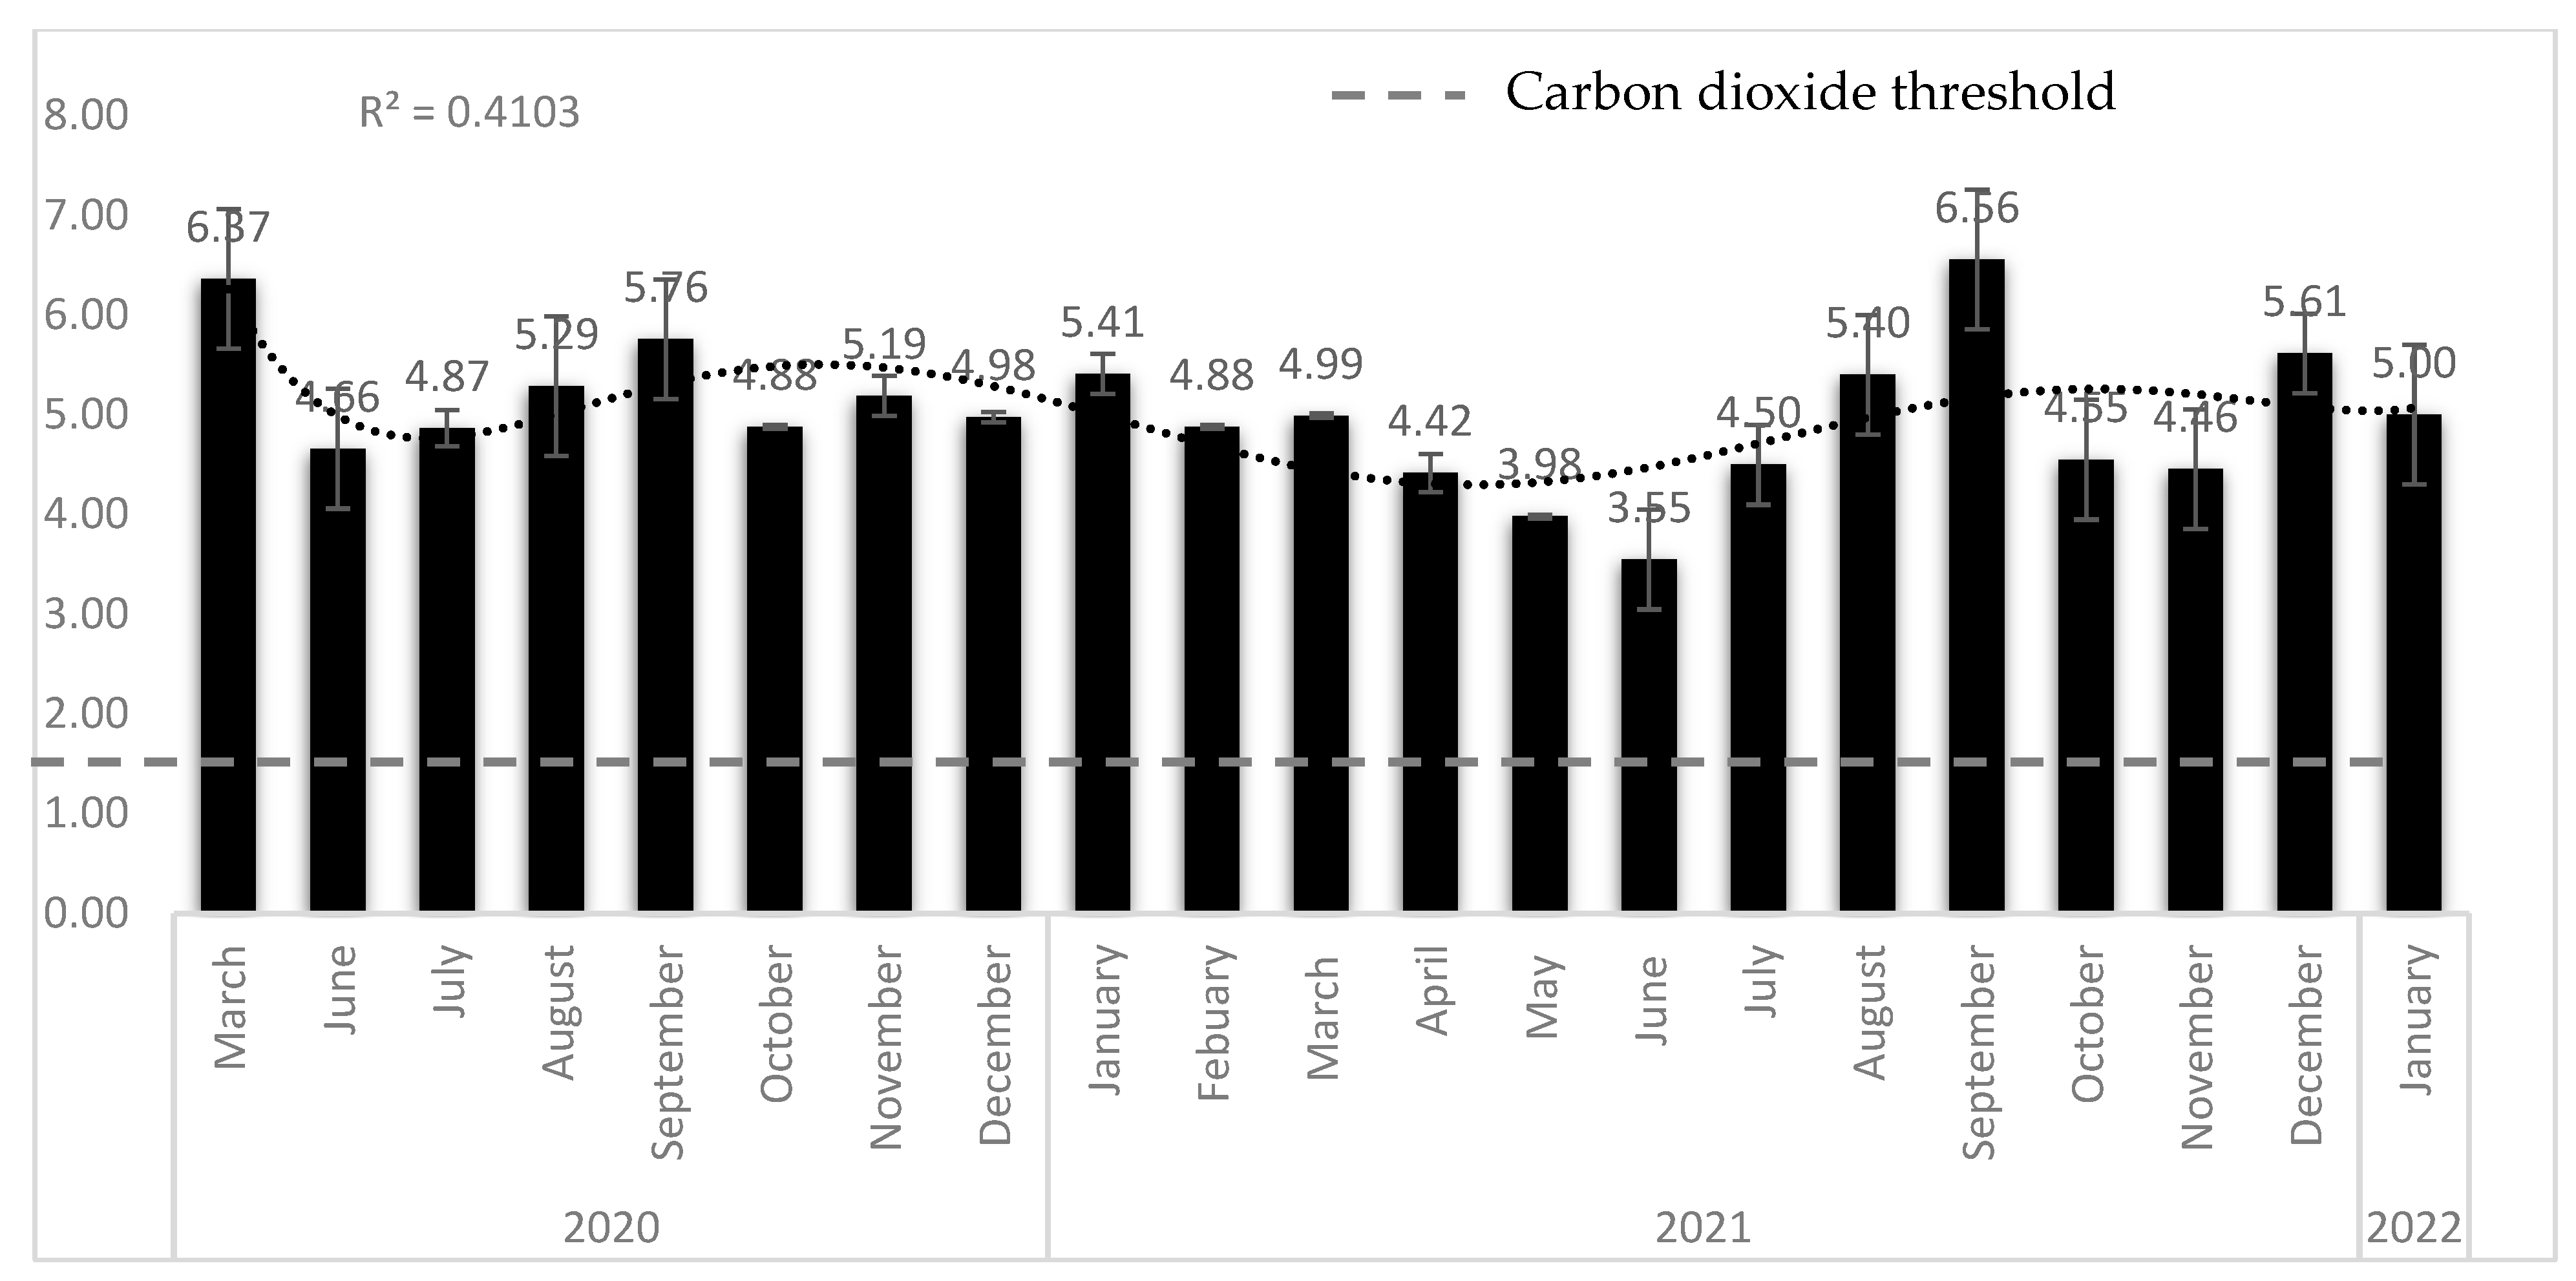
3.2. Carbon Dioxide Generation from Thohoyandou Landfill
3.3. Monitoring of CH4 and CO2 Concentrations from the Different Probes of the Thohoyandou Landfill
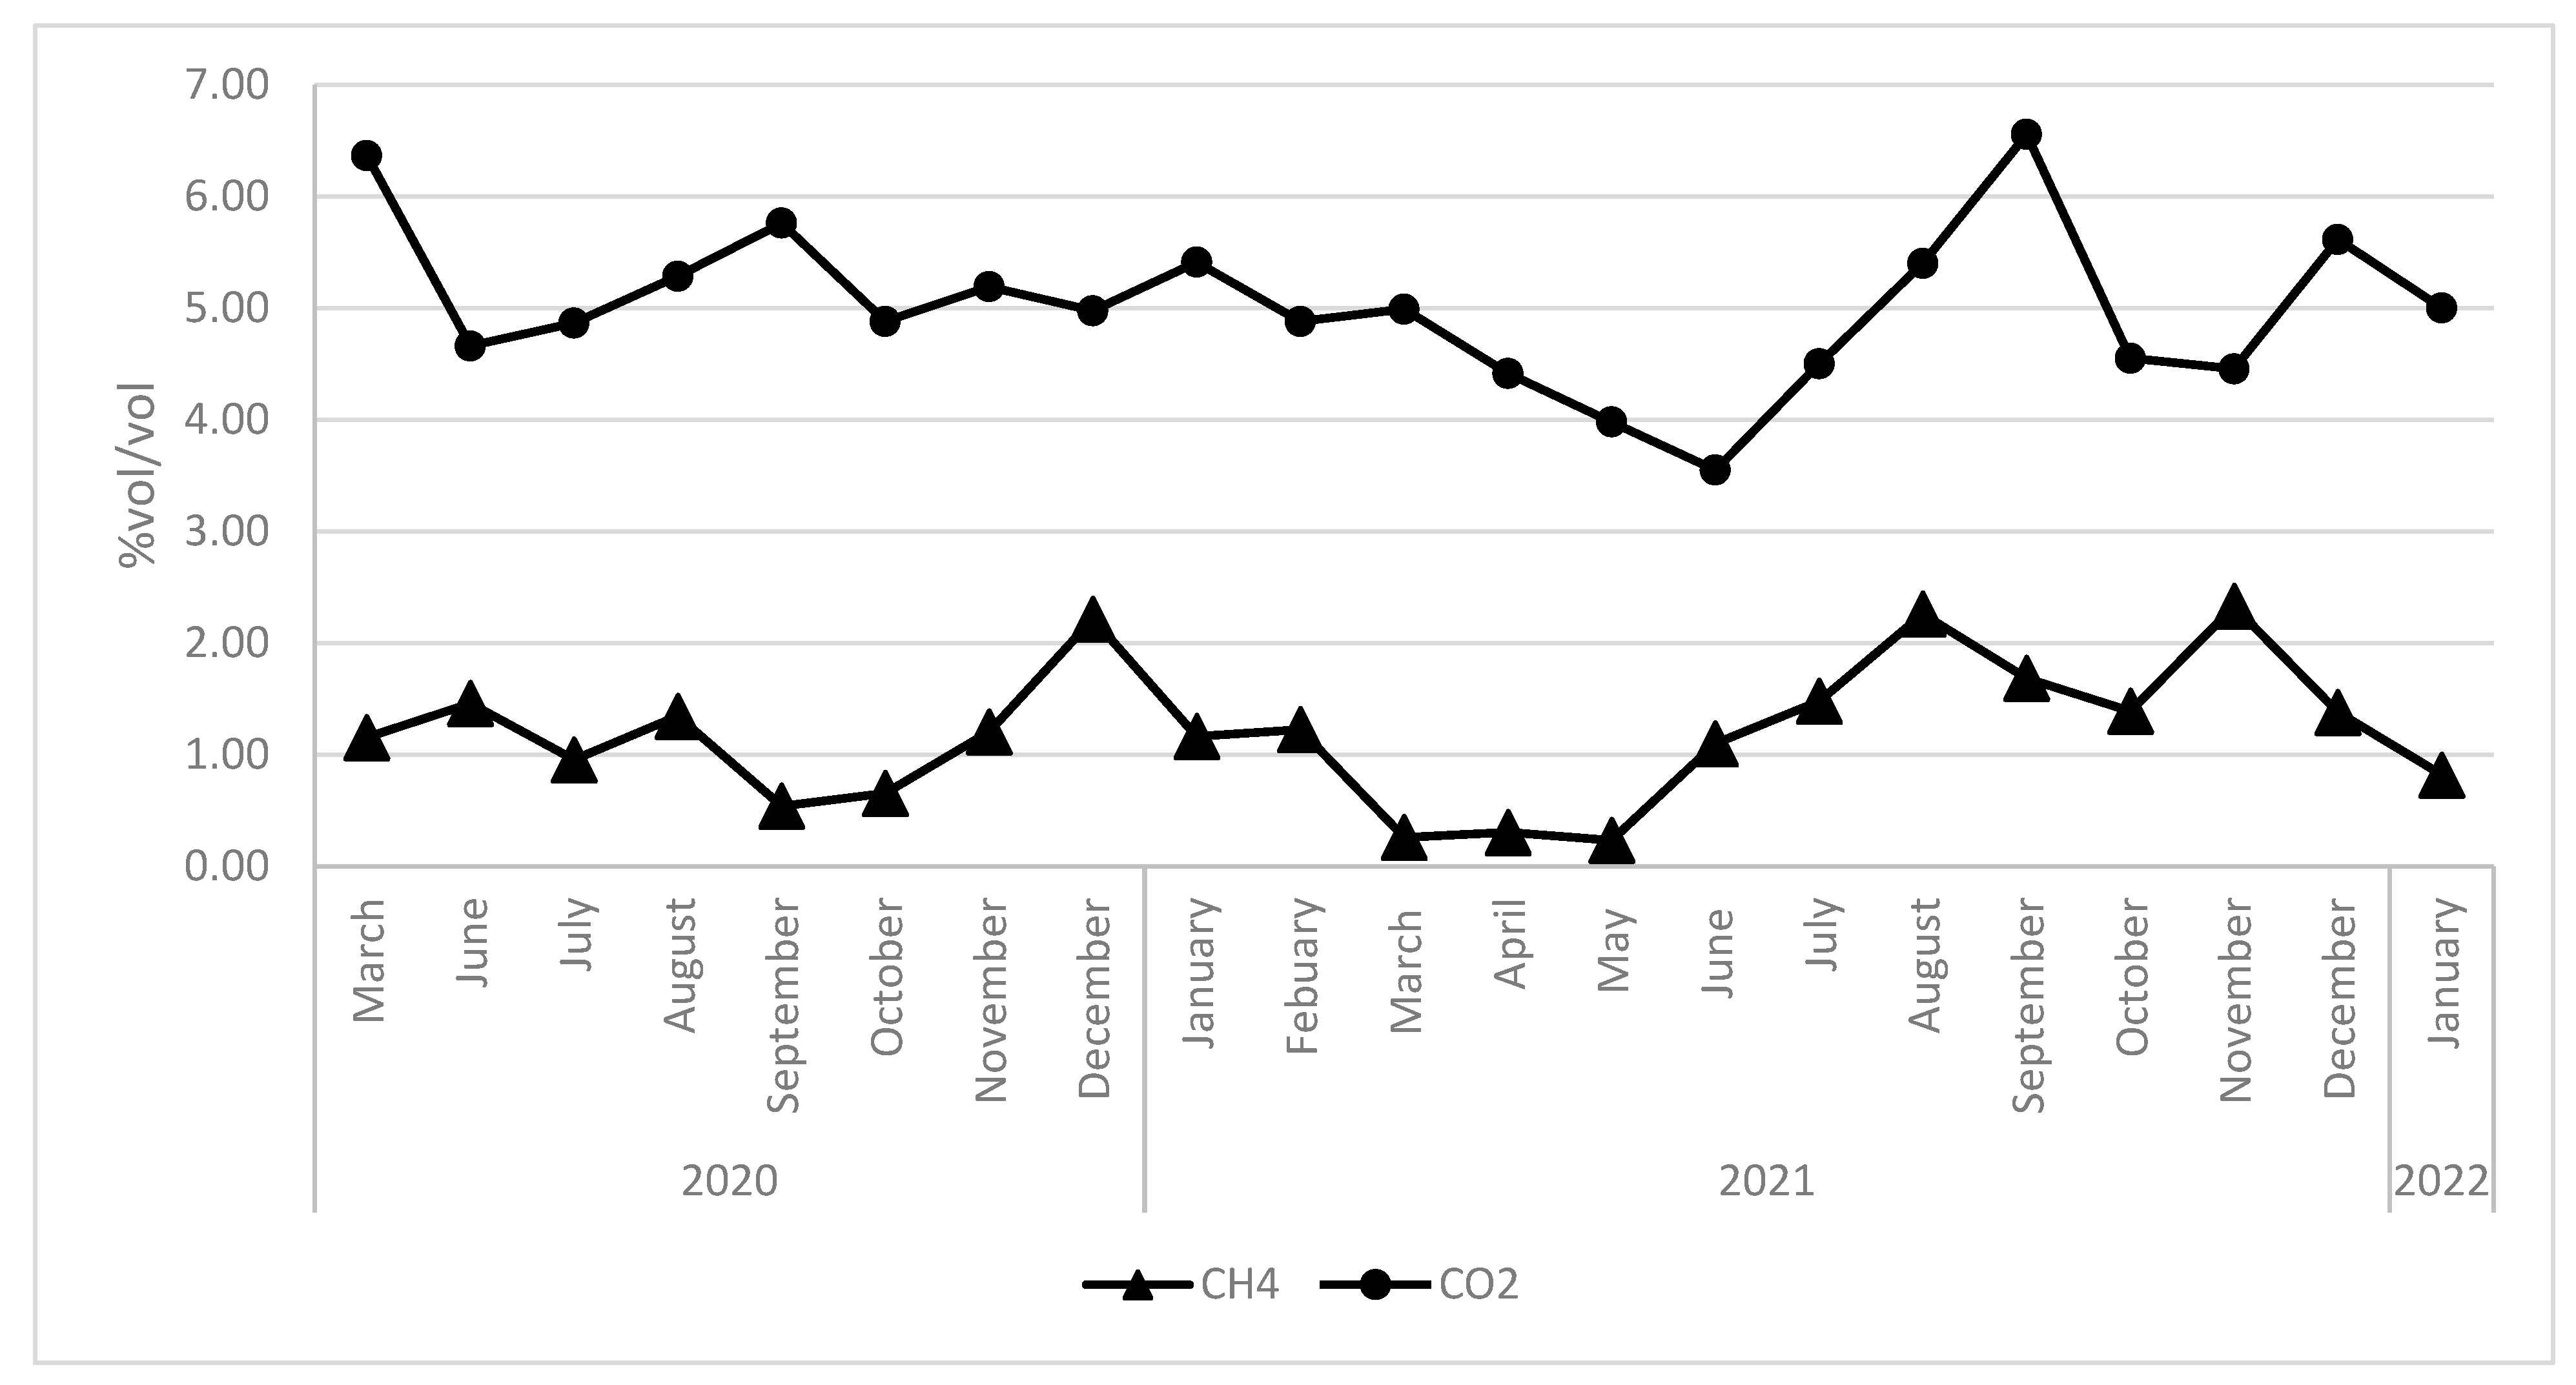
3.4. Average CH4 and CO2 Comparison
3.5. Influence of Meteorological Conditions on the CH4 and CO2 Levels
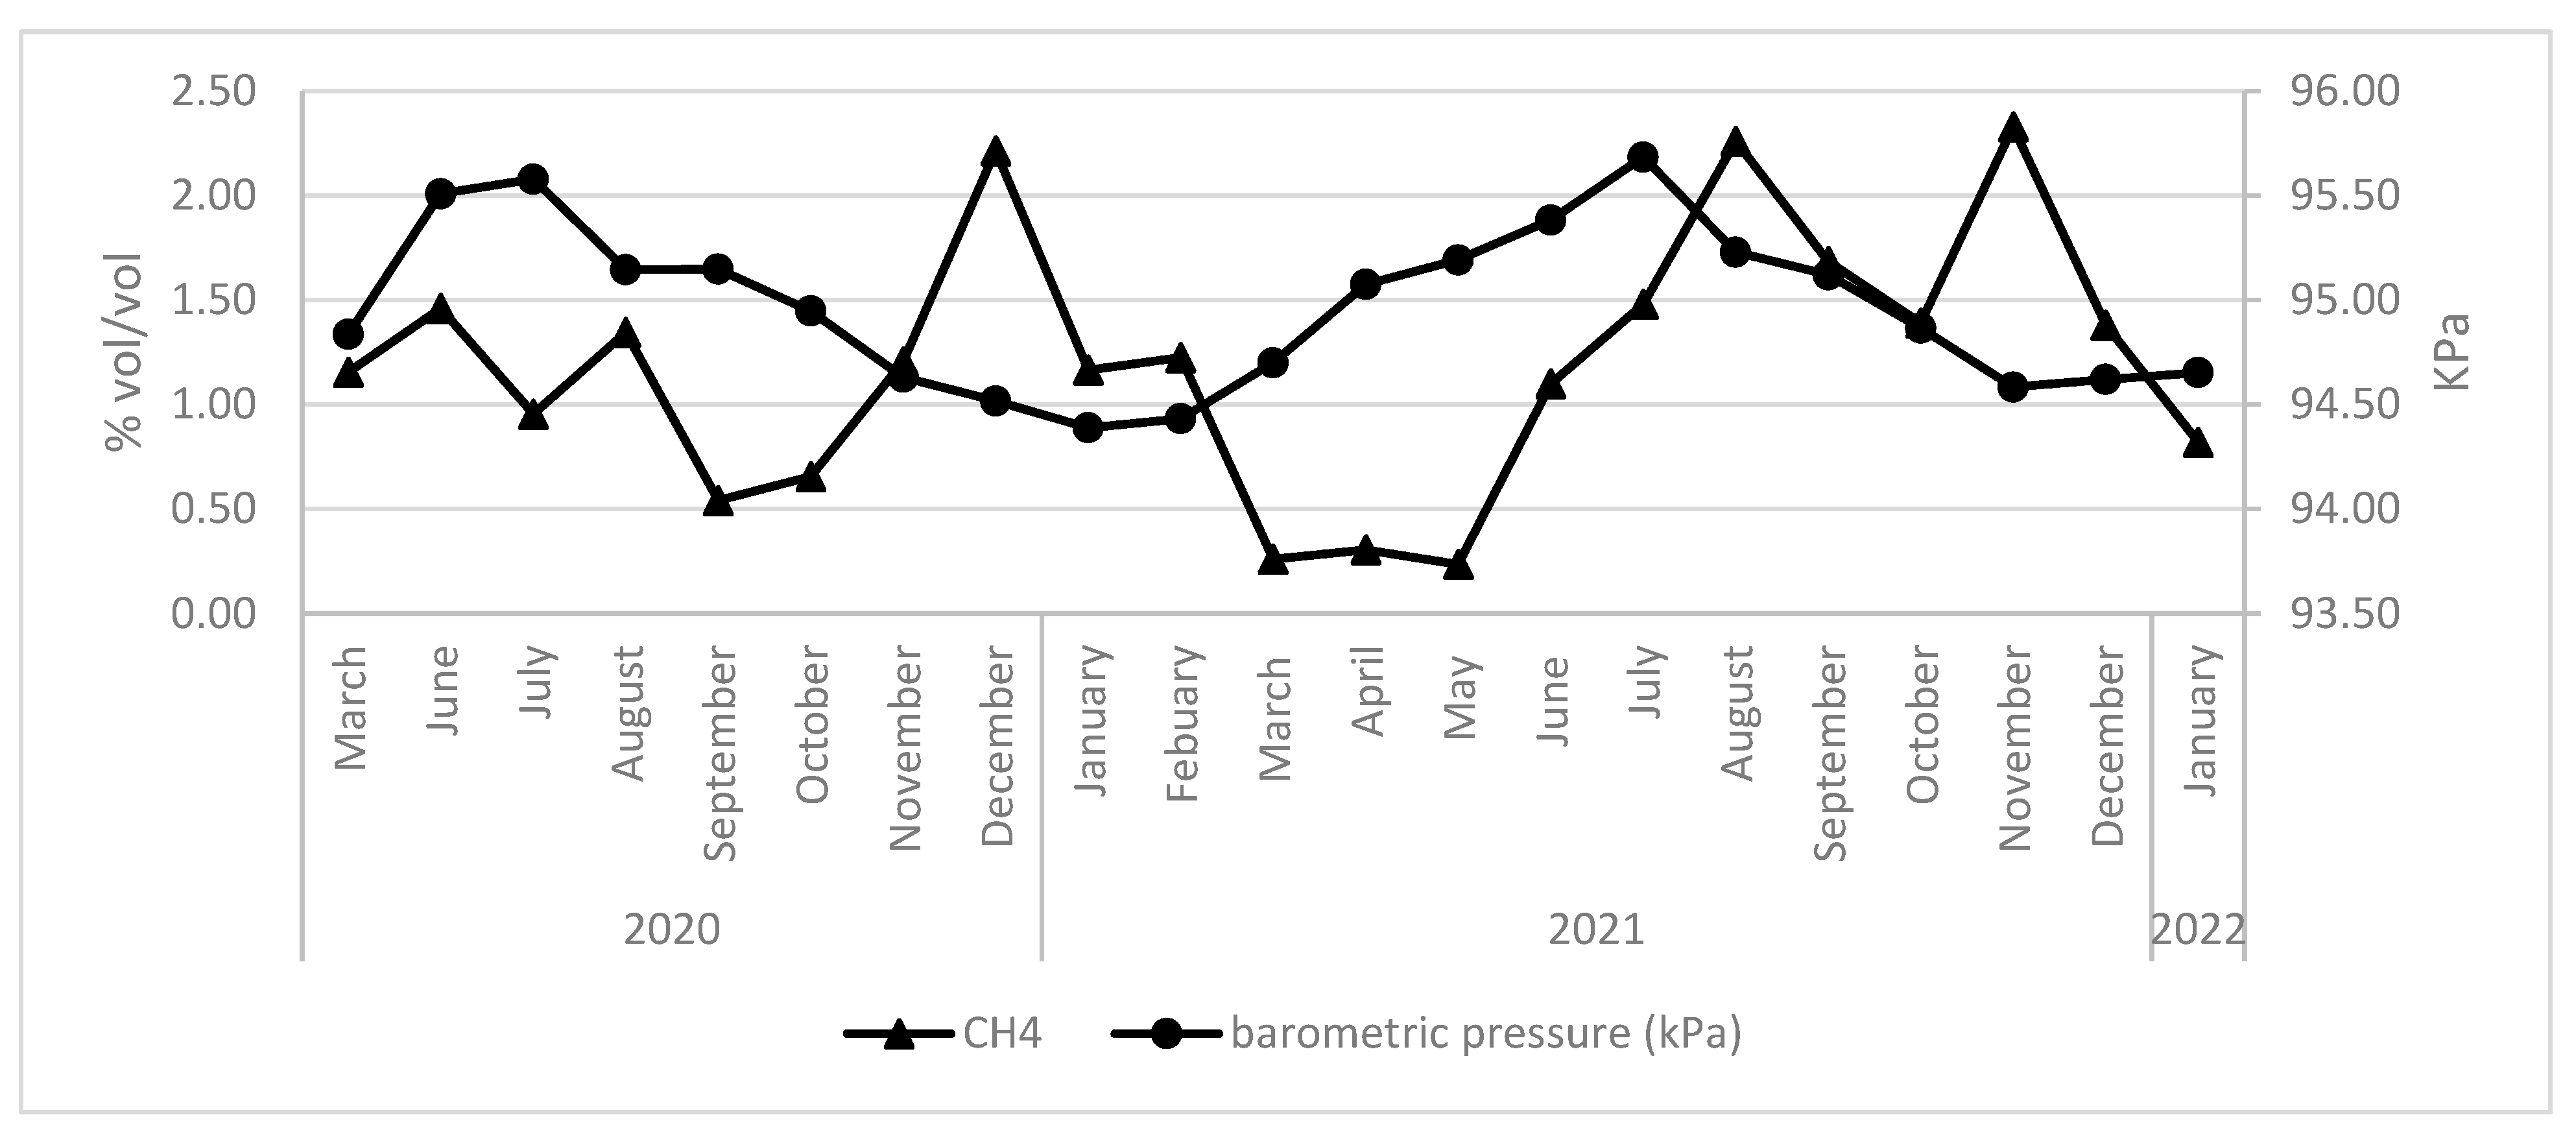
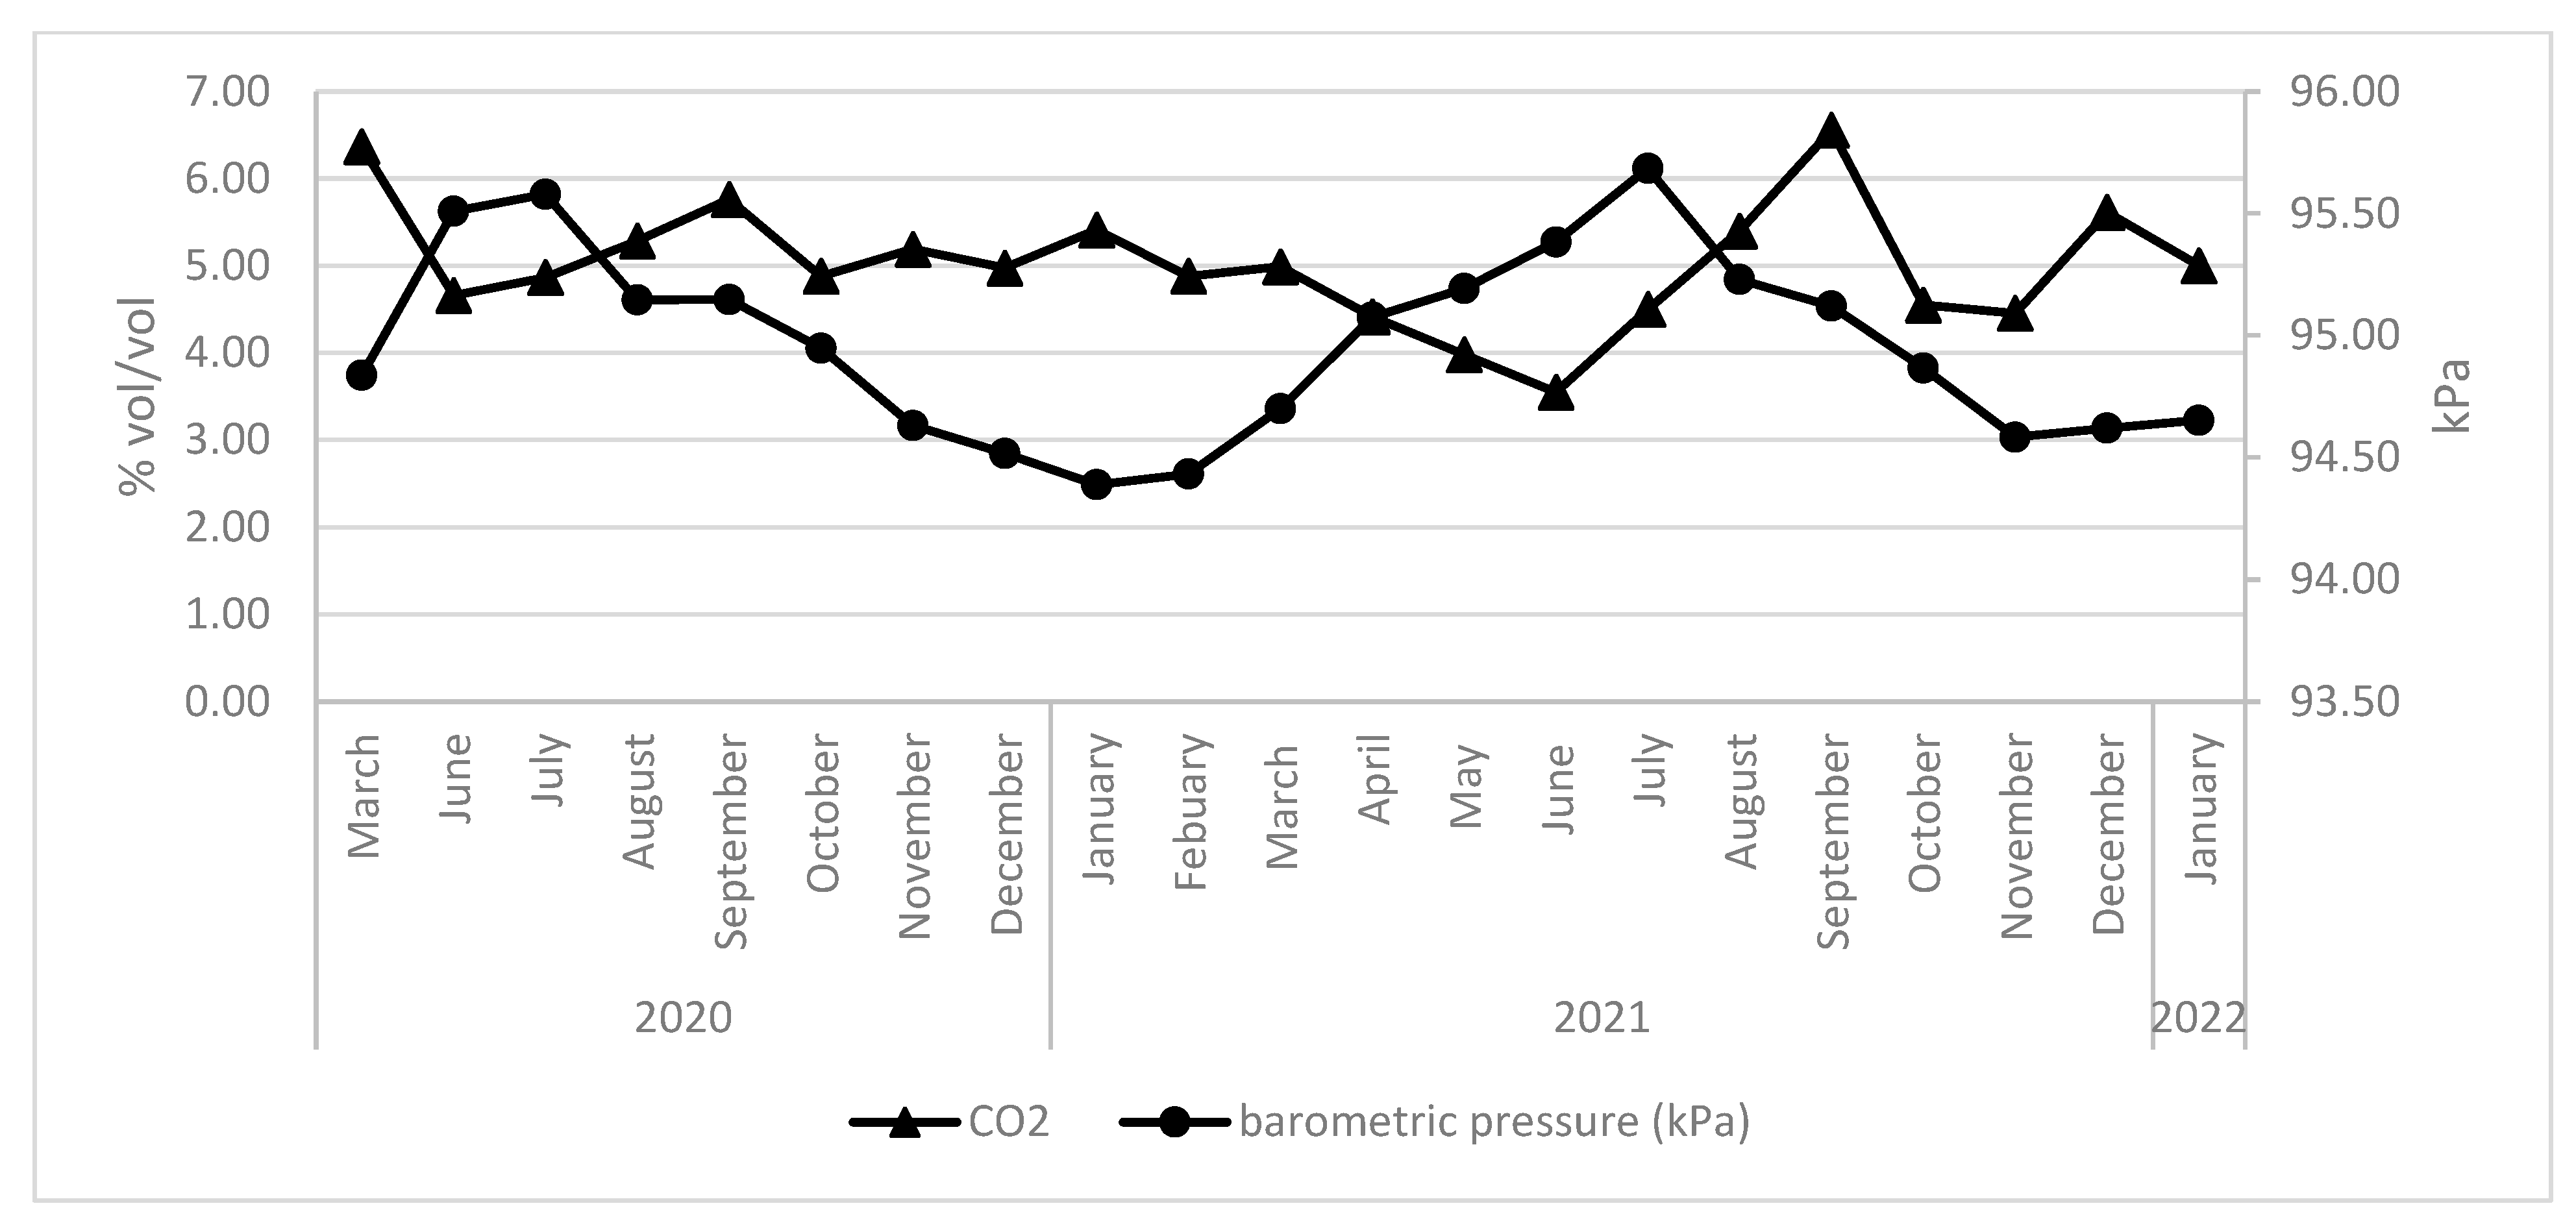
3.5.1. Barometric Pressure
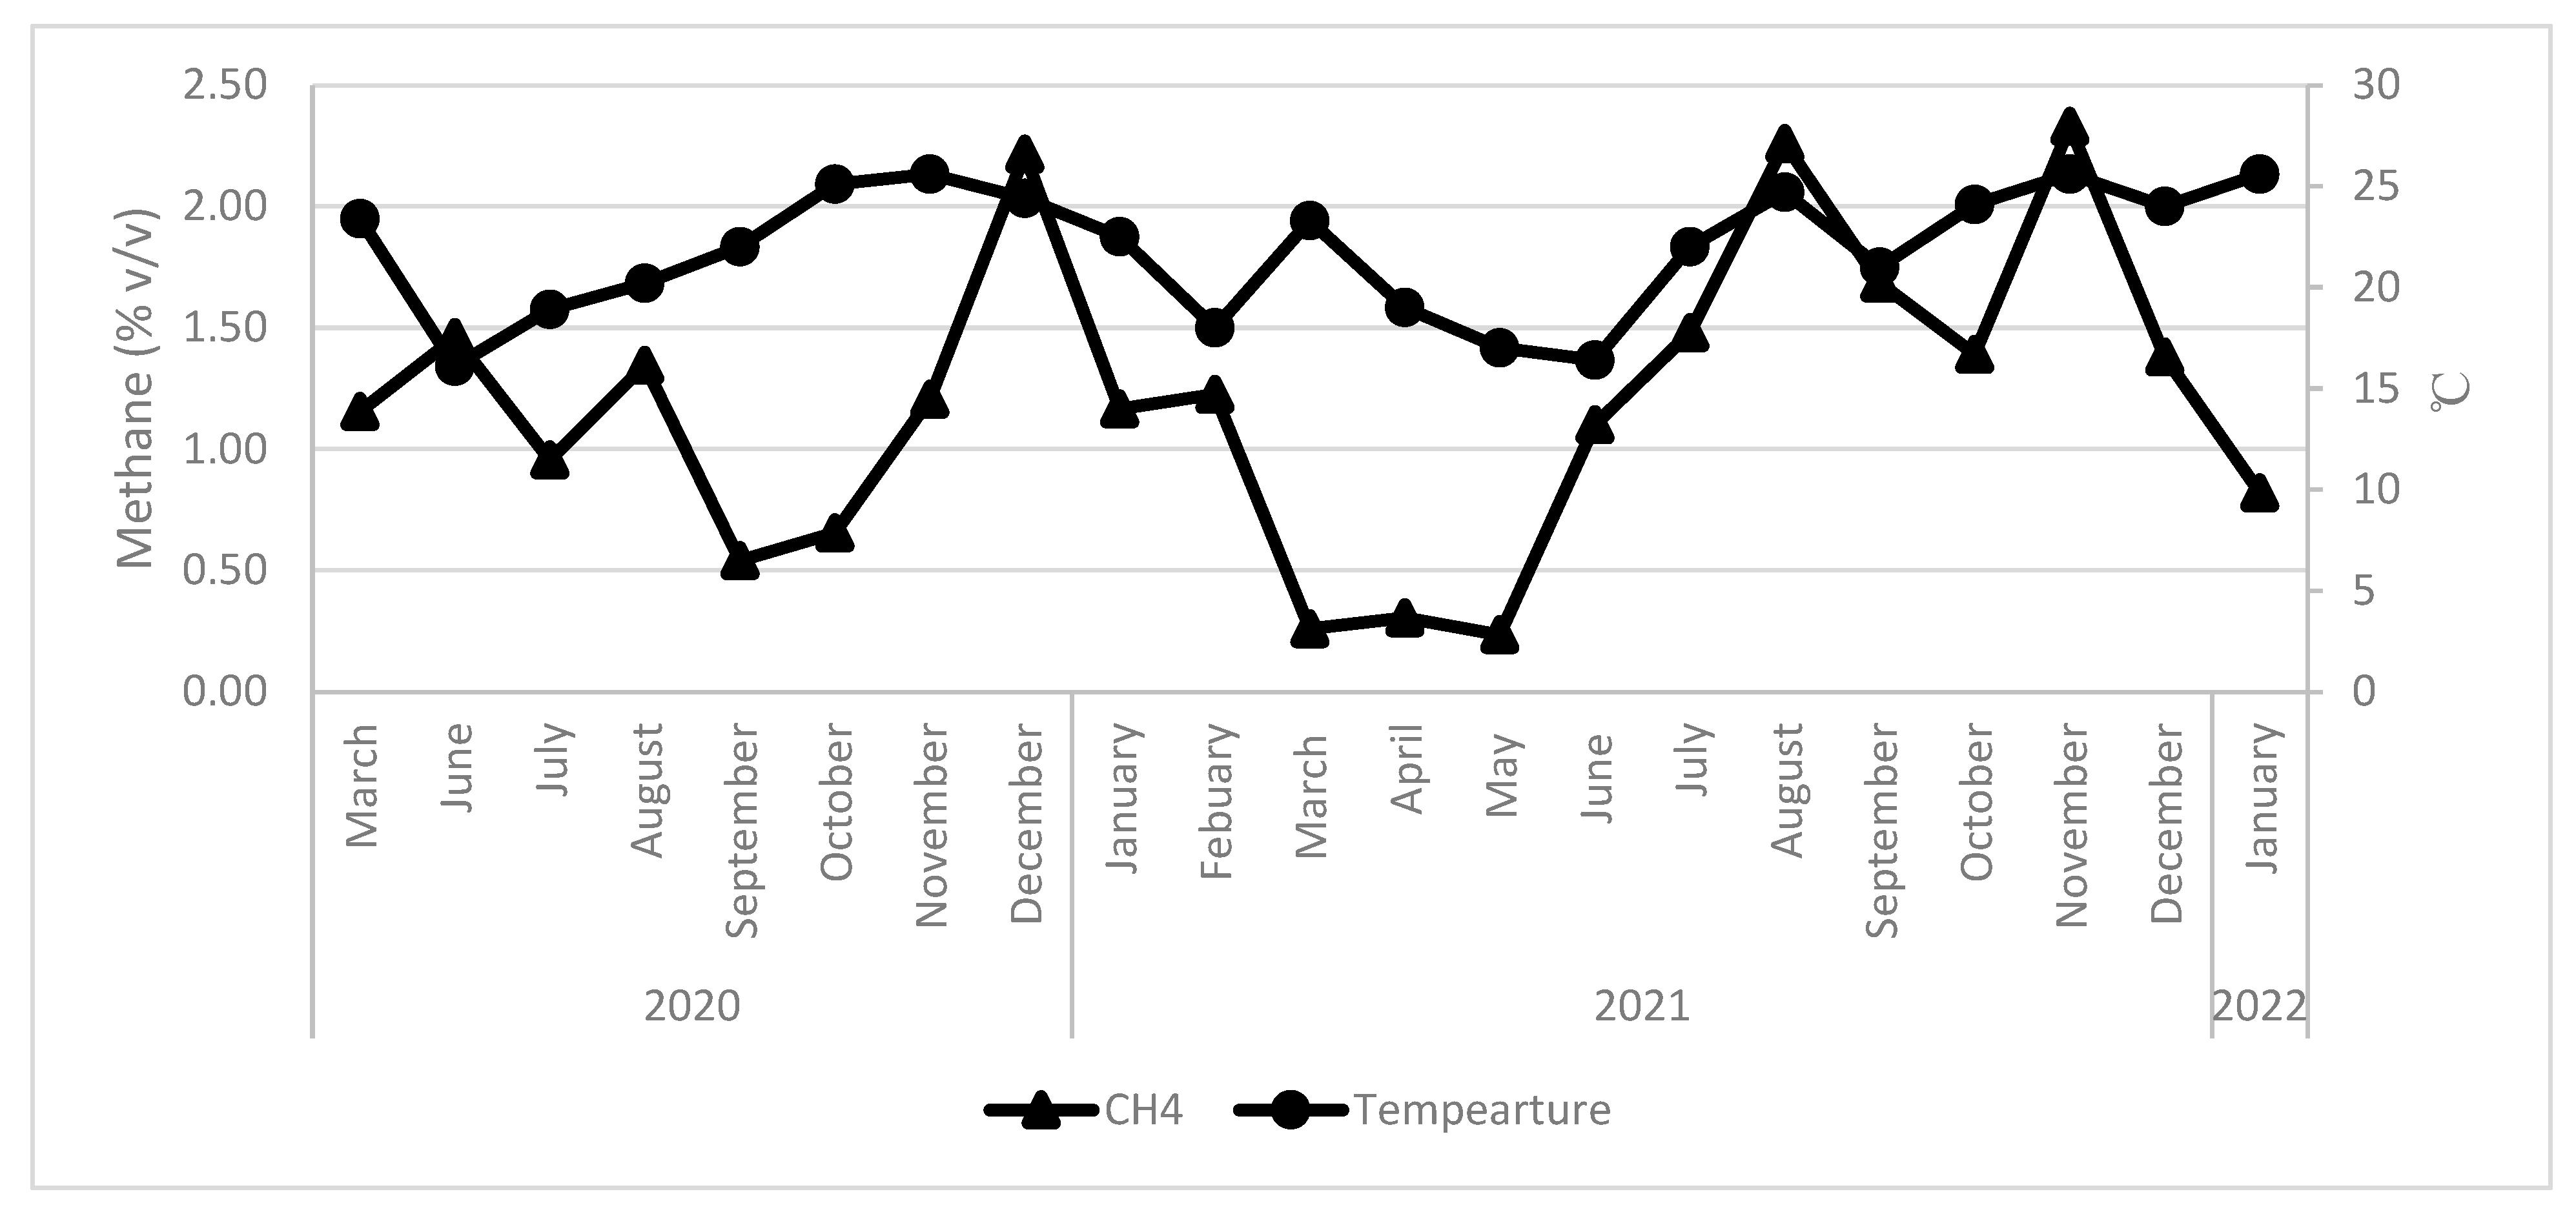
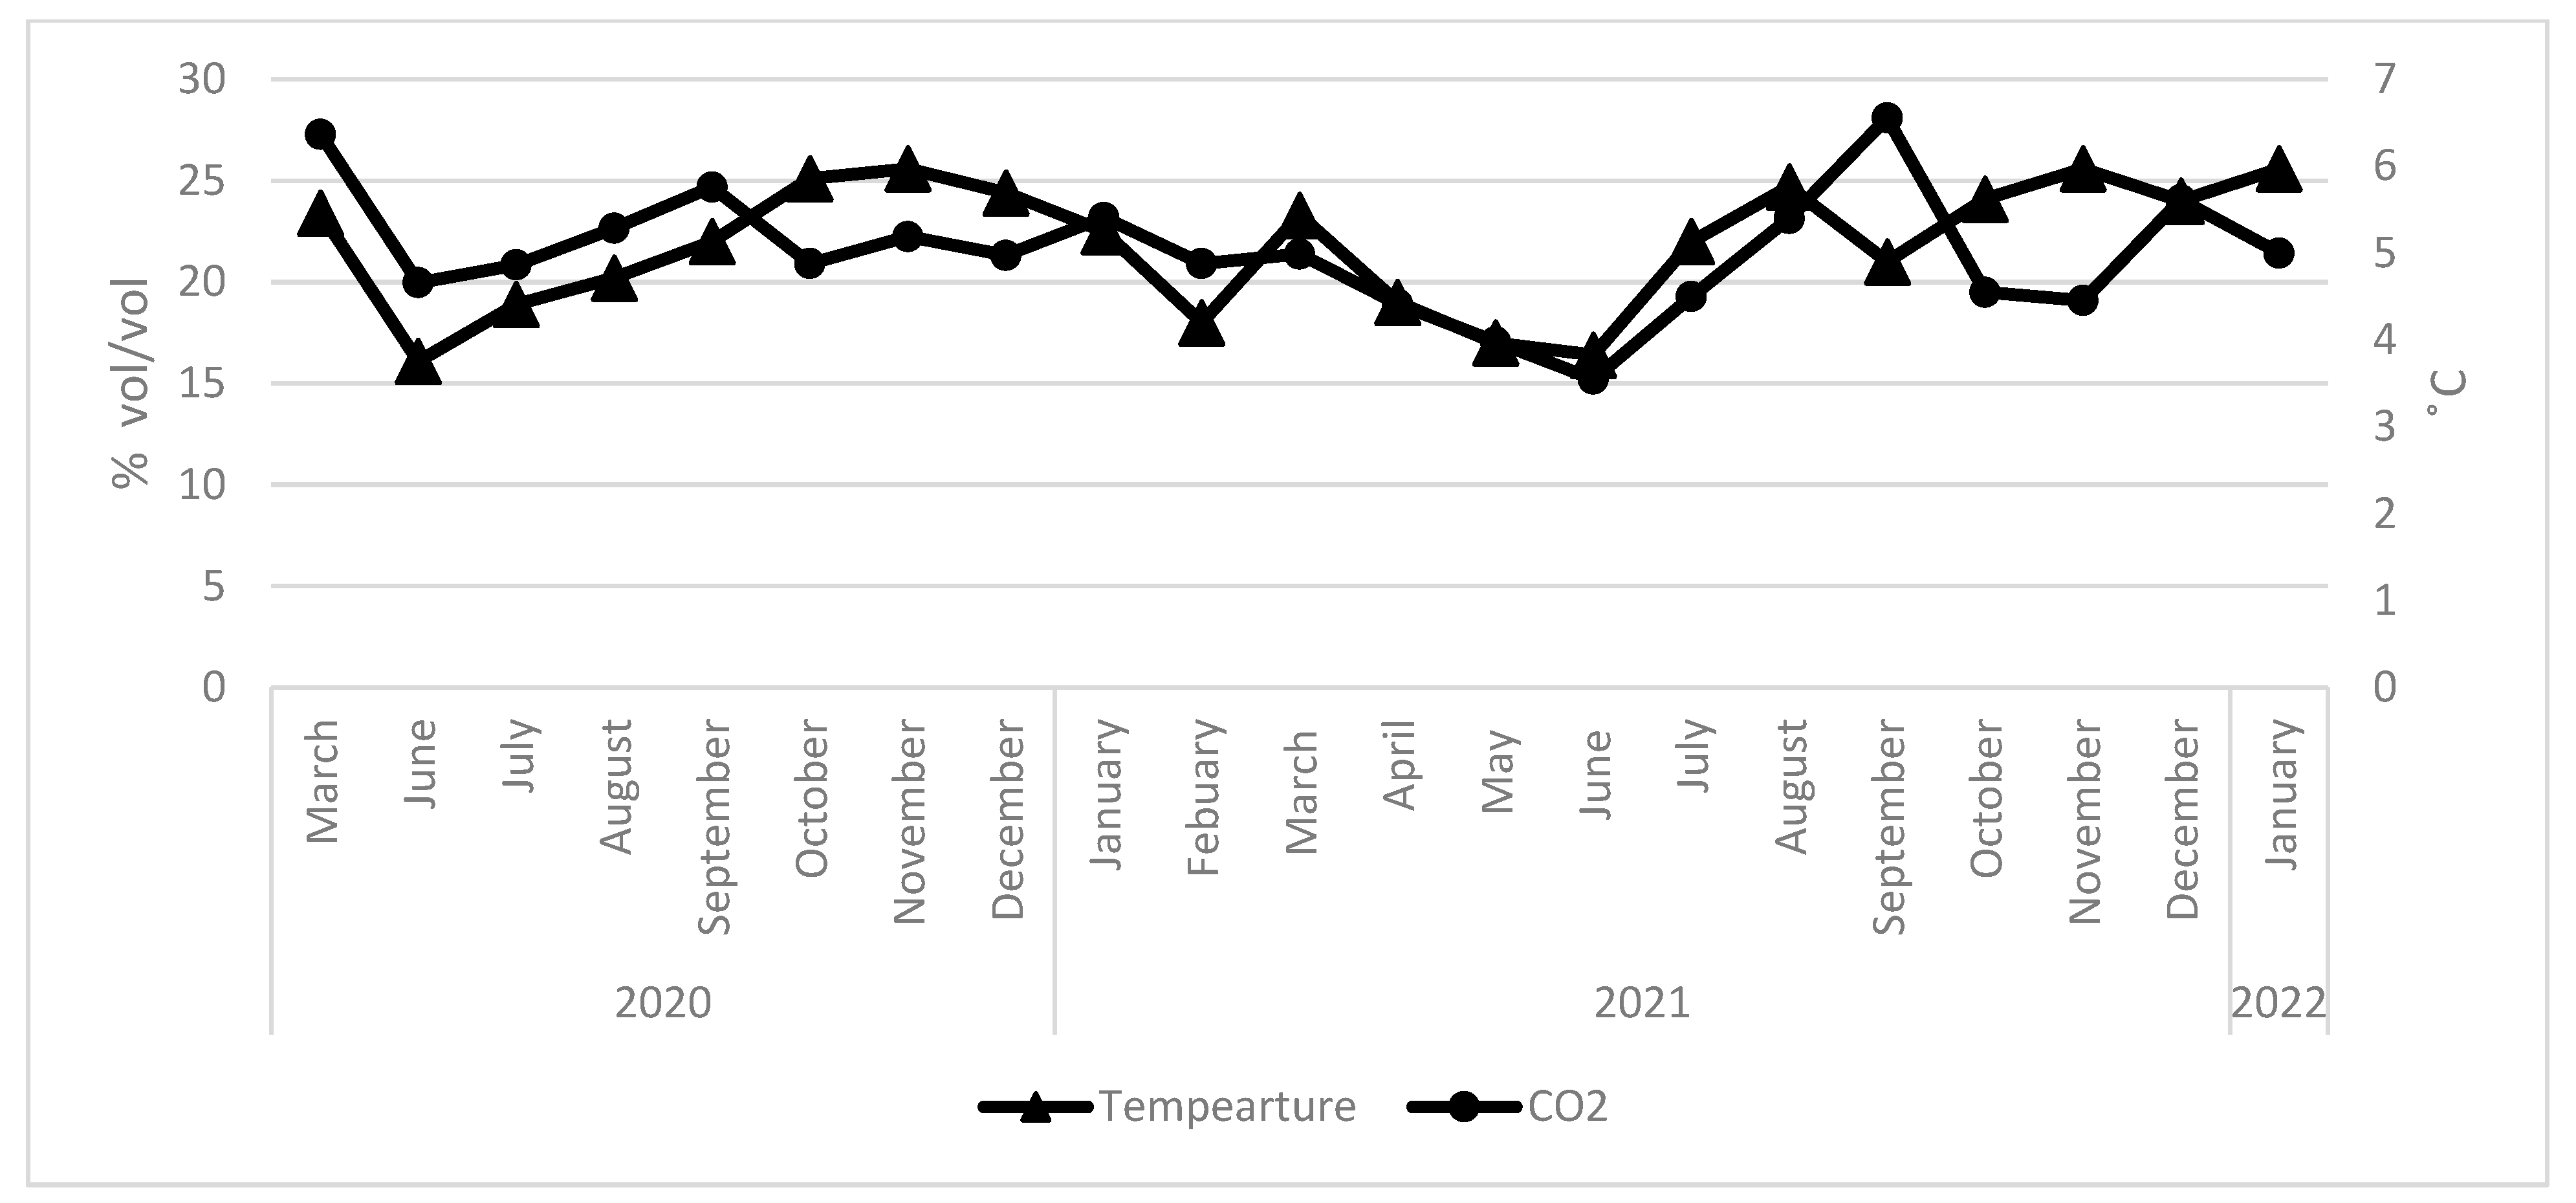
3.5.2. Ambient Temperature
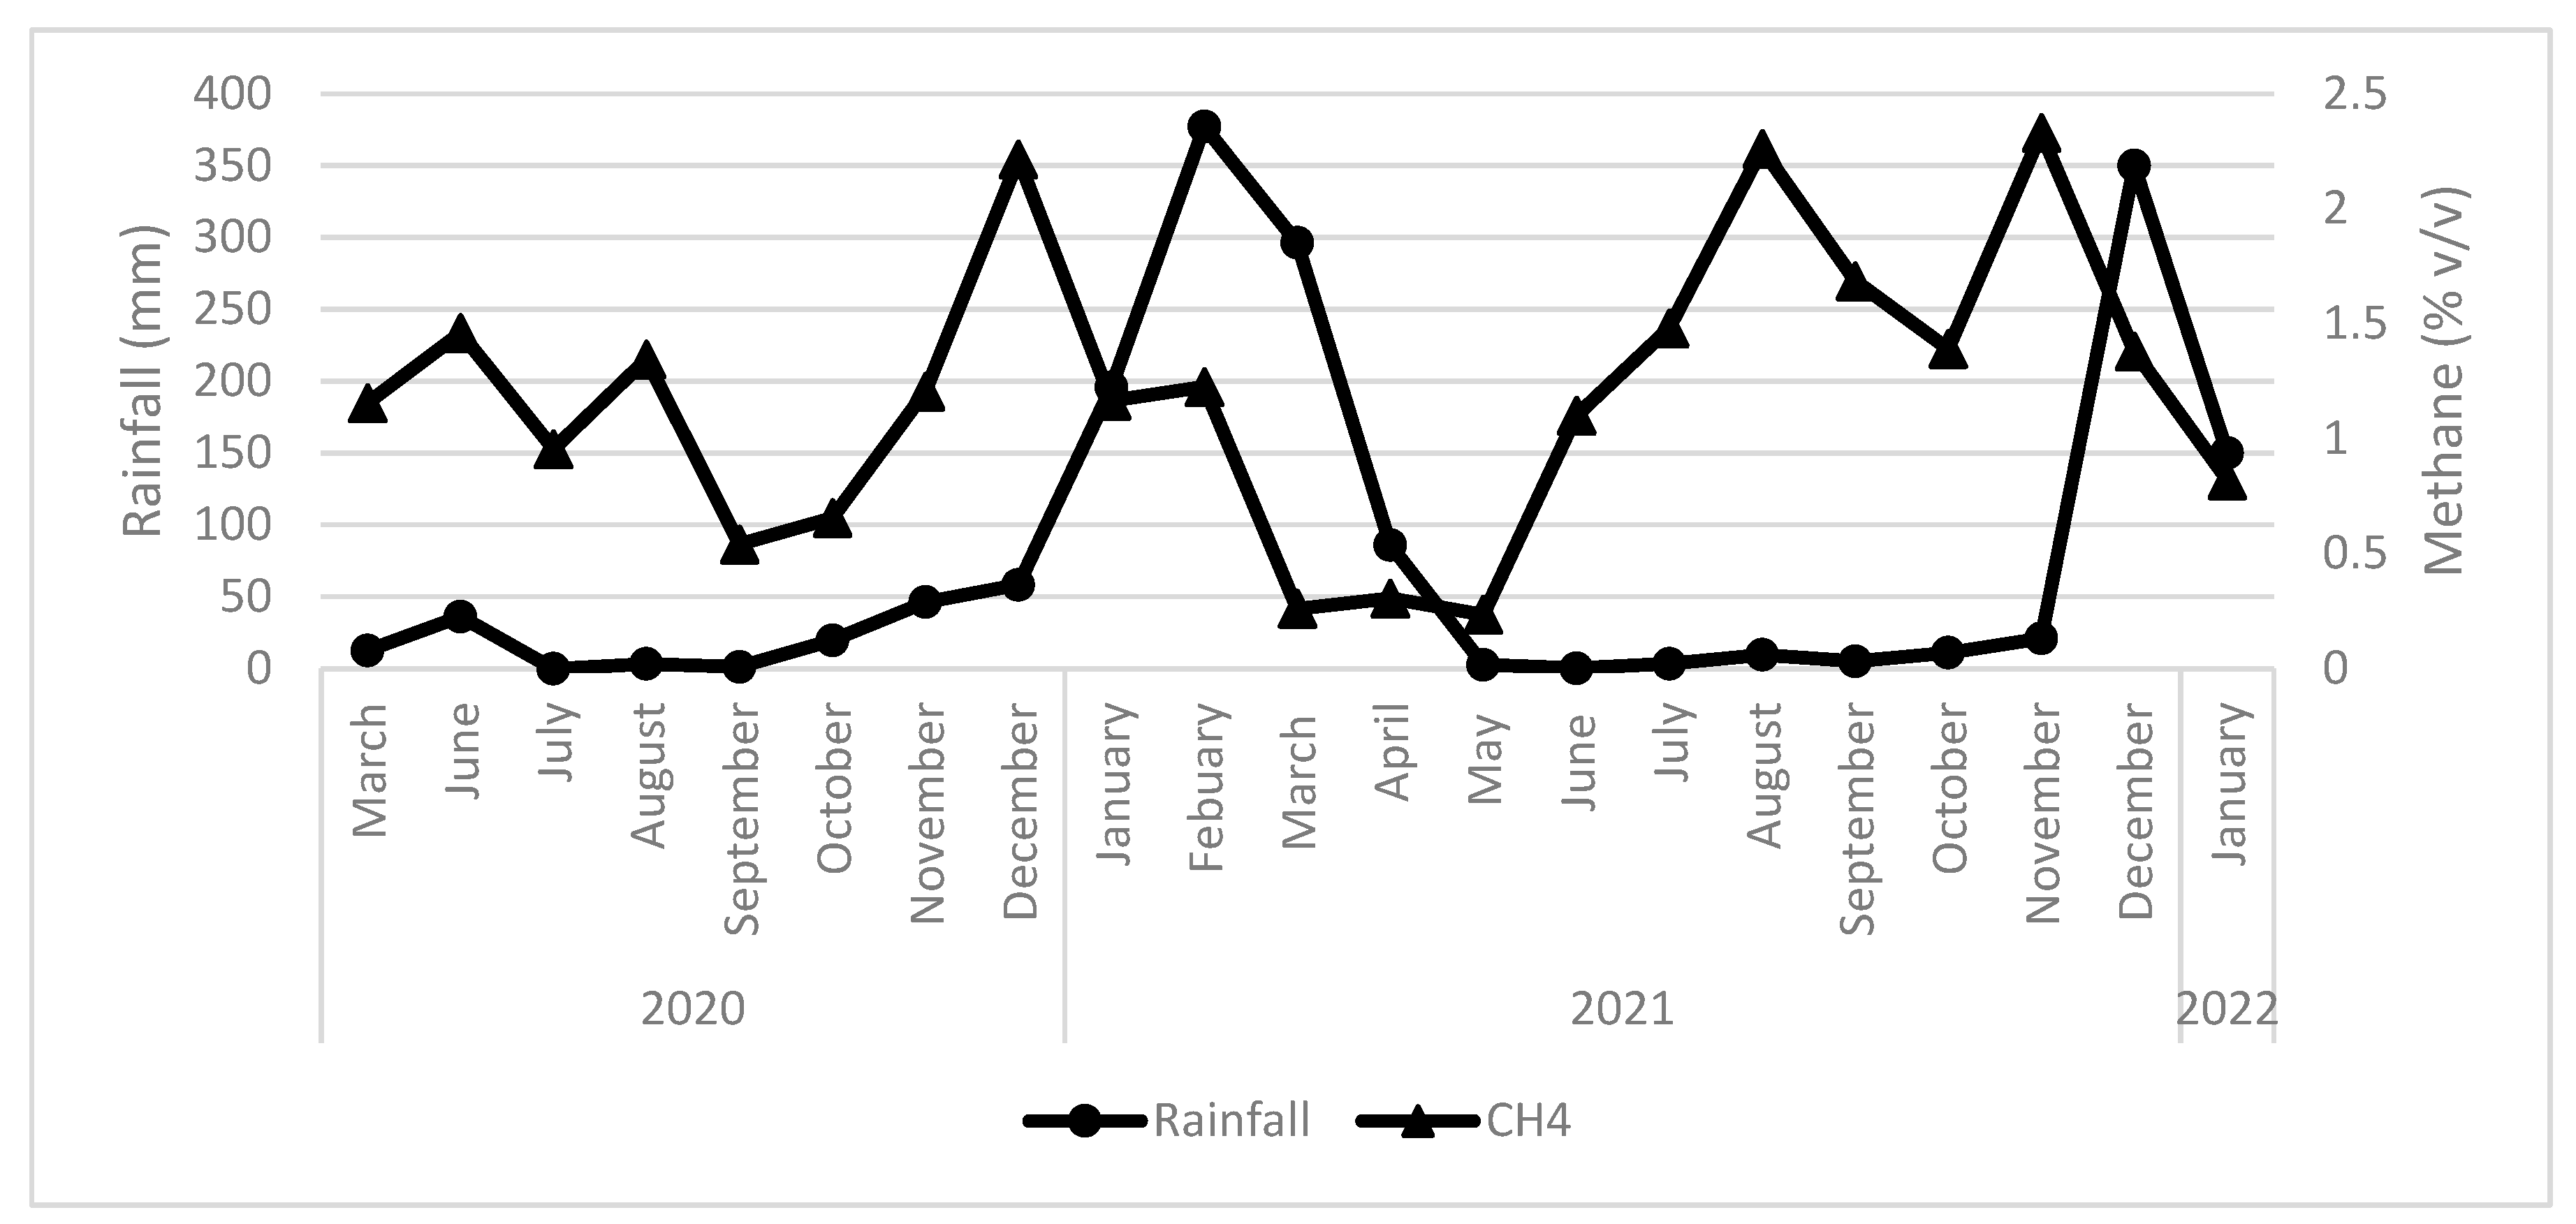
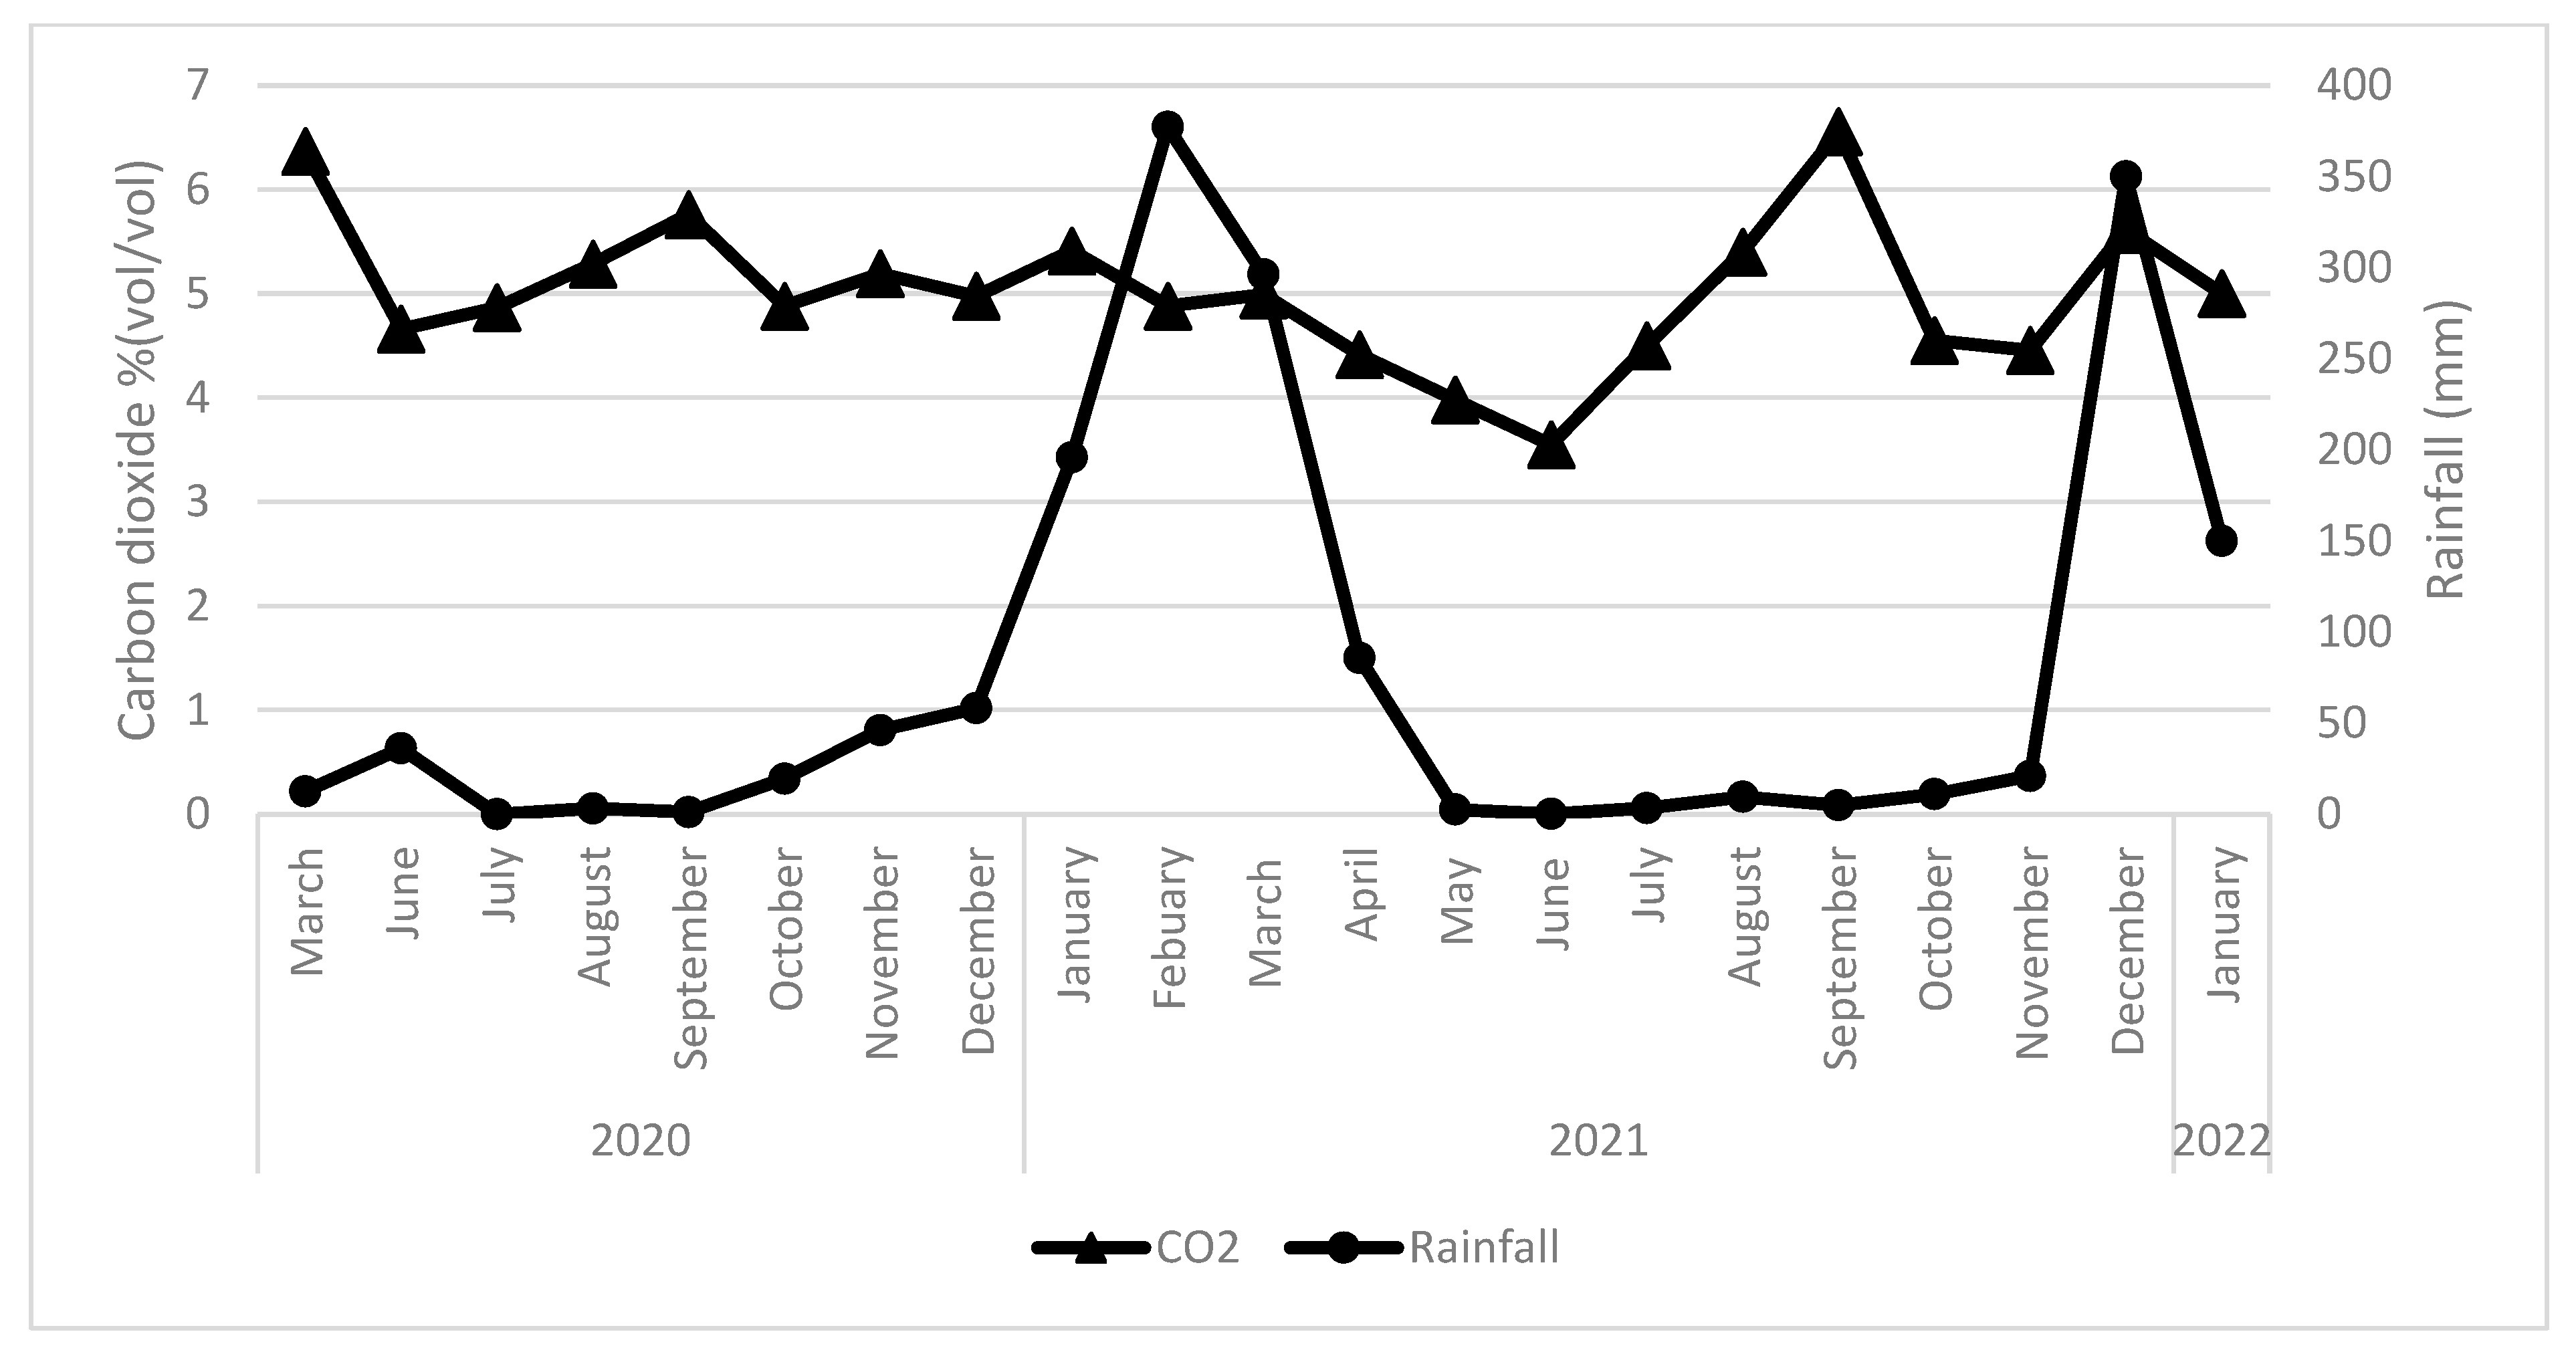
3.5.3. Rainfall
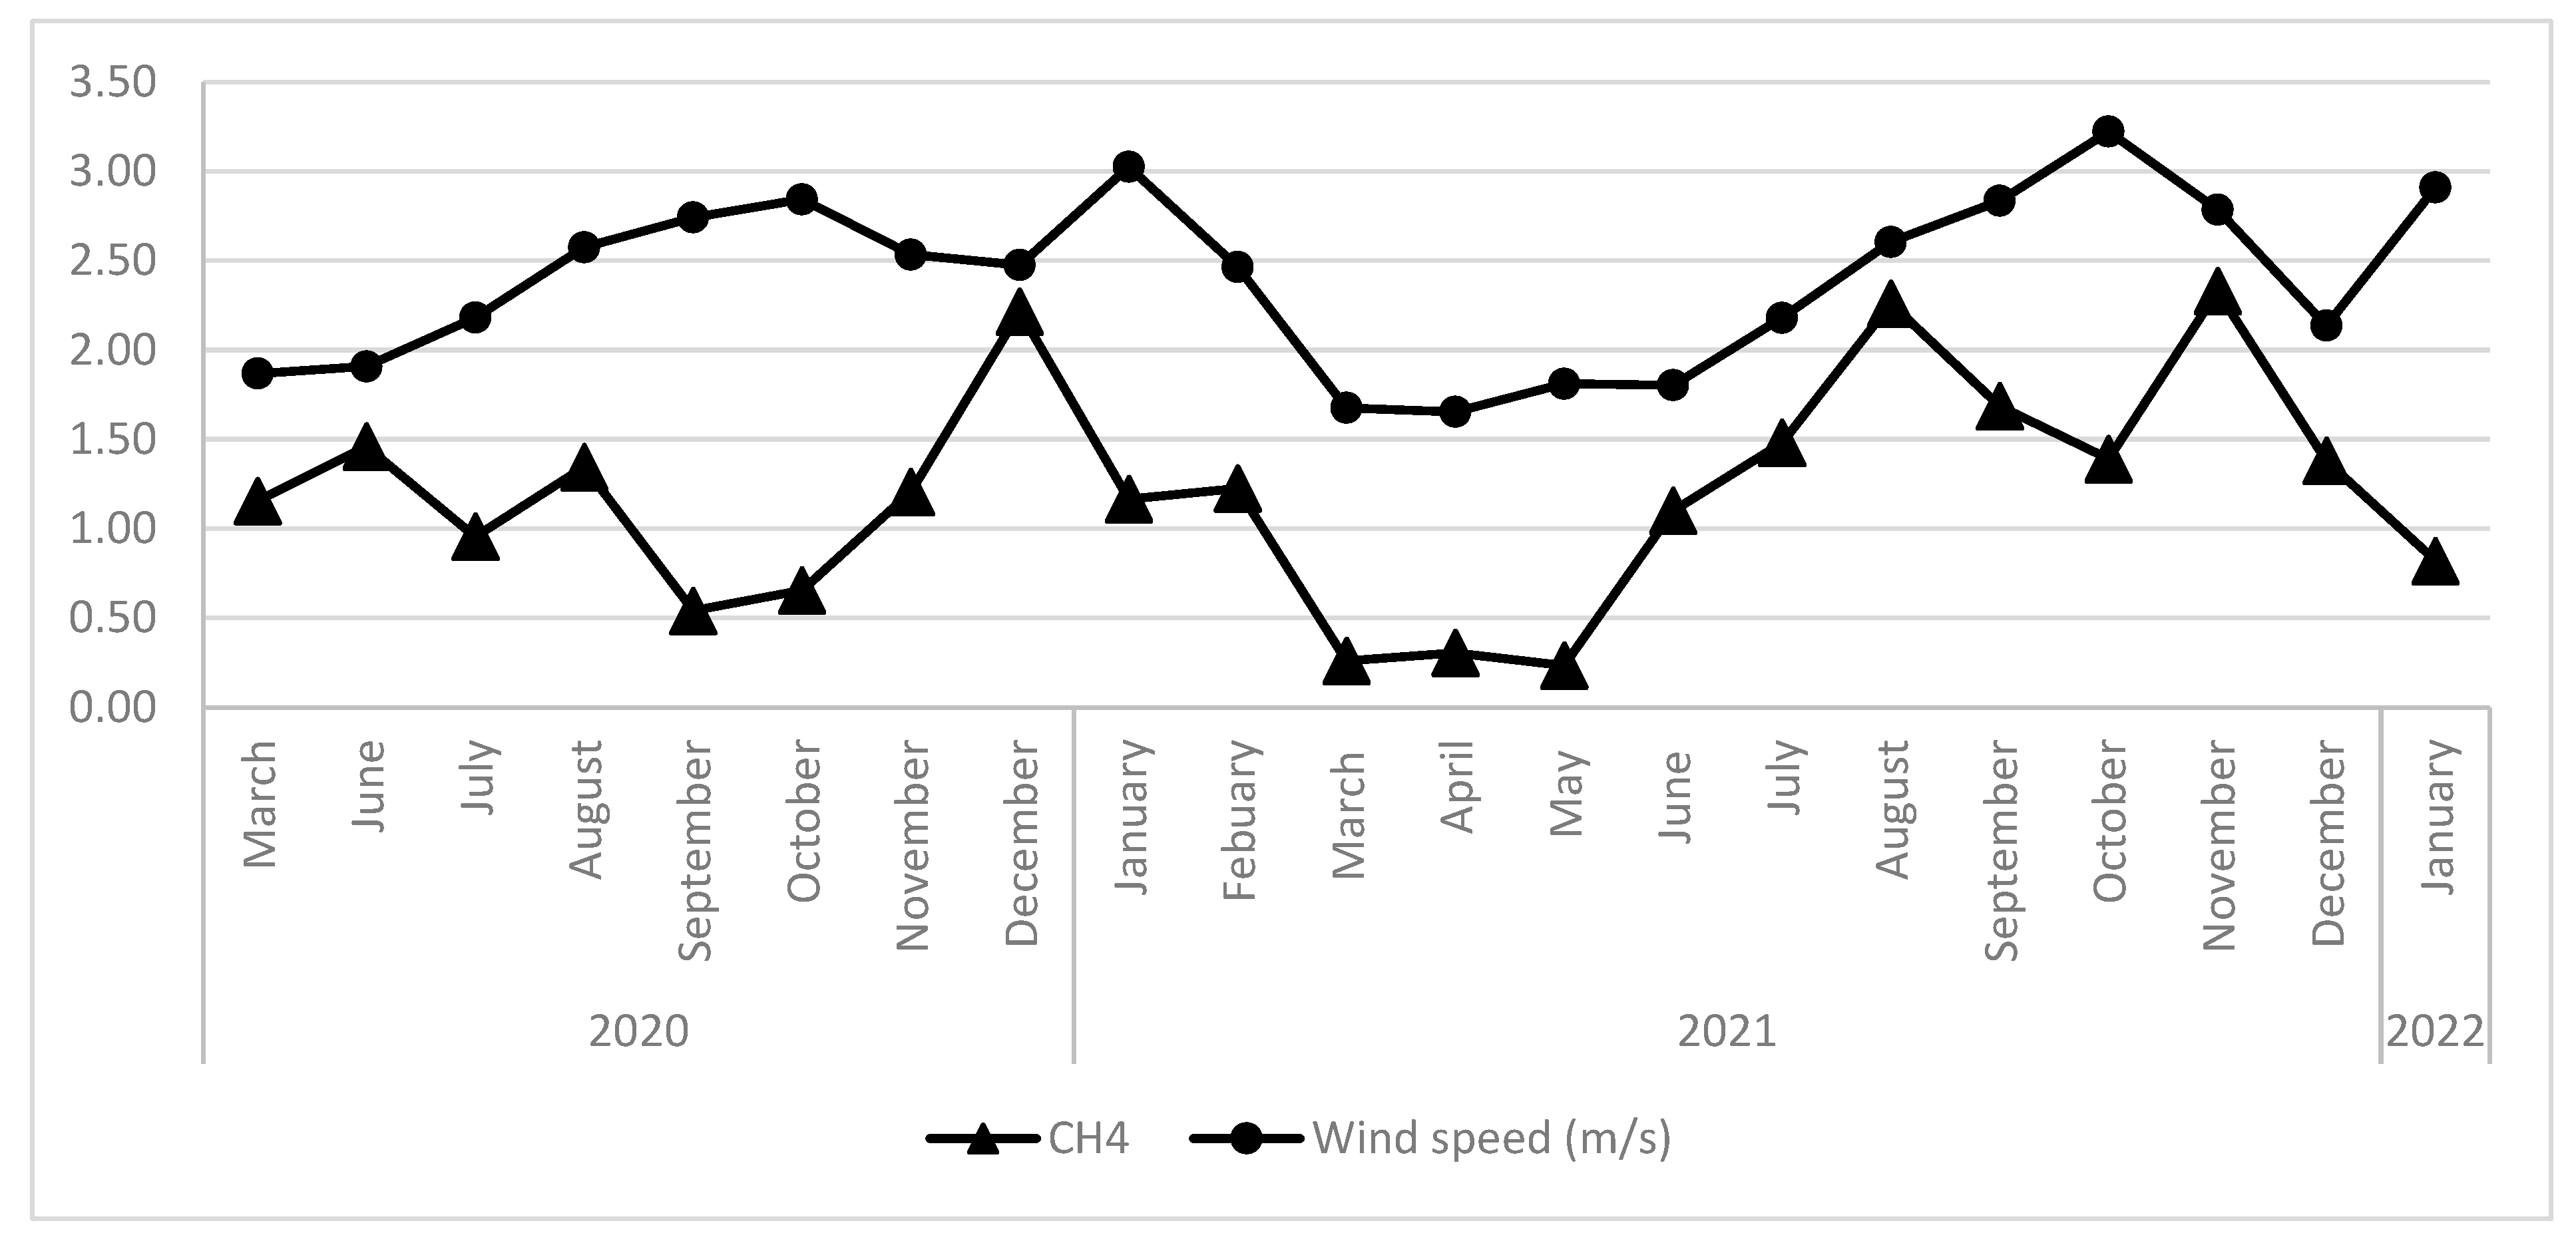
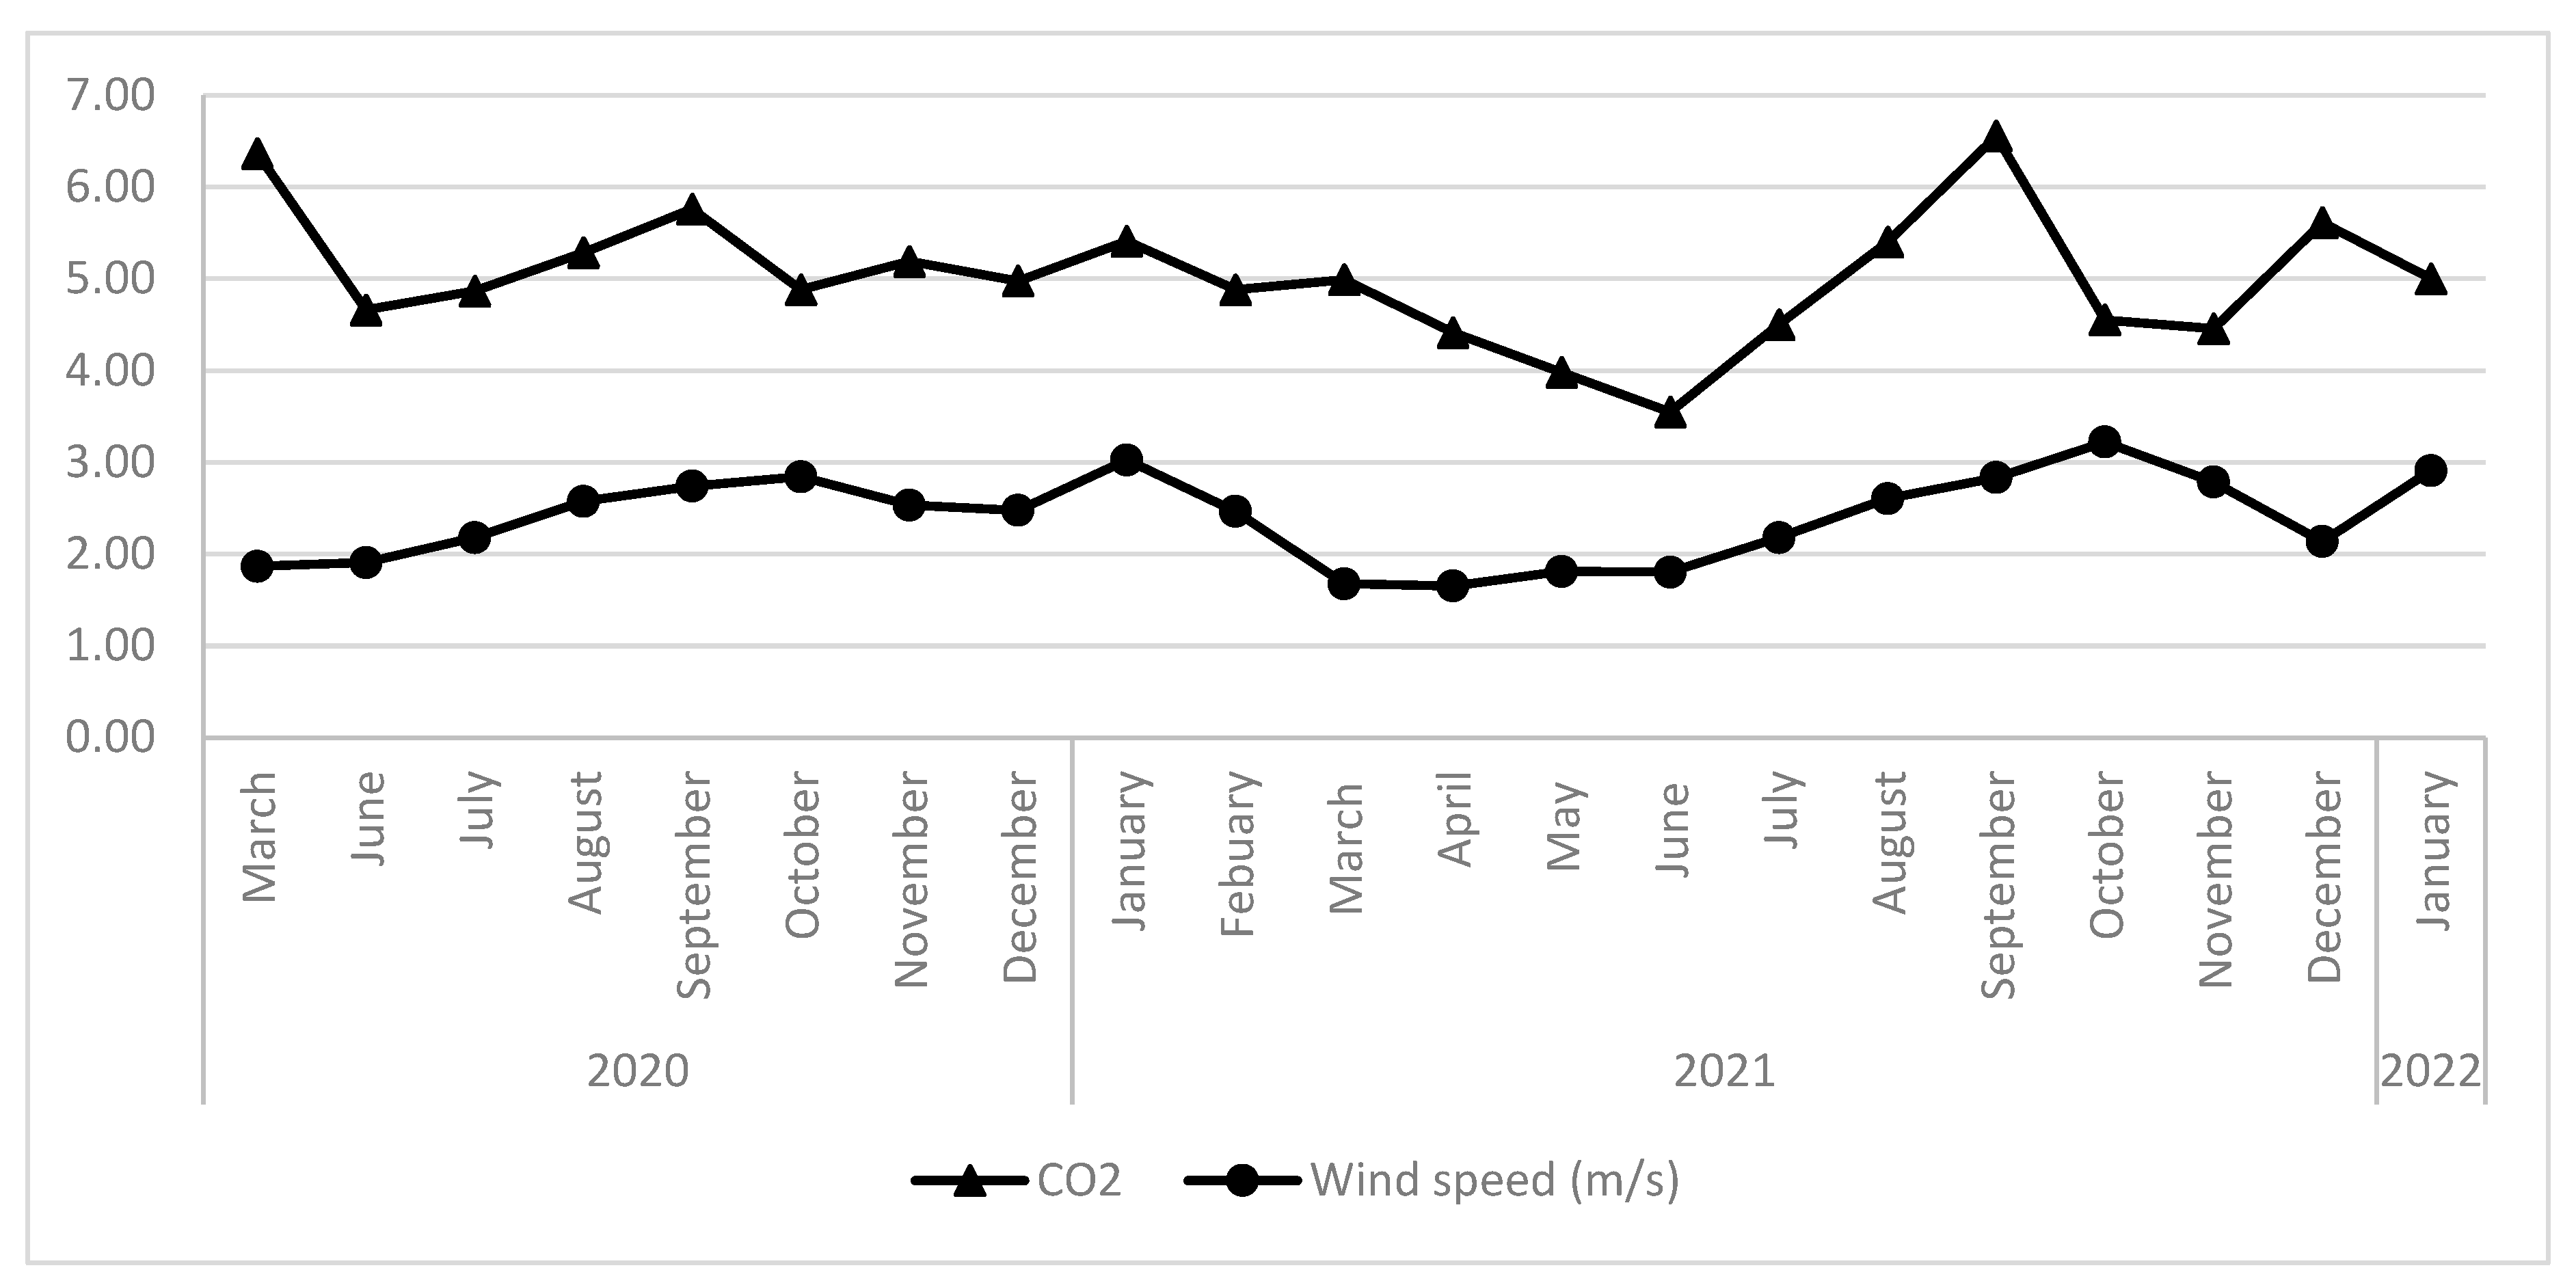
3.5.4. Wind Speed
4. Conclusions
Author Contributions
Funding
Informed Consent Statement
Data Availability Statement
Acknowledgments
Conflicts of Interest
References
- Manheim, D.C.; Yeşiller, N.; Hanson, J.L. Gas Emissions from Municipal Solid Waste Landfills: A Comprehensive Review and Analysis of Global Data. J. Indian Inst. Sci. 2021, 101, 625–657. [Google Scholar] [CrossRef]
- Sibeko, M.A.; Adeniji, A.O.; Okoh, O.O.; Hlangothi, S.P. Trends in the management of waste tyres and recent experimental approaches in the analysis of polycyclic aromatic hydrocarbons (PAHs) from rubber crumbs. Environ. Sci. Pollut. Res. 2020, 27, 43553–43568. [Google Scholar] [CrossRef] [PubMed]
- Sekhohola-Dlamini, L.; Tekere, M. Microbiology of municipal solid waste landfills: A review of microbial dynamics and ecological influences in waste bioprocessing. Biodegradation 2019, 31, 1–21. [Google Scholar] [CrossRef]
- Teng, C.; Zhou, K.; Peng, C.; Chen, W. Characterization and treatment of landfill leachate: A review. Water Res. 2021, 203, 117525. [Google Scholar] [CrossRef] [PubMed]
- Sharma, A.; Ganguly, R.; Gupta, A.K. Impact assessment of leachate pollution potential on groundwater: An indexing method. J. Environ. Eng. 2020, 146, 05019007. [Google Scholar] [CrossRef]
- Njoku, P.O.; Edokpayi, J.N.; Odiyo, J.O. Health and environmental risks of residents living close to a landfill: A case study of Thohoyandou Landfill, Limpopo Province, South Africa. Int. J. Environ. Res. Public Health 2019, 16, 2125. [Google Scholar] [CrossRef] [Green Version]
- Fay, C.; Doherty, A.R.; Beirne, S.; Collins, F.; Foley, C.; Healy, J.; Kiernan, B.M.; Lee, H.; Maher, D.; Orpen, D.; et al. Remote real-time monitoring of subsurface landfill gas migration. Sensors 2011, 11, 6603–6628. [Google Scholar] [CrossRef] [PubMed] [Green Version]
- Agency for Toxic Substances and Disease Registry (ATSDR). Landfill Gas Premier: An Overview of Environmental Health Professionals. 2001. Available online: http://www.atsdr.cdc.gov/hac/landfill/html/intro.html (accessed on 30 August 2022).
- Beirne, S.; Kiernan, B.M.; Fay, C.; Foley, C.; Corcoran, B.; Smeaton, A.F.; Diamond, D. Autonomous greenhouse gas measurement system for analysis of gas migration on landfill sites. In Proceedings of the 2010 IEEE Sensors Applications Symposium (SAS), Limerick, Ireland, 23–25 February 2010; pp. 143–148. [Google Scholar]
- Kiernan, B.M.; Beirne, S.; Fay, C.; Diamond, D. Monitoring of Gas Emissions at Landfill Sites Using Autonomous Gas Sensors; STRIVE; Environmental Protection Agency: Washington, DC, USA, 2010; pp. 1–27. [Google Scholar]
- Wang-Yao, K.; Towprayoon, S.; Chiemchaisri, C.; Gheewala, S.H.; Nopharatana, A. Seasonal variation of landfill methane emissions from seven solid waste disposal sites in central Thailand. In Proceedings of the 2nd Joint International Conference on Sustainable Energy and Environment (SEE 2006), Bangkok, Thailand, 21–23 November 2006; Volume 2123. [Google Scholar]
- Scheutz, C.; Samuelsson, J.; Fredenslund, A.; Kjeldsen, P. Quantification of multiple methane emission sources at landfills using a double tracer technique. Waste Manag. 2011, 31, 1009–1017. [Google Scholar] [CrossRef]
- Park, J.-W.; Shin, H.-C. Surface emission of landfill gas from solid waste landfill. Atmos. Environ. 2001, 35, 3445–3451. [Google Scholar] [CrossRef]
- Fredenslund, A.M.; Scheutz, C.; Kjeldsen, P. Tracer method to measure landfill gas emissions from leachate collection systems. Waste Manag. 2010, 30, 2146–2152. [Google Scholar] [CrossRef]
- Raza, S.T.; Hafeez, S.; Ali, Z.; Nasir, Z.A.; Butt, M.M.; Saleem, I.; Wu, J.; Chen, Z.; Xu, Y. An Assessment of Air Quality within Facilities of Municipal Solid Waste Management (MSWM) Sites in Lahore, Pakistan. Processes 2021, 9, 1604. [Google Scholar] [CrossRef]
- Ezekwe, C.I.; Agbakoba, A.; Igbagara, P.W. Source gas emission and ambient air quality around the eneka co-disposal landfill in Portharcourt, Nigeria. Gas 2016, 1, 2. [Google Scholar]
- Massacci, G. 2.4 Physico-Chemical Characteristics and Toxicology of Landfill Gas Components. In Landfilling of Waste: Biogas; CRC Press: Boca Raton, FL, USA, 2020; p. 73. [Google Scholar]
- Pehme, K.-M.; Orupõld, K.; Kuusemets, V.; Tamm, O.; Jani, Y.; Tamm, T.; Kriipsalu, M. Field study on the efficiency of a methane degradation layer composed of fine fraction soil from landfill mining. Sustainability 2020, 12, 6209. [Google Scholar] [CrossRef]
- Eklund, B. Proposed regulatory framework for evaluating the methane hazard due to vapor intrusion. In Proceedings of the AWMA Vapor Intrusion Conference, Chicago, IL, USA, 29–30 September 2010; pp. 29–30. [Google Scholar]
- Scheutz, C.; Kjeldsen, P. Guidelines for landfill gas emission monitoring using the tracer gas dispersion method. Waste Manag. 2019, 85, 351–360. [Google Scholar] [CrossRef]
- Kiernan, B.M.; Beirne, S.; Fay, C.; Diamond, D. Landfill gas monitoring at borehole wells using an autonomous environmental monitoring system. In Proceedings of the 5th International Conference on Climate Change and Global Warming, Sanur, Indonesia, 24–25 September 2008. [Google Scholar]
- Nsele, S. News24. 2016. Available online: http://www.news24.com/SouthAfrica/News/choking-smoke-shrouds-city-20160809 (accessed on 4 May 2022).
- Nanda, S.; Berruti, F. Municipal solid waste management and landfilling technologies: A review. Environ. Chem. Lett. 2020, 19, 1433–1456. [Google Scholar] [CrossRef]
- Flores-Orozco, A.; Gallistl, J.; Steiner, M.; Brandstätter, C.; Fellner, J. Mapping biogeochemically active zones in landfills with induced polarization imaging: The Heferlbach landfill. Waste Manag. 2020, 107, 121–132. [Google Scholar] [CrossRef]
- Bian, R.; Chen, J.; Li, W.; Sun, Y.; Chai, X.; Wang, H.; Wang, Y.; Zhao, J. Numerical modeling of methane oxidation and emission from landfill cover soil coupling water-heat-gas transfer: Effects of meteorological factors. Process. Saf. Environ. Prot. 2020, 146, 647–655. [Google Scholar] [CrossRef]
- Braker, G.; Schwarz, J.; Conrad, R. Influence of temperature on the composition and activity of denitrifying soil communities. FEMS Microbiol. Ecol. 2010, 73, 134–148. [Google Scholar] [CrossRef]
- Czepiel, P.; Shorter, J.; Mosher, B.; Allwine, E.; McManus, J.; Harriss, R.; Kolb, C.; Lamb, B. The influence of atmospheric pressure on landfill methane emissions. Waste Manag. 2003, 23, 593–598. [Google Scholar] [CrossRef] [PubMed]
- Aghdam, E.F.; Scheutz, C.; Kjeldsen, P. Impact of meteorological parameters on extracted landfill gas composition and flow. Waste Manag. 2019, 87, 905–914. [Google Scholar] [CrossRef] [PubMed] [Green Version]
- Shu, S.; Li, Y.; Sun, Z.; Shi, J. Effect of gas pressure on municipal solid waste landfill slope stability. Waste Manag. Res. 2021, 40, 323–330. [Google Scholar] [CrossRef]
- Vaverková, M.D. Landfill impacts on the environment. Geosciences 2019, 9, 431. [Google Scholar] [CrossRef] [Green Version]
- Njoku, P.O.; Edokpayi, J.N.; Odiyo, J.O. Modeling landfill gas potential and potential energy recovery from Thohoyandou landfill site, South Africa. J. Air Waste Manag. Assoc. 2020, 70, 820–833. [Google Scholar] [CrossRef]
- Njoku, P.O. Estimation of the Emissions of Gases from a Two Landfill Sites Using the LandGEM and Afvalzorg Models: Case Study of the Weltervenden (Polokwane) and Thohoyandou Landfills. Master’s Thesis, University of Venda, Thohoyandou, South Africa, 2018. [Google Scholar]
- Bhailall, S.; Piketh, S.; Smith, N.; Bogner, J. Subsurface gas generation at a landfill in Johannesburg. Clean Air J. 2010, 18, 10–14. [Google Scholar] [CrossRef]
- Monster, J.; Kjeldsen, P.; Scheutz, C. Methodologies for measuring fugitive methane emissions from landfills—A review. Waste Manag. 2019, 87, 835–859. [Google Scholar] [CrossRef]
- Li, R.S.; Zeiss, C. In situ moisture content measurement in MSW landfills with TDR. Environ. Eng. Sci. 2001, 18, 53–66. [Google Scholar] [CrossRef]
- Keenan, S.; Nec, Y.; Huculak, G. Landfill Gas Flow—Effects of Asymmetry. J. Solid Waste Technol. Manag. 2021, 47, 188–203. [Google Scholar] [CrossRef] [PubMed]
- Gollapalli, M.; Kota, S.H. Methane emissions from a landfill in north-east India: Performance of various landfill gas emission models. Environ. Pollut. 2018, 234, 174–180. [Google Scholar] [CrossRef] [PubMed]
- Elmi, A.; Al-Harbi, M.; Yassin, M.F.; Al-Awadhi, M.M. Modeling gaseous emissions and dispersion of two major greenhouse gases from landfill sites in arid hot environment. Environ. Sci. Pollut. Res. 2020, 28, 15424–15434. [Google Scholar] [CrossRef] [PubMed]
- Zhang, C.; Xu, T.; Feng, H.; Chen, S. Greenhouse Gas Emissions from Landfills: A Review and Bibliometric Analysis. Sustainability 2019, 11, 2282. [Google Scholar] [CrossRef] [Green Version]
- Koliopoulos, T.; Mebarek-Oudina, F.; Kouloumbis, P.; Ciarkowska, K.; Antonkiewicz, J. Environmental health landfill management–heat transfer modelling at soil materials for agricultural food protection and sustainability. J. Emerg. Environ. Technol. Health Prot. 2019, 2, 54–70. [Google Scholar]
- Njoku, P.O.; Edokpayi, J.N. Estimation of landfill gas production and potential utilization in a South Africa landfill. J. Air Waste Manag. Assoc. 2022, 73, 1–14. [Google Scholar] [CrossRef]
- Popiţa, G.; Frunzeti, N.; Ionescu, A.; Lazăr, A.L.; Baciu, C.; Popovici, A.; Pop, C.; Faur, V.C.; Proorocu, M. Evaluation of carbon dioxide and methane emission from Cluj-Napoca municipal landfill, Romania. Environ. Eng. Manag. J. 2015, 14, 1389–1398. [Google Scholar]
- Pinheiro, L.T.; Cattanio, J.H.; Imbiriba, B.; Castellon, S.E.M.; Elesbão, S.A.; de Souza Ramos, J.R. Carbon Dioxide and methane flux measurements at a large unsanitary dumping site in the Amazon Region. Braz. J. Environ. Sci. 2019, 54, 13–33. [Google Scholar]
- Xu, L.; Lin, X.; Amen, J.; Welding, K.; McDermitt, D. Impact of changes in barometric pressure on landfill methane emission. Glob. Biogeochem. Cycles 2014, 28, 679–695. [Google Scholar] [CrossRef] [Green Version]
- Rachor, I.M.; Gebert, J.; Gröngröft, A.; Pfeiffer, E.M. Variability of methane emissions from an old landfill over different time-scales. Eur. J. Soil Sci. 2013, 64, 16–26. [Google Scholar] [CrossRef]
- Delgado, M.; López, A.; Esteban, A.L.; Lobo, A. Some findings on the spatial and temporal distribution of methane emissions in landfills. J. Clean. Prod. 2022, 362, 132334. [Google Scholar] [CrossRef]
- Reddy, K.R.; Rai, R.K.; Green, S.J.; Chetri, J.K. Effect of temperature on methane oxidation and community composition in landfill cover soil. J. Ind. Microbiol. Biotechnol. 2019, 46, 1283–1295. [Google Scholar] [CrossRef] [PubMed]
- Schupp, S.; De la Cruz, F.B.; Cheng, Q.; Call, D.F.; Barlaz, M.A. Evaluation of the temperature range for biological activity in landfills experiencing elevated temperatures. ACS EST Eng. 2020, 1, 216–227. [Google Scholar] [CrossRef]
- Gong, H.; Zhou, S.; Chen, Z.; Chen, L. Effect of volatile organic compounds on carbon dioxide adsorption performance via pressure swing adsorption for landfill gas upgrading. Renew. Energy 2018, 135, 811–818. [Google Scholar] [CrossRef]
- Yang, R.; Xu, Z.; Chai, J.; Qin, Y.; Li, Y. Permeability test and slope stability analysis of municipal solid waste in Jiangcungou Landfill, Shaanxi, China. J. Air Waste Manag. Assoc. 2016, 66, 655–662. [Google Scholar] [CrossRef] [Green Version]
- Johari, A.; Ahmed, S.I.; Hashim, H.; Alkali, H.; Ramli, M. Economic and environmental benefits of landfill gas from municipal solid waste in Malaysia. Renew. Sustain. Energy Rev. 2012, 16, 2907–2912. [Google Scholar] [CrossRef]
- Kissas, K.; Ibrom, A.; Kjeldsen, P.; Scheutz, C. Methane emission dynamics from a Danish landfill: The effect of changes in barometric pressure. Waste Manag. 2021, 138, 234–242. [Google Scholar] [CrossRef]
- Xin, D.; Hao, Y.; Shimaoka, T.; Nakayama, H.; Chai, X. Site specific diel methane emission mechanisms in landfills: A field validated process based on vegetation and climate factors. Environ. Pollut. 2016, 218, 673–680. [Google Scholar] [CrossRef]


| Probes | Average CH4 | Average CO2 | Standard Deviation for CH4 | Standard Deviation for CO2 |
|---|---|---|---|---|
| A | 0.56 | 5.14 | 0.31 | 1.3 |
| B | 0.30 | 4.58 | 0.17 | 1.31 |
| C | 0.48 | 3.71 | 1.63 | 1.79 |
| D | 0.26 | 4.56 | 0.21 | 0.5 |
| G | 1.58 | 3.86 | 1.05 | 1.14 |
| H | 0.69 | 3.59 | 2.28 | 1.78 |
| I | 2.30 | 6.47 | 0.2 | 0.81 |
| J | 2.33 | 6.65 | 0.3 | 1.1 |
| K | 1.60 | 6.44 | 0.85 | 2.35 |
| M | 2.56 | 5.96 | 1.77 | 1.37 |
| N | 0.55 | 5.92 | 0.17 | 1.19 |
| O | 0.55 | 6.68 | 0.45 | 1.44 |
| P | 0.40 | 6.21 | 0.23 | 1.38 |
| Q | 0.60 | 6.08 | 0.38 | 2.27 |
| R | 0.50 | 6.74 | 0.25 | 2.47 |
| Pearson Correlation | p-Value | |
|---|---|---|
| Winter 2020 | −0.73 | p < 0.001 |
| Summer 2020 | −0.07 | p < 0.001 |
| Winter 2021 | 0.64 | p < 0.001 |
| Summer 2021 | 0.60 | p < 0.04 |
| Meteorology | CH4 | CO2 | ||
|---|---|---|---|---|
| Pearson Correlation | p-Value | Pearson Correlation | p-Value | |
| Temperature | 0.31 | p < 0.001 | 0.39 | p < 0.001 |
| Rainfall | −0.17 | p < 0.01 | 0.10 | p < 0.001 |
| Wind speed | 0.39 | p < 0.001 | 0.10 | p < 0.001 |
| Barometric pressure | −0.10 | p < 0.001 | −0.25 | p < 0.001 |
| CO2 | 0.18 | p < 0.001 | ||
| Hypothesis | R Squared | Adjusted R Squared | Mean Square | F | p-Value |
|---|---|---|---|---|---|
| H1 | 0.098 | 0.051 | 0.39 | 2.067 | 0.17 |
| H2 | 0.029 | −0.023 | 0.10 | 0.559 | 0.46 |
| H3 | 0.15 | 0.11 | 1.122 | 3.36 | 0.082 |
| H4 | 0.011 | −0.042 | 0.079 | 0.203 | 0.66 |
| Hypothesis | R Squared | Adjusted R Squared | Mean Square | F | p-Value |
|---|---|---|---|---|---|
| H1 | 0.15 | 0.11 | 1.52 | 3.37 | 0.82 |
| H2 | 0.01 | −0.042 | 0.10 | 0.20 | 0.66 |
| H3 | 0.091 | 0.043 | 0.92 | 1.90 | 0.18 |
| H4 | 0.059 | 0.009 | 0.59 | 1.18 | 0.29 |
Disclaimer/Publisher’s Note: The statements, opinions and data contained in all publications are solely those of the individual author(s) and contributor(s) and not of MDPI and/or the editor(s). MDPI and/or the editor(s) disclaim responsibility for any injury to people or property resulting from any ideas, methods, instructions or products referred to in the content. |
© 2023 by the authors. Licensee MDPI, Basel, Switzerland. This article is an open access article distributed under the terms and conditions of the Creative Commons Attribution (CC BY) license (https://creativecommons.org/licenses/by/4.0/).
Share and Cite
Njoku, P.O.; Piketh, S.; Makungo, R.; Edokpayi, J.N. Monitoring of Subsurface Emissions and the Influence of Meteorological Factors on Landfill Gas Emissions: A Case Study of a South African Landfill. Sustainability 2023, 15, 5989. https://doi.org/10.3390/su15075989
Njoku PO, Piketh S, Makungo R, Edokpayi JN. Monitoring of Subsurface Emissions and the Influence of Meteorological Factors on Landfill Gas Emissions: A Case Study of a South African Landfill. Sustainability. 2023; 15(7):5989. https://doi.org/10.3390/su15075989
Chicago/Turabian StyleNjoku, Prince Obinna, Stuart Piketh, Rachel Makungo, and Joshua Nosa Edokpayi. 2023. "Monitoring of Subsurface Emissions and the Influence of Meteorological Factors on Landfill Gas Emissions: A Case Study of a South African Landfill" Sustainability 15, no. 7: 5989. https://doi.org/10.3390/su15075989