Article

Construction and Optimization of an Ecological Network in the Comprehensive Land Consolidation Project of a Small Rural Town in Southeast China

1
Department of Land Management, School of Public Affairs, Zhejiang University, Hangzhou 310058, China
2
Land Academy for National Development, Zhejiang University, Hangzhou 310058, China
*
Author to whom correspondence should be addressed.
Sustainability 2023, 15(7), 5984; https://doi.org/10.3390/su15075984
Submission received: 7 February 2023 / Revised: 26 March 2023 / Accepted: 28 March 2023 / Published: 30 March 2023
(This article belongs to the Special Issue Agricultural Landscape Stability and Sustainable Land Management)

Abstract

:
In recent years, China has put forward comprehensive land consolidation projects to solve problems in rural areas, such as cultivated land fragmentation, scattered spatial pattern of construction land and ecological environment pollution, and boost the rural revitalization strategy. Constructing ecological networks is important for maintaining ecological security. This study built an ecological network using morphological spatial pattern analysis (MSPA), spatial principal component analysis (SPCA) method and minimum cumulative resistance model (MCR) models to analyze the spatial and temporal characteristics and ecological security pattern. Finally, it was optimized by analyzing ecological network indices and using two methods of adding additional ecological sources and stepping stones. The results show that ecological sources and ecological corridors for three phases are located in the central and northern parts with an uneven distribution. In fact, adding new ecological sources is more efficient in balancing the ecological pattern of a study area. The ecological network indices α, β, γ and C values increased by 15.3%, 8.4%, 8.5% and 3.3%, respectively. Constructing and optimizing an ecological network is expected to provide scientific basis for small-scale landscape design, provide theoretical reference for spatial pattern optimization of comprehensive land consolidation projects and coordination of regional development and ecological protection.

1. Introduction

Since China’s reform and opening up, the rapid urbanization process has led to a continuous expansion of the urban fringe, with a large amount of agricultural and ecological land being continuously squeezed out, natural habitats disappearing [1]. The Chinese government has carried out relevant land consolidation activities for a while already, from the early period of only focusing on the increase in cultivated land area, to the quantity and quality of farmland, and then to propose to protect the trinity of quantity, quality, and the ecosystem of farmland [2,3]. China’s land consolidation has played an important role. In recent decades, with the entry of China into a new phase of high-quality development, the Chinese government has put forward major national development strategies, such as the ecological civilization construction and rural revitalization strategy, and in line with the original land consolidation, has proposed comprehensive land consolidation [4,5]. Comprehensive land consolidation projects require the integration of all elements, including land, capital, livelihood, ecology and industrial benefits [6], to optimize the spatial pattern of production, living, and ecology in rural areas, to increase the area of farmland and the intensive and economical use of land, and to improve the rural habitat. The main contents of comprehensive land consolidation include agricultural land consolidation, rural built-up land consolidation and rural ecological restoration. There are many studies on agricultural land consolidation and built-up land consolidation [7,8]. There are fewer studies on ecological restoration and conservation in the countryside, and in particular, optimization of ecological security patterns in rural areas. Building an ecological network to improve the connectivity of a comprehensive land consolidation area is of great significance to enhance rural ecological security and balance the ecological pattern of the countryside. However, comprehensive land consolidation projects require each project area to add 5% new farmland, and the new farmland index can be used for construction land index transfer, making the local government gain a large amount of revenue [9,10]. Some local governments often adopt the practice of reclaiming some scattered settlements for construction land or reclaiming parkland, forest land and grassland as farmland in order to pursue the maximum benefit of capital [11]. The conflicting objectives of economic income and ecological network protection often lead to the formation of a large scale of farmland and the reduction of biodiversity in practice. Therefore, it is important to explore how to design the landscape ecological pattern of a comprehensive land consolidation project so that its ecological environment is protected with minimal loss of economic benefits.
By increasing the landscape connectivity to re-establish the ecological connectivity of landscape components and strengthen the construction of networked landscape structures, it becomes inevitable to optimize the overall service function of the landscape and maintain regional ecological security. Ecological networks, according to Charles (1990), are “open spaces that connect parks, nature reserves, cultural landscapes, or historic sites and their communities” [12]. From the standpoint of biological conservation, Bennett et al. (2006) argue that ecological networks are continuous regional aggregations of adjacent natural landscape elements that have a significant impact on the survival and reproduction of organisms and must be protected by humans [13]. An ecological network is defined in landscape ecology as an open space that connects ecological patches in the landscape via ecological corridors to form an organic and complete network. The system is used to conserve ecological diversity and maintain the landscape’s integrity in order to ensure the landscape’s multiple ecological, economic, social, cultural, and aesthetic functions [14,15]. Although scholars’ definitions of ecological networks differ, they all emphasize their integrity, connectivity, and ecological service functions.
By connecting high-quality habitats in structure and function, regional-scale ecological networks maintain the stability of the ecological security pattern [16,17,18]. A stable ecological network not only promotes biodiversity but also provides coordinated economic and ecological development [19,20]. One of the current research hotspots in the context of landscape fragmentation and habitat loss is the construction of ecological networks through landscape connectivity to ensure the ecological security of areas [21,22,23,24,25]. The ecological network is composed of ecological source and ecological corridor. The ecological source is the high-quality human settlement environment, and the ecological corridor is the path connecting the ecological source. The ecological corridor serves many purposes, including transportation and communication, pollution filtering, wind and sand control, and flood regulation. They have the ability to connect fragmented ecological patches and make the urban ecological network system highly connected, both in the landscape and within the city [26]. The development and optimization of ecological networks can significantly improve the service function of regional natural ecosystems and is an important step toward achieving regional sustainable development. It will not only improve biodiversity, aesthetics, and cultural features, but it will also play an important role in the development of sustainable cities [27].
In recent years, landscape connectivity studies have also received widespread attention from scholars [28,29], and landscape index methods [30], morphological spatial pattern analysis (MSPA) [31,32], circuit theory [33], graph theory methods, and minimum cumulative resistance models (MCR) [34] are common methods for constructing connectivity models. Least cost path (LCP) is a commonly used method in connectivity analysis [35]. This method assumes that species’ dispersal abilities are dependent on landscape matrix characteristics that facilitate or hinder movement between patches [36]. The shortest distance between habitat patches with the least amount of obstruction is determined using least cost paths. However, because the results represent only a line between two points and not a realistic corridor, they are of limited use for conservation efforts [37]. Researchers have increasingly concentrated on least cost corridors, which represent a cumulative cost gradient, making them more similar to functional areas that connect habitats and thus more realistic in terms of conservation objectives [38].
Graph theory is also an approach in connectivity analysis. Graph theory uses a topological approach to identify patches, corridors, and matrices in a landscape mosaic into nodes, connections and ecological flow relationships between them, reflecting the complex network structure of ecosystems in a simple and intuitive graphical way. The landscape is translated into a graph theory diagram consisting of habitat patches (nodes) that are more or less connected by a network, with the links representing individual dispersal or flow through the landscape [39]. Graph theory is useful because it aids in determining landscape connectivity [40] and the contribution of each individual patch [41]. There is a direct relationship between graph theory and the index of integration of connectivity (IIC) and the probability of connectivity (PC). The graph theory-based indices clarify the relative connectivity between the optimal habitat area for the focal species and all patches that comprise the entire habitat area, and can be used to prioritize protected areas in order to identify important patch networks for general landscape connectivity, to analyze the impact of individual patch loss and the selection of individual patches that may be connected to corridors, and to assess newly established landscape structures. These metrics have been used to identify the effects of dispersal on focal species and other ecological flows, as well as to assess landscape connectivity in urban green spaces [42,43]. The MSPA identifies landscape patterns by using image-based morphological classification, which has been used in landscape ecology to identify internal and external fragments [44] as well as connecting features of such corridors [45]. The habitat effectiveness index, for instance, completes MSPA [44]. This approach is useful for preserving biodiversity and managing areas, as it contributes to the development of standards for the assessment of ecological design, landscape planning, and biological conservation [46]. In territorial space planning and land management, landscape connectivity is important for conserving biodiversity, maintaining ecosystem stability and integrity, and building ecological security patterns in the landscape, and there is a growing consensus that restoring landscape connectivity not only mitigates landscape fragmentation caused by urbanization and protects the ecological integrity of the region, but is also essential for curbing global climate change [47].
Most of the existing research on landscape connectivity is concerned with the construction and optimization of regional ecological networks [48,49]. However, most existing studies use municipal boundaries or complete geographic units as the study area, using data at large and medium scales. At such scales, the presence of small ecological sources or stepping stones can easily be overlooked, and landscape connectivity cannot be calculated accurately. By selecting a small-scale study area, the impact of stepping stones on the functional connectivity of the study area can be studied in a more detailed way. Furthermore, for small-scale rural landscapes, and as semi-natural ecosystems, it is necessary to take into account not only the disturbing factors of human activity, but also the natural background of the area, such as slope and altitude, which affect geological hazards.
Comprehensive land consolidation is widely promoted in Zhejiang Province, which is advanced and representative compared to other regions in China, and has formed a more mature theoretical system and practical experience. As a traditional agricultural town, the problem of resource depletion and lack of vitality for development is representative of Xiepu Town located in Ningbo City, Zhejiang Province. Xiepu Town fully reflects the development bottlenecks and ecological problems faced by traditional agricultural towns in China in the context of rapid urbanization. At the same time, the study of a typical area can reflect common problems in the existing model of the comprehensive land consolidation project, providing a realistic basis for landscape planning and optimization strategies for comprehensive land consolidation in China. In general, this study focuses on how to optimize the ecological security pattern of comprehensive land consolidation projects under the win–win situation of economy and environment, and provides theories and methods for rural ecological restoration and village-scale landscape planning. The main research objectives are as follows: (1) build comprehensive resistance surface through SPCA and construct the ecological network based on MSPA and MCR model to evaluate ecological security patterns in rural areas; (2) comprehensively analyzed the temporal and spatial characteristics of the ecological network of the study area and existing problems in the comprehensive land consolidation project; (3) build an optimization mechanism of ecological networks for the comprehensive land consolidation project to provide a scientific basis for small-scale landscape design.

2. Materials and Methods

2.1. Study Area

The study area is located in Xiepu Town, Zhenhai District, Ningbo City, Zhejiang Province, at the eastern end of the Ning Shao Plain (121°33′ E to 121°40′ E, 29°59′ N to 30°04′ N). The research area covers Yanshan village, Juedu village and part of Yu Yan village, with the village boundary and Cihai North Road as the boundary, with a total area of 767.30 hm2. The study area is shown in Figure 1. The study area has a subtropical monsoon climate with long hours of light and abundant rainfall, which provides excellent conditions for agricultural production. Due to its coastal location, it is susceptible to Pacific typhoons in summer. The average annual temperature is 16.3 °C, the average annual sunshine duration is 1944 h, the sunshine rate is 44%, and the average annual precipitation is 1350 mm. The overall topography of the study area is high in the north and low in the south, with the maximum elevation of the low ridge at Yu Yan village on the north side being 142 m. The central part is a large water network plain area, accounting for more than 80% of the total area of the study area. Its ground elevation is about 2 m, and the terrain is flat. Ecological hills, such as Xiaonan Hill and Xiaoling Mountain, are situated around the water system in the central part, at an elevation of about 2–83 m.
The study area includes 17 natural villages, including Tunshan, Jinzhang and Guishan, with a total of 1542 households and a total population of 3736 by the end of 2020. Industries in Xiepu Town are dominated by traditional agriculture and manufacturing, with the tertiary sector being less developed. The total industrial output value of the town above designated size in 2021 totaled CNY 7.733 billion, an increase of 37.8%, respectively, compared to the same period last year. The town’s industrial and agricultural output value in 2021 totaled CNY 8 billion, and the per capita disposable income of farmers rose to CNY 36,630, an increase of 18% and 49%, respectively, compared to 2016.
The comprehensive land consolidation project in the study area is carried out in three aspects: farmland consolidation, village consolidation and ecological restoration. Firstly, farmland, as the key land use type in the research area, is the core resource for agricultural development, accounting for 39.78% of the total area of the study area. However, most of the farmland is in between woodland, gardens and industrial land, and the level of aggregation of farmland is low, with farmers operating on a scattered basis, and there is not yet a mature model of transfer operation, which restricts large-scale agricultural production. Therefore, to meet the needs of developing special agriculture and solving existing problems, the comprehensive land consolidation focuses on the goals of food security, economic security, ecological security and social stability, starting from the spatial pattern of farmland, to improve the service function of farmland ecosystem. Secondly, the land use efficiency of the study area is low and the fragmentation of construction land is serious, with a total area of 55 hm2 of industrial land and a large amount of inefficient construction land. Large-scale factories are basically located around rural settlements, so the demolition and relocation of rural residences and the redistribution of industrial land is undoubtedly the key to village consolidation. Finally, the pressure of ecological environmental protection restoration in Xiepu Town mainly comes from rivers and abandoned mines. The river ecosystem in the town is fragile, with a low self-purification capacity, and is affected by industrial and agricultural production and the daily lives of residents. Under the current spatial layout, the ecological restoration of the river is not enough to solve the river pollution problem. On the other hand, the rapid economic development of Xiepu Town, which relied on mineral resources in its early years, has also caused irreparable damage to the ecological environment. Mining activities have gradually reduced the pH and fertility of the soil, decreasing the soil’s carrying capacity and quality, resulting in soil erosion, degradation of natural habitats, reduction of biodiversity and destruction of the ecosystem. In the context of ecological civilization, the transition to the development of a green economy needs to be based on improving agricultural infrastructure, re-planning the layout of industrial land and rural residential bases, and carrying out comprehensive improvement of the living environment.

2.2. Data

The data include: (1) Land use and land cover of the study area in 2013, 2017 and 2021 are obtained from the department of natural resources management. (2) The 30 m × 30 m resolution digital elevation model is derived from the geospatial data cloud (http://www.gscloud.cn, accessed on 11 October 2022). (3) Data on industrial output value, total industrial and agricultural output value, and disposable income of farmers above the scale are obtained from the statistical yearbook of Zhenhai District. (4) The planning objectives and planning paths related to the comprehensive land consolidation project and the current situation of the research area are obtained by the village committee and the engineering design team. (5) The road data are downloaded from the Open Street map.

2.3. Methods

According to the actual research needs of the study area, the land cover in 2013, 2017 and 2021 was divided into seven landscape types: farmland, woodland, garden, grass, water, built-up land, and unused land. At present, the “identify ecological sources—construct resistance surfaces—extract ecological corridors” model is the most widely used method to evaluate landscape connectivity and construct ecological networks. In this study, the ecological network was constructed in four steps and the existing ecological network was optimized (Figure 2). The first step is to identify ecological sources through MSPA and landscape connectivity analysis; the second step is to establish resistance surfaces using the SPCA method; the third step is to extract potential ecological networks using the MCR model and evaluate them using the network analysis method; fourthly, the ecological network was optimized by building stepping stones.

2.3.1. Identification of Ecological Sources

The theoretical basis of ecological sources is the ‘source-sink’ theory, which originally referred to existing natural habitats that could be used as a source for the dispersal and maintenance of species [50]. According to the principle of habitat diversity in landscape ecology, patch size is positively related to habitat diversity [51], and therefore ecological source sites should usually be of a certain size.
First of all, based on MSPA to identify ecological source sites [31], landscape elements that have a significant impact on enhancing regional landscape connectivity can be identified. Based on land cover data, seven types of landscape types can be generated, namely core, bridge, edge, loop, perforation, branch and islet. The core areas are the larger habitat patches that provide habitat and migration spaces for species and act as ecological source sites in the ecological network. Soille and Vogt (2009) [52] developed Guidos software for spatial pattern analysis and identification of ecological source sites (http://forest.jrc.ec.europa.eu/download/software/guidos/, accessed on 18 October 2022). To ensure the accuracy of the data, we selected the original land use cover data in order to retain important minor landscape elements. We applied the 8-neighborhood analysis method to the raster data using Guidos analysis software for MSPA analysis. First, woodland and grass were used as foreground (FG) and cultivated land, built-up land, garden land, water, and unused land as background (BG). From the landscape characteristics of the study area, the larger the scale, the more landscape details are missing, while the smaller scale patches are severely fragmented. Moreover, the area of this study area is small, so we identified core area patches larger than 0.5 hm2 as possible ecological source sites.
In addition, landscape connectivity refers to the process by which the landscape facilitates or hinders the dispersal of species between ecological patches [53,54]. To be precise, the connectivity between ecological patches can be effectively determined from a macroscopic quantitative perspective [55]. After identifying possible ecological sources based on the MSPA method, the landscape connectivity index was used to identify ecological source sites. The core areas were analyzed using the ArcGIS 10.2 platform and Conefor2.6 software. The patch connectivity threshold chosen was 1000 m, and the probability was set to 0.5. The integral index of connectivity (IIC), possibility index (PC), and patch importance value (dPC) are expressed by Equations (1)–(3):
I I C = i = 1 n j = 1 n a i a j 1 + n l i j A L 2 ,
P C = i = 1 n j = 1 n a i a j p i j * A L 2 ,
d P C = P C P C r e m o v e P C × 100 % ,
where, n is the number of patches within the study area; a i and a j are the areas of patchs i and j; p i j * is the maximum probability of species dispersion in patchs i and j; n l i j is the number of connections between patch i and patch j; A L is the total area of the research range; IIC is the overall connectivity index; PC is the possible connectivity index of a patch in the landscape, 0 ≤ PC ≤ 1, the larger the value of PC, the higher the connectivity between the patch and other patches; dPC shows the importance of the patch.

2.3.2. Construction of Resistance Surface

A resistance surface is a spatial surface of resistance in a landscape. Landscape resistance was first proposed by Forman (1995) and can be summarized as the impediment to the dispersal of species, material, or energy flows in space [56]. This resistance can be caused by changes in the natural environment or by human activities. The values of resistance vary considerably between landscape types. The success of a species in getting from a source to a target source depends on crossing the resistance distance between the sources [57], meaning the cumulative resistance distance formed by the accumulation of resistance values for each point in the path through which the species crosses a given landscape. Calculating this distance requires a comprehensive resistance surface, so constructing a resistance surface is the basis for extracting ecological network components and is key to ensuring that the ecological network achieves functional connectivity and ecological conservation in the landscape. This study adopts a method based on the ecological safety index, which is constructed from the background characteristics of the ecological environment and the potential threats to it. Commonly used ecological security constraints include elevation, slope, landscape type, vegetation cover, distance from water bodies, distance from roads and distance from residential areas in combination with each ecological safety constraint factor [48,49,58]. The SPCA and expert scoring methods are used to evaluate and classify the ecological safety level of a specific area. A comprehensive resistance surface is also constructed based on the results of the spatial distribution of the ecological safety index evaluation. In this study, a comprehensive resistance index system was constructed based on two resistance factors: natural conditions and human interference (Table 1). The DEM, slope, distance to water bodies and land cover type were selected to represent the resistance factors of natural conditions in the area [49]. The human interference factor is expressed as the distance to the road and built-up land [48].
In order to avoid factor weight bias caused by subjective influences, this study used SPCA to determine the weights of each factor. With the help of the Principal Components tool of the multivariate analysis function in ArcGIS 10.2 software, the raster data corresponding to each ecological safety evaluation index were input for principal component analysis, and the spatial loadings map corresponding to each principal component and the cumulative contribution rate of each principal component could be obtained. According to the formula for calculating the comprehensive ecological safety index, the variance contribution rate of the principal components obtained from SPCA analysis was calculated to obtain the weights of each evaluation factor. Finally, the evaluation units were weighted and summed, so as to obtain the spatial distribution of ecological safety in the study area. The factors were firstly classified into five categories using the natural breakpoint method, and then the mean values of each breakpoint for 2013, 2017 and 2021 were calculated to derive the classification of each factor for three years. Finally, a reclassification tool was used to assign values to the factors to eliminate inconsistencies in the degree of dimensionality of each factor.

2.3.3. Extract Potential Ecological Corridor

The ecological corridor has many ecosystem service functions, such as biodiversity maintenance, water conservation, soil conservation, flood control and storage. The ecological corridor is a direct channel through which ecological sources communicate with each other and exchange matter and energy, which is conducive to the flow of species between “sources” and matrix. Ecological corridors are also key ecological components to enhance the overall connectivity of the ecosystem. Extraction and construction of ecological corridors can effectively maintain or restore landscape connectivity [59]. On the minimum cumulative resistance surface, the corridor is the resistance trough between two adjacent “sources” and the low-resistance channel that is easiest to contact [60]. MCR extracts the landscape connectivity of the area measured by the resistance distance and calculates the minimum cumulative resistance of the species spreading from the ecological source to a certain point in the space to realize landscape simulation and corridor extraction. This study extracted the ecological corridors between ecological sources that were consistent with the path characteristics of minimum cost [61]. Then, the raster was vectorized, the repeated paths were eliminated, and the vectorized lines were smoothed to determine the spatial position of the ecological corridor with the lowest cumulative resistance value. Potential ecological corridors are extracted based on the MCR model, with Equation (4) as follows:
M C R = f m i n j = n i = m D i j R i ,
where, D i j is the distance from location i to ecological source j; R i is the resistance encountered in the process of movement; and MCR is the minimum cumulative resistance.

2.3.4. Analyze the Connectivity of Ecological Networks and Build Ecological Network

The network analysis method is widely used in the internal structure of ecological networks, which can be combined with the graph theory method to evaluate the connectivity and complexity of the ecological corridor. By analyzing a graph-theoretic network composed of simplified nodes and connections, the network’s topology structure, node connectivity, connection rate and spatial topological relationships were quantitatively described with network closure (α), line-point rate (β), network connectivity (γ) and cost ratio (C) [62,63]. The calculation formulas are defined as follows:
α = L V + 1 2 V 5 ,
β = L V ,
γ = L 3 V 2 ,
C = 1 1 d ,
where L is the number of corridors; V is the number of ecological sources (number of nodes); d is the total length of the ecological corridor; α index reflects the degree of network circuit, the larger the value indicates that the path provides more possibilities for material and energy flow; β index reflects the number of corridors corresponding to each node, the higher the value, the better the layout of the network; γ index reflects the connectivity of each node in the network, indicating how connected each node is to the other; C represents the input–output relationship, and the lower the value, the more beneficial the ecological network construction.

2.3.5. Optimize Ecological Networks

An ecological network is a complex system of different landscape, forms and types of ecological landscape. In the ecological network based on the MCR model, the distribution of ecological sources and ecological corridors may be unbalanced. In areas without ecological sources, patches with relatively high connectivity can be selected as supplementary ecological sources to effectively solve this problem [40]. Stepping stones provide habitat for species migration, increase landscape connectivity, and promote biodiversity [48,49,64]. Therefore, this research made use of the ecological corridors of 2013, 2017 and 2021, and innovatively integrated the corridors formed by the MCR model, and superimposed the advantageous areas in them to form important ecological nodes. These nodes served as stepping stones to improve the landscape connectivity of the study area.

3. Results

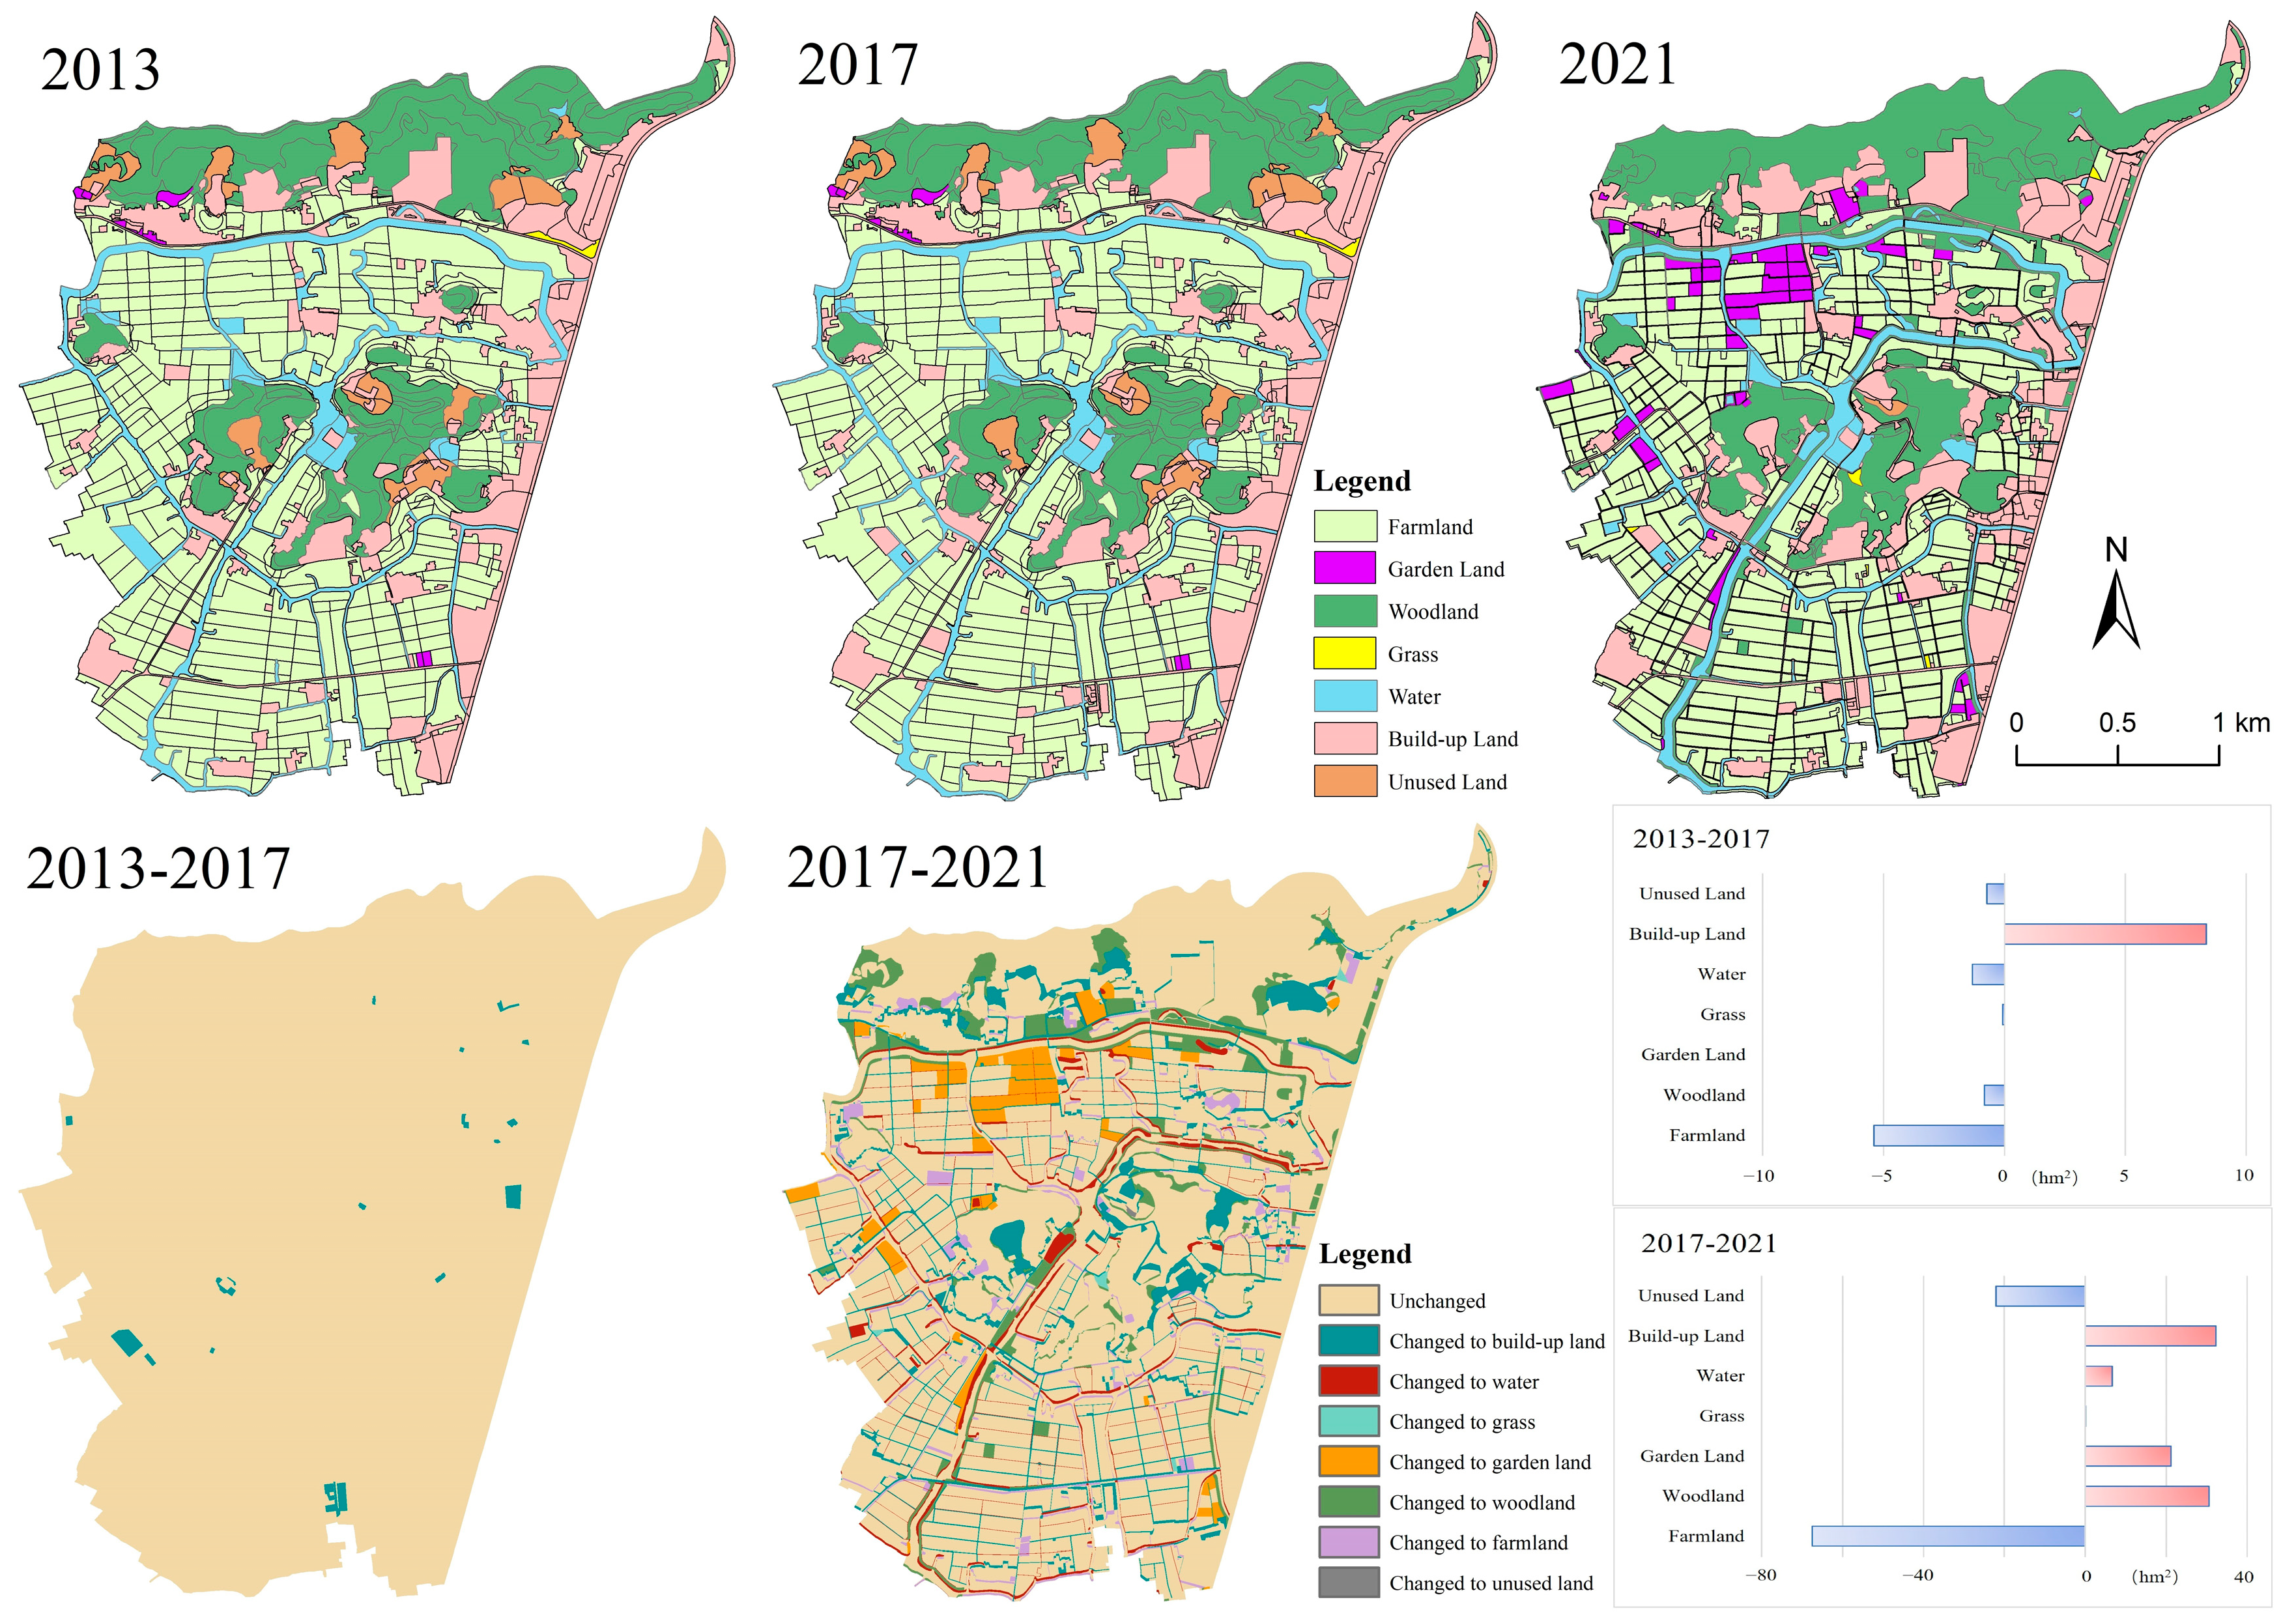
3.1. Land Use Cover Changes

The maps of land use and land cover change in Xiepu Town in 2013, 2017 and 2021 are shown in Figure 3. Farmland is the most widely distributed and spatially interconnected, concentrated within the central area to the large river along the mountain. Woodland is distributed more steadily in the low ridge in the north and in the central area in Xiaonan Hill and Xiaoling Mountain. The garden land is located at the confluence of two rivers. Grass is less distributed in Yuyan village along the side of the mountain road. The area of unused land has decreased significantly, and all is in areas around the mountain that are difficult to develop or have not yet been developed. Built-up land is heavily concentrated in the eastern residential areas and around the various villages.
During the period 2013–2017, spatial changes in land use in Xiepu Town were not obvious, and all that occurred were conversions between other use types and construction land. Spatially, this change was concentrated around North Cihai Road in the east, Luojia village in the south and Fangzhen village in the southwest. It was reflected in marginal expansion, with new construction land coming from the linkage between urban and rural construction land, the occupation of ecological space and the development of unused land. Grassland, forest land and water areas were largely unchanged, and the study area generally had a good basis for agricultural scale as well as rich ecological resources. Garden land remains unchanged, with a fragmented spatial distribution and no scale effect has yet been formed. Cultivated land is of high quality and widely distributed, with large areas of farmland having the potential for large-scale operation. During the period 2017–2021, the spatial changes in land use in the study were more dramatic, with changes concentrated in the north of the study area and around rivers and roads in the center. In terms of type, construction land was undoubtedly the type that has grown the most, with cultivated land and unused land being the main sources of growth. Farmland has declined to a greater extent in the north, with the emergence of rural roads reducing the concentration of farmland. The large scale of garden land in the north of the study area was a special case, converted from farmland, in addition to the scattering of garden land within the study area. The increase in water body was reflected in the increased width and connectivity of the river channels. The sharp reduction in the amount of unused land was evidence of the fact that Xiepu Town has exploited its reserves for development and the increasing demand for land during this period. In general, the town is undergoing a period of rapid urbanization and the demand for construction land is increasing, while the amount of arable land is declining rapidly in comparison, which is not conducive to the development of large-scale agriculture. When development of unused land is completed, the dynamics changes between various land use types will become more obvious. This also places a higher demand on the comprehensive land consolidation to further improve the land use pattern.

3.2. Ecological Sources Change

In this study, land use data based on the MSPA method, image processing and morphological analysis were used to identify ecological sources in the study area, and at the pixel level, habitat patches that play an important role in landscape connectivity were extracted. The results of ecological sources of the study area are shown in Figure 4. The core area of the study area remained almost unchanged from 2013 to 2017, and showed an upward trend from 2017 to 2021, accounting for less than a quarter of the total area. The core area is concentrated in the central and northern part of the study area. The ecological source of the study area was determined by calculating the dPC value of the core area larger than 0.5 hm2. In 2013 and 2017, 10 regions with dPC value greater than 1 were selected as ecological sources. In 2021, 20 ecological sources were selected. These ecological sources are mainly distributed in the central and northern parts of the study area. Among them, the central ecological source has the highest dPC value and strong connectivity, which is extremely important in the ecological network. The ecological source of the northern region is mainly composed of woodland area. In 2013, the total core area of the study area was 155.23 hm2, which decreased by 0.89 hm2 in 2017. In 2021, the area of core rose to 184.99 hm2. It can be seen that core patches with good connectivity are mainly distributed in the central and northern parts of the study area, with poor overall connectivity and serious fractures from north to south. Therefore, it is necessary to strengthen the protection and restoration of the southern region, build ecological patches suitable for the survival of species, promote the ecological network of material and energy flow between the northern and southern regions, and promote the healthy and sustainable development of the ecosystem. In addition, after the comprehensive land consolidation, a small amount of woodland has appeared in the southern area of the study area. Therefore, it is necessary to further build the green space and improve the ecological function of the woodland in the study area.

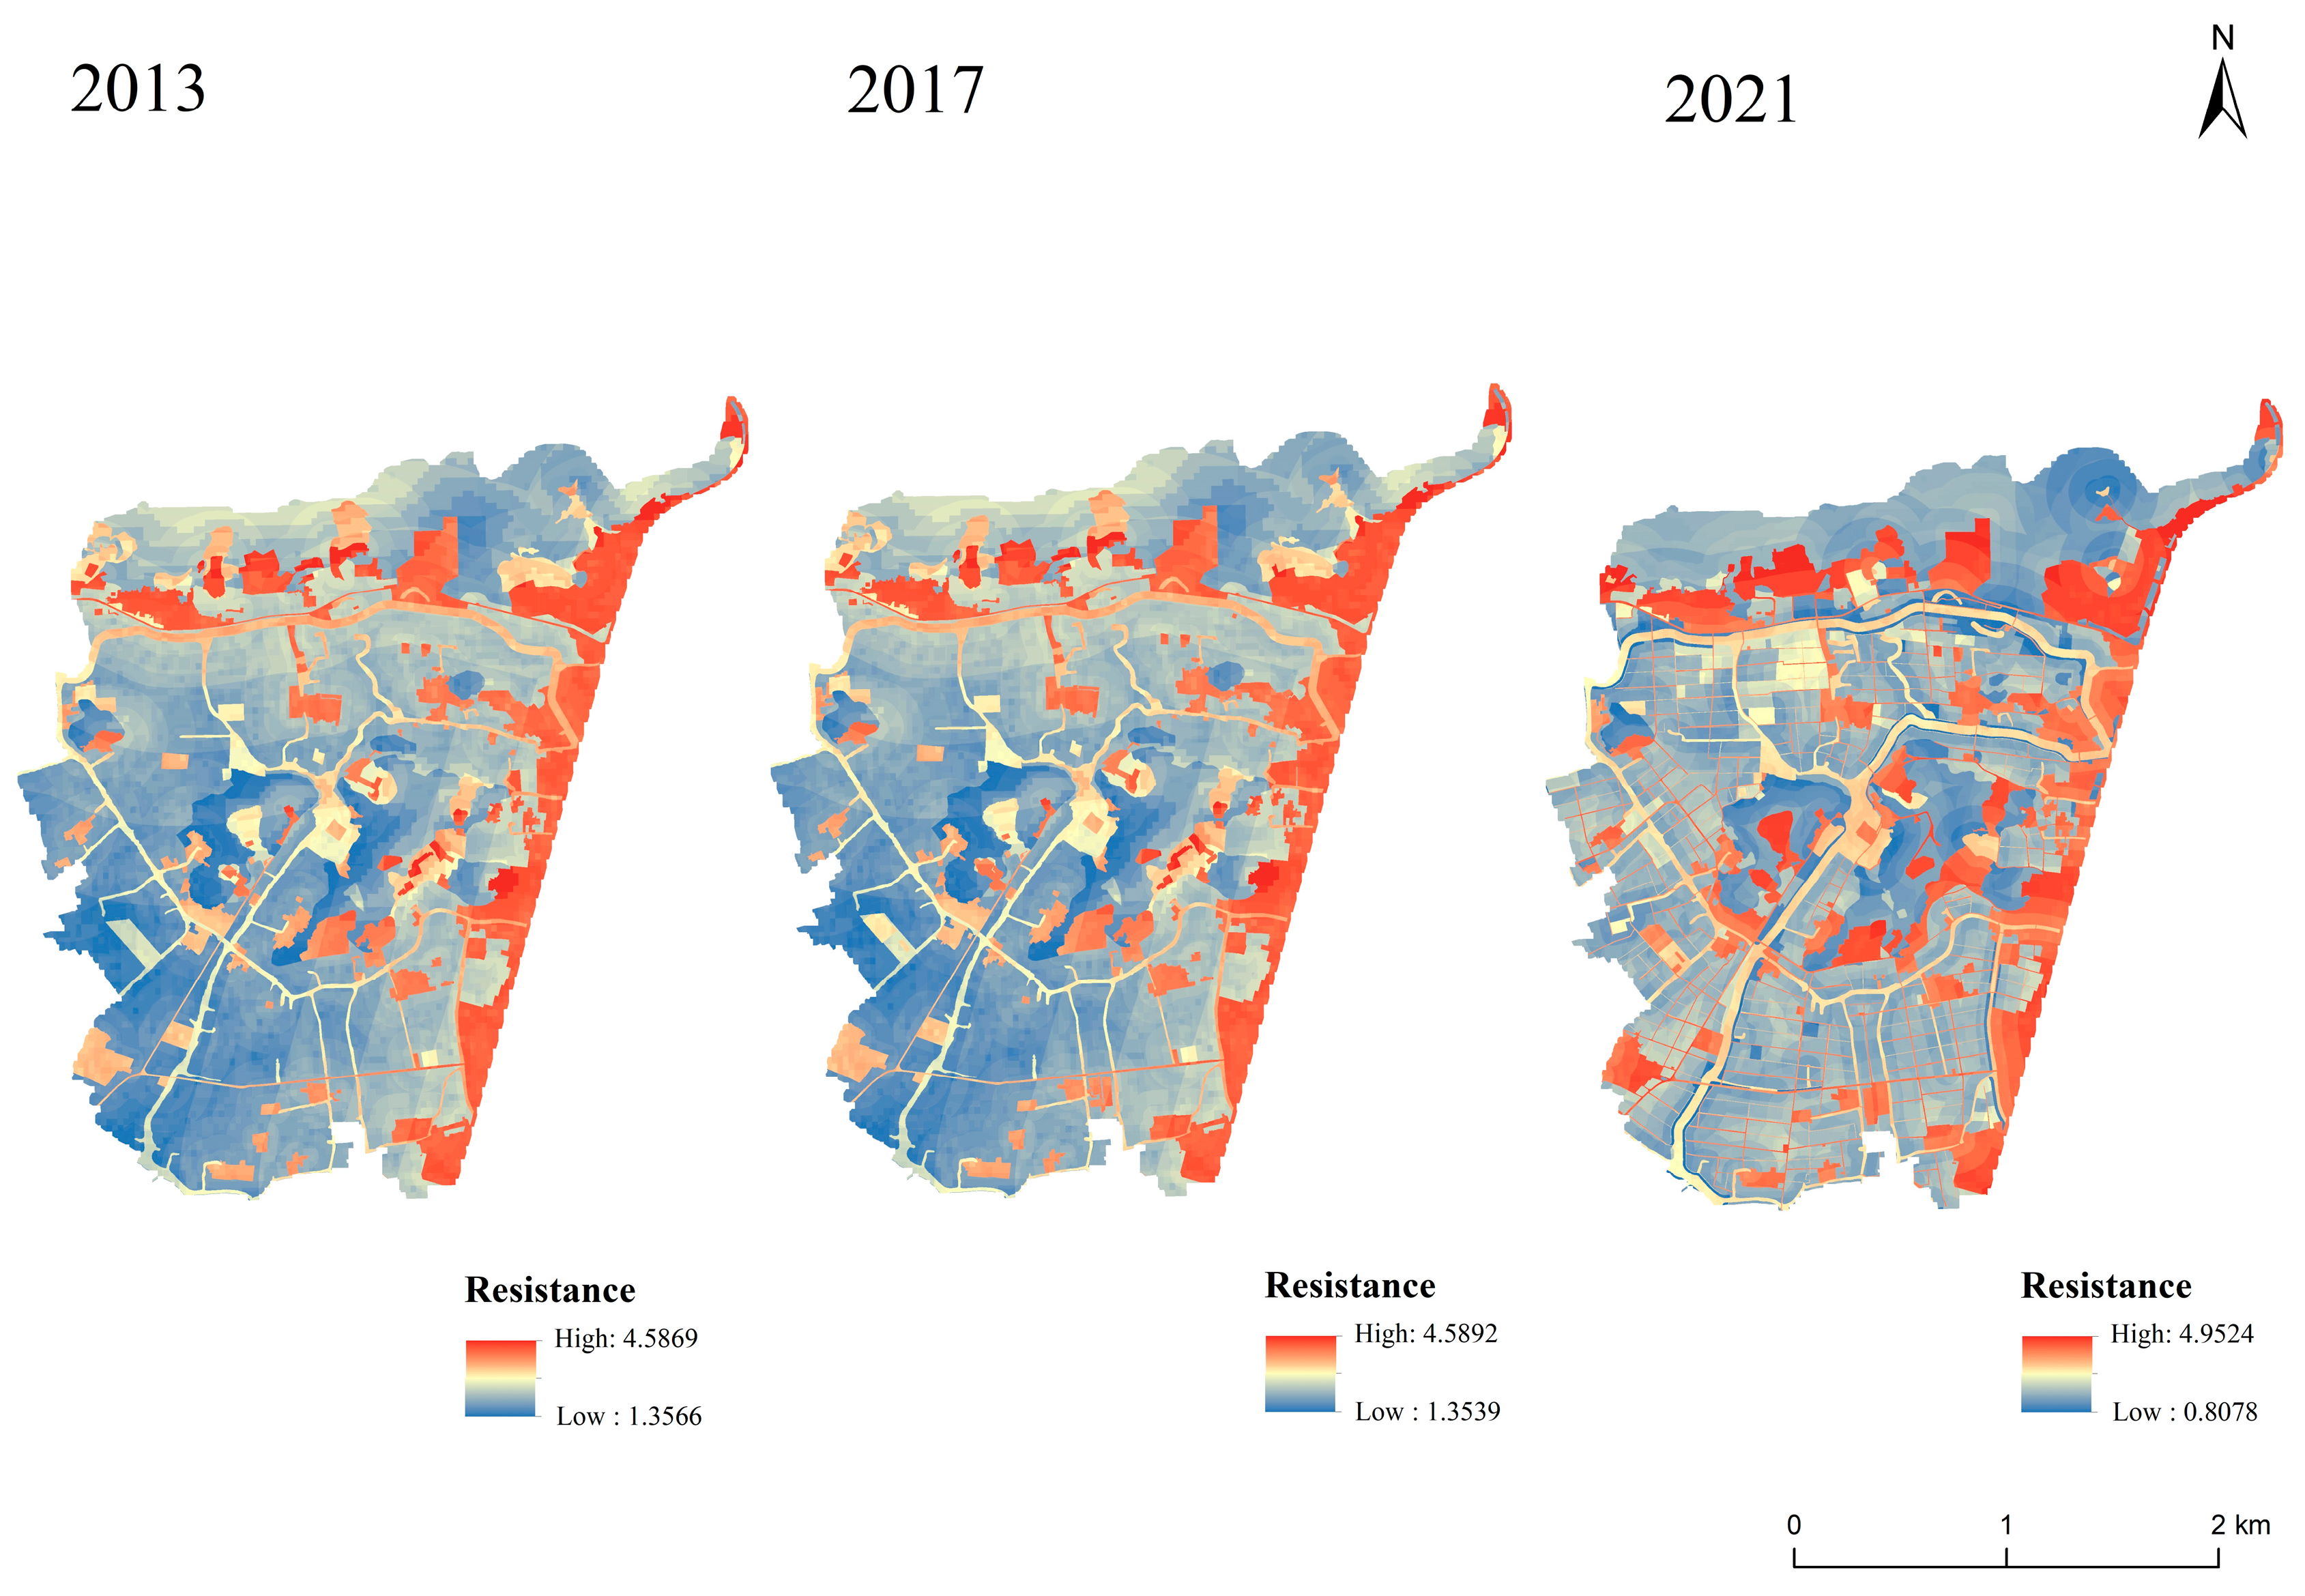
3.3. Resistance Surface and the Change of Factor Weights

Creating a reasonable resistance surface is the basis for establishing an ecological corridor. In this study, six resistance factors were selected and the SPCA method was applied to calculate the weights of each factor for the study area in 2013, 2017 and 2021 (Table 2). Because the land use cover of the study area has changed slightly from 2013 to 2017, the weight of each factor remained the same in both years. Land use type, DEM and distance to road were the three factors with higher weights. In contrast, the land use cover in 2021 shows a significant difference from the previous two years, with a decrease in the amount of cultivated and unused land, and an increase in the amount of other land types to a varying degree. Distance to water and distance to built-up land are also heavily weighted factors.
This study chose six resistance factors for the study area in 2013 as an example (Figure 5A–F). As shown in Figure 5A, among the land use type factors, construction land and water have high resistance, which were distributed in all the study area. As shown in Figure 5B–D, pixel with high resistance in DEM factor, slope factor, and distance to water factor are mostly located in the northern and central parts of the research area. Moreover, when the distances from the road and built-up land are further, the resistance in these factors is smaller (Figure 5E,F). The comprehensive resistance surface (Figure 5G) hinders communication between the 10 ecological sources. The lower the resistance value, the greater the transmission and communication in that area. According to the distribution of resistance values, high resistance areas are concentrated in the eastern built-up area and in the north on constructed and unused land. The medium resistance zone is an important area of ecological buffer zone, mainly located in the central mountainous region and the watershed in the study area. The low-resistance areas are mostly arable land that is far from built-up land and roads. This phenomenon mainly reflects the fact that human activities are the most significant factor influencing ecological resistance.
The comprehensive resistance surfaces for the study area in 2013, 2017 and 2021 are shown in Figure 6. The integrated resistance value shows an increasing range of resistance values over time, from 1.36 to 4.59 in 2013, to 0.81 to 4.95 in 2021. The difference in resistance value between pixels in the study area reached its maximum in 2021, indicating that human activities have influenced the ecological resistance of the study area more with the development of eco-tourism and special agriculture in the town of Xiepu. In terms of spatial distribution, all three years of high resistance areas were located in the northern and eastern part of the study area on built-up land, and there were also scattered high resistance areas throughout the whole study area, and the resistance values in these areas increased over time. Resistance values in the center and south-west, which were originally low, have also increased due to the construction of roads and the expansion of built-up land. The rapid urbanization of Xiepu Town has changed the original ecological resistance and the increasing amount of land for construction has challenged the ecological safety pattern of the study area. Therefore, considering the synergistic goal orientation of ecological protection and economic development, there is an urgent need to change the existing land use pattern in the study area, achieve intensive and economical use of construction land, and further promote the ecological effect.

3.4. Establishment and Optimization of Ecological Network

Based on the establishment of a comprehensive resistance surface, the distribution of corridors was identified using the LCP method of the MCR model. Using the ecological source as the source point for the outward spread of the ecological hub, the cost-weighted distance (CWD) and LCP were obtained. After removing some of the redundant corridors, the ecological networks for 2013, 2017 and 2021 were obtained, as shown in Figure 7A–C. As shown in Table 3, there are 10 ecological nodes in 2013 and 2017, while there are 20 ecological nodes in the study area by 2021, showing an increasing trend. At the same time, the number of ecological corridors also rises with the number of ecological sources. β and C indices show different degrees of increase in both time periods. β grows the fastest, by 0.25 from 2013 to 2021, and C index grows by 0.01. α and γ both reach their highest values of 0.93 and 0.96, respectively, in 2017. β is larger indicating that the ecological network of the study area is getting better and better. The ecological network A–C shows a lack of corridor connectivity in the southern and eastern parts of the study area. The eastern part is an agglomeration of villages with high development intensity, a large area of built-up land and limited ecological resources. The southern part of the study area is dominated by agricultural land and has poor ecological functions. Therefore, based on the location and connectivity, core patches should be selected as supplementary ecological sources in the southern part of the study area to balance the ecological source layout.
In this study, the potential ecological corridors of 2013, 2017 and 2021 were superimposed to identify six intersection points of the potential corridors in each year and set as stepping stones (Figure 7D). The α, β and γ indices of the ecological network with the addition of stepping stones all decreased to different degrees compared to those in 2021. Moreover, as the stepping stones were all located between the central and northern ecological sources in the study area, even if stepping stones were added, they could not constitute an ecological network covering the whole area and could not enhance the landscape connectivity in the southern part of the study area. Therefore, the addition of new ecological source sites may be a better approach. Furthermore, trees have already been planted in the south-western part of the study area, creating a small area of woodland. If the area of the existing small woodland is expanded and upgraded to an ecological source site, the local landscape connectivity can be enhanced more efficiently and constitute a more complete ecological network with a smaller economic loss. This research selected six core patches in the southern and western parts of the study area as supplementary ecological sources and established an ecological network (Figure 7E). α, β, γ and C indices all showed huge increases compared to ecological network D, especially the β and C indices, indicating that the ecological network is becoming more complete and the layout covers a wider area. Spatially, the new ecological nodes have effectively filled the gaps in the west and south, and 9.054 km of new ecological corridors have been added to connect with the original network, forming a new ecological network.

4. Discussion

4.1. Optimization Mechanism of Ecological Network

This study used new framework to establish an optimization mechanism of an ecological network. The network analysis method can be studied through a graphical theory approach, analyzing the quality of ecological patches and corridors, and studying the integrity and stability of ecological networks [65]. In many previous studies, only textual assessments were made based on the optimized networks [49,66]. Although spatially the approach allows for descriptive evaluation of the network, the ecological network indices can be used as quantitative indicators in combination with qualitative studies to enhance the measurement of optimized ecological network connectivity [48,64]. In this study, we first used the ecological network indices to evaluate the connectivity of existing ecological networks. In addition, many studies have pointed out that the addition of stepping stones can have a huge effect on enhancing landscape connectivity in the study area [28,67]. In the process of adding stepping stones in this paper, the ecological networks of 2013, 2017 and 2021 were overlaid, and the intersections of potential corridors in each year were set as stepping stones. Intersections of potential ecological corridors experienced less resistance to getting to the same ecological source site than other pixels, had a greater potential for source-to-source connectivity and dispersal, required fewer barriers and blockages to be crossed, were less costly, and had a greater potential for species to migrate to each other in order to enhance their effect on the flow and transfer of organisms and energy [28]. However, as the ecological source sites in the study area are concentrated in the center and north, this is due to the destruction and blockage of ecological sources by the construction of a large number of towns and agricultural production. As a result, ecological network construction is mainly concentrated in the north. The role of “stepping stones” is not obvious for this study area, and it is the second method to supplement the core area as an ecological source. It is later found that the method of adding stepping stones could not balance the ecological network pattern. Assuming that a small number of existing core areas in the western and southern parts of the study area become new ecological source areas, there is a huge increase in the ecological network indices, so it shows that expanding the existing core areas to optimize them into new ecological source areas is another way to optimize the ecological network. Overall, this study provides an optimization mechanism of “calculating ecological network indices—adding stepping stone—supplying new ecological source” for ecological network construction research.

4.2. The Advantages of Building Ecological Networks for Comprehensive Land Consolidation

Due to the strong scale-dependent regional character of the ecological landscape, especially in areas with high human activity, small-scale areas exhibit significant landscape heterogeneity [68]. Therefore, changes at different scales should be considered in ecological network construction and rural spatial planning [69], and attention should be paid to land-use characteristics and landscape pattern characteristics at smaller scales. This research analyzes the distributional characteristics and connectivity of ecological sources and corridors, down to the small scale. This approach fills a key gap that is lacking in studies at this scale. By identifying ecological sources and extracting potential ecological corridors to form a small-scale ecological network distribution, targeted strategies can be developed for different characteristics of the region and the connectivity of ecological networks in different areas can be improved. Therefore, this study applied two methods of optimizing ecological networks to the study area, adding stepping stones and supplementing new ecological sources. The results show that the addition of new ecological source sites is more effective in improving landscape connectivity and balancing ecological patterns. The “establish ecological network—calculating ecological network indices—adding stepping stones—complementing new ecological sources” approach helps to fulfil the new requirements for the efficient use of natural resources and ecological protection and restoration in the comprehensive land consolidation project with local conditions, and provides a method for improving the ecological pattern and a new approach to territorial space planning and ecological restoration.

4.3. Reconciling Conflicts between Rural Development and Ecological Protection

Ecological sources that require ecological preservation have been identified through the development of the ecological network. As a typical agricultural town, Xiepu Town has little available land for expansion, which limits the amount of space for development in the research area and exacerbates ecological issues. Therefore, a more adaptable land use policy needs to be created to satisfy the needs of both ecological preservation and economic growth. As a comprehensive land consolidation project, the area’s goals include maximizing the use of the land’s spatial configuration, achieving the harmony of economic, social, and ecological benefits, and fostering the integrated development of urban and rural areas [70]. In order to accomplish these objectives, rural spatial planning and landscape pattern optimization must take into account both the countryside’s production function and its ecological function, coordinating both rural growth and ecological protection. As a result, additional new ecological sources from woodlands were chosen for this investigation. Because woodland is a fundamental region in MSPA identification and also has specific ecological services, it may supply more ecological functions, improve landscape connectivity and biodiversity, and balance the ecological pattern when enlarged to become an ecological source. The area that needs to be changed must be less than what would be required to rebuild the ecological source area, and this method can also lessen the economic loss to the study area while increasing the effectiveness of land use and making it easier to coordinate production with the environment’s ecological needs.

4.4. Research Limitations and Future Research Directions

The integration of ecological networks and spatial planning is more suited to the protection of regional ecological environments and the coordination of development and conservation than traditional land consolidation approaches. The northern and central regions of the research area make up the majority of the ecological network that was built. In this study, the design of the study area was optimized by the employment of two strategies to modify the geographical distribution of the ecological network. Although the optimization method theoretically adds new ecological nodes, the theoretical solution should be validated by field data in order to make it practicable as well as to monitor, evaluate, and manage the research area adaptively. Whether, for instance, the recently installed stepping stones and ecological source disrupt the present land use and bother the locals with regard to commuting. Additionally, this study does not take into account any particular species and instead focuses on rural ecological land. Land use cover affects ecological processes, species migration, and reproduction, thus future research should take into account the behaviors of specific creatures in the studied area and use additional data from multiple sources for a thorough analysis.

5. Conclusions

This paper provides the spatial and temporal changes in ecological networks in a comprehensive land consolidation project of an agricultural town along the southeast coast of China from 2013 to 2021, and develops a framework for the spatial optimization of ecological networks. Our analysis highlights that the increase in built-up land area and the fragmentation of core areas have a significant influence on ecological security patterns. Meanwhile, it also underlines that the distribution of existing ecological source areas and the specific extent of potential ecological corridors are detrimental to landscape connectivity and affect the integrity and stability of ecological landscapes and planning and management. A better understanding of the role of conserving existing ecological source areas and optimizing existing ecological networks is significant for small-scale rural spatial optimization. Robust evidence discussed in this study suggests that the mechanisms of optimization of ecological networks are critical in facilitating the development of ecological planning and spatial pattern optimization for comprehensive land consolidation. Future research needs to focus on the validation of field data to identify feasible ways to overcome these barriers and make progress towards sustainable development goals in the countryside, and to provide a theoretical basis and scientific reference for rural spatial planning and comprehensive land consolidation in terms of policy and planning methods.

Author Contributions

Conceptualization, M.S., X.F. and Y.C.; Methodology, M.S. and X.F.; Software, M.S.; Formal analysis, M.S.; Investigation, K.S. and J.B.; Resources, Y.C.; Data curation, M.S., K.S. and J.B.; Writing—original draft, M.S.; Writing—review & editing, X.F. and Y.C.; Visualization, M.S.; Supervision, Y.C. All authors have read and agreed to the published version of the manuscript.

Funding

This research was funded by the Key Project of the National Social Science Fund of China (No. 20AGL025).

Institutional Review Board Statement

Not applicable.

Informed Consent Statement

Not applicable.

Data Availability Statement

The data used to support the findings of this study are available from the corresponding author upon request.

Conflicts of Interest

The authors declare no conflict of interest.

References

  1. Yonaba, R.; Biaou, A.C.; Koïta, M.; Tazen, F.; Mounirou, L.A.; Zour’e, C.O.; Queloz, P.; Karambiri, H.; Yacouba, H. A dynamic land use/land cover input helps in picturing the Sahelian paradox: Assessing variability and attribution of changes in surface runoff in a Sahelian watershed. Sci. Total Environ. 2021, 757, 143792. [Google Scholar] [CrossRef] [PubMed]
  2. Xia, F.Z.; Yang, Y.M.; Yan, J.M. Review on the connotation of China’s comprehensive land consolidation in the past 40 years: Stage evolution and development change. Chin. Land Sci. 2018, 5, 78–85. [Google Scholar]
  3. Xu, H.Z. Mechanism and implementation path of comprehensive land consolidation to boost rural revitalization. Guizhou Soc. Sci. 2021, 5, 144–152. [Google Scholar] [CrossRef]
  4. Wu, C.F.; Xiao, W.; Cao, Y.; Fang, K. Ecological Restoration of Territorial Space; Geological Publishing House: Beijing, China, 2019; pp. 304–305. [Google Scholar]
  5. Yan, J.M.; Xia, F.Z.; Li, Q. Top-level design of comprehensive land consolidation strategy in China. Trans. Chin. Soc. Agric. Eng. 2012, 28, 1–9. [Google Scholar]
  6. Li, Y.X.; Li, J.; Chen, H.; Wang, Z.J. Landscape connectivity evaluation and temporal-spatial characteristics of Guiyang City from 2008 to 2017 based on MSPA and MCR models. Chin. J. Ecol. 2022, 41, 1240–1248. [Google Scholar]
  7. Tang, H.; Yun, W.; Liu, W.; Sang, L. Structural Changes in the Development of China’s Farmland Consolidation in 1998–2017: Changing Ideas and Future Framework. Land Use Policy 2019, 89, 104212. [Google Scholar] [CrossRef]
  8. Zhang, M.; He, T.; Wu, C.; Li, G. The Spatiotemporal Changes in Ecological–Environmental Quality Caused by Farmland Consolidation Using Google Earth Engine: A Case Study from Liaoning Province in China. Remote Sens. 2022, 14, 3646. [Google Scholar] [CrossRef]
  9. Kong, X.S.; Wang, J.; Jin, Z.F.; Er, L.L. Rural land consolidation transformation and innovative thinking for rural revitalization. Chin. Land Sci. 2019, 5, 95–102. [Google Scholar]
  10. Xiao, W.; Hou, L.; Yue, W.Z. Connotation, dilemma and countermeasure of comprehensive land consolidation. Chin. Land 2022, 7, 12–15. [Google Scholar] [CrossRef]
  11. Li, J.L.; Xu, J.G.; Chu, J.L. Research on Urban Ecological Security Pattern Based on Circuit Theory: A Case Study of Anqing City. Resour. Environ. Yangtze Val. 2020, 29, 1812–1824. [Google Scholar]
  12. Charles, E.L. Greenway for America; Johns Hopkins University: Baktimore, MD, USA, 1990; p. 1. [Google Scholar]
  13. Bennett, A.F.; Radford, J.Q.; Haslem, A. Properties of Land Mosaics: Implications for Nature Conservation in Agricultural Environments. Biol. Conserv. 2006, 133, 250–264. [Google Scholar] [CrossRef]
  14. Xing, L.; Hu, M.; Wang, Y. Integrating Ecosystem Services Value and Uncertainty into Regional Ecological Risk Assessment: A Case Study of Hubei Province, Central China. Sci. Total Environ. 2020, 740, 140126. [Google Scholar] [CrossRef] [PubMed]
  15. Sun, X.; Crittenden, J.C.; Li, F.; Lu, Z.; Dou, X. Urban Expansion Simulation and the Spatio-Temporal Changes of Ecosystem Services, a Case Study in Atlanta Metropolitan Area, USA. Sci. Total Environ. 2018, 622–623, 974–987. [Google Scholar] [CrossRef] [PubMed]
  16. Yu, Q.; Yue, D.; Wang, Y.; Kai, S.; Fang, M.; Ma, H.; Zhang, Q.; Huang, Y. Optimization of Ecological Node Layout and Stability Analysis of Ecological Network in Desert Oasis: A Typical Case Study of Ecological Fragile Zone Located at Deng Kou County (Inner Mongolia). Ecol. Indic. 2018, 84, 304–318. [Google Scholar] [CrossRef]
  17. Li, X.; Lao, C.; Liu, Y.; Liu, X.; Chen, Y.; Li, S.; Ai, B.; He, Z. Early Warning of Illegal Development for Protected Areas by Integrating Cellular Automata with Neural Networks. J. Environ. Manag. 2013, 130, 106–116. [Google Scholar] [CrossRef]
  18. Baggio, J.A.; Hillis, V. Managing ecological disturbances: Learning and the structure of social-ecological networks. Environ. Modell. Softw. 2018, 109, 32–40. [Google Scholar] [CrossRef]
  19. Hostetler, M.; Allen, W.; Meurk, C. Conserving Urban Biodiversity? Creating green Infrastructure Is Only the First Step. Landsc. Urban Plan. 2011, 100, 369–371. [Google Scholar] [CrossRef]
  20. Lookingbill, T.R.; Gardner, R.H.; Ferrari, J.R.; Keller, C.E. Combining a dispersal model with network theory to assess habitat connectivity. Ecol. Appl. 2010, 20, 427–441. [Google Scholar] [CrossRef]
  21. Chen, C.; Shi, L.; Lu, Y.; Yang, S.; Liu, S. The Optimization of Urban Ecological Network Planning Based on the Minimum Cumulative Resistance Model and Granularity Reverse Method: A Case Study of Haikou, China. IEEE Access 2020, 8, 43592–43605. [Google Scholar] [CrossRef]
  22. Guo, L.; Luo, J.; Yuan, M.; Huang, Y.; Shen, H.; Li, T. The Influence of Urban Planning Factors on PM2.5 Pollution Exposure and Implications: A Case Study in China Based on Remote Sensing, LBS, and GIS Data. Sci. Total Environ. 2019, 659, 1585–1596. [Google Scholar] [CrossRef]
  23. Vuilleumier, S.V.; Prélaz-Droux, R. Map of ecological networks for landscape planning. Landsc. Urban Plan. 2002, 58, 157–170. [Google Scholar] [CrossRef]
  24. Battisti, C. Habitat fragmentation, fauna and ecological network planning: Toward a theoretical conceptual framework. Ital. J. Zool. 2003, 70, 241–247. [Google Scholar] [CrossRef]
  25. Hüse, B.; Szabo, S.; Deák, B.; Tóthmérész, B. Mapping an ecological network of green habitat patches and their role in maintaining urban biodiversity in and around Debrecen city (Eastern Hungary). Land Use Policy 2016, 57, 574–581. [Google Scholar] [CrossRef]
  26. Tang, Y.; Gao, C.; Wu, X. Urban Ecological Corridor Network Construction: An Integration of the Least Cost Path Model and the InVEST Model. Int. J. Geo-Inf. 2020, 9, 33. [Google Scholar] [CrossRef] [Green Version]
  27. Ignatieva, M.; Stewart, G.H.; Meurk, C. Planning and Design of Ecological Networks in Urban Areas. Landsc. Ecol. 2011, 7, 17–25. [Google Scholar] [CrossRef]
  28. Luo, Y.; Wu, J.; Wang, X.; Peng, J. Using Stepping-Stone Theory to Evaluate the Maintenance of Landscape Connectivity under China’s Ecological Control Line Policy. J. Clean. Prod. 2021, 296, 126356. [Google Scholar] [CrossRef]
  29. Heintzman, L.J.; McIntyre, N.E. Assessment of Playa Wetland Network Connectivity for Amphibians of the South-Central Great Plains (USA) Using Graph-Theoretical, Least-Cost Path, and Landscape Resistance Modelling. Landsc. Ecol. 2021, 36, 1117–1135. [Google Scholar] [CrossRef]
  30. Yan, X.; Niu, Z.G. Study on wetland connectivity in Baiyangdian Basin. Acta Ecol. Sin. 2019, 39, 9200–9210. [Google Scholar]
  31. Ye, H.; Yang, Z.; Xu, X. Ecological Corridors Analysis Based on MSPA and MCR Model—A Case Study of the Tomur World Natural Heritage Region. Sustainability 2020, 12, 959. [Google Scholar] [CrossRef] [Green Version]
  32. Wickham, J.D.; Riitters, K.H.; Wade, T.G.; Vogt, P. A national assessment of green infrastructure and change for the conterminous United States using morphological image processing. Landsc. Urban Plan. 2010, 94, 186–195. [Google Scholar] [CrossRef]
  33. Li, T.; Gong, Y.B.; Ge, J.Z.; Qi, Z.X.; Xie, S.B. Construction of urban landscape ecological security pattern based on Circuit theory: A case study of Hengyang City, Hunan Province. Chin. J. Appl. Ecol. 2021, 32, 2555–2564. [Google Scholar]
  34. Li, H.H.; Ma, T.K.; Wang, K.; Tan, M.; Qu, J.F. Construction of Ecological Security Pattern in Northern Peixian Based on MCR and SPCA. J. Ecol. Rural Environ. 2020, 36, 1036–1045. [Google Scholar]
  35. Correa Ayram, C.A.; Mendoza, M.E.; Etter, A.; Salicrup, D.R.P. Habitat Connectivity in Biodiversity Conservation: A Review of Recent Studies and Applications. Prog. Phys. Geogr. Earth Environ. 2016, 40, 7–37. [Google Scholar] [CrossRef]
  36. Adriaensen, F.; Chardon, J.P.; De Blust, G.; Swinnen, E.; Villalba, S.; Gulinck, H.; Matthysen, E. The Application of ‘Least-Cost’ Modelling as a Functional Landscape Model. Landsc. Urban Plan. 2003, 64, 233–247. [Google Scholar] [CrossRef]
  37. Rudnick, D.; Ryan, S.; Beier, P. The role of landscape connectivity in planning and implementing conservation and restoration priorities. Issues Ecol. 2012, 16, 20. [Google Scholar]
  38. Beier, P.; Spencer, W.; Baldwin, R.F.; McRAE, B.H. Toward Best Practices for Developing Regional Connectivity Maps: Regional Connectivity Maps. Conserv. Biol. 2011, 25, 879–892. [Google Scholar] [CrossRef] [PubMed]
  39. Bunn, A.G.; Urban, D.L.; Keitt, T.H. Landscape Connectivity: A Conservation Application of Graph Theory. J. Environ. Manag. 2000, 59, 265–278. [Google Scholar] [CrossRef] [Green Version]
  40. Laita, A.; Kotiaho, J.S.; Mönkkönen, M. Graph-Theoretic Connectivity Measures: What Do They Tell Us about Connectivity? Landsc. Ecol. 2011, 26, 951–967. [Google Scholar] [CrossRef]
  41. Rubio, L.; Saura, S. Assessing the importance of individual habitat fragments as irreplaceable connecting elements: An analysis of simulated and real landscape data. Ecol. Complex. 2012, 11, 28–37. [Google Scholar] [CrossRef]
  42. Decout, S.; Manel, S.; Miaud, C.; Luque, S. Integrative Approach for Landscape-Based Graph Connectivity Analysis: A Case Study with the Common Frog (Rana Temporaria) in Human-Dominated Landscapes. Landsc. Ecol. 2012, 27, 267–279. [Google Scholar] [CrossRef]
  43. Ziółkowska, E.; Ostapowicz, K.; Kuemmerle, T.; Perzanowski, K.; Radeloff, V.C.; Kozak, J. Potential Habitat Connectivity of European Bison (Bison Bonasus) in the Carpathians. Biol. Conserv. 2012, 146, 188–196. [Google Scholar] [CrossRef]
  44. Vogt, P.; Riitters, K.H.; Estreguil, C.; Kozak, J.; Wade, T.G.; Wickham, J.D. Mapping Spatial Patterns with Morphological Image Processing. Landsc. Ecol. 2007, 22, 171–177. [Google Scholar] [CrossRef]
  45. Vogt, P.; Riitters, K.H.; Iwanowski, M.; Estreguil, C.; Kozak, J.; Soille, P. Mapping Landscape Corridors. Ecol. Indic. 2007, 7, 481–488. [Google Scholar] [CrossRef]
  46. Clerici, N.; Vogt, P. Ranking European Regions as Providers of Structural Riparian Corridors for Conservation and Management Purposes. Int. J. Appl. Earth Obs. Geoinf. 2013, 21, 477–483. [Google Scholar] [CrossRef]
  47. He, K.; Lin, T.; Wu, J.F.; Sui, M.F.; Liu, L.; Ding, G.C. Construction of green infrastructure network in Fuzhou City Center based on spatial priority. Chin. J. Appl. Ecol. 2021, 32, 1424–1432. [Google Scholar]
  48. Nie, W.; Shi, Y.; Siaw, M.J.; Yang, F.; Wu, R.; Wu, X.; Zheng, X.; Bao, Z. Constructing and Optimizing Ecological Network at County and Town Scale: The Case of Anji County, China. Ecol. Indic. 2021, 132, 108294. [Google Scholar] [CrossRef]
  49. Zhang, J.; Zhu, H.; Zhang, P.; Song, Y.; Zhang, Y.; Li, Y.; Rong, T.; Liu, Z.; Yang, D.; Lou, Y. Construction of GI Network Based on MSPA and PLUS Model in the Main Urban Area of Zhengzhou: A Case Study. Front. Environ. Sci. 2022, 10, 878656. [Google Scholar] [CrossRef]
  50. Yu, K.J. Landscape ecological security pattern of biological conservation. Acta Ecol. Sin. 1999, 19, 8–15. [Google Scholar]
  51. Guo, X.; Huang, G.; Jia, P.; Wu, J. Estimating Fine-Scale Heat Vulnerability in Beijing Through Two Approaches: Spatial Patterns, Similarities, and Divergence. Remote Sens. 2019, 11, 2358. [Google Scholar] [CrossRef] [Green Version]
  52. Soille, P.; Vogt, P. Morphological Segmentation of Binary Patterns. Pattern Recognit. Lett. 2009, 30, 456–459. [Google Scholar] [CrossRef]
  53. Taylor, P.D.; Fahrig, L.; Henein, K.; Merriam, G. Connectivity Is a Vital Element of Landscape Structure. Oikos 1993, 68, 571. [Google Scholar] [CrossRef] [Green Version]
  54. Forman, R.T.T.; Collinge, S.K. Nature Conserved in Changing Landscapes with and without Spatial Planning. Landsc. Urban Plan. 1997, 37, 129–135. [Google Scholar] [CrossRef]
  55. Clergeau, P.; Burel, F. The role of spatio-temporal patch connectivity at the landscape level: An example in a bird distribution. Landsc. Urban Plan. 1997, 38, 37–43. [Google Scholar] [CrossRef]
  56. Forman, R.T.T. Some General Principles of Landscape and Regional Ecology. Landscape Ecol. 1995, 10, 133–142. [Google Scholar] [CrossRef]
  57. Knaapen, J.P.; Scheffer, M.; Harms, B. Estimating Habitat Isolation in Landscape Planning. Landsc. Urban Plan. 1992, 23, 1–16. [Google Scholar] [CrossRef]
  58. Keeley, A.T.H.; Beier, P.; Gagnon, J.W. Estimating landscape resistance from habitat suitability: Effects of data source and nonlinearities. Landsc. Ecol. 2016, 31, 2151–2162. [Google Scholar] [CrossRef]
  59. Peng, J.; Li, H.L.; Liu, Y.X.; Hu, Y.N.; Yang, Y. Ecological security pattern identification and optimization strategy in Xiong’an New Area. Acta Geo. Sin. 2018, 73, 701–710. [Google Scholar]
  60. Luo, Y.; Wu, J. Linking the Minimum Spanning Tree and Edge Betweenness to Understand Arterial Corridors in an Ecological Network. Landsc. Ecol. 2021, 36, 1549–1565. [Google Scholar] [CrossRef]
  61. McRae, B.H.; Dickson, B.G.; Keitt, T.H.; Shah, V.B. Using Circuit Theory to Model Connectivity in Ecology, Evolution, and Conservation. Ecology 2008, 89, 2712–2724. [Google Scholar] [CrossRef]
  62. Zhang, Z.; Meerow, S.; Newell, J.P.; Lindquist, M. Enhancing Landscape Connectivity through Multifunctional Green Infrastructure Corridor Modeling and Design. Urban For. Urban Green. 2019, 38, 305–317. [Google Scholar] [CrossRef]
  63. Zhao, S.; Ma, Y.; Wang, J.; You, X. Landscape Pattern Analysis and Ecological Network Planning of Tianjin City. Urban For. Urban Green. 2019, 46, 126479. [Google Scholar] [CrossRef]
  64. Huang, X.; Wang, H.; Shan, L.; Xiao, F. Constructing and Optimizing Urban Ecological Network in the Context of Rapid Urbanization for Improving Landscape Connectivity. Ecol. Indic. 2021, 132, 108319. [Google Scholar] [CrossRef]
  65. Xiao, H.; Liu, Y.H.; Yu, Z.R.; Zhang, Q.; Zhang, X. Combination of ecoprofile and least-cost model for eco-network planning. Chin. Geogr. Sci. 2014, 24, 113–123. [Google Scholar] [CrossRef] [Green Version]
  66. Hu, C.G.; Wang, Z.Y.; Wang, Y.; Sun, D.Q.; Zhang, J.X. Combining MSPA-MCR Model to Evaluate the Ecological Network in Wuhan, China. Land 2022, 11, 213. [Google Scholar] [CrossRef]
  67. Huang, X.F.; Wu, C.F.; You, H.Y.; Xiao, W.; Zhong, S.Q. Construction of rural landscape ecological corridor in water network plain area based on MCR Model. Trans. Chin. Soc. Agric. Eng. 2019, 35, 243–251. [Google Scholar]
  68. Shi, F.; Liu, S.; Sun, Y.; An, Y.; Zhao, S.; Liu, Y.; Li, M. Ecological Network Construction of the Heterogeneous Agro-Pastoral Areas in the Upper Yellow River Basin. Agric. Ecosyst. Environ. 2020, 302, 107069. [Google Scholar] [CrossRef]
  69. Gonthier, D.J.; Ennis, K.K.; Farinas, S.; Hsieh, H.-Y.; Iverson, A.L.; Batáry, P.; Rudolphi, J.; Tscharntke, T.; Cardinale, B.J.; Perfecto, I. Biodiversity Conservation in Agriculture Requires a Multi-Scale Approach. Proc. R. Soc. B 2014, 281, 20141358. [Google Scholar] [CrossRef] [Green Version]
  70. Ge, D.Z.; Long, H.L. Rural spatial governance and urban-rural integration development. Acta Geogr. Sin. 2020, 75, 1272–1286. [Google Scholar]
Figure 1. Location of the study area.
Sustainability 15 05984 g001
Figure 2. Framework for ecological network construction in the study area.
Sustainability 15 05984 g002
Figure 3. Land use cover and change in the study area from 2013 to 2021.
Sustainability 15 05984 g003
Figure 4. The change of core area and ecological sources area in the study area from 2013 to 2021.
Sustainability 15 05984 g004
Figure 5. Resistance factor rating in study area in 2013. (A): land use type, (B): DEM, (C): slope, (D): distance to water, (E): distance to road, (F): distance to build-up land, (G): comprehensive resistance.
Sustainability 15 05984 g005
Figure 6. Comprehensive resistance surface in the study area in 2013, 2017 and 2021.
Sustainability 15 05984 g006
Figure 7. Existing ecological networks and optimized ecological networks ((A): ecological network in 2013, (B): ecological network in 2017, (C): ecological network in 2021, (D): stepping stones design based on ecological network in 2013, 2017 and 2021, (E): graph showing target ecological sources and corridors).
Sustainability 15 05984 g007
Table 1. Resistance surface.
Rating FactorsResistance FactorResistance Value
12345
Natural disturbance factorsLand use typeWoodlandFarmland, GrassGarden land, Unused landWaterBuilt-up land
DEM<22–55–1515–25>25
Slope<1515–3030–6060–90>90
Distance to water (m)0–5353–130130–236236–383>383
Human disturbance factorsDistance to road (m)>1306925–1306582–925269–5820–269
Distance to built-up land (m)>343214–343121–21448–1210–48
Table 2. Weight of each factor and comprehensive resistance value in 2013, 2017 and 2021.
Index201320172021
Land use type0.470.470.59
DEM0.200.200.02
Slope0.060.060.04
Distance to water0.030.030.19
Distance to road0.150.150.06
Distance to built-up land0.090.090.10
Comprehensive resistance1.3566–4.58691.3539–4.58920.8078–4.9524
Table 3. Indices of five ecological networks.
IndexABCDE
Corridor number2223495964
Node number1010202626
α0.870.930.860.720.83
β2.202.302.452.272.46
γ0.920.960.910.820.89
C0.900.910.910.920.95
Corridor length (km)9.69510.64711.70813.15820.762
Disclaimer/Publisher’s Note: The statements, opinions and data contained in all publications are solely those of the individual author(s) and contributor(s) and not of MDPI and/or the editor(s). MDPI and/or the editor(s) disclaim responsibility for any injury to people or property resulting from any ideas, methods, instructions or products referred to in the content.

