
Will Online MOOCs Improve the Efficiency of Chinese Higher Education Institutions? An Empirical Study Based on DEA

Abstract
:1. Introduction
2. Literature Review
2.1. Performance Evaluation with DEA in International HEIs
2.2. Performance Evaluation with DEA in Chinese HEIs
2.3. Research Gap
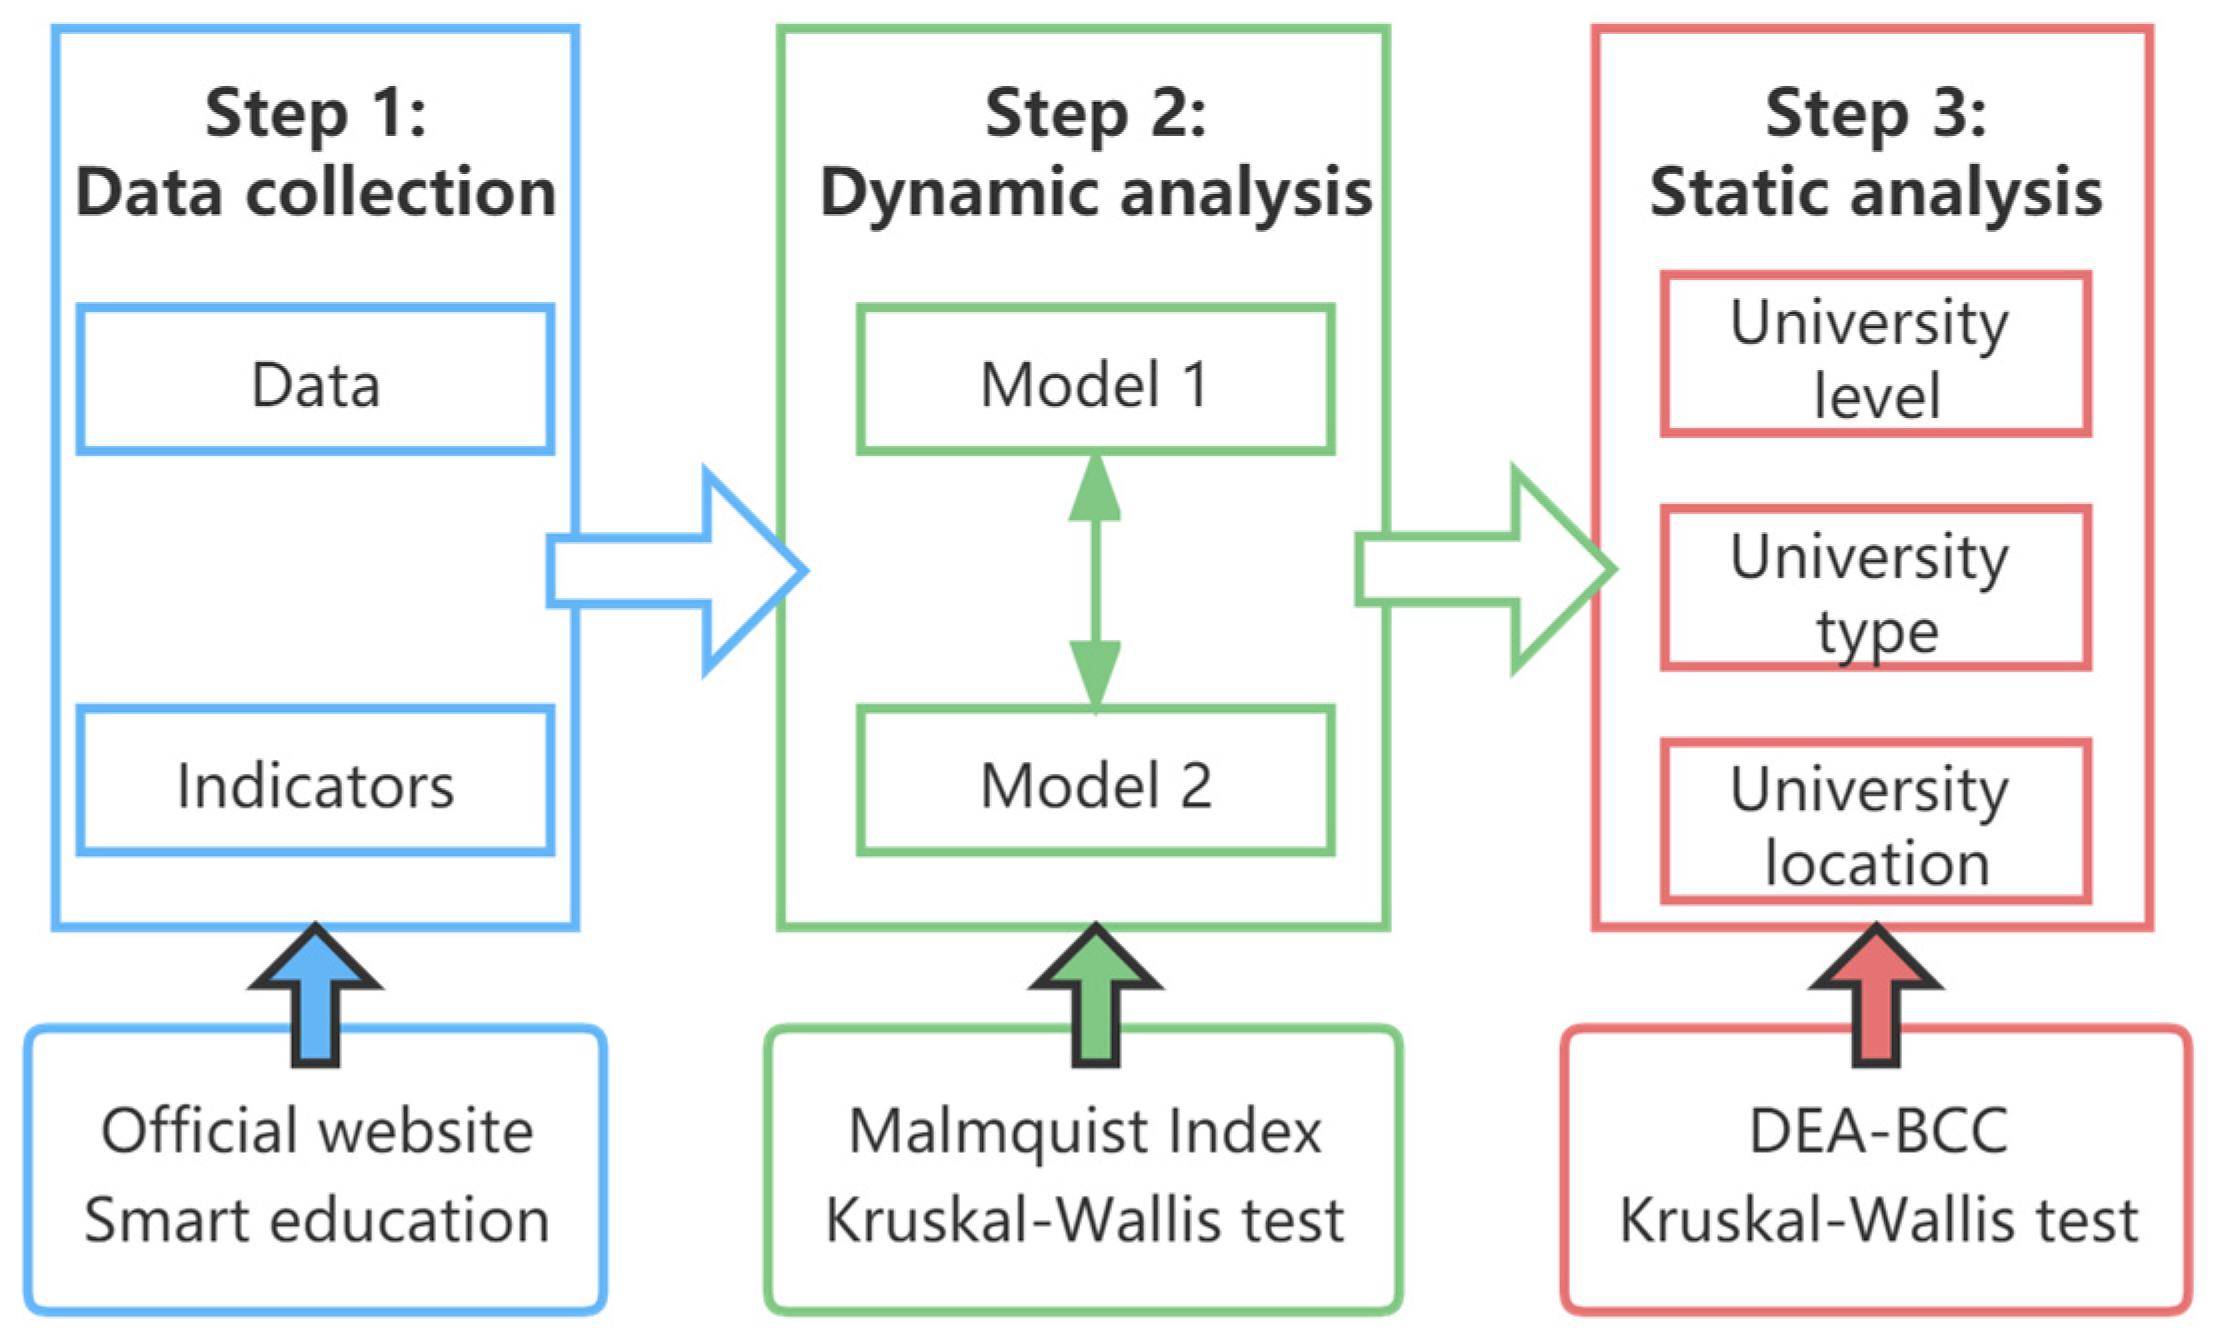
3. Methodology and Data
3.1. Methodology
3.1.1. DEA-BCC
3.1.2. Malmquist Index
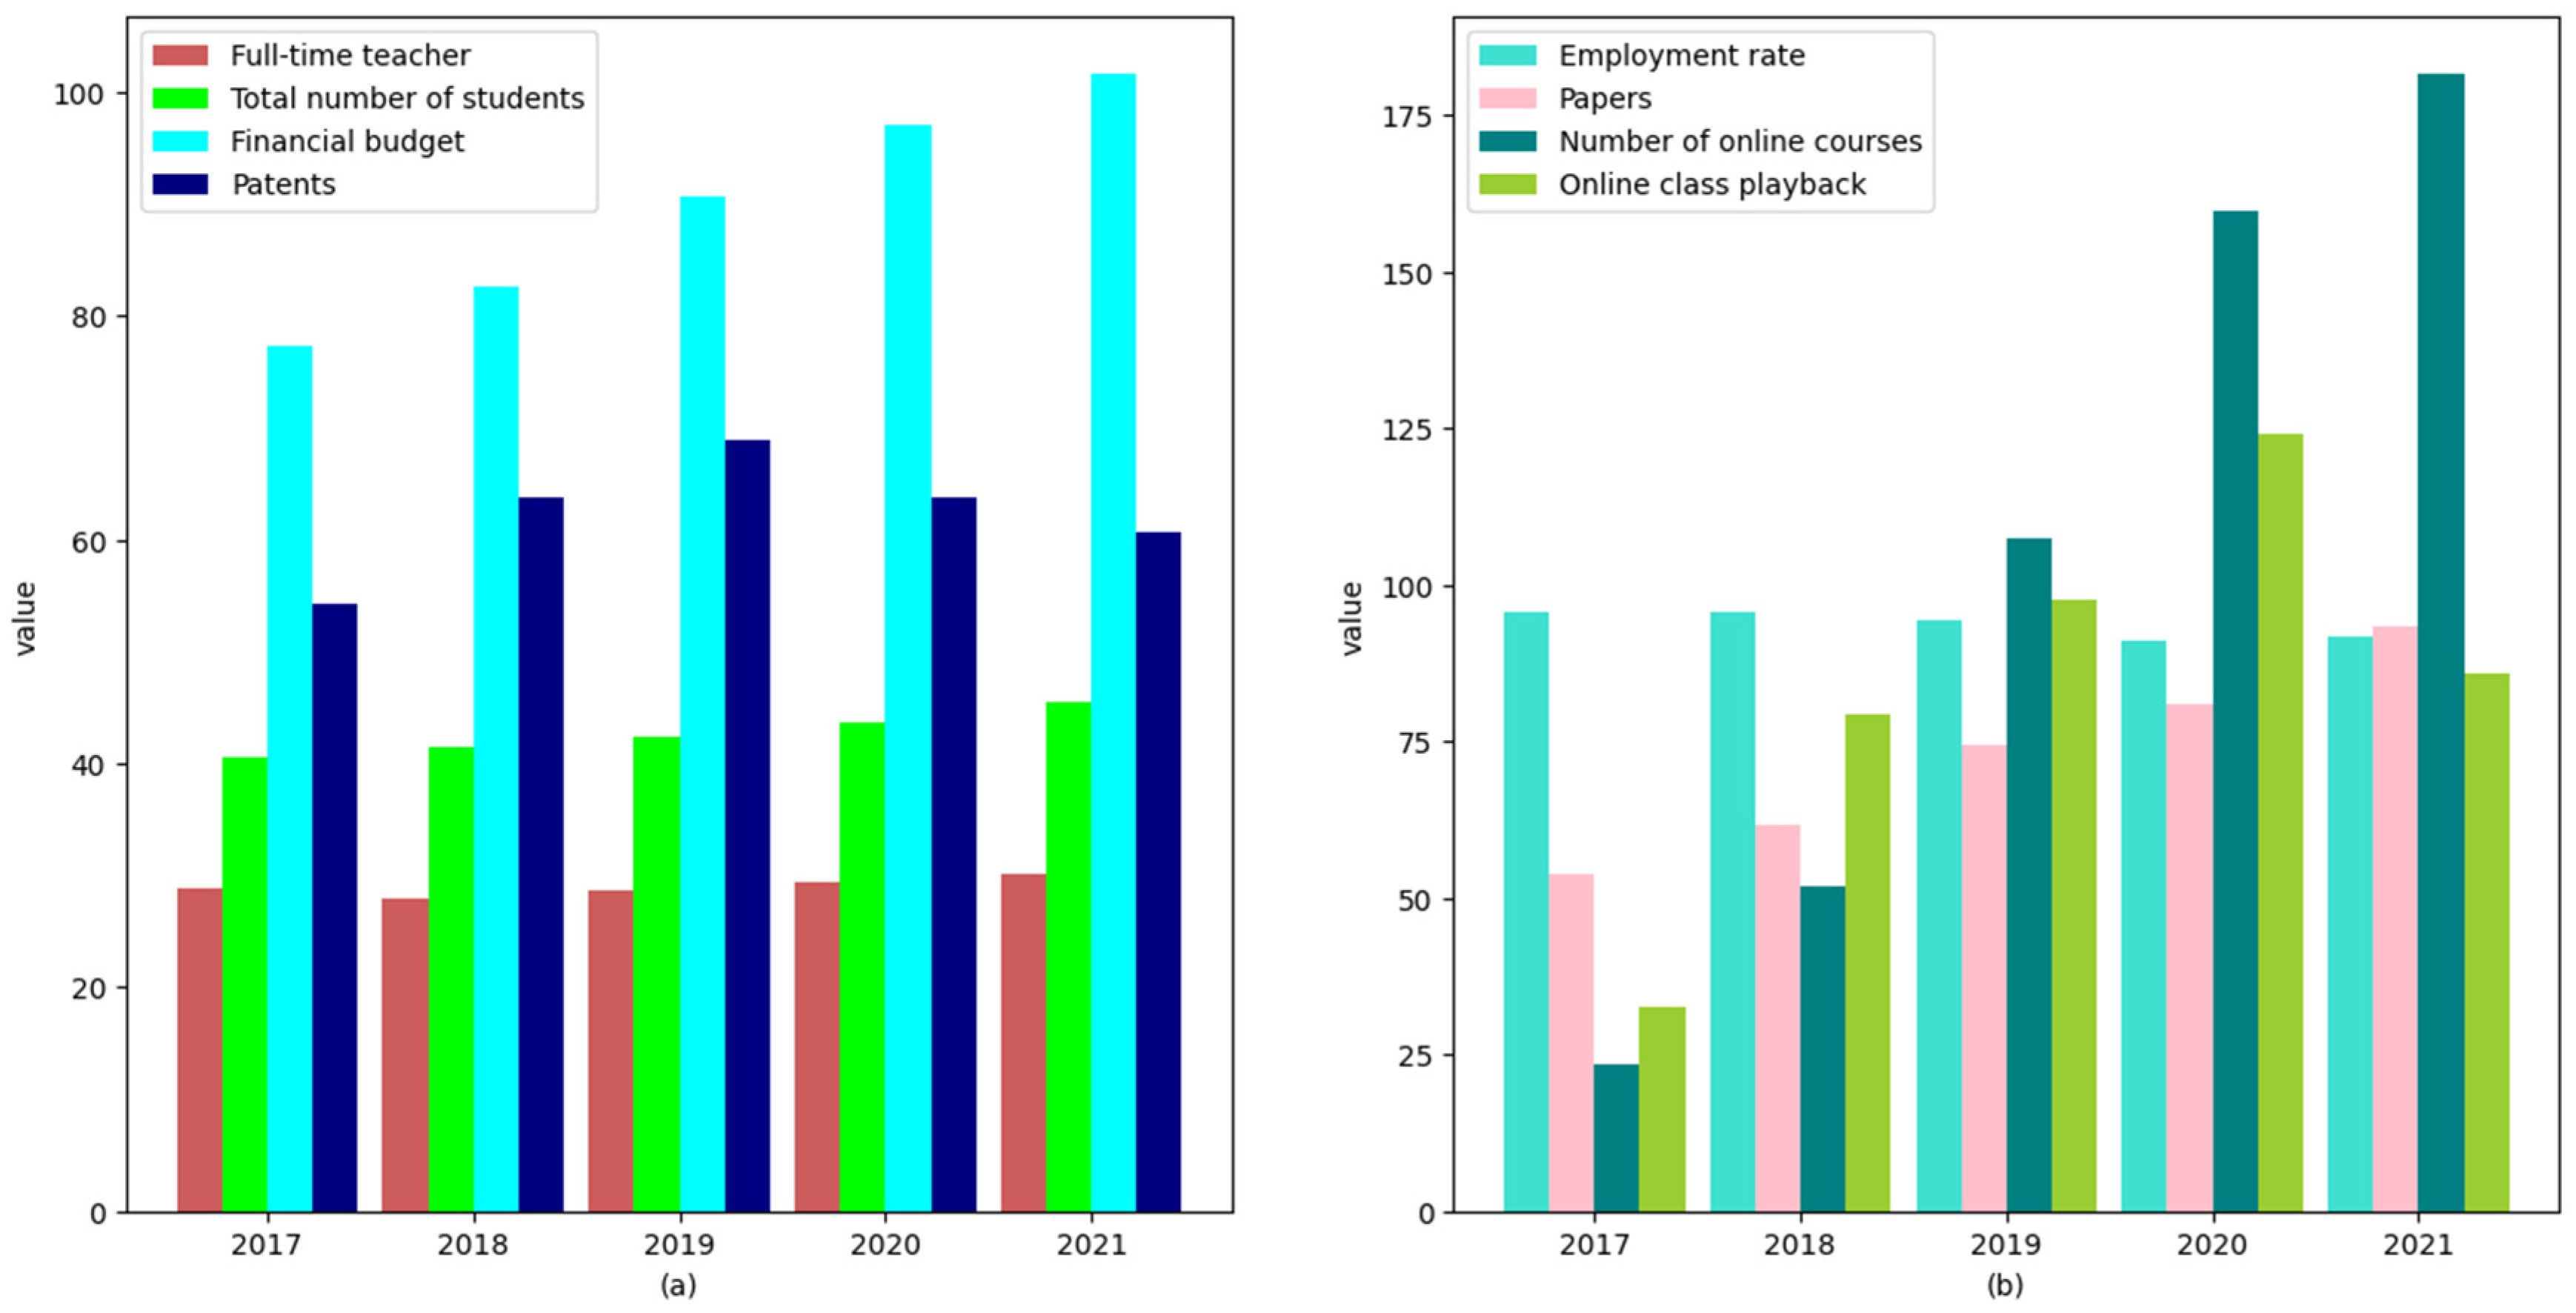
3.2. Data
3.2.1. Indicators
3.2.2. Descriptive Statistics
4. Empirical Results
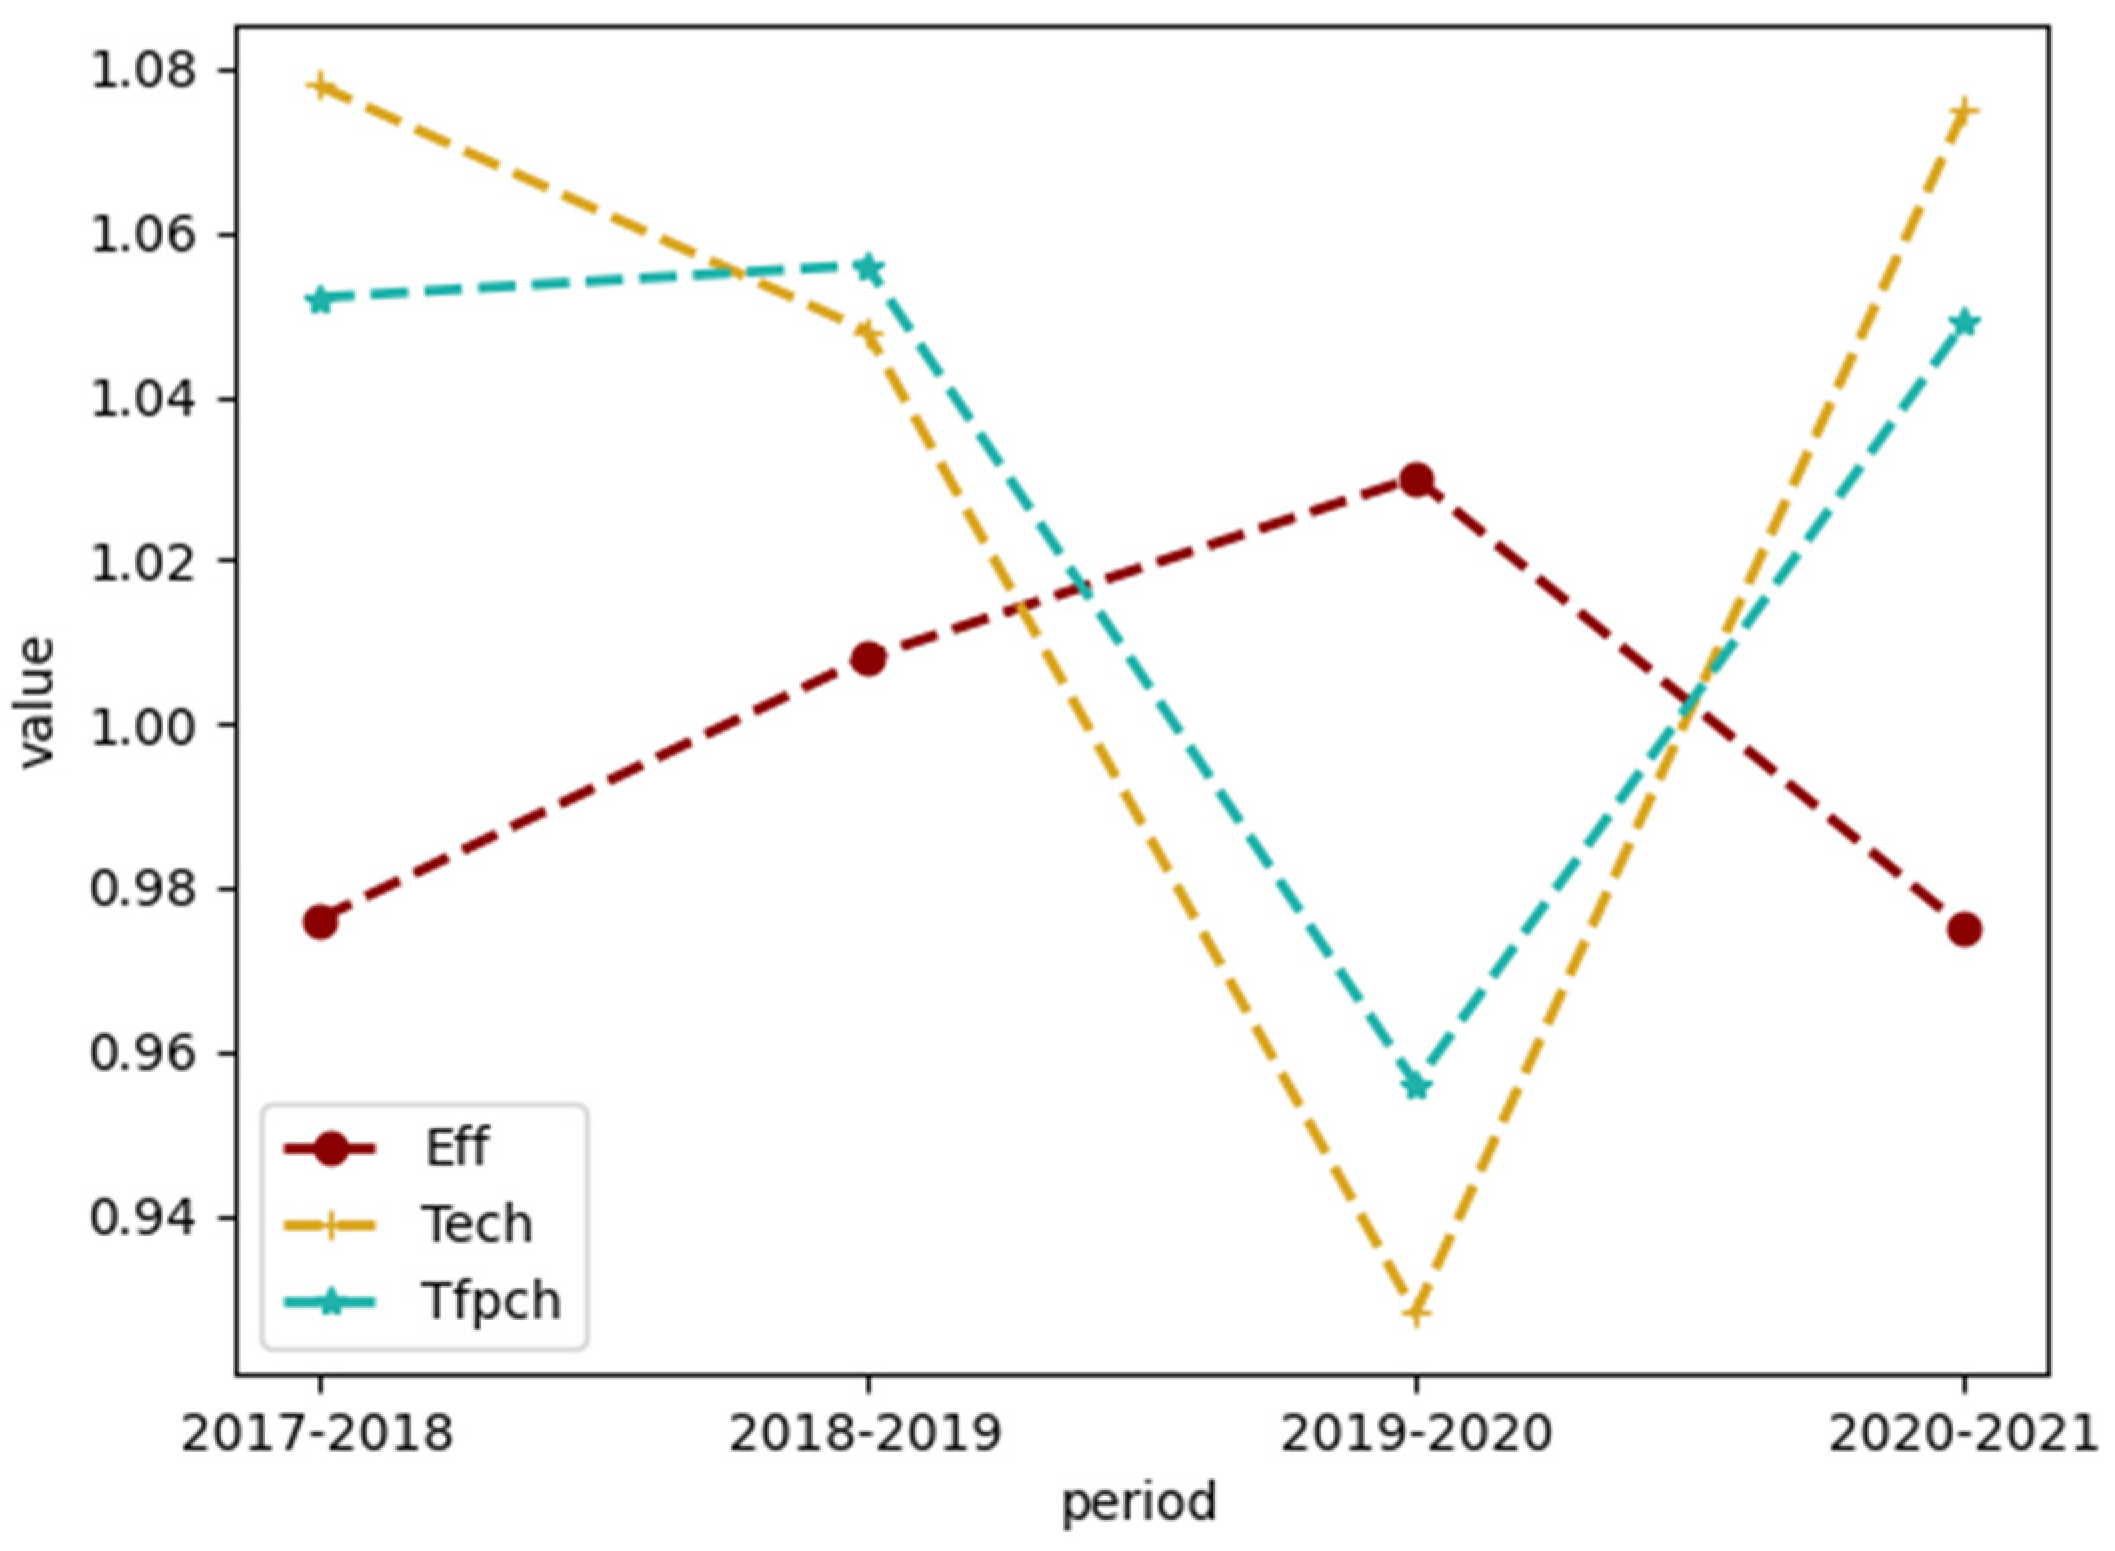
4.1. Dynamic Analysis
4.2. Static Analysis
5. Conclusions, Implication, and Limitations
5.1. Conclusion and Discussion
5.2. Implications
5.3. Limitations
Author Contributions
Funding
Institutional Review Board Statement
Informed Consent Statement
Data Availability Statement
Conflicts of Interest
Appendix A

| Year | Statistics | NOFTT | TNOS | FB | NOPA | EROU | NOCPP | NOMO | PTOOM |
|---|---|---|---|---|---|---|---|---|---|
| 2017 | Mean | 2877.0882 | 40,612.5 | 773,615 | 5422.97 | 95.5315 | 5363.176 | 23.3088 | 324,234.30 |
| Median | 2725.0000 | 39,285.0 | 685,319 | 4402.00 | 96.2300 | 5754.000 | 21.5000 | 227,529.00 | |
| SD | 1228.7528 | 14,349.8 | 459,955 | 4606.42 | 3.75032 | 3116.800 | 19.42492 | 338,822.46 | |
| Min | 1071.00 | 16,616.0 | 138,943 | 142.00 | 79.61 | 186.00 | 0.10 | 0.10 | |
| Max | 7317.00 | 76,730.0 | 2,333,476 | 18,707.0 | 99.31 | 13,245.00 | 63.00 | 1,235,081.0 | |
| 2018 | Mean | 2792.2647 | 41,396.5 | 826,359 | 6375.64 | 95.5179 | 6168.764 | 51.7676 | 791,616.29 |
| Median | 2721.5000 | 40,347.0 | 749,133 | 5331.50 | 96.3750 | 6365.500 | 47.5000 | 598,642.00 | |
| SD | 952.76810 | 14,303.9 | 469,952 | 5558.69 | 3.36906 | 3455.460 | 35.96032 | 1,047,899.6 | |
| Min | 1112.00 | 16,730.0 | 95,874.8 | 123.00 | 86.18 | 258.00 | 0.10 | 0.10 | |
| Max | 5525.00 | 74,915.0 | 2,694,521 | 24,572.0 | 99.58 | 14,403.00 | 117.00 | 5,028,418.0 | |
| 2019 | Mean | 2792.2647 | 41,396.5 | 82,635 | 6375.64 | 95.5179 | 6168.764 | 51.7676 | 791,616.29 |
| Median | 2721.5000 | 40,347.0 | 749,133 | 5331.50 | 96.3750 | 6365.500 | 47.5000 | 598,642.00 | |
| SD | 952.76810 | 14,303.9 | 469,952 | 5558.69 | 3.36906 | 3455.460 | 35.96032 | 1,047,899.6 | |
| Min | 1112.00 | 16,730.0 | 95,874.8 | 123.00 | 86.18 | 258.00 | 0.10 | 0.10 | |
| Max | 5525.00 | 74,915.0 | 2,694,521 | 24,572.0 | 99.58 | 14,403.00 | 117.00 | 5,028,418.0 | |
| 2020 | Mean | 2942.7059 | 43,718.8 | 970,778 | 6384.76 | 91.1312 | 8105.823 | 159.6471 | 1,241,053.2 |
| Median | 2853.0000 | 42,633.0 | 818,357 | 5004.50 | 93.2100 | 8310.000 | 145.5000 | 902,904.50 | |
| SD | 885.94851 | 13,665.3 | 581,438 | 5422.60 | 6.57612 | 4462.555 | 108.32691 | 1,176,488.4 | |
| Min | 1122.00 | 17,916.0 | 183,629 | 80.00 | 68.74 | 324.00 | 17.00 | 58,894.00 | |
| Max | 4819.00 | 69,862.0 | 3,107,164 | 25,462.0 | 98.90 | 17,328.00 | 490.00 | 5,445,825.0 | |
| 2021 | Mean | 3019.4412 | 45,502.2 | 1,016,061 | 6058.52 | 91.7518 | 9330.382 | 181.5000 | 857,610.64 |
| Median | 3012.5000 | 44,479.5 | 866,030 | 4864.00 | 92.3600 | 9498.000 | 161.0000 | 588,166.50 | |
| SD | 898.68335 | 13,753.1 | 622,743 | 5103.94 | 5.59493 | 5058.577 | 123.40847 | 892,444.42 | |
| Min | 1162.00 | 19,273.0 | 188,186 | 85.00 | 75.91 | 327.00 | 16.00 | 15,634.00 | |
| Max | 4796.00 | 69,940.0 | 3,172,831 | 22,854.0 | 99.01 | 20,382.00 | 500.00 | 4,610,311.0 |
Appendix B
| DMU | Effch | Tech | Pech | Sech | Tfpch |
|---|---|---|---|---|---|
| Peking University | 0.961 | 1.088 | 0.999 | 0.963 | 1.046 |
| Tsinghua University | 0.95 | 1.088 | 1 | 0.95 | 1.034 |
| Shanghai Jiao Tong University | 1 | 1.125 | 1 | 1 | 1.125 |
| Zhejiang University | 1.009 | 1.079 | 1 | 1.009 | 1.09 |
| Wuhan University | 0.989 | 1.068 | 0.976 | 1.014 | 1.057 |
| Fudan University | 0.99 | 1.07 | 0.983 | 1.007 | 1.059 |
| Huazhong University of Science and Technology | 0.99 | 1.085 | 0.985 | 1.005 | 1.074 |
| Beijing Normal University | 1.031 | 0.956 | 0.988 | 1.044 | 0.986 |
| Xi’an Jiaotong University | 0.968 | 1.041 | 1.001 | 0.968 | 1.008 |
| Jilin University | 0.982 | 1.079 | 0.971 | 1.011 | 1.059 |
| Shandong University | 0.952 | 1.072 | 0.988 | 0.964 | 1.021 |
| Nankai University | 1.035 | 0.952 | 1.002 | 1.033 | 0.986 |
| Sichuan University | 1.009 | 1.088 | 1.005 | 1.004 | 1.098 |
| Tongji University | 1.069 | 0.975 | 0.99 | 1.079 | 1.042 |
| Xiamen University | 1.041 | 0.977 | 0.989 | 1.052 | 1.017 |
| East China Normal University | 1.016 | 0.989 | 1.005 | 1.011 | 1.004 |
| Dalian University of Technology | 0.989 | 1.032 | 1.008 | 0.981 | 1.021 |
| Central South University | 1.033 | 1.075 | 1.002 | 1.031 | 1.11 |
| China Agricultural University | 1 | 0.946 | 1 | 1 | 0.946 |
| University of Electronic Science and Technology of China | 1 | 1.04 | 1 | 1 | 1.04 |
| Chongqing University | 0.985 | 1.069 | 0.997 | 0.988 | 1.053 |
| Northeastern University | 1.019 | 1.027 | 0.986 | 1.034 | 1.047 |
| Northwest A & F University | 0.996 | 1.015 | 0.969 | 1.027 | 1.011 |
| Hunan University | 0.991 | 1.017 | 0.978 | 1.013 | 1.007 |
| Sun Yat-sen University | 1.002 | 1.108 | 0.991 | 1.011 | 1.11 |
| Nanjing University | 1 | 1.029 | 1 | 1 | 1.029 |
| University of Science and Technology of China | 1 | 1.026 | 1 | 1 | 1.026 |
| Renmin University of China | 1.038 | 0.967 | 1 | 1.038 | 1.003 |
| Tianjin University | 1.02 | 1.033 | 1.001 | 1.019 | 1.053 |
| Southeast University | 0.949 | 1.006 | 0.994 | 0.955 | 0.955 |
| South China University of Technology | 0.965 | 1.028 | 0.996 | 0.969 | 0.992 |
| Lanzhou University | 0.958 | 1.018 | 0.982 | 0.975 | 0.975 |
| Minzu University of China | 1 | 0.94 | 1 | 1 | 0.94 |
| Ocean University of China | 0.971 | 0.968 | 0.994 | 0.976 | 0.94 |
| Mean | 0.997 | 1.03 | 0.993 | 1.003 | 1.027 |
Appendix C
| DMU | Eff | Tech | Pech | Sech | Tfpch |
|---|---|---|---|---|---|
| Peking University | 1 | 1.217 | 1 | 1 | 1.217 |
| Tsinghua University | 1 | 1.158 | 1 | 1 | 1.158 |
| Shanghai Jiao Tong University | 1 | 1.15 | 1 | 1 | 1.15 |
| Zhejiang University | 1.012 | 1.212 | 1 | 1.012 | 1.227 |
| Wuhan University | 0.963 | 1.124 | 0.971 | 0.993 | 1.083 |
| Fudan University | 0.98 | 1.11 | 0.983 | 0.997 | 1.087 |
| Huazhong University of Science and Technology | 1.003 | 1.12 | 0.993 | 1.01 | 1.123 |
| Beijing Normal University | 1.041 | 1.258 | 1 | 1.041 | 1.309 |
| Xi’an Jiaotong University | 1 | 1.251 | 1 | 1 | 1.251 |
| Jilin University | 0.973 | 1.1 | 0.969 | 1.003 | 1.069 |
| Shandong University | 0.994 | 1.143 | 0.987 | 1.007 | 1.136 |
| Nankai University | 1.033 | 1.007 | 1.002 | 1.032 | 1.041 |
| Sichuan University | 1.028 | 1.14 | 1.005 | 1.022 | 1.172 |
| Tongji University | 0.974 | 1.221 | 0.989 | 0.985 | 1.189 |
| Xiamen University | 1.013 | 1.149 | 0.988 | 1.025 | 1.164 |
| East China Normal University | 1.035 | 1.06 | 1.005 | 1.029 | 1.097 |
| Dalian University of Technology | 0.965 | 1.159 | 1 | 0.965 | 1.118 |
| Central South University | 1.029 | 1.118 | 1.002 | 1.028 | 1.151 |
| China Agricultural University | 1 | 0.976 | 1 | 1 | 0.976 |
| University of Electronic Science and Technology of China | 1 | 1.167 | 1 | 1 | 1.167 |
| Chongqing University | 1.003 | 1.082 | 0.999 | 1.003 | 1.085 |
| Northeastern University | 1 | 1.215 | 1 | 1 | 1.215 |
| Northwest A & F University | 1.006 | 1.058 | 0.969 | 1.038 | 1.064 |
| Hunan University | 1.018 | 1.142 | 0.985 | 1.033 | 1.162 |
| Sun Yat-sen University | 1 | 1.113 | 0.991 | 1.009 | 1.113 |
| Nanjing University | 1 | 1.13 | 1 | 1 | 1.13 |
| University of Science and Technology of China | 1 | 1.036 | 1 | 1 | 1.036 |
| Renmin University of China | 1 | 1.175 | 1 | 1 | 1.175 |
| Tianjin University | 1.022 | 1.074 | 1.001 | 1.02 | 1.097 |
| Southeast University | 0.954 | 1.077 | 0.994 | 0.96 | 1.028 |
| South China University of Technology | 0.968 | 1.038 | 0.996 | 0.972 | 1.005 |
| Lanzhou University | 0.958 | 1.018 | 0.982 | 0.975 | 0.975 |
| Minzu University of China | 1 | 1.017 | 1 | 1 | 1.017 |
| Ocean University of China | 1 | 1.037 | 1 | 1 | 1.037 |
| Mean | 0.999 | 1.117 | 0.994 | 1.005 | 1.116 |
Appendix D
| Serial No | DMU | Benchmark | ||||
|---|---|---|---|---|---|---|
| 1 | Peking University | 1 | ||||
| 2 | Shanghai Jiao Tong University | 2 | ||||
| 3 | Zhejiang University | 3 | ||||
| 4 | Wuhan University | 26 | 25 | 2 | 29 | |
| 5 | Fudan University | 2 | 8 | 25 | 29 | |
| 6 | Huazhong University of Science and Technology | 1 | 17 | 26 | 3 | 2 |
| 7 | Beijing Normal University | 7 | ||||
| 8 | Xi’an Jiaotong University | 8 | ||||
| 9 | Jilin University | 2 | 25 | 8 | 29 | |
| 10 | Shandong University | 8 | 26 | 3 | 12 | |
| 11 | Nankai University | 11 | ||||
| 12 | Sichuan University | 12 | ||||
| 13 | Tongji University | 29 | 26 | 2 | 8 | |
| 14 | Xiamen University | 26 | 29 | 8 | ||
| 15 | East China Normal University | 19 | 16 | 29 | ||
| 16 | Dalian University of Technology | 16 | ||||
| 17 | Central South University | 17 | ||||
| 18 | China Agricultural University | 18 | ||||
| 19 | University of Electronic Science and Technology of China | 19 | ||||
| 20 | Chongqing University | 26 | 29 | 19 | 16 | |
| 21 | Northeastern University | 21 | ||||
| 22 | Northwest A & F University | 19 | 33 | 18 | ||
| 23 | Hunan University | 21 | 33 | 26 | 19 | 7 |
| 24 | Sun Yat-sen University | 25 | 2 | 29 | ||
| 25 | Tsinghua University | 25 | ||||
| 26 | Nanjing University | 26 | ||||
| 27 | University of Science and Technology of China | 27 | ||||
| 28 | Renmin University of China | 28 | ||||
| 29 | Tianjin University | 29 | ||||
| 30 | Southeast University | 29 | 2 | 8 | 26 | |
| 31 | South China University of Technology | 29 | ||||
| 32 | Lanzhou University | 18 | 19 | 11 | ||
| 33 | Minzu University of China | 33 | ||||
| 34 | Ocean University of China | 34 | ||||
References
- Johnes, J. Data Envelopment Analysis and Its Application to the Measurement of Efficiency in Higher Education. Econ. Educ. Rev. 2006, 25, 273–288. [Google Scholar] [CrossRef] [Green Version]
- Charnes, A.; Cooper, W.W.; Rhodes, E. Measuring the Efficiency of Decision Making Units. Eur. J. Oper. Res. 1978, 2, 429–444. [Google Scholar] [CrossRef]
- Lee, B.L.; Worthington, A.C. A Network DEA Quantity and Quality-Orientated Production Model: An Application to Australian University Research Services. Omega 2016, 60, 26–33. [Google Scholar] [CrossRef] [Green Version]
- El Gibari, S.; Gomez, T.; Ruiz, F. Combining Reference Point Based Composite Indicators with Data Envelopment Analysis: Application to the Assessment of Universities. Scientometrics 2022, 127, 4363–4395. [Google Scholar] [CrossRef]
- Singh, A.P.; Yadav, S.P.; Tyagi, P. Performance Assessment of Higher Educational Institutions in India Using Data Envelopment Analysis and Re-Evaluation of NIRF Rankings. Int. J. Syst. Assur. Eng. Manag. 2022, 13, 1024–1035. [Google Scholar] [CrossRef]
- Johnes, J. Measuring Teaching Efficiency in Higher Education: An Application of Data Envelopment Analysis to Economics Graduates from UK Universities 1993. Eur. J. Oper. Res. 2006, 174, 443–456. [Google Scholar] [CrossRef]
- Wijesundara, W.M.T.H.; Prabodanie, R.A.R. Relative Efficiencies of the State Universities in Sri Lanka: Can They Enroll More Students? Int. J. Educ. Manag. 2022, 36, 1284–1296. [Google Scholar] [CrossRef]
- Johnes, J.; Li, Y.U. Measuring the Research Performance of Chinese Higher Education Institutions Using Data Envelopment Analysis. China Econ. Rev. 2008, 19, 679–696. [Google Scholar] [CrossRef] [Green Version]
- Contreras, I.; Lozano, S. Allocating Additional Resources to Public Universities. A DEA Bargaining Approach. Socio-Econ. Plan. Sci. 2020, 71, 100752. [Google Scholar] [CrossRef]
- Ma, D.; Li, X. Allocation Efficiency of Higher Education Resources in China. Int. J. Emerg. Technol. Learn. 2021, 16, 59–71. [Google Scholar] [CrossRef]
- Song, Y.; Schubert, T.; Liu, H.; Yang, G. Measuring Scientific Productivity in China Using Malmquist Productivity Index. J. Data Info. Sci. 2019, 4, 32–59. [Google Scholar] [CrossRef] [Green Version]
- Xiong, X.; Yang, G.; Zhou, D.; Wang, Z. How to Allocate Multi-Period Research Resources? Centralized Resource Allocation for Public Universities in China Using a Parallel DEA-Based Approach. Socio-Econ. Plan. Sci. 2022, 82, 101317. [Google Scholar] [CrossRef]
- Abbott, M.; Doucouliagos, C. The Efficiency of Australian Universities: A Data Envelopment Analysis. Econ. Educ. Rev. 2003, 22, 89–97. [Google Scholar] [CrossRef]
- Yaisawarng, S.; Ng, Y.C. The Impact of Higher Education Reform on Research Performance of Chinese Universities. China Econ. Rev. 2014, 31, 94–105. [Google Scholar] [CrossRef]
- Thanassoulis, E.; Kortelainen, M.; Johnes, G.; Johnes, J. Costs and Efficiency of Higher Education Institutions in England: A DEA Analysis. J. Oper. Res. Soc. 2011, 62, 1282–1297. [Google Scholar] [CrossRef] [Green Version]
- Sun, Y.; Wang, D.; Yang, F.; Ang, S. Efficiency Evaluation of Higher Education Systems in China: A Double Frontier Parallel DEA Model. Comput. Ind. Eng. 2023, 176, 108979. [Google Scholar] [CrossRef]
- Ma, Z.; See, K.F.; Yu, M.-M.; Zhao, C. Research Efficiency Analysis of China’s University Faculty Members: A Modified Meta-Frontier DEA Approach. Socio-Econ. Plan. Sci. 2021, 76, 100944. [Google Scholar] [CrossRef]
- Tavares, R.S.; Angulo-Meza, L.; Sant’Anna, A.P. A Proposed Multistage Evaluation Approach for Higher Education Institutions Based on Network Data Envelopment Analysis: A Brazilian Experience. Eval. Program Plan. 2021, 89, 101984. [Google Scholar] [CrossRef]
- Zhang, C.; Jiang, N.; Su, T.; Chen, J.; Streimikiene, D.; Balezentis, T. Spreading Knowledge and Technology: Research Efficiency at Universities Based on the Three-Stage MCDM-NRSDEA Method with Bootstrapping. Technol. Soc. 2022, 68, 101915. [Google Scholar] [CrossRef]
- Johnes, G.; Johnes, J.; Thanassoulis, E. An Analysis of Costs in Institutions of Higher Education in England. Stud. High. Educ. 2008, 33, 527–549. [Google Scholar] [CrossRef] [Green Version]
- Johnes, J. Efficiency and Productivity Change in the English Higher Education Sector from 1996/97 to 2004/5. Manch. Sch. 2008, 76, 653–674. [Google Scholar] [CrossRef] [Green Version]
- Andersson, C.; Antelius, J.; Mansson, J.; Sund, K. Technical Efficiency and Productivity for Higher Education Institutions in Sweden. Scand. J. Educ. Res. 2017, 61, 205–223. [Google Scholar] [CrossRef]
- Johnes, G.; Virmani, S. The Efficiency of Private and Public Schools in Urban and Rural Areas: Moving beyond the Development Goals. Int. Trans. Oper. Res. 2020, 27, 1869–1885. [Google Scholar] [CrossRef] [Green Version]
- Zhao, L.-T.; Wang, D.-S.; Liang, F.-Y.; Chen, J. A Recommendation System for Effective Learning Strategies: An Integrated Approach Using Context-Dependent DEA. Expert Syst. Appl. 2023, 211, 118535. [Google Scholar] [CrossRef]
- Agasisti, T.; Egorov, A.; Maximova, M. Do Merger Policies Increase Universities’ Efficiency? Evidence from a Fuzzy Regression Discontinuity Design. Appl. Econ. 2021, 53, 185–204. [Google Scholar] [CrossRef]
- Papadimitriou, M.; Johnes, J. Does Merging Improve Efficiency? A Study of English Universities. Stud. High. Educ. 2019, 44, 1454–1474. [Google Scholar] [CrossRef] [Green Version]
- Firsova, A.A.; Chernyshova, G.Y. Mathematical Models for Evaluation of the Higher Education System Functions with DEA Approach. Izv. Sarat. Univ. Novaya Ser.-Mat. Mekhan. Inform. 2019, 19, 351–362. [Google Scholar] [CrossRef]
- Agasisti, T.; Egorov, A.; Zinchenko, D.; Leshukov, O. Efficiency of Regional Higher Education Systems and Regional Economic Short-Run Growth: Empirical Evidence from Russia. Ind. Innov. 2021, 28, 507–534. [Google Scholar] [CrossRef]
- Wu, J.; Zhang, G.; Zhu, Q.; Zhou, Z. An Efficiency Analysis of Higher Education Institutions in China from a Regional Perspective Considering the External Environmental Impact. Scientometrics 2020, 122, 57–70. [Google Scholar] [CrossRef]
- Agasisti, T.; Yang, G.; Song, Y.; Tran, C.-T.T.D. Evaluating the Higher Education Productivity of Chinese and European “Elite” Universities Using a Meta-Frontier Approach. Scientometrics 2021, 126, 5819–5853. [Google Scholar] [CrossRef]
- Chu Ng, Y.; Li, S.K. Measuring the Research Performance of Chinese Higher Education Institutions: An Application of Data Envelopment Analysis. Educ. Econ. 2000, 8, 139–156. [Google Scholar] [CrossRef]
- Jiang, J.; Lee, S.K.; Rah, M.-J. Assessing the Research Efficiency of Chinese Higher Education Institutions by Data Envelopment Analysis. Asia Pacific Educ. Rev. 2020, 21, 423–440. [Google Scholar] [CrossRef]
- Yang, G.; Fukuyama, H.; Song, Y. Measuring the Inefficiency of Chinese Research Universities Based on a Two-Stage Network DEA Model. J. Informetr. 2018, 12, 10–30. [Google Scholar] [CrossRef]
- An, Q.; Wang, Z.; Emrouznejad, A.; Zhu, Q.; Chen, X. Efficiency Evaluation of Parallel Interdependent Processes Systems: An Application to Chinese 985 Project Universities. Int. J. Prod. Res. 2019, 57, 5387–5399. [Google Scholar] [CrossRef]
- Banker, R.D.; Charnes, A.; Cooper, W.W. Some Models for Estimating Technical and Scale Inefficiencies in Data Envelopment Analysis. Manag. Sci. 1984, 30, 1078–1092. [Google Scholar] [CrossRef] [Green Version]
- Malmquist, S. Index Numbers and Indifference Surfaces. Trab. De Estad. 1953, 4, 209–242. [Google Scholar] [CrossRef]
- Färe, R.; Grosskopf, S.; Lindgren, B.; Roos, P. Productivity Changes in Swedish Pharamacies 1980–1989: A Non-Parametric Malmquist Approach. J. Prod. Anal. 1992, 3, 85–101. [Google Scholar] [CrossRef]
- Caves, D.W.; Christensen, L.R.; Diewert, W.E. The Economic Theory of Index Numbers and the Measurement of Input, Output, and Productivity. Econometrica 1982, 50, 1393–1414. [Google Scholar] [CrossRef]
- Charnes, A.; Cooper, W.W.; Rhodes, E. Evaluating Program and Managerial Efficiency: An Application of Data Envelopment Analysis to Program Follow Through. Manag. Sci. 1981, 27, 668–697. [Google Scholar] [CrossRef]
- Wang, K.; Zhu, C. MOOC-Based Flipped Learning in Higher Education: Students’ Participation, Experience and Learning Performance. Int. J. Educ. Technol. High Educ. 2019, 16, 33. [Google Scholar] [CrossRef] [Green Version]
- Mirmozaffari, M.; Shadkam, E.; Khalili, S.M.; Kabirifar, K.; Yazdani, R.; Asgari Gashteroodkhani, T. A Novel Artificial Intelligent Approach: Comparison of Machine Learning Tools and Algorithms Based on Optimization DEA Malmquist Productivity Index for Eco-Efficiency Evaluation. Int. J. Energy Sect. Manag. 2021, 15, 523–550. [Google Scholar] [CrossRef]
- Mirmozaffari, M.; Yazdani, M.; Boskabadi, A.; Dolatsara, H.A.; Kabirifar, K.; Golilarz, N.A. A Novel Machine Learning Approach Combined with Optimization Models for Eco-Efficiency Evaluation. Appl. Sci. 2020, 10, 5210. [Google Scholar] [CrossRef]
- Sun, S.; Zhang, N.-N.; Liu, J.-B. Study on the Rural Revitalization and Urban-Rural Integration Efficiency in Anhui Province Based on Game Cross-Efficiency DEA Model. Comput. Intell. Neurosci. 2022, 2022, 7373435. [Google Scholar] [CrossRef] [PubMed]
- Andrews, A. An Application of PCA-DEA with the Double-Bootstrap Approach to Estimate the Technical Efficiency of New Zealand District Health Boards. Health Econ. Policy Law 2022, 17, 175–199. [Google Scholar] [CrossRef] [PubMed]


| Model | Input | Output |
|---|---|---|
| Model 1 | Number of full-time teachers (NOFTT) Total number of students (TNOS) Financial budget (FB) | Number of patent applications (NOPA) Employment rate of undergraduates (EROU) Number of core papers published (NOCPP) |
| Model 2 | Number of full-time teachers (NOFTT) Total number of students (TNOS) Financial budget (FB) | Number of patent applications (NOPA) Employment rate of undergraduates (EROU) Number of core papers published (NOCPP) Number of online MOOCs run (NOMO) Playback times of online MOOCs (PTOOM) |
| Period | Effch | Tech | Pech | Sech | Tfpch |
|---|---|---|---|---|---|
| 2017–2018 | 0.976 | 1.078 | 0.996 | 0.979 | 1.052 |
| 2018–2019 | 1.008 | 1.048 | 0.994 | 1.013 | 1.056 |
| 2019–2020 | 1.030 | 0.928 | 0.989 | 1.042 | 0.956 |
| 2020–2021 | 0.975 | 1.075 | 0.995 | 0.981 | 1.049 |
| Mean | 0.997 | 1.030 | 0.993 | 1.003 | 1.027 |
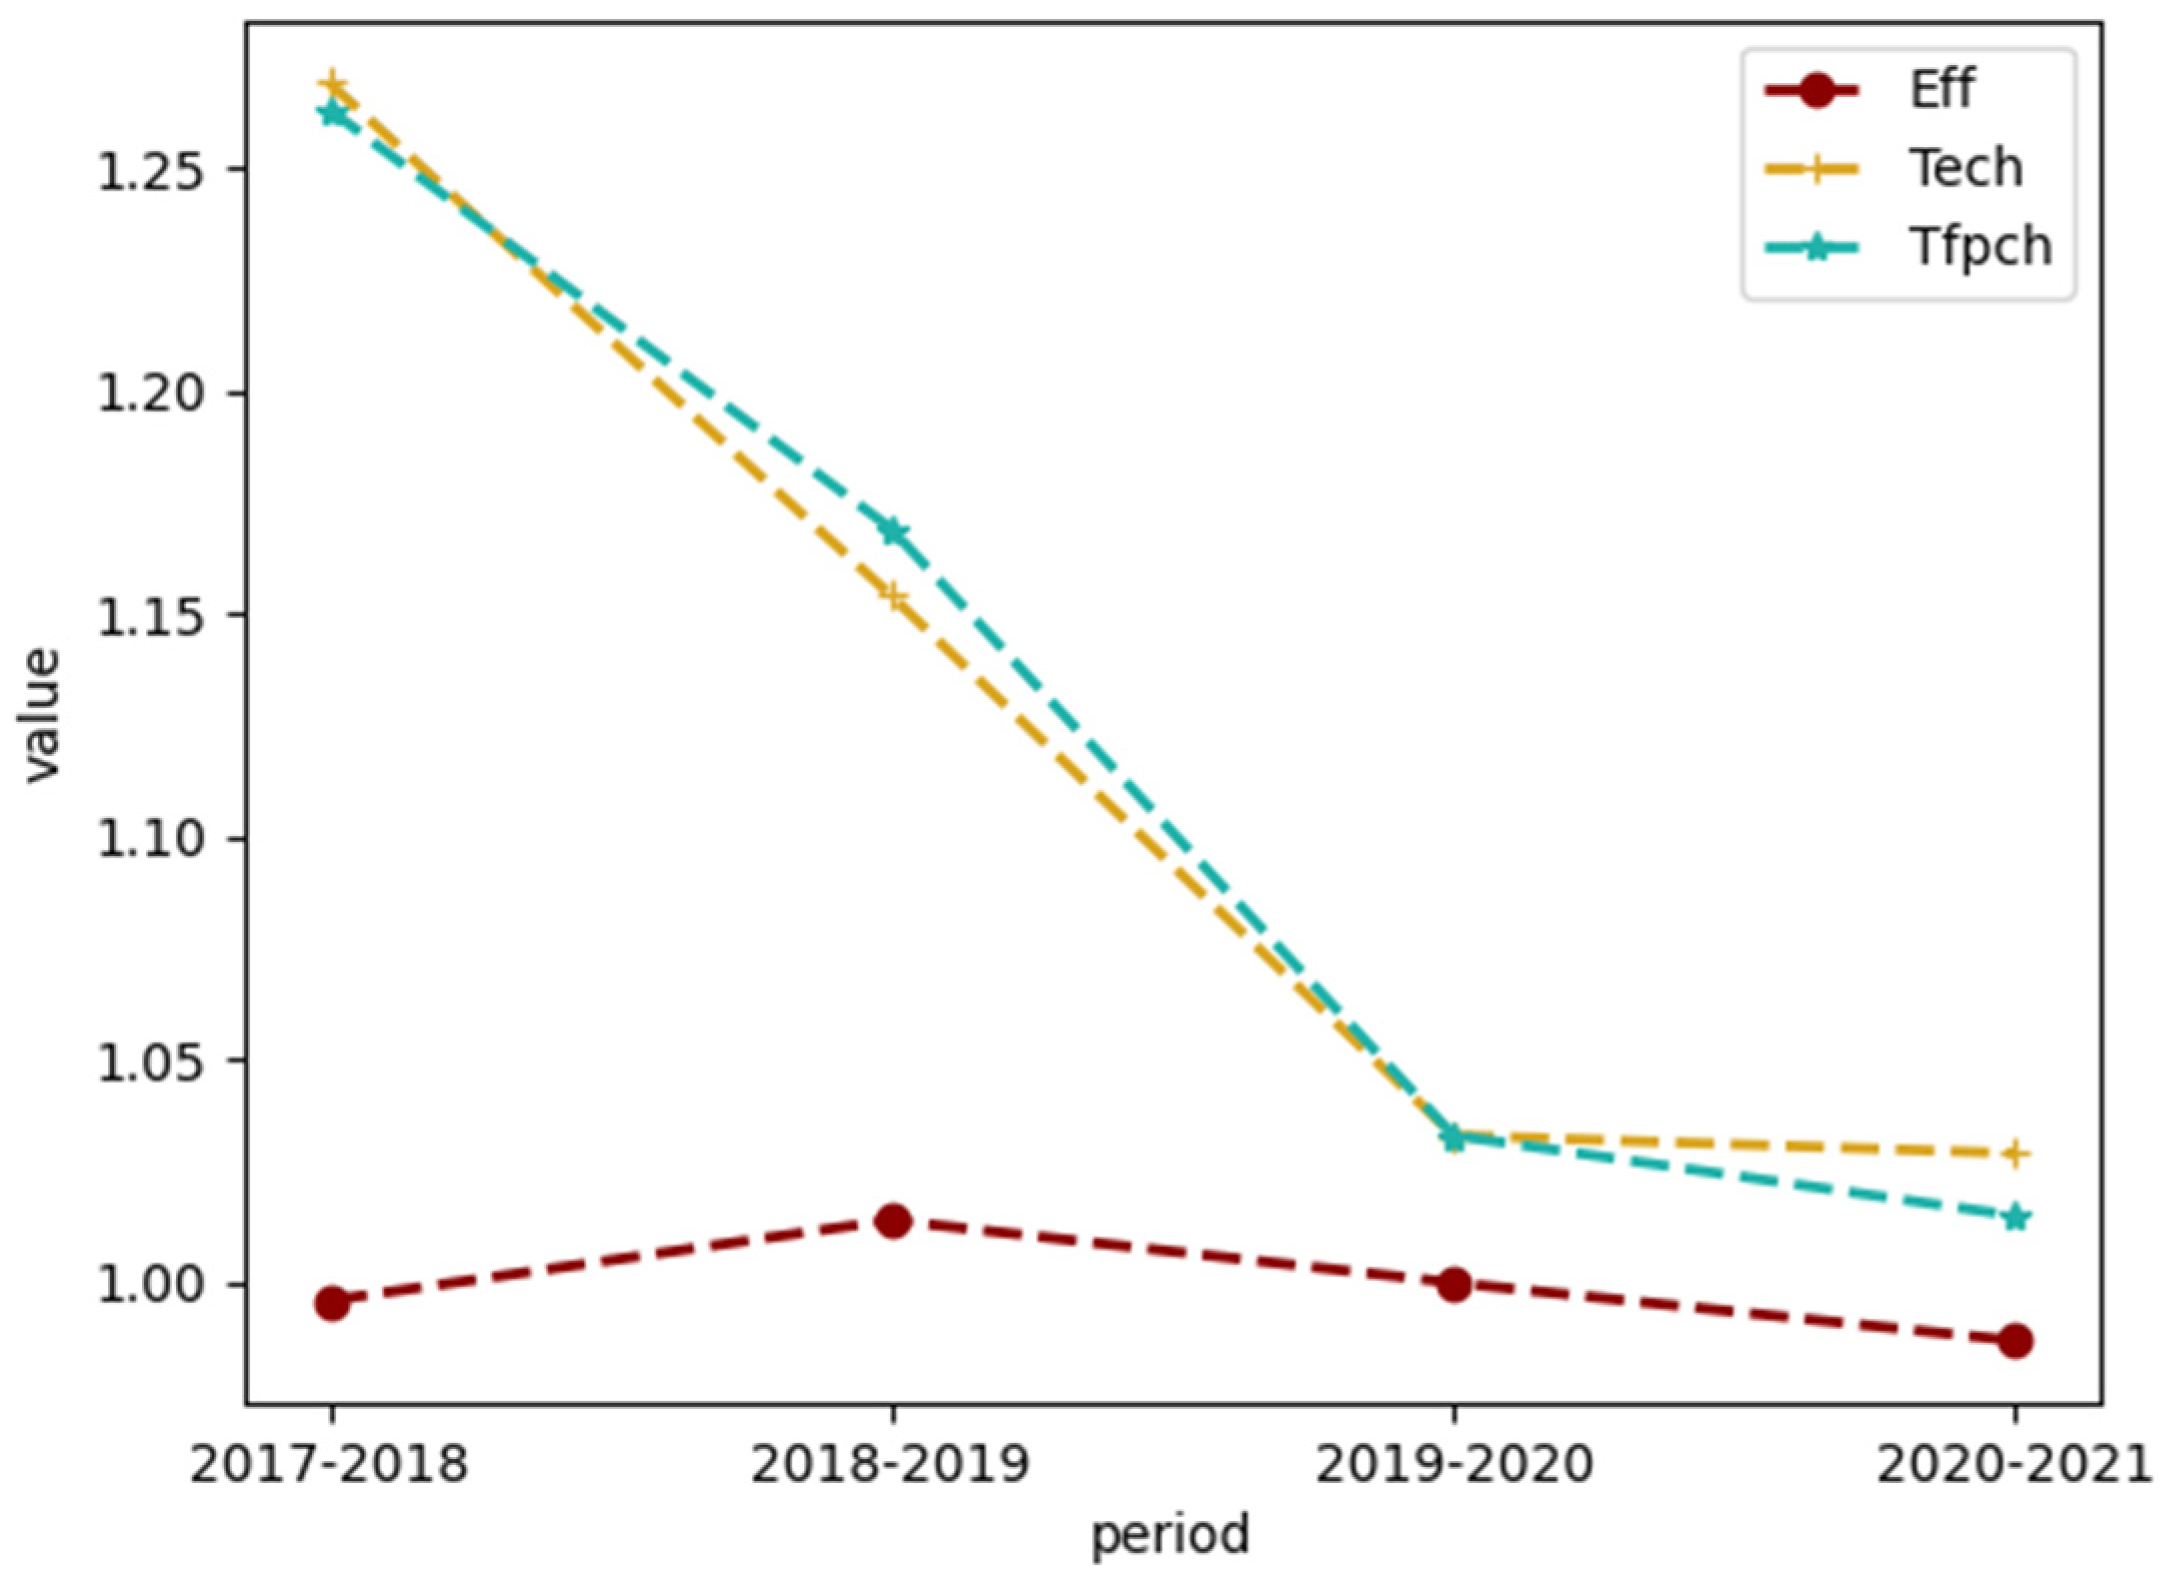
| Period | Effch | Tech | Pech | Sech | Tfpch |
|---|---|---|---|---|---|
| 2017–2018 | 0.996 | 1.269 | 0.996 | 1 | 1.263 |
| 2018–2019 | 1.014 | 1.154 | 0.996 | 1.018 | 1.169 |
| 2019–2020 | 1 | 1.033 | 0.99 | 1.011 | 1.033 |
| 2020–2021 | 0.987 | 1.029 | 0.997 | 0.99 | 1.015 |
| Mean | 0.999 | 1.117 | 0.994 | 1.005 | 1.116 |
| Indicators | Kruskal-Wallis H (K) | df | p-Value |
|---|---|---|---|
| Tfpch | 21.273 | 1 | 0.000004 |
| Eff | 0.432 | 1 | 0.511 |
| Tech | 21.956 | 1 | 0.000003 |
| Group | Crste | Vrste | Scale |
|---|---|---|---|
| A | 0.9735 | 0.988875 | 0.983125 |
| B | 0.865435 | 0.966913 | 0.89213 |
| C | 0.914667 | 0.941667 | 0.97 |
| Kruskal–Wallis H (K) | df | p-Value |
|---|---|---|
| 5.427 | 2 | 0.066 |
| University Type | Crste | Vrste | Scale |
|---|---|---|---|
| Comprehensive university | 0.8865 | 0.965346 | 0.915 |
| Professional university | 0.9235 | 0.9845 | 0.938 |
| Kruskal–Wallis H (K) | df | p-Value |
|---|---|---|
| 0.630 | 1 | 0.428 |
| Region | Crste | Vrste | Scale |
|---|---|---|---|
| East | 0.9022 | 0.97885 | 0.91975 |
| Middle | 0.892 | 0.9554 | 0.9298 |
| West | 0.908667 | 0.9635 | 0.942 |
| Northeast | 0.827 | 0.946667 | 0.866 |
| Kruskal–Wallis H (K) | df | p-Value |
|---|---|---|
| 0.548 | 3 | 0.908 |
Disclaimer/Publisher’s Note: The statements, opinions and data contained in all publications are solely those of the individual author(s) and contributor(s) and not of MDPI and/or the editor(s). MDPI and/or the editor(s) disclaim responsibility for any injury to people or property resulting from any ideas, methods, instructions or products referred to in the content. |
© 2023 by the authors. Licensee MDPI, Basel, Switzerland. This article is an open access article distributed under the terms and conditions of the Creative Commons Attribution (CC BY) license (https://creativecommons.org/licenses/by/4.0/).
Share and Cite
Liu, Z.; Xiong, H.; Sun, Y. Will Online MOOCs Improve the Efficiency of Chinese Higher Education Institutions? An Empirical Study Based on DEA. Sustainability 2023, 15, 5970. https://doi.org/10.3390/su15075970
Liu Z, Xiong H, Sun Y. Will Online MOOCs Improve the Efficiency of Chinese Higher Education Institutions? An Empirical Study Based on DEA. Sustainability. 2023; 15(7):5970. https://doi.org/10.3390/su15075970
Chicago/Turabian StyleLiu, Zihong, Haitao Xiong, and Ying Sun. 2023. "Will Online MOOCs Improve the Efficiency of Chinese Higher Education Institutions? An Empirical Study Based on DEA" Sustainability 15, no. 7: 5970. https://doi.org/10.3390/su15075970