
Sustainable Development of Business Economy Based on Big Data Algorithm under the Background of Low-Carbon Economy
Abstract
:1. Introduction
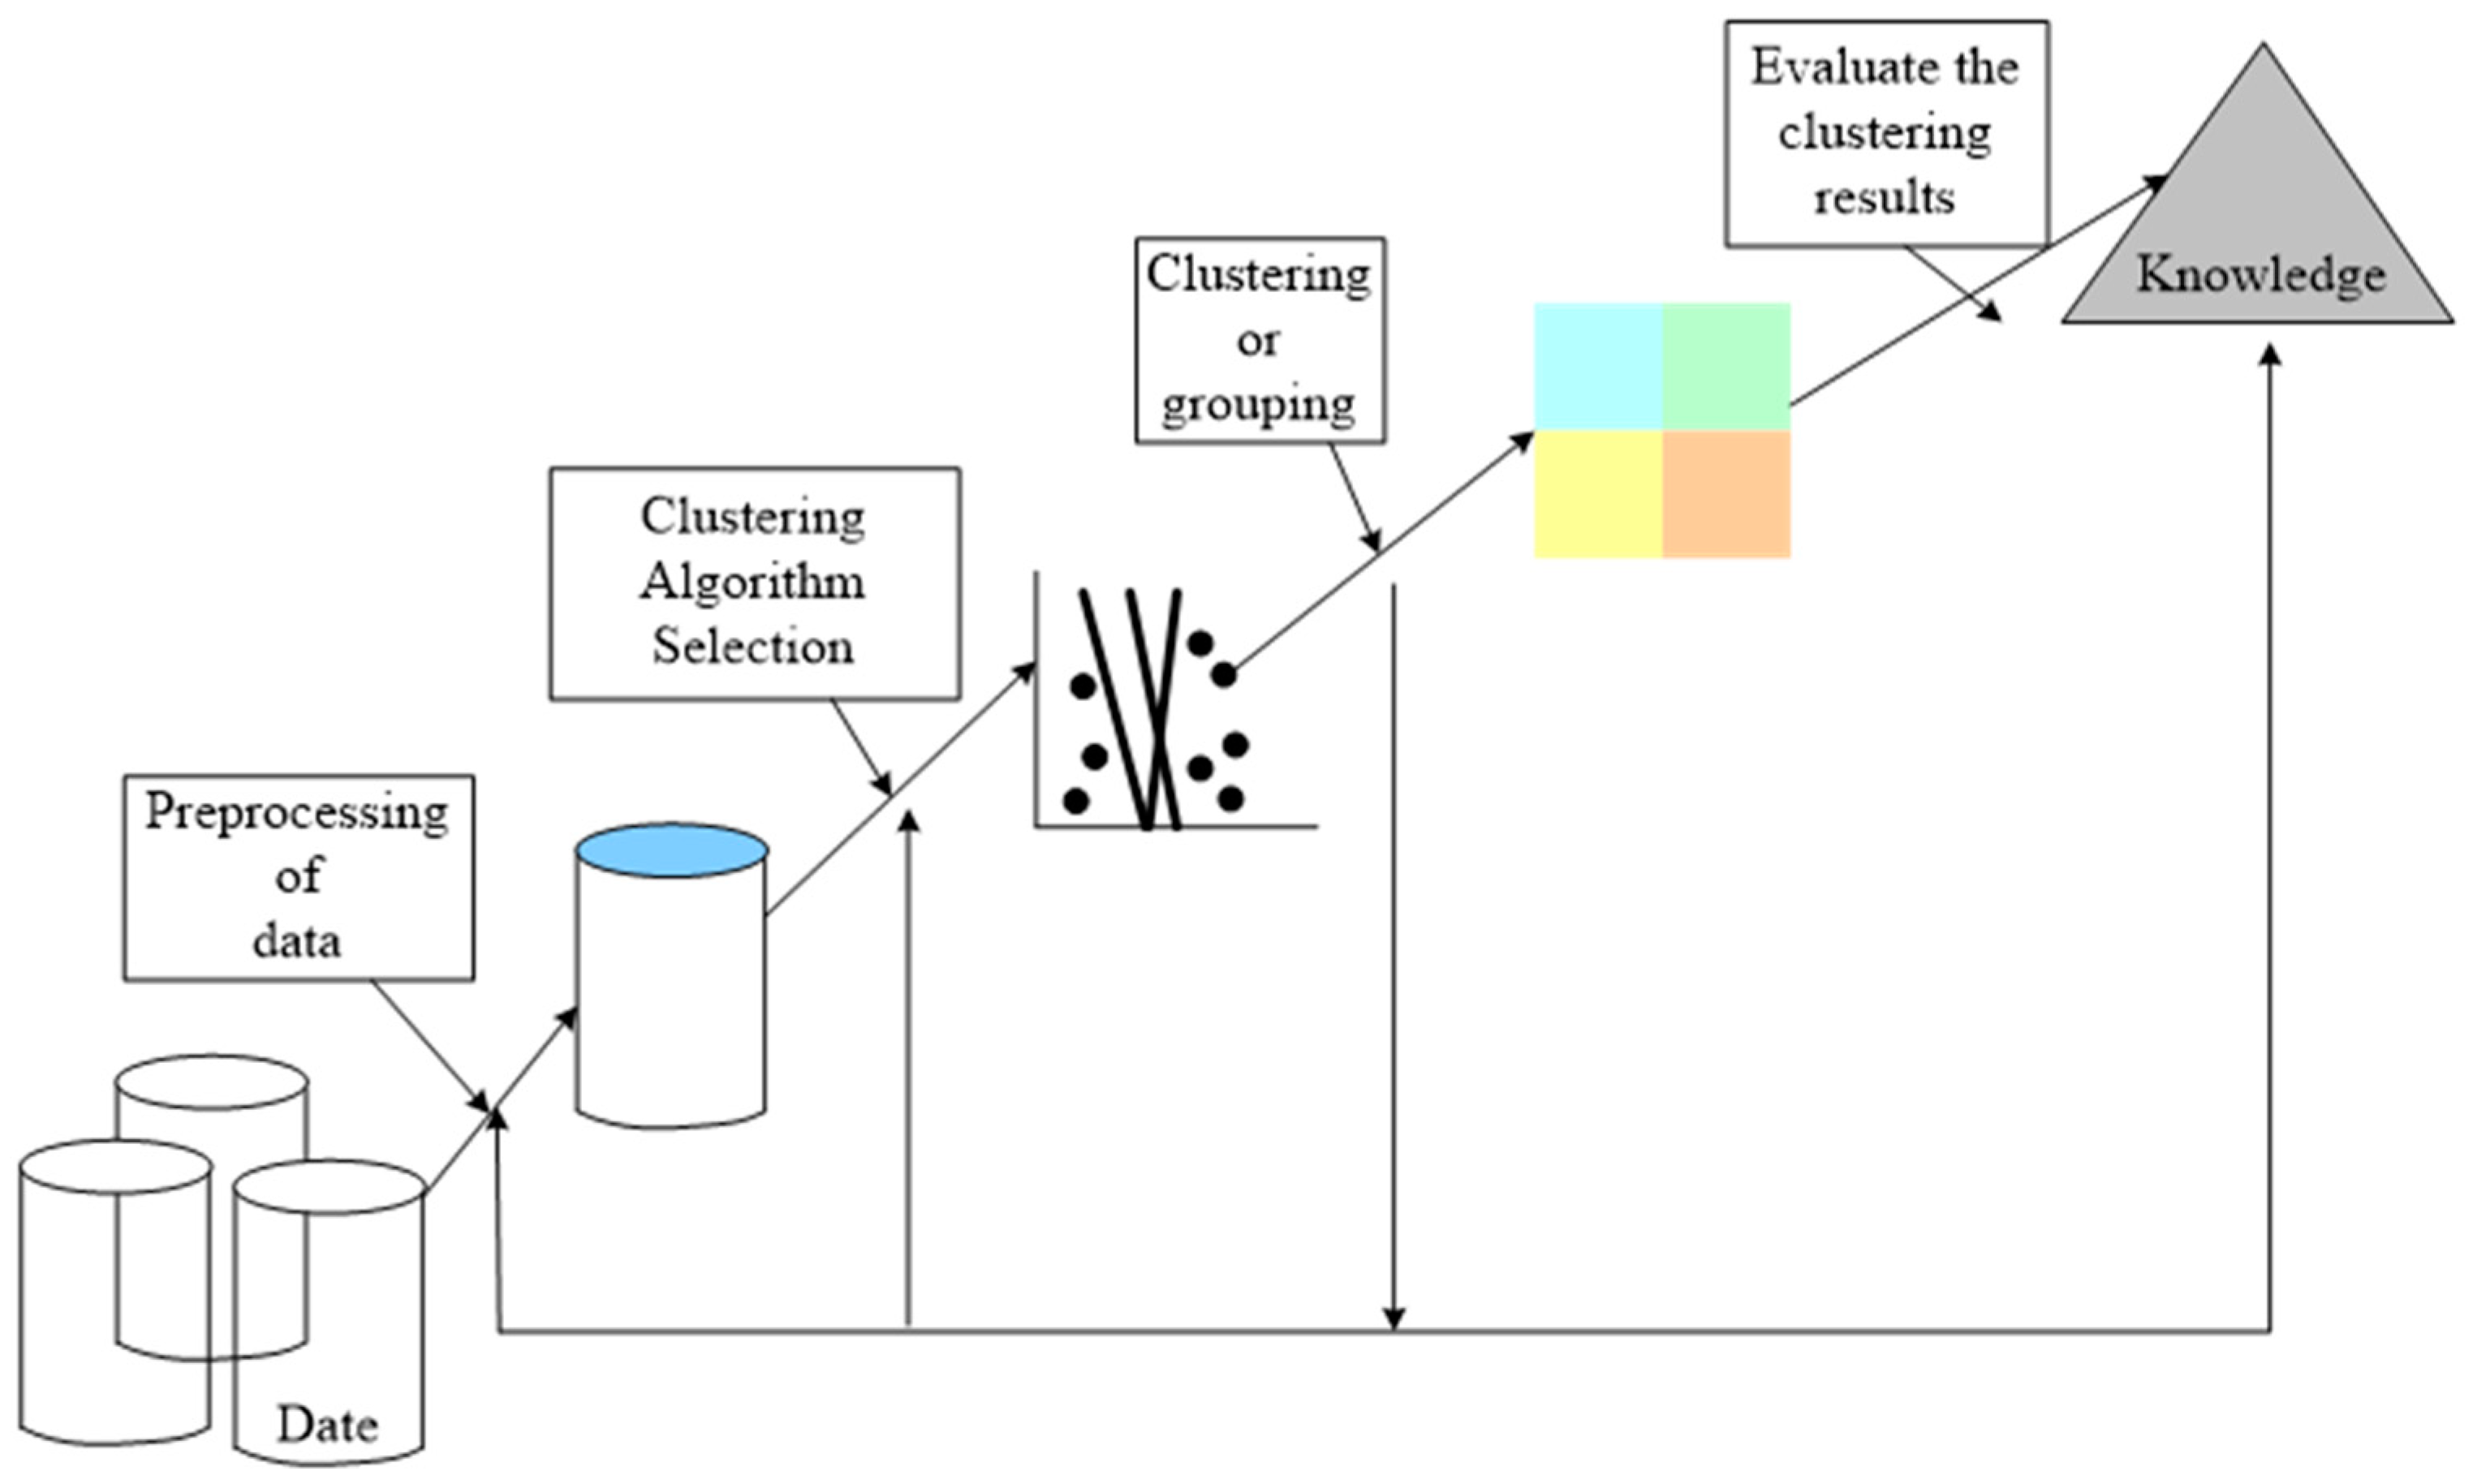
2. CA of Big Data Algorithms
2.1. Similarity Measure between Objects
2.1.1. Distance Metric
2.1.2. Similarity Measurement
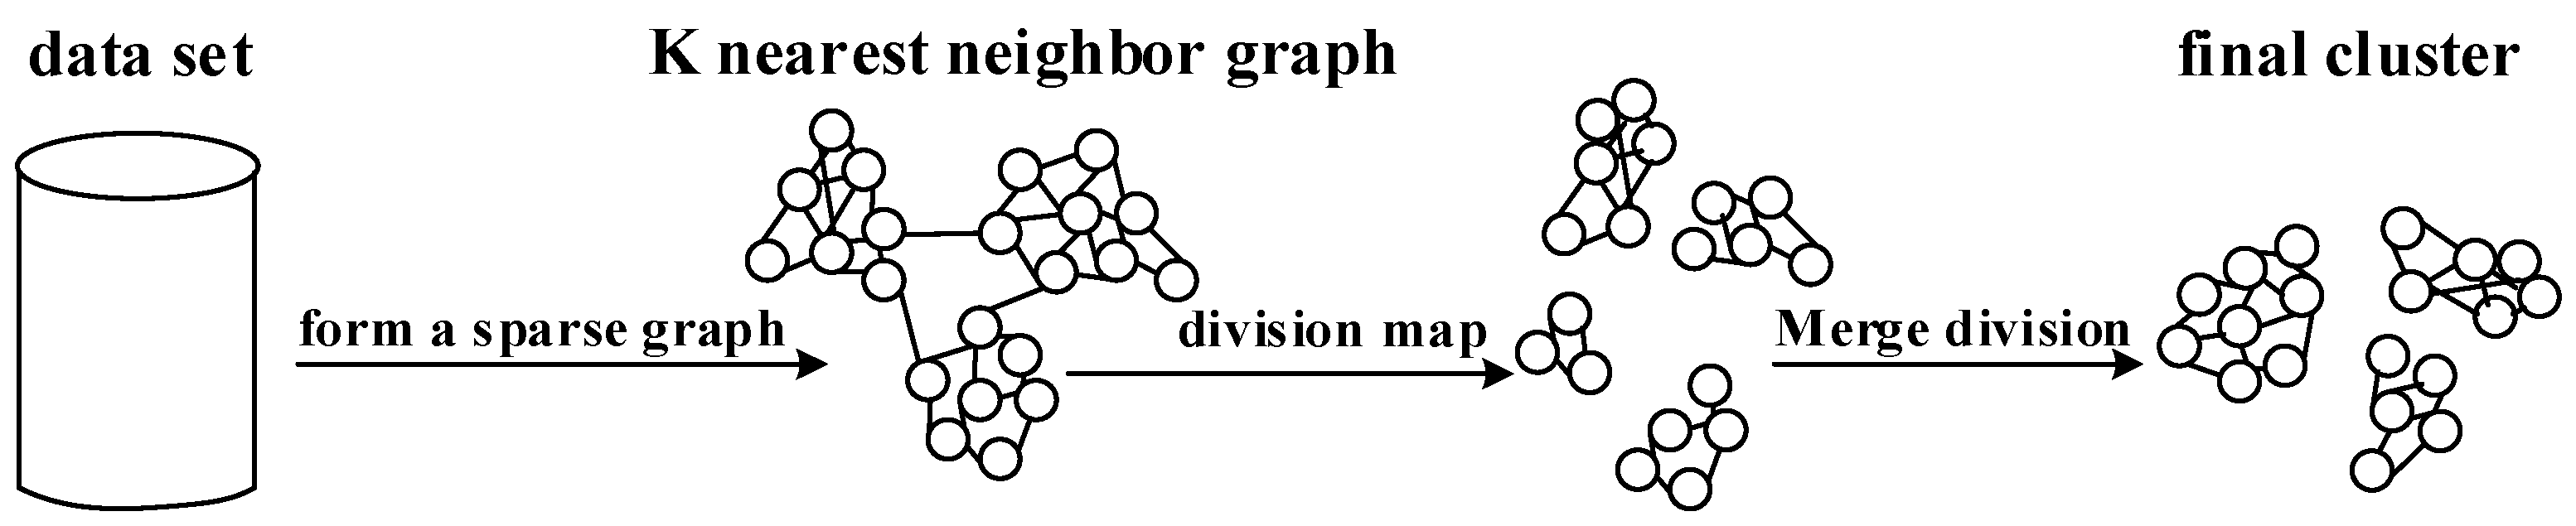
2.2. Hierarchical Clustering
2.3. Clustering Algorithm Evaluation Index
- (1)
- Internal evaluation indicators
- (2)
- External evaluation indicators
- (3)
- Relative evaluation index
2.4. Calculation of Relative Mass of Data Points
3. Sustainable Development of Business Economy Based on Big Data Algorithm
3.1. Theoretical Basis of the LCE and Sustainable Development
3.1.1. Sustainable Development
- (1)
- The idea of sustainable development
- (2)
- Basic principles of sustainable development
- ➀
- The principle of fairness
- ➁
- The principle of continuity
- ➂
- The principle of commonality
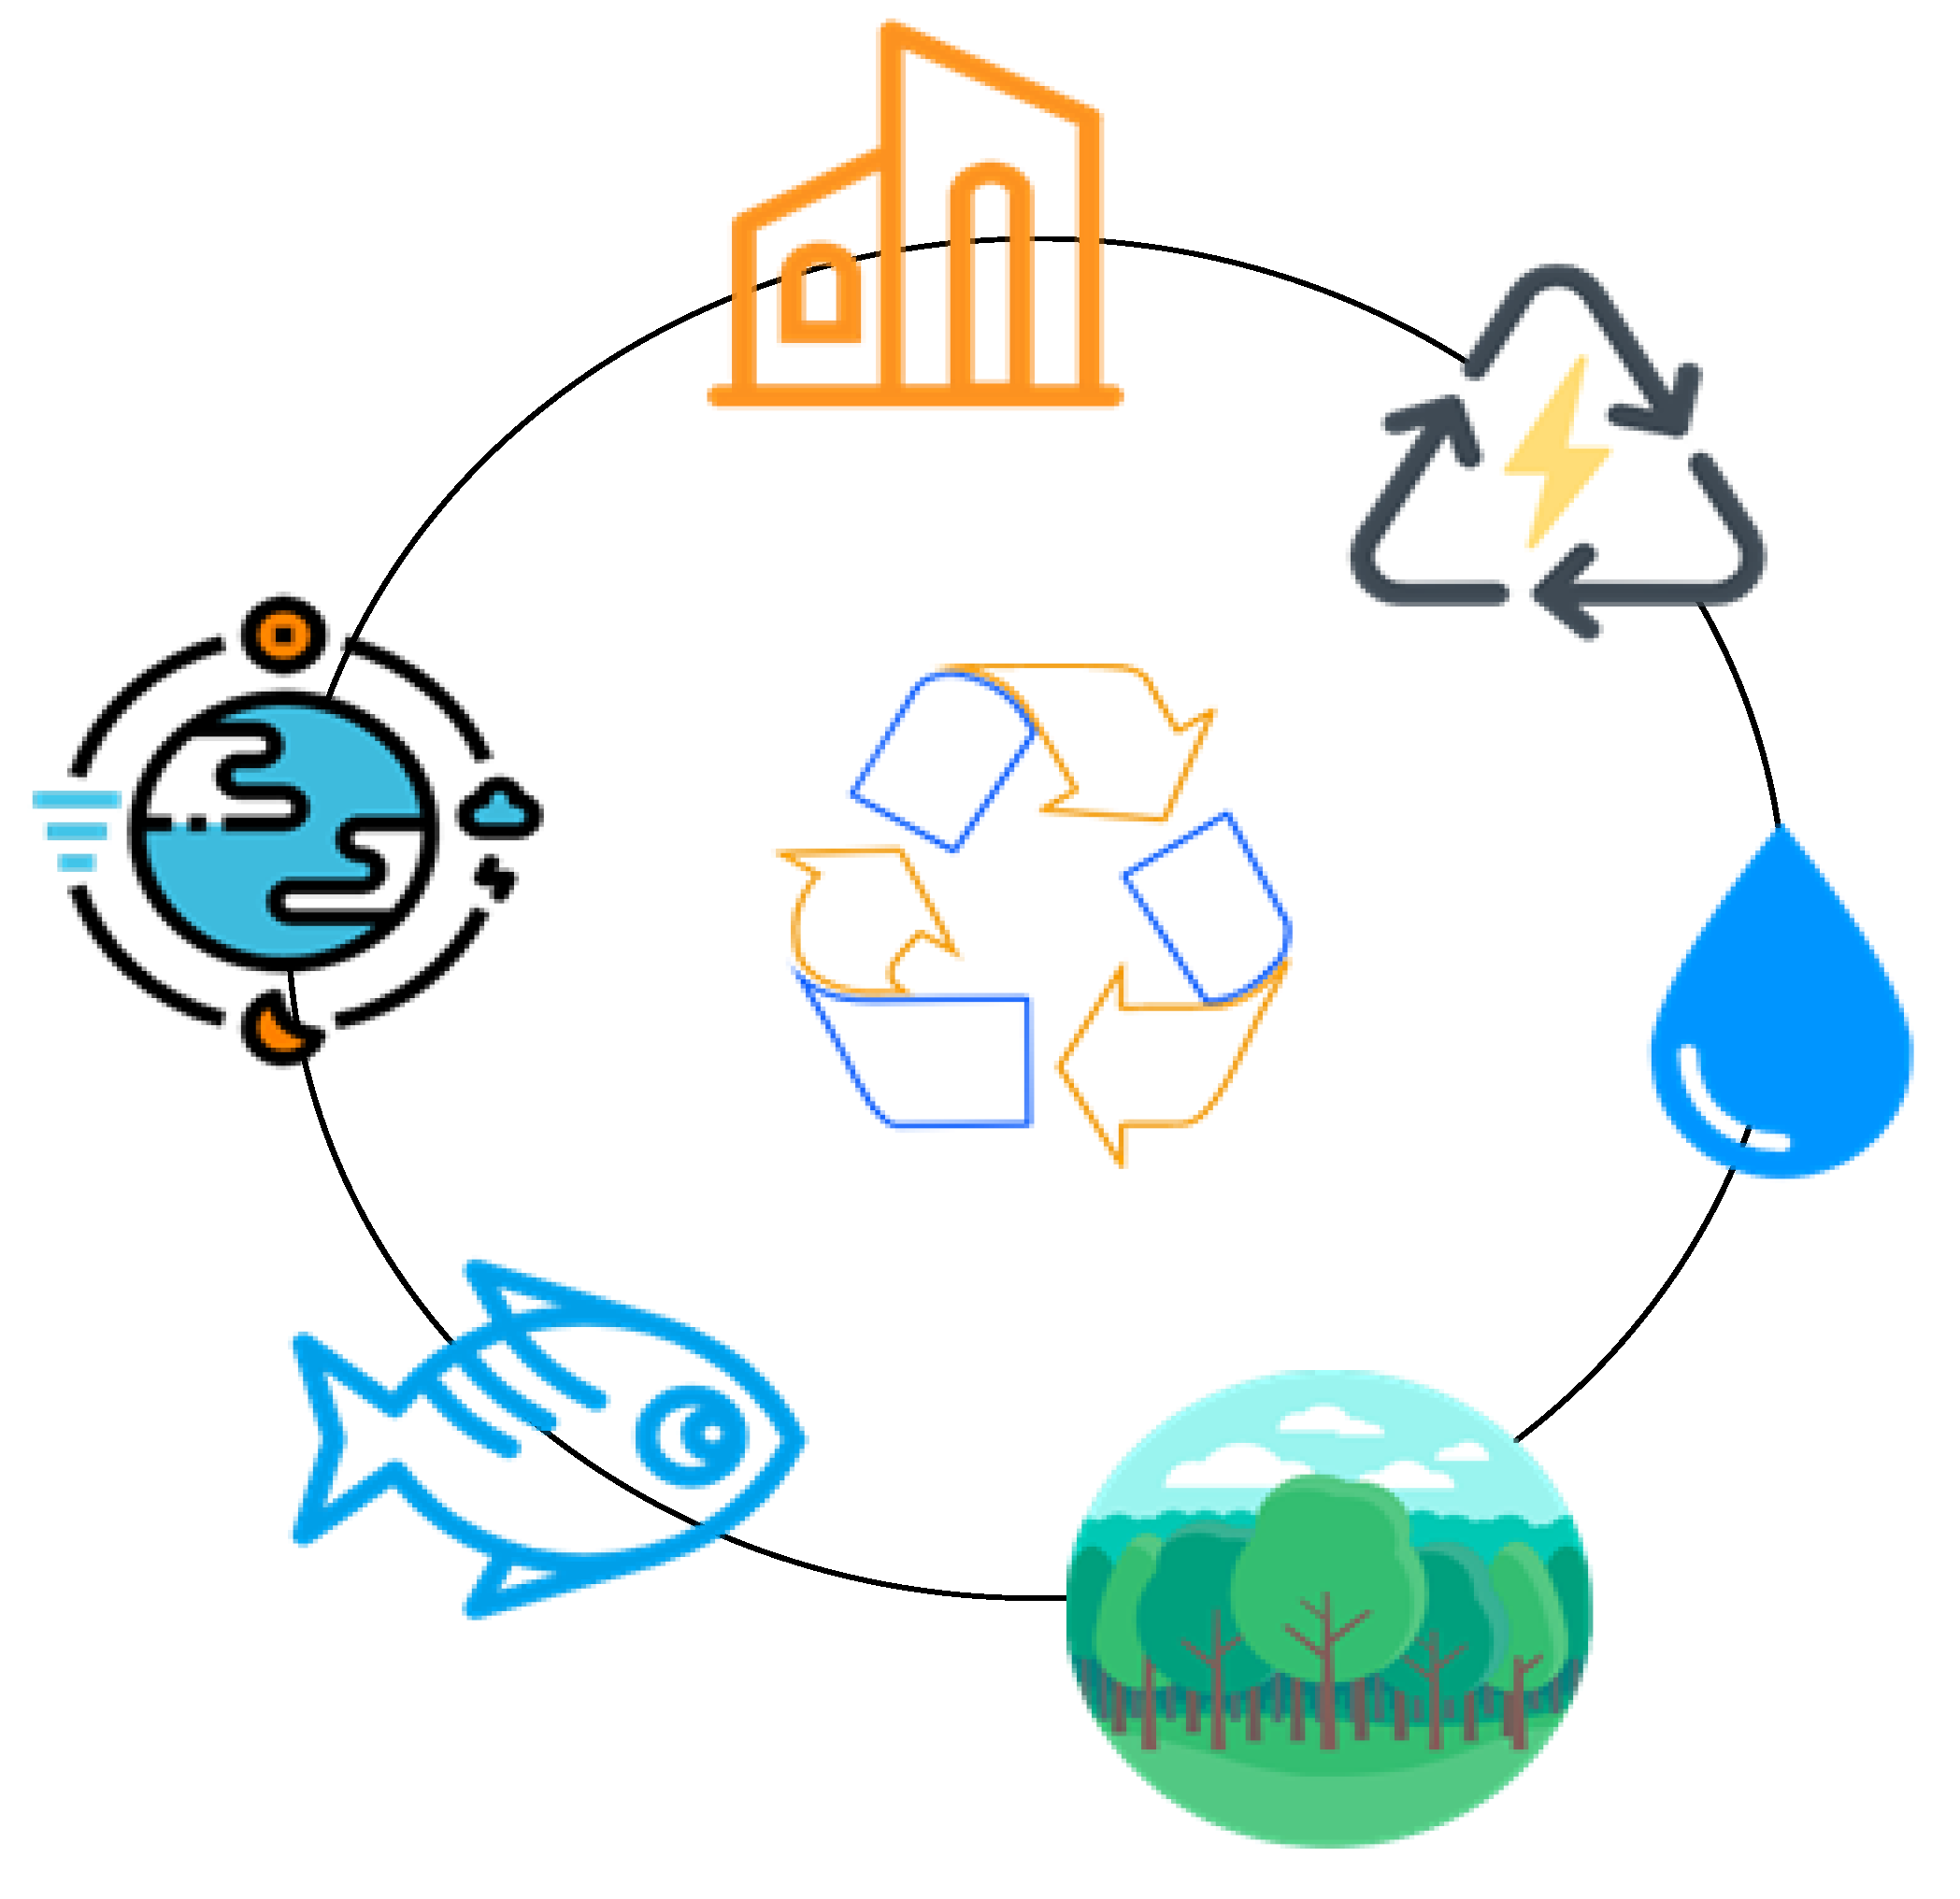
3.1.2. LCE Theory
- (1)
- LCE as the development trend of emerging industries
- (2)
- LCE is the sublation of the traditional industrial development model
- (3)
- The status of the LCE in the future emerging industrial structure
- (4)
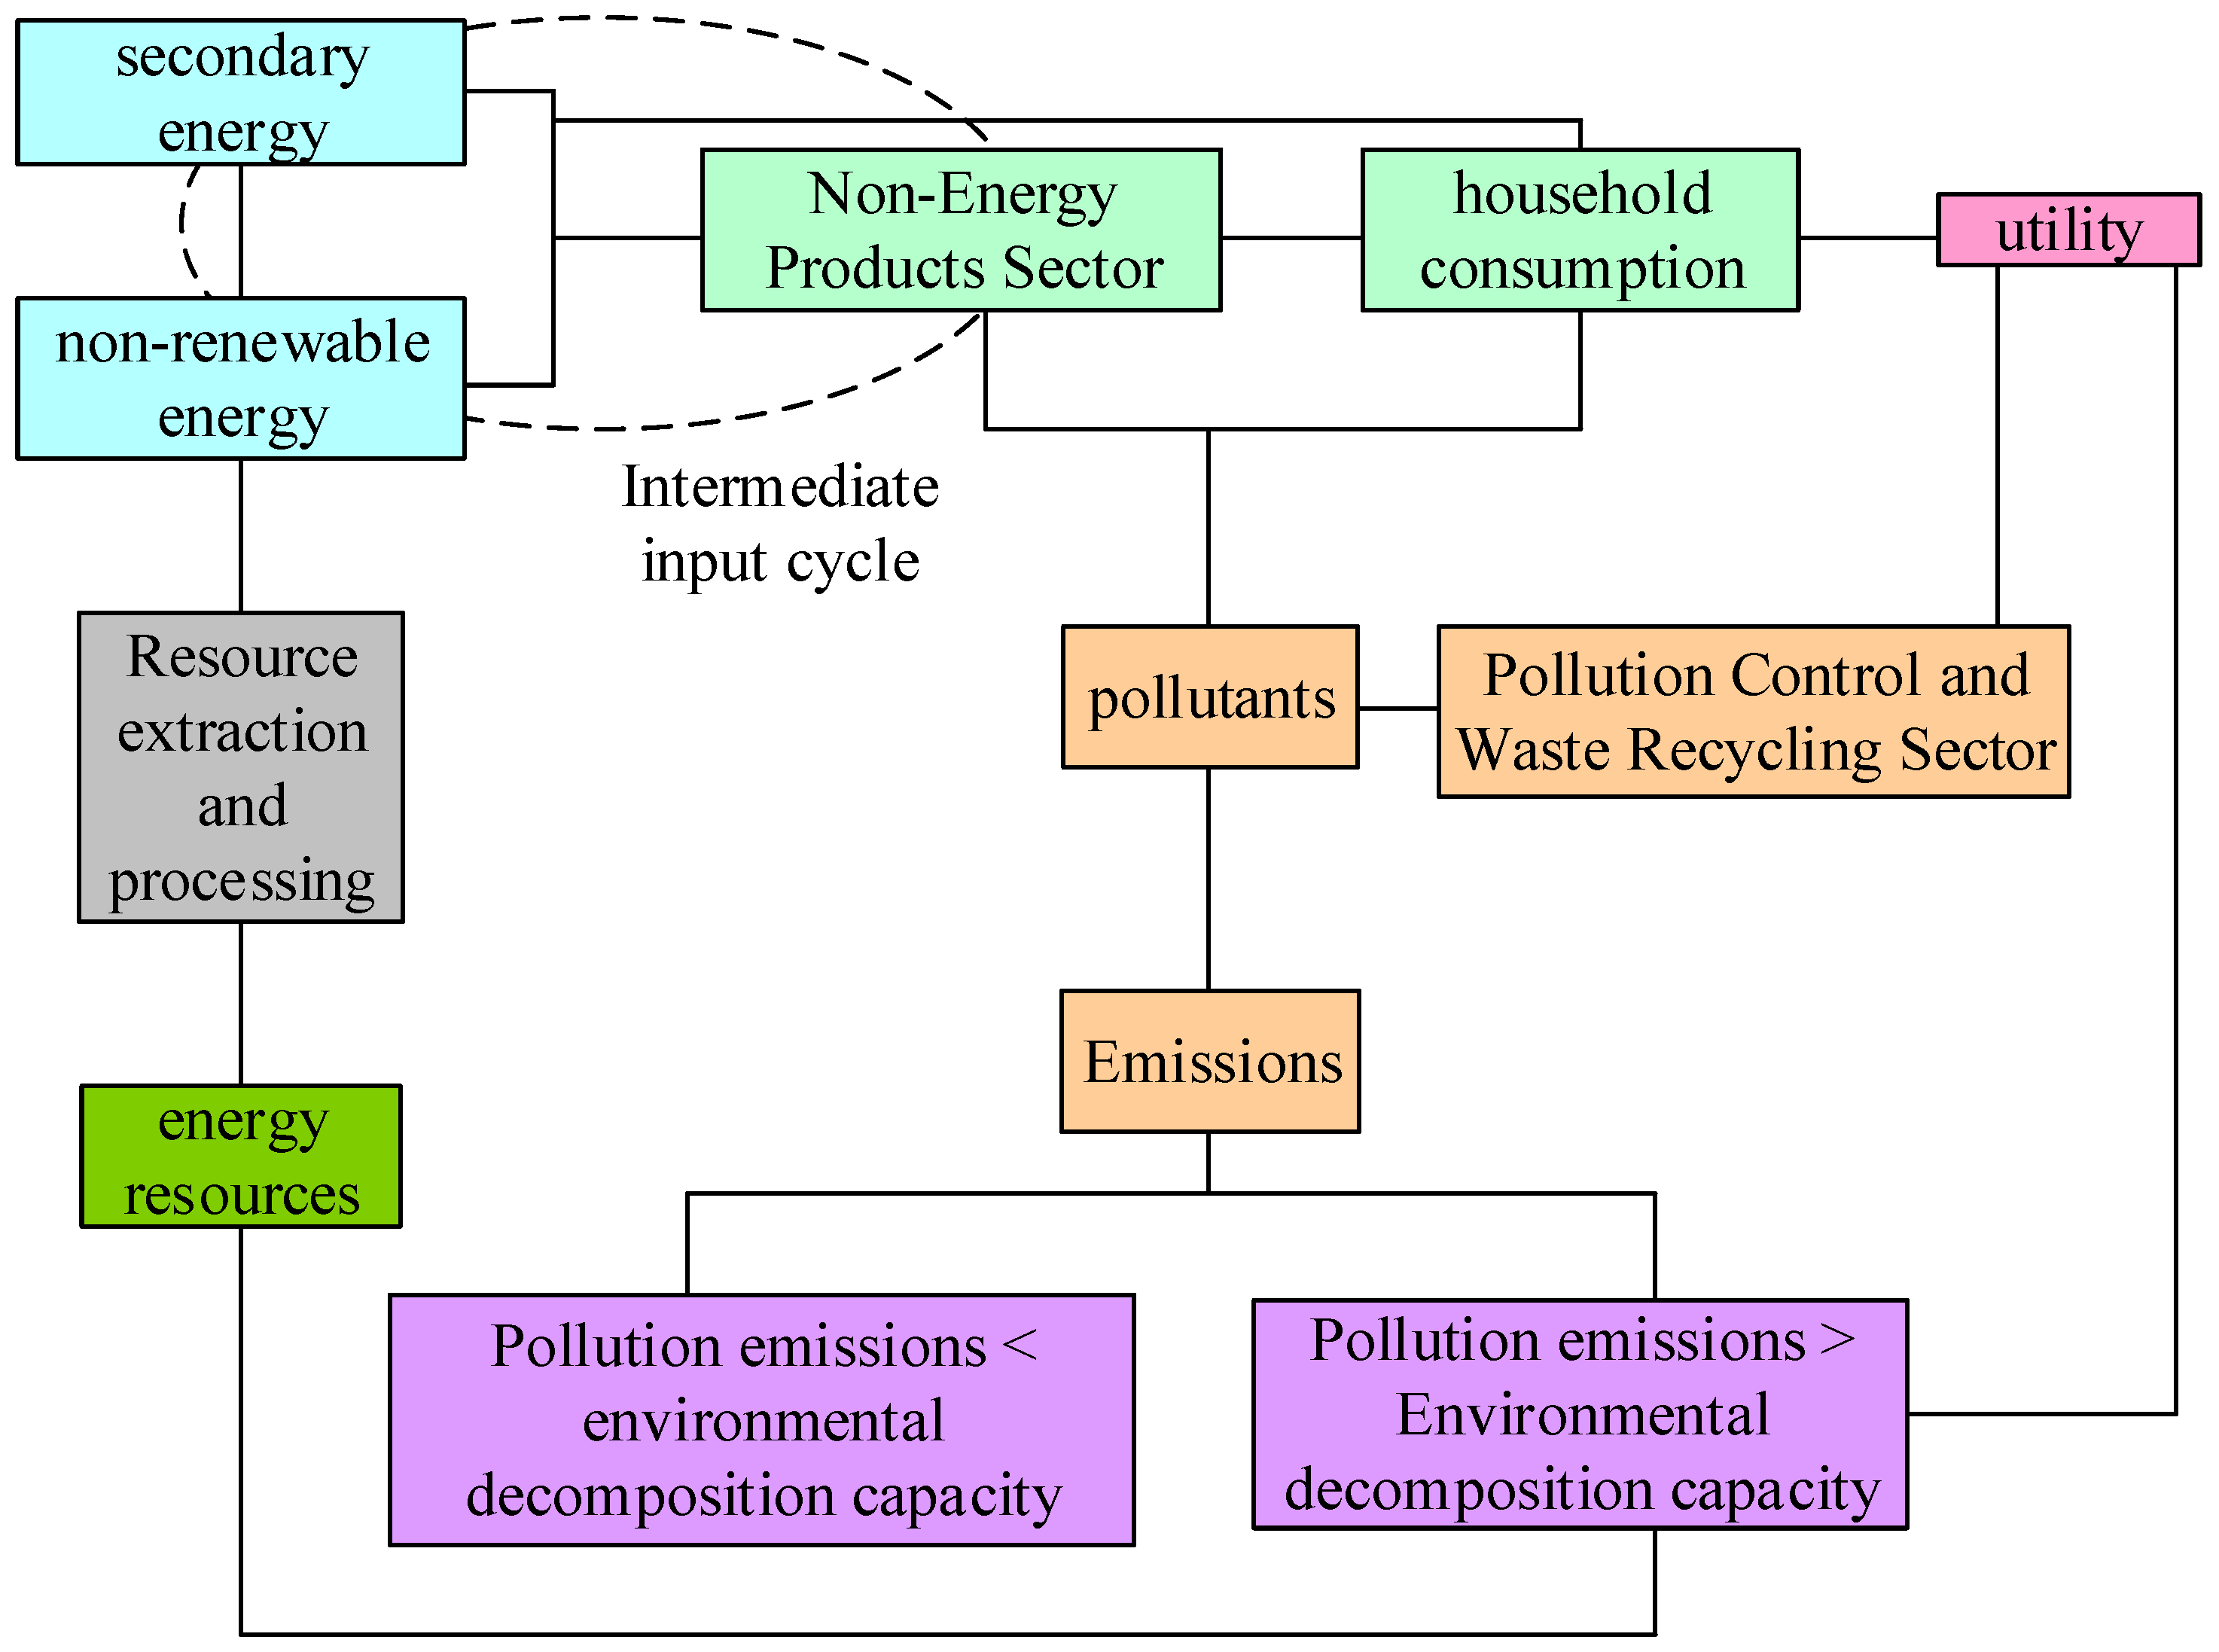
- Economic model of low-carbon economic cycle and operation
3.2. Demonstration of the LCE and the Sustainable Development Index System and Coupled Development
- (2)
- Changes in the low-carbon economic system and sustainable development of a coastal city
3.3. Experimental
- (1)
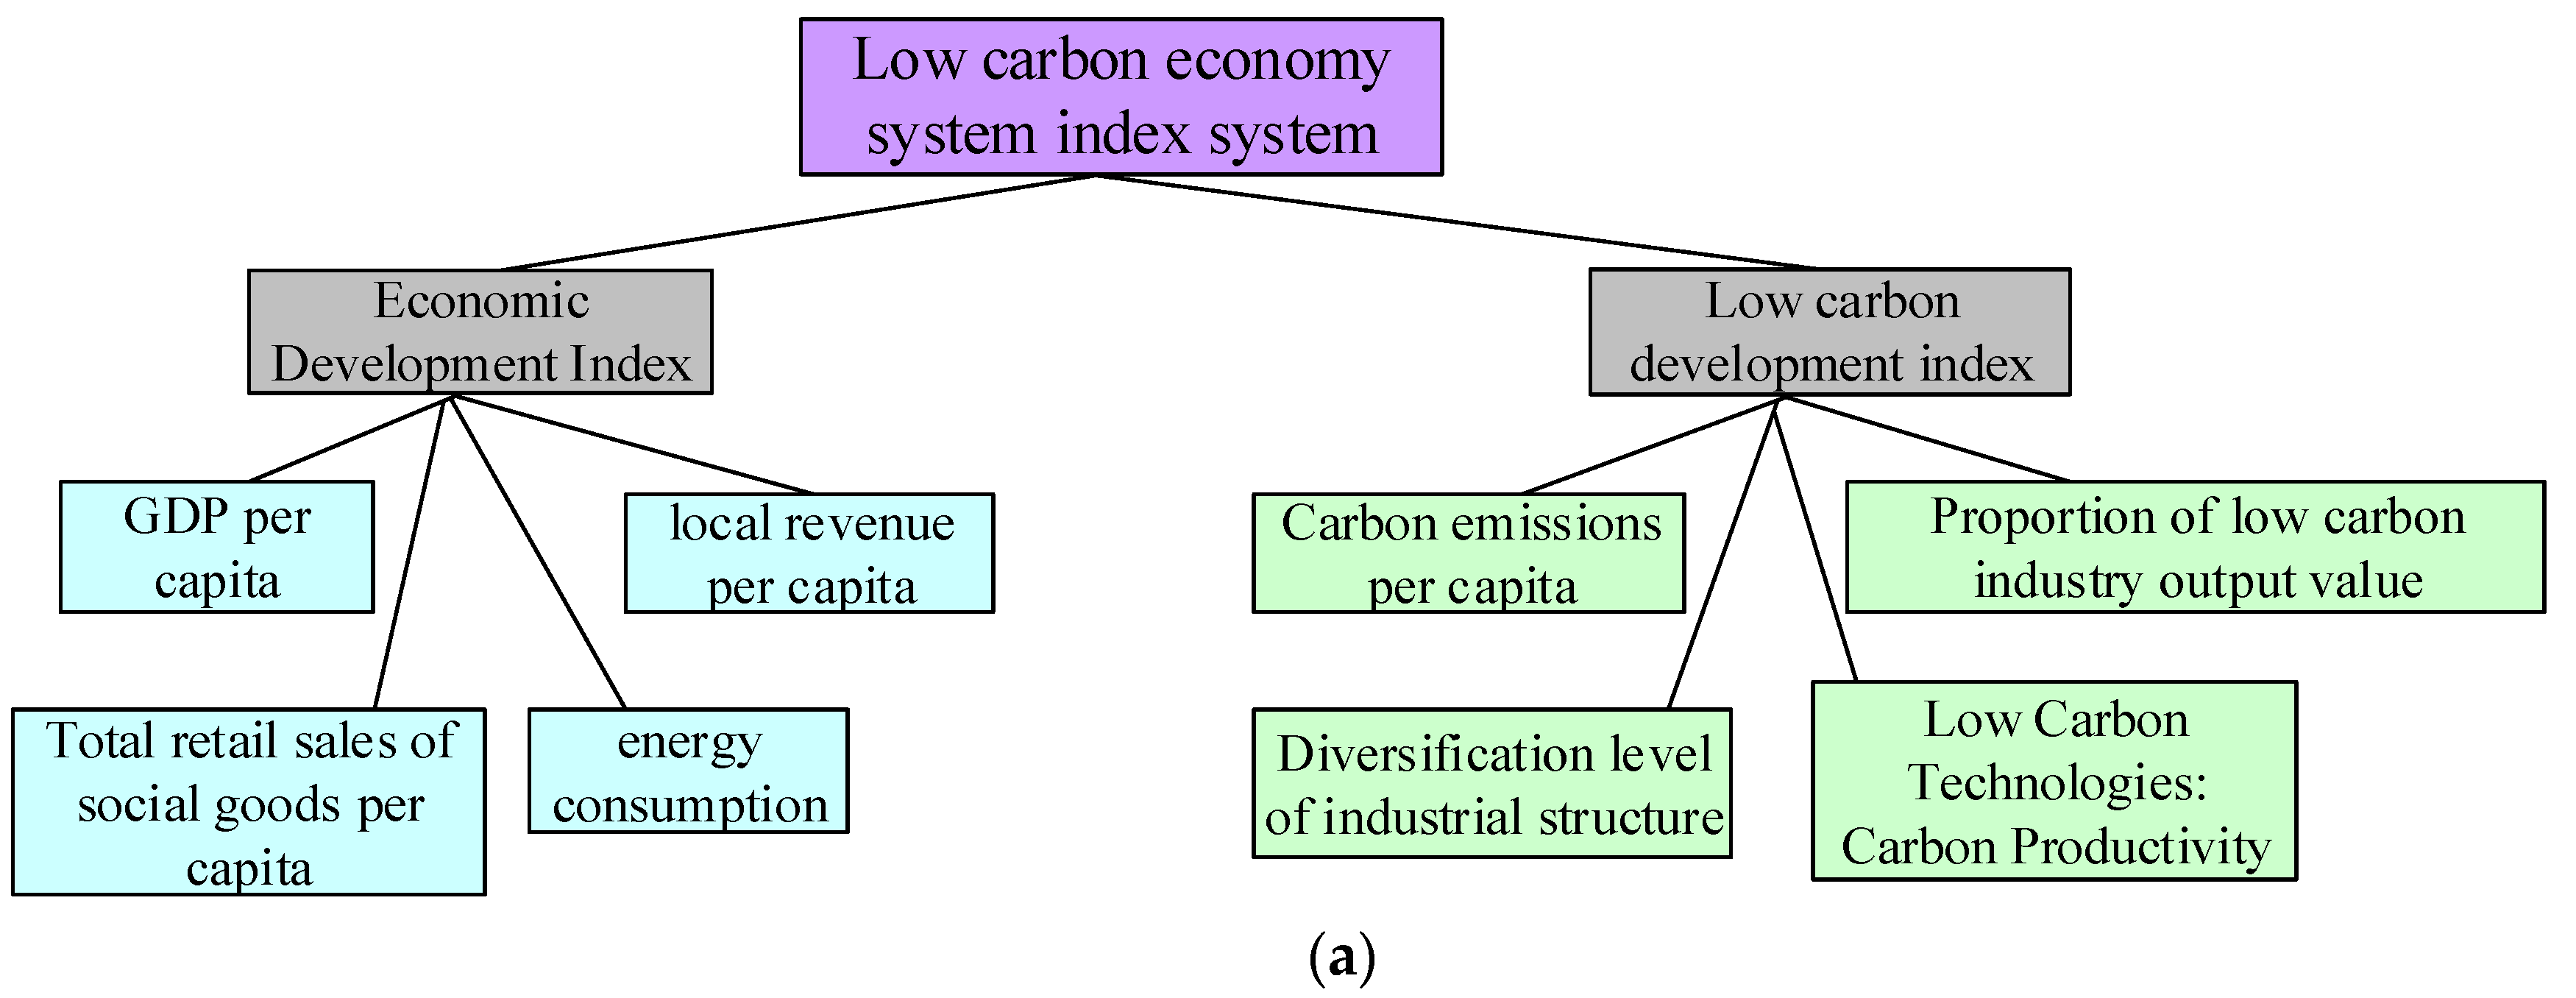
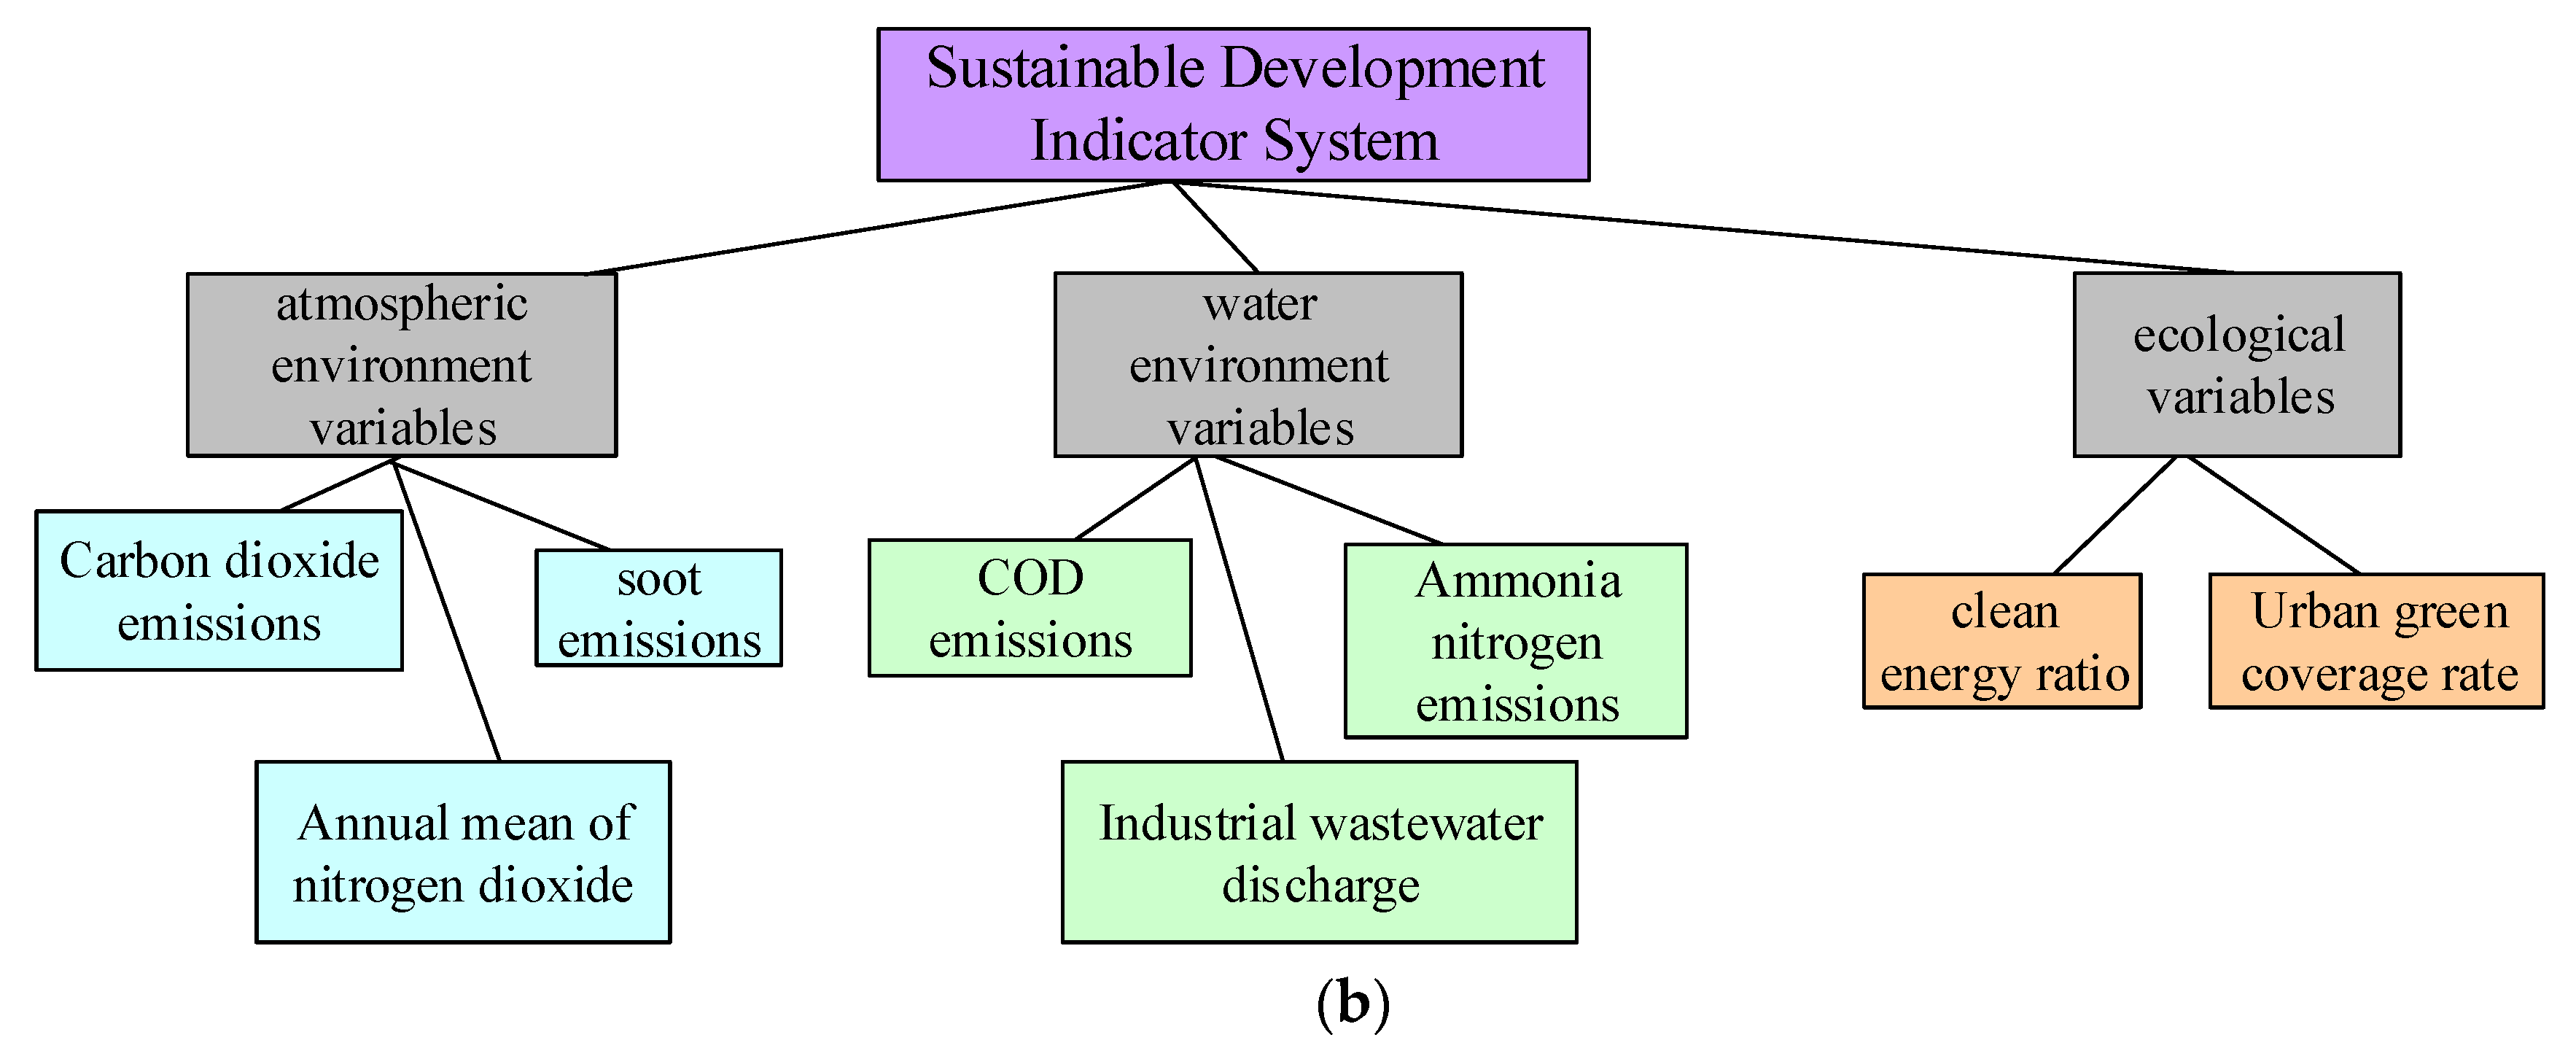
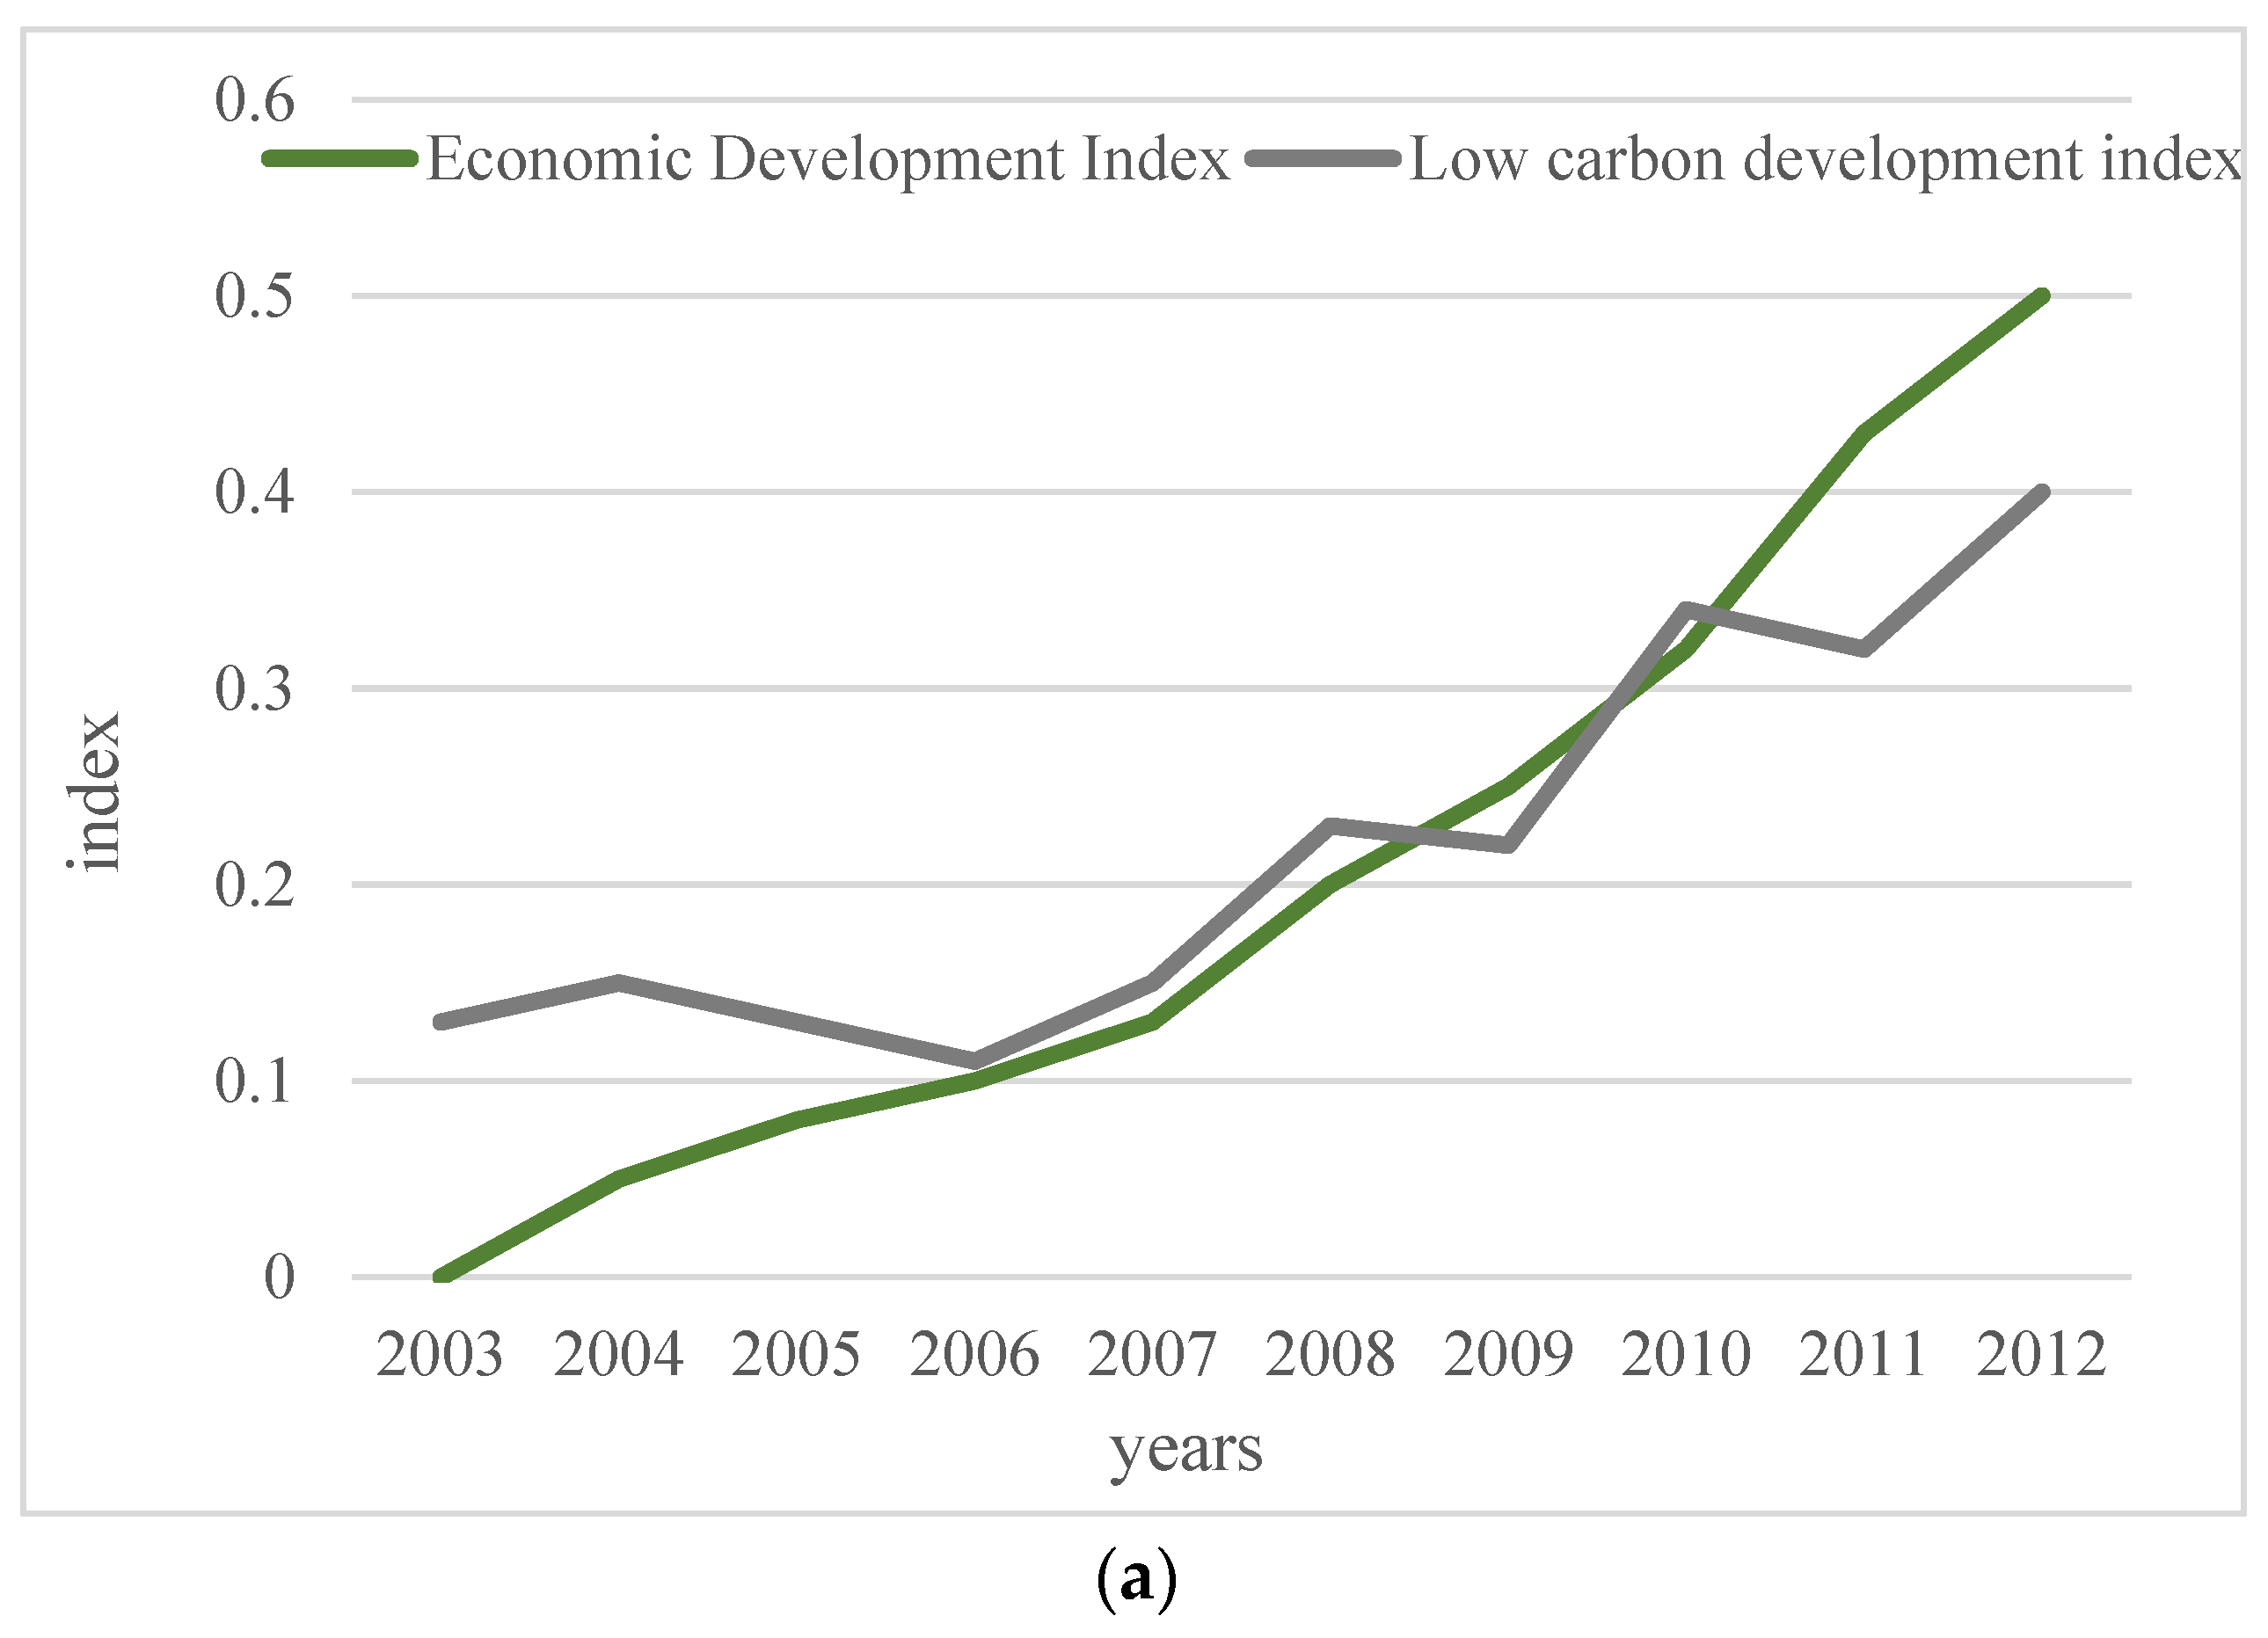
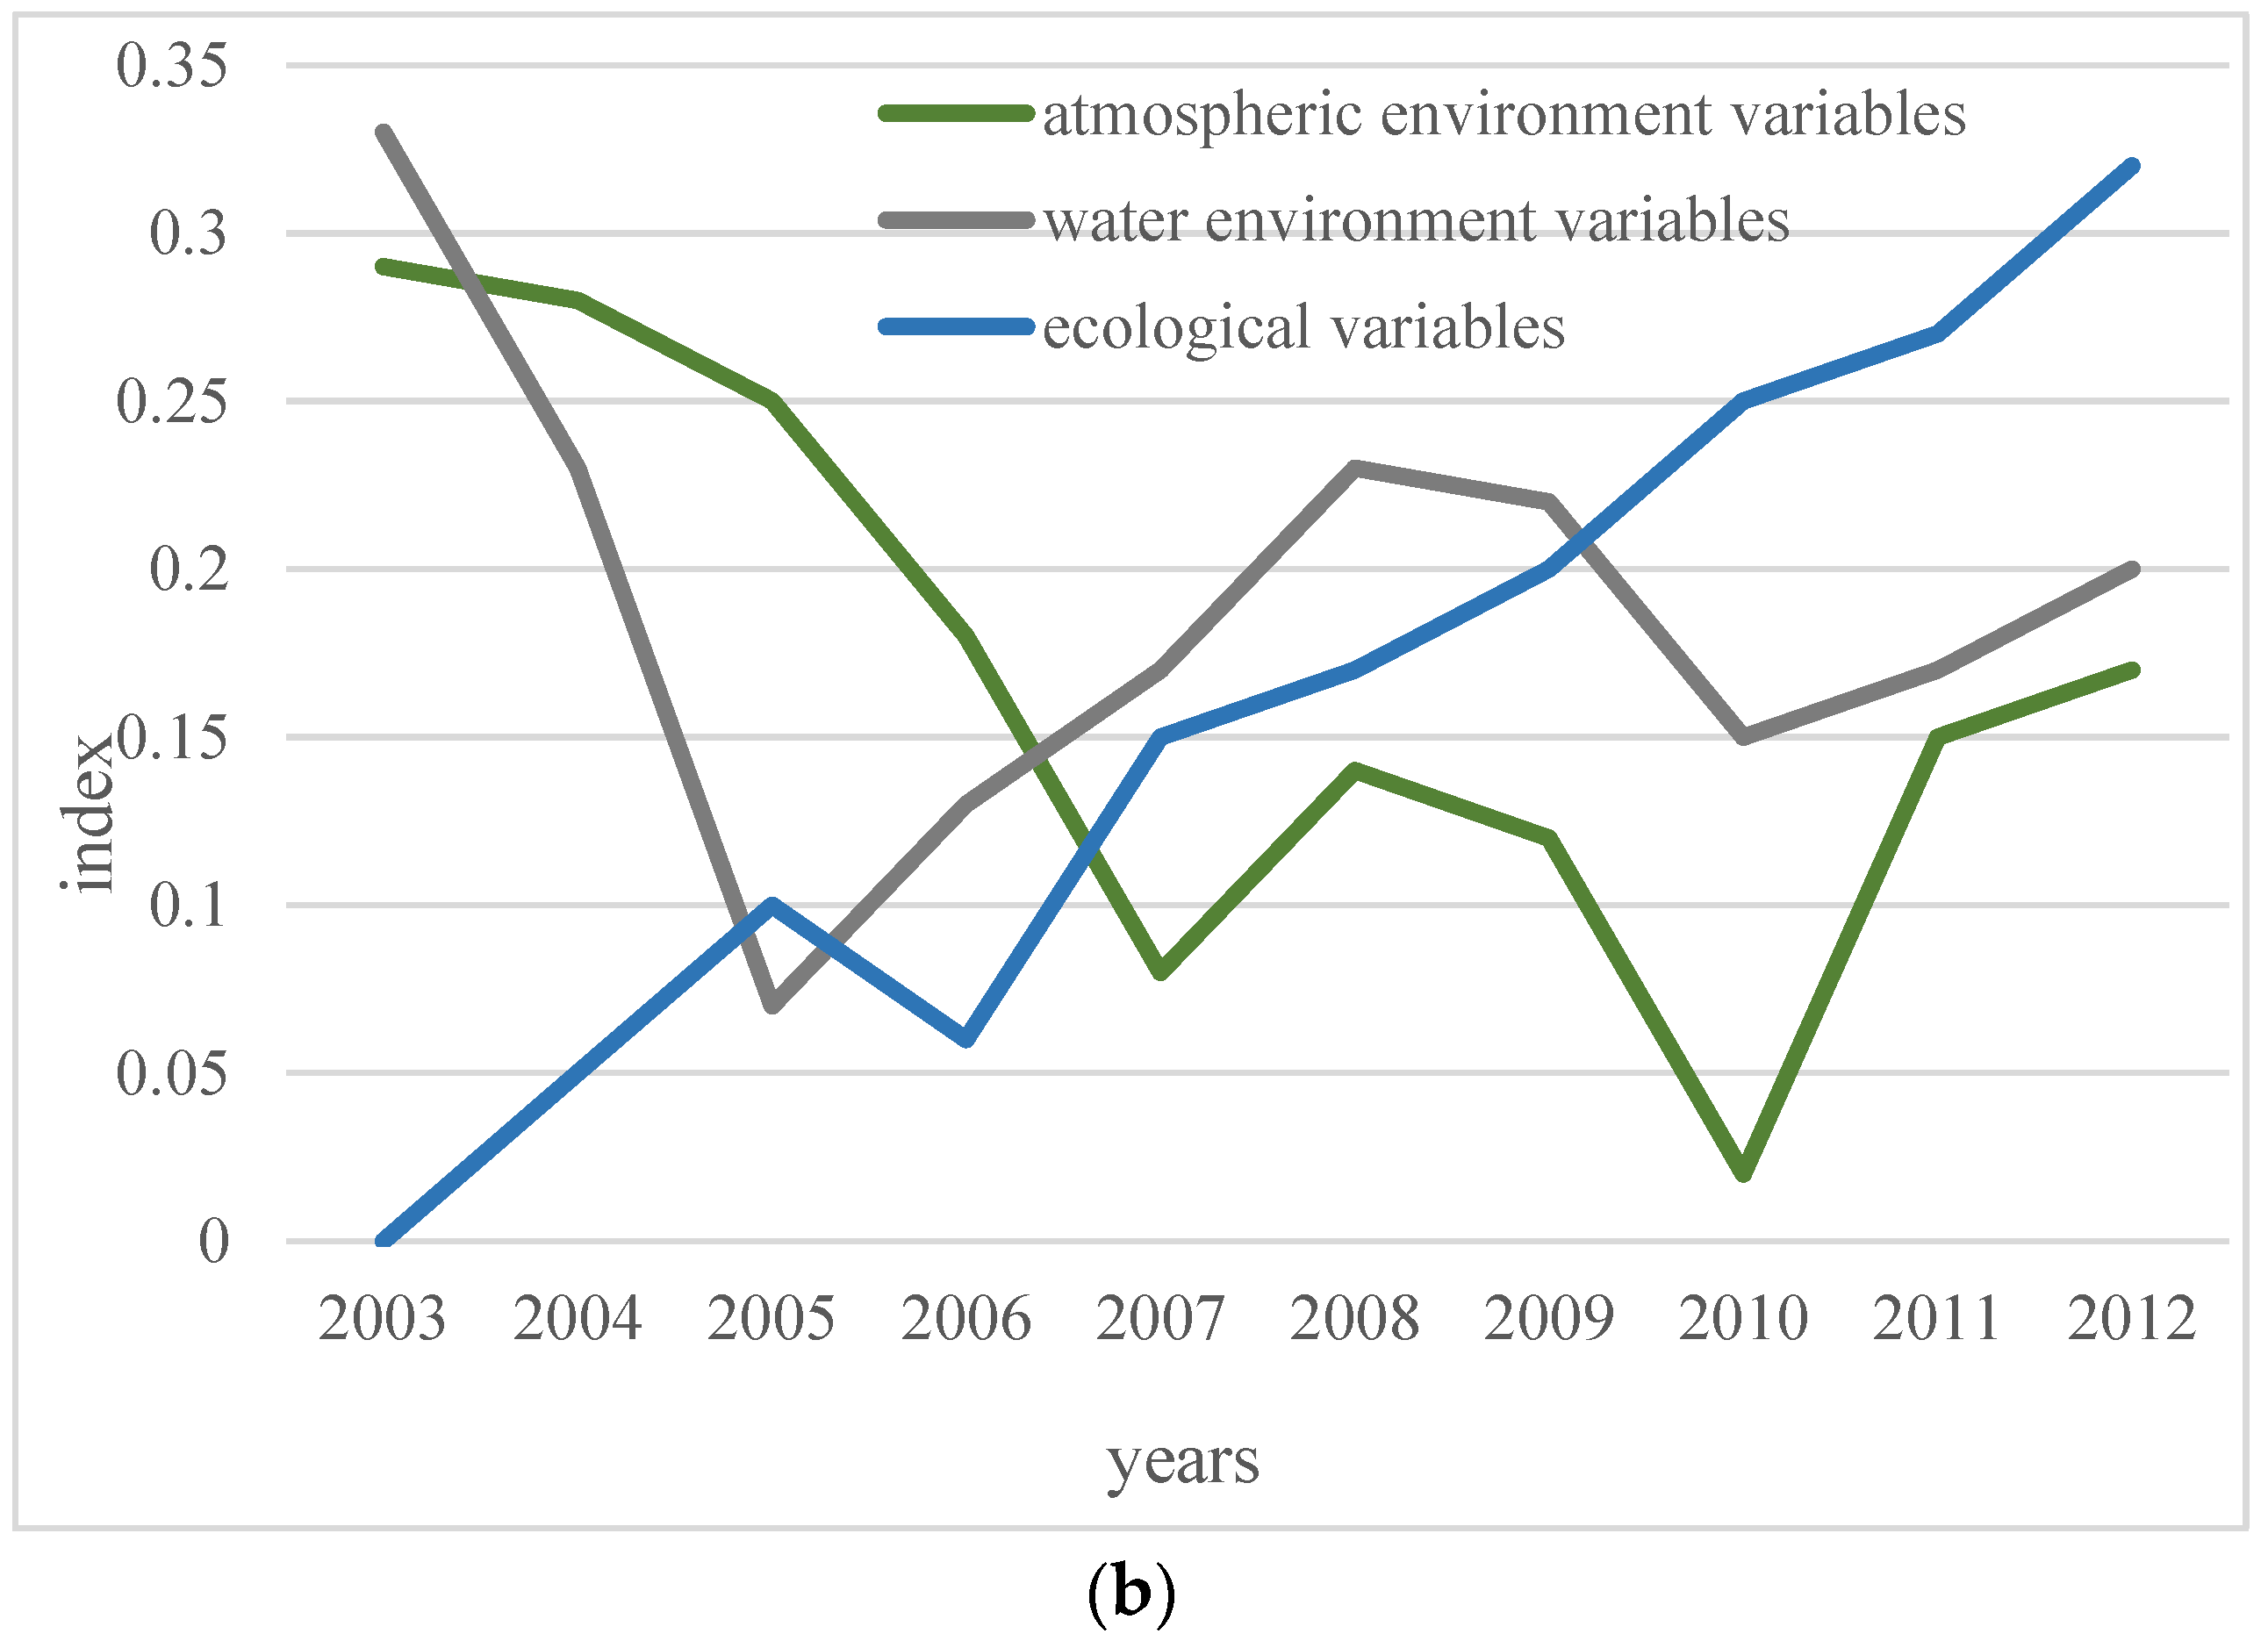
- System development evaluation
- (2)
- Coupling degree analysis of the LCE-sustainable development system
- (3)
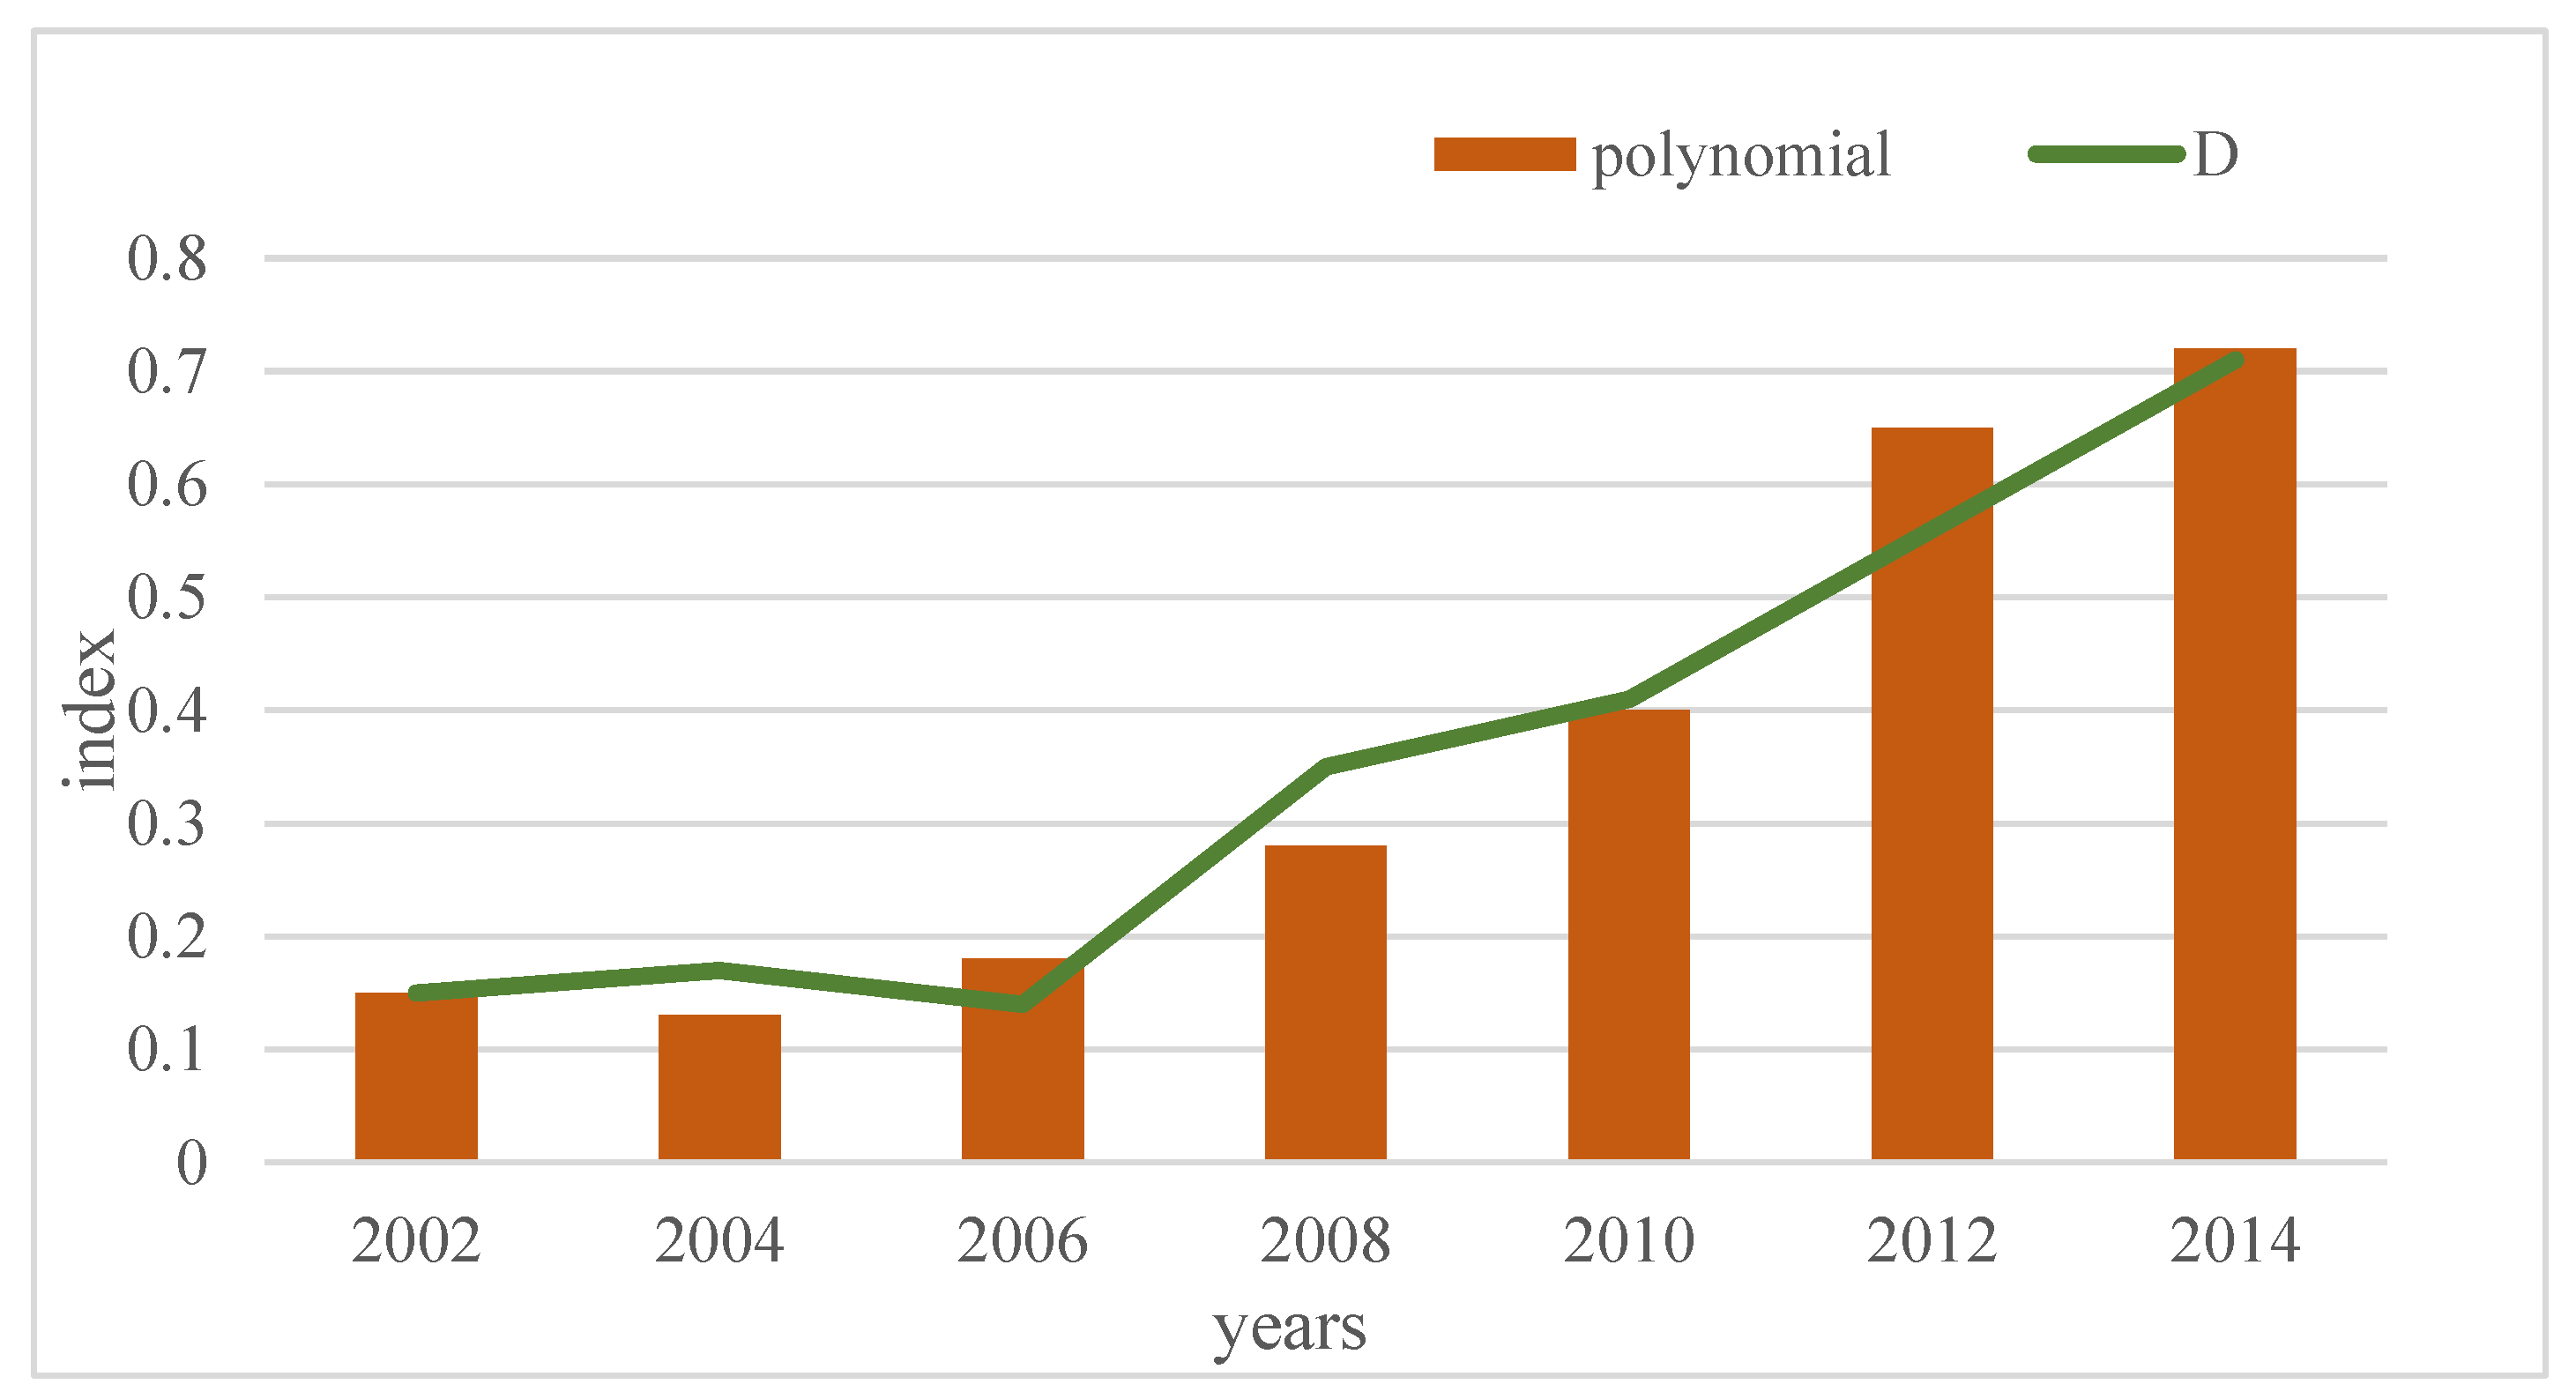
- The coupling and coordination degree of the LCE-sustainable development system
- (4)
- Prediction of the LCE-sustainable development system coupling coordination degree
3.4. Discussion of Experimental Results
- (1)
- Study results and discussion
- (2)
- Study limitations
4. Conclusions
Author Contributions
Funding
Institutional Review Board Statement
Informed Consent Statement
Data Availability Statement
Conflicts of Interest
References
- Heyes, G.; Sharmina, M.; Mendoza, J.M.F.; Gallego-Schmid, A.; Azapagic, A. Developing and implementing circular economy business models in service-oriented technology companies. J. Clean. Prod. 2017, 177, 621–632. [Google Scholar] [CrossRef]
- Mendicino, C.; Zhang, Y. Risk shocks in a small open economy: Business cycle dynamics in Canada. Econ. Model. 2018, 72, 391–409. [Google Scholar] [CrossRef]
- Chen, K.J.; Chu, A.C.; Lai, C.C. Home production and small open economy business cycles. J. Econ. Dyn. Control. 2018, 95, 110–135. [Google Scholar] [CrossRef] [Green Version]
- Kumar, V.; Lahiri, A.; Dogan, O.B. A strategic framework for a profitable business model in the sharing economy. Ind. Mark. Manag. 2017, 69, 147–160. [Google Scholar] [CrossRef]
- Sabar, N.R.; Abawajy, J.; Yearwood, J. Heterogeneous cooperative co-evolution memetic differential evolution algorithms for big data optimisation problems. IEEE Trans. Evol. Comput. 2017, 21, 315–327. [Google Scholar] [CrossRef]
- Bruno, R.; Ferreira, P. A Study on Garbage Collection Algorithms for Big Data Environments. Acm Comput. Surv. 2018, 51, 1–35. [Google Scholar] [CrossRef]
- Van der Voort, H.G.; Klievink, A.J.; Arnaboldi, M.; Meijer, A.J. Rationality and politics of algorithms. Will the promise of big data survive the dynamics of public decision making? Gov. Inf. Q. 2019, 36, 27–38. [Google Scholar] [CrossRef]
- Qian, J.; Xia, M.; Yue, X. Parallel knowledge acquisition algorithms for big data using MapReduce. Int. J. Mach. Learn. Cybern. 2018, 9, 1007–1021. [Google Scholar] [CrossRef]
- Sherer, J.A. When Is a Chair Not a Chair?: Big Data Algorithms, Disparate Impact, and Considerations of Modular Programming. Comput. Internet Lawyer 2017, 34, 6–10. [Google Scholar]
- Vedder, A.; Naudts, L. Accountability for the use of algorithms in a big data environment. Int. Rev. Law Comput. Technol. 2017, 31, 206–224. [Google Scholar] [CrossRef] [Green Version]
- Meyer, U.; Abedjan, Z. Algorithms for Big Data. It Inf. Technol. 2020, 62, 117–118. [Google Scholar] [CrossRef]
- Sagastume Gutierrez, A.; Eras, J.C.; Huisingh, D.; Vandecasteele, C.; Hens, L. The current potential of low-carbon economy and biomass-based electricity in Cuba. The case of sugarcane, energy cane and marabu (Dichrostachys cinerea) as biomass sources. J. Clean. Prod. 2018, 172, 2108–2122. [Google Scholar] [CrossRef]
- Warner, N.A. Zero CO_2 steelmaking in a future low carbon economy. 1. Energy conservation in smelting hematite ore directly to refined iron slab. Transactions of the Institutions of Mining and Metallurgy, Section C. Miner. Process. Extr. Metall. 2018, 127, 73–83. [Google Scholar]
- Faerber, L.A.; Balta-Ozkan, N.; Connor, P.M. Innovative network pricing to support the transition to a smart grid in a low-carbon economy. Energy Policy 2018, 116, 210–219. [Google Scholar] [CrossRef] [Green Version]
- Duarte, R.; Sanchez-Choliz, J.; Sarasa, C. Consumer-side actions in a low-carbon economy: A dynamic CGE analysis for Spain. Energy Policy 2018, 118, 199–210. [Google Scholar] [CrossRef]
- Hafeznia, H.; Pourfayaz, F.; Maleki, A. An assessment of Iran’s natural gas potential for transition toward low-carbon economy. Renew. Sustain. Energy Rev. 2017, 79, 71–81. [Google Scholar] [CrossRef]
- Tavera Romero, C.A.; Castro, D.F.; Ortiz, J.H.; Khalaf, O.I.; Vargas, M.A. Synergy between Circular Economy and Industry 4.0: A Literature Review. Sustainability 2021, 13, 4331. [Google Scholar] [CrossRef]
- Wisesa, O.; Adriansyah, A.; Khalaf, O.I. Prediction Analysis for Business To Business (B2B) Sales of Telecommunication Services using Machine Learning Techniques. Majlesi J. Electr. Eng. 2020, 14, 145–153. [Google Scholar] [CrossRef]
- Li, X.T.; Wang, J.; Yang, C.Y. Risk prediction in financial management of listed companies based on optimized BP neural network under digital economy. J. Manuf. Process. 2022, 1–14. [Google Scholar] [CrossRef]
- Li, J.; Li, J.; Ji, J.; Meng, S. Research on the Impact of the Coronavirus Disease 2019 (COVID-19) Pandemic on the Global Trade Economy Based on Big Data Analysis. J. Organ. End User Comput. 2021, 33, 1–18. [Google Scholar] [CrossRef]
- Jakob, M. Ecuador’s climate targets: A credible entry point to a low-carbon economy? Energy Sustain. Dev. 2017, 39, 91–100. [Google Scholar] [CrossRef]
- Sharmila, V.G.; Tamilarasan, K.; Kumar, M.D.; Kumar, G.; Varjani, S.; Kumar, S.A.; Banu, J.R. Trends in dark biohydrogen production strategy and linkages with transition towards low carbon economy: An outlook, cost-effectiveness, bottlenecks and future scope. Int. J. Hydrogen Energy 2022, 47, 15309–15332. [Google Scholar] [CrossRef]
- Yang, X.; Zhao, C.; Xu, H.; Liu, K.; Zha, J. Changing the industrial structure of tourism to achieve a low-carbon economy in China: An industrial linkage perspective. J. Hosp. Tour. Manag. 2021, 48, 374–389. [Google Scholar] [CrossRef]
- Lee, J.; Bazilian, M.; Hastings-Simon, S. The material foundations of a low-carbon economy. One Earth 2021, 4, 331–334. [Google Scholar] [CrossRef]
- Nyambuu, U.; Semmler, W. Climate change and the transition to a low carbon economy—Carbon targets and the carbon budget. Econ. Model. 2020, 84, 367–376. [Google Scholar] [CrossRef]
- Andronie, M.; Lăzăroiu, G.; Ștefănescu, R.; Uță, C.; Dijmărescu, I. Sustainable, Smart, and Sensing Technologies for Cyber-Physical Manufacturing Systems: A Systematic Literature Review. Sustainability 2021, 13, 5495. [Google Scholar] [CrossRef]
- De Blasio, N.; Fallon, P. The Plastic Waste Challenge in a Post-COVID-19 World: A Circular Approach to Sustainability. J. Self-Gov. Manag. Econ. 2022, 10, 7–29. [Google Scholar] [CrossRef]
- Andronie, M.; Lăzăroiu, G.; Iatagan, M.; Hurloiu, I.; Dijmărescu, I. Sustainable Cyber-Physical Production Systems in Big Data-Driven Smart Urban Economy: A Systematic Literature Review. Sustainability 2021, 13, 751. [Google Scholar] [CrossRef]


| Years | Low-Carbon Economy Composite Index | Sustainability Composite Index | Years | Low-Carbon Economy Composite Index | Sustainability Composite Index |
|---|---|---|---|---|---|
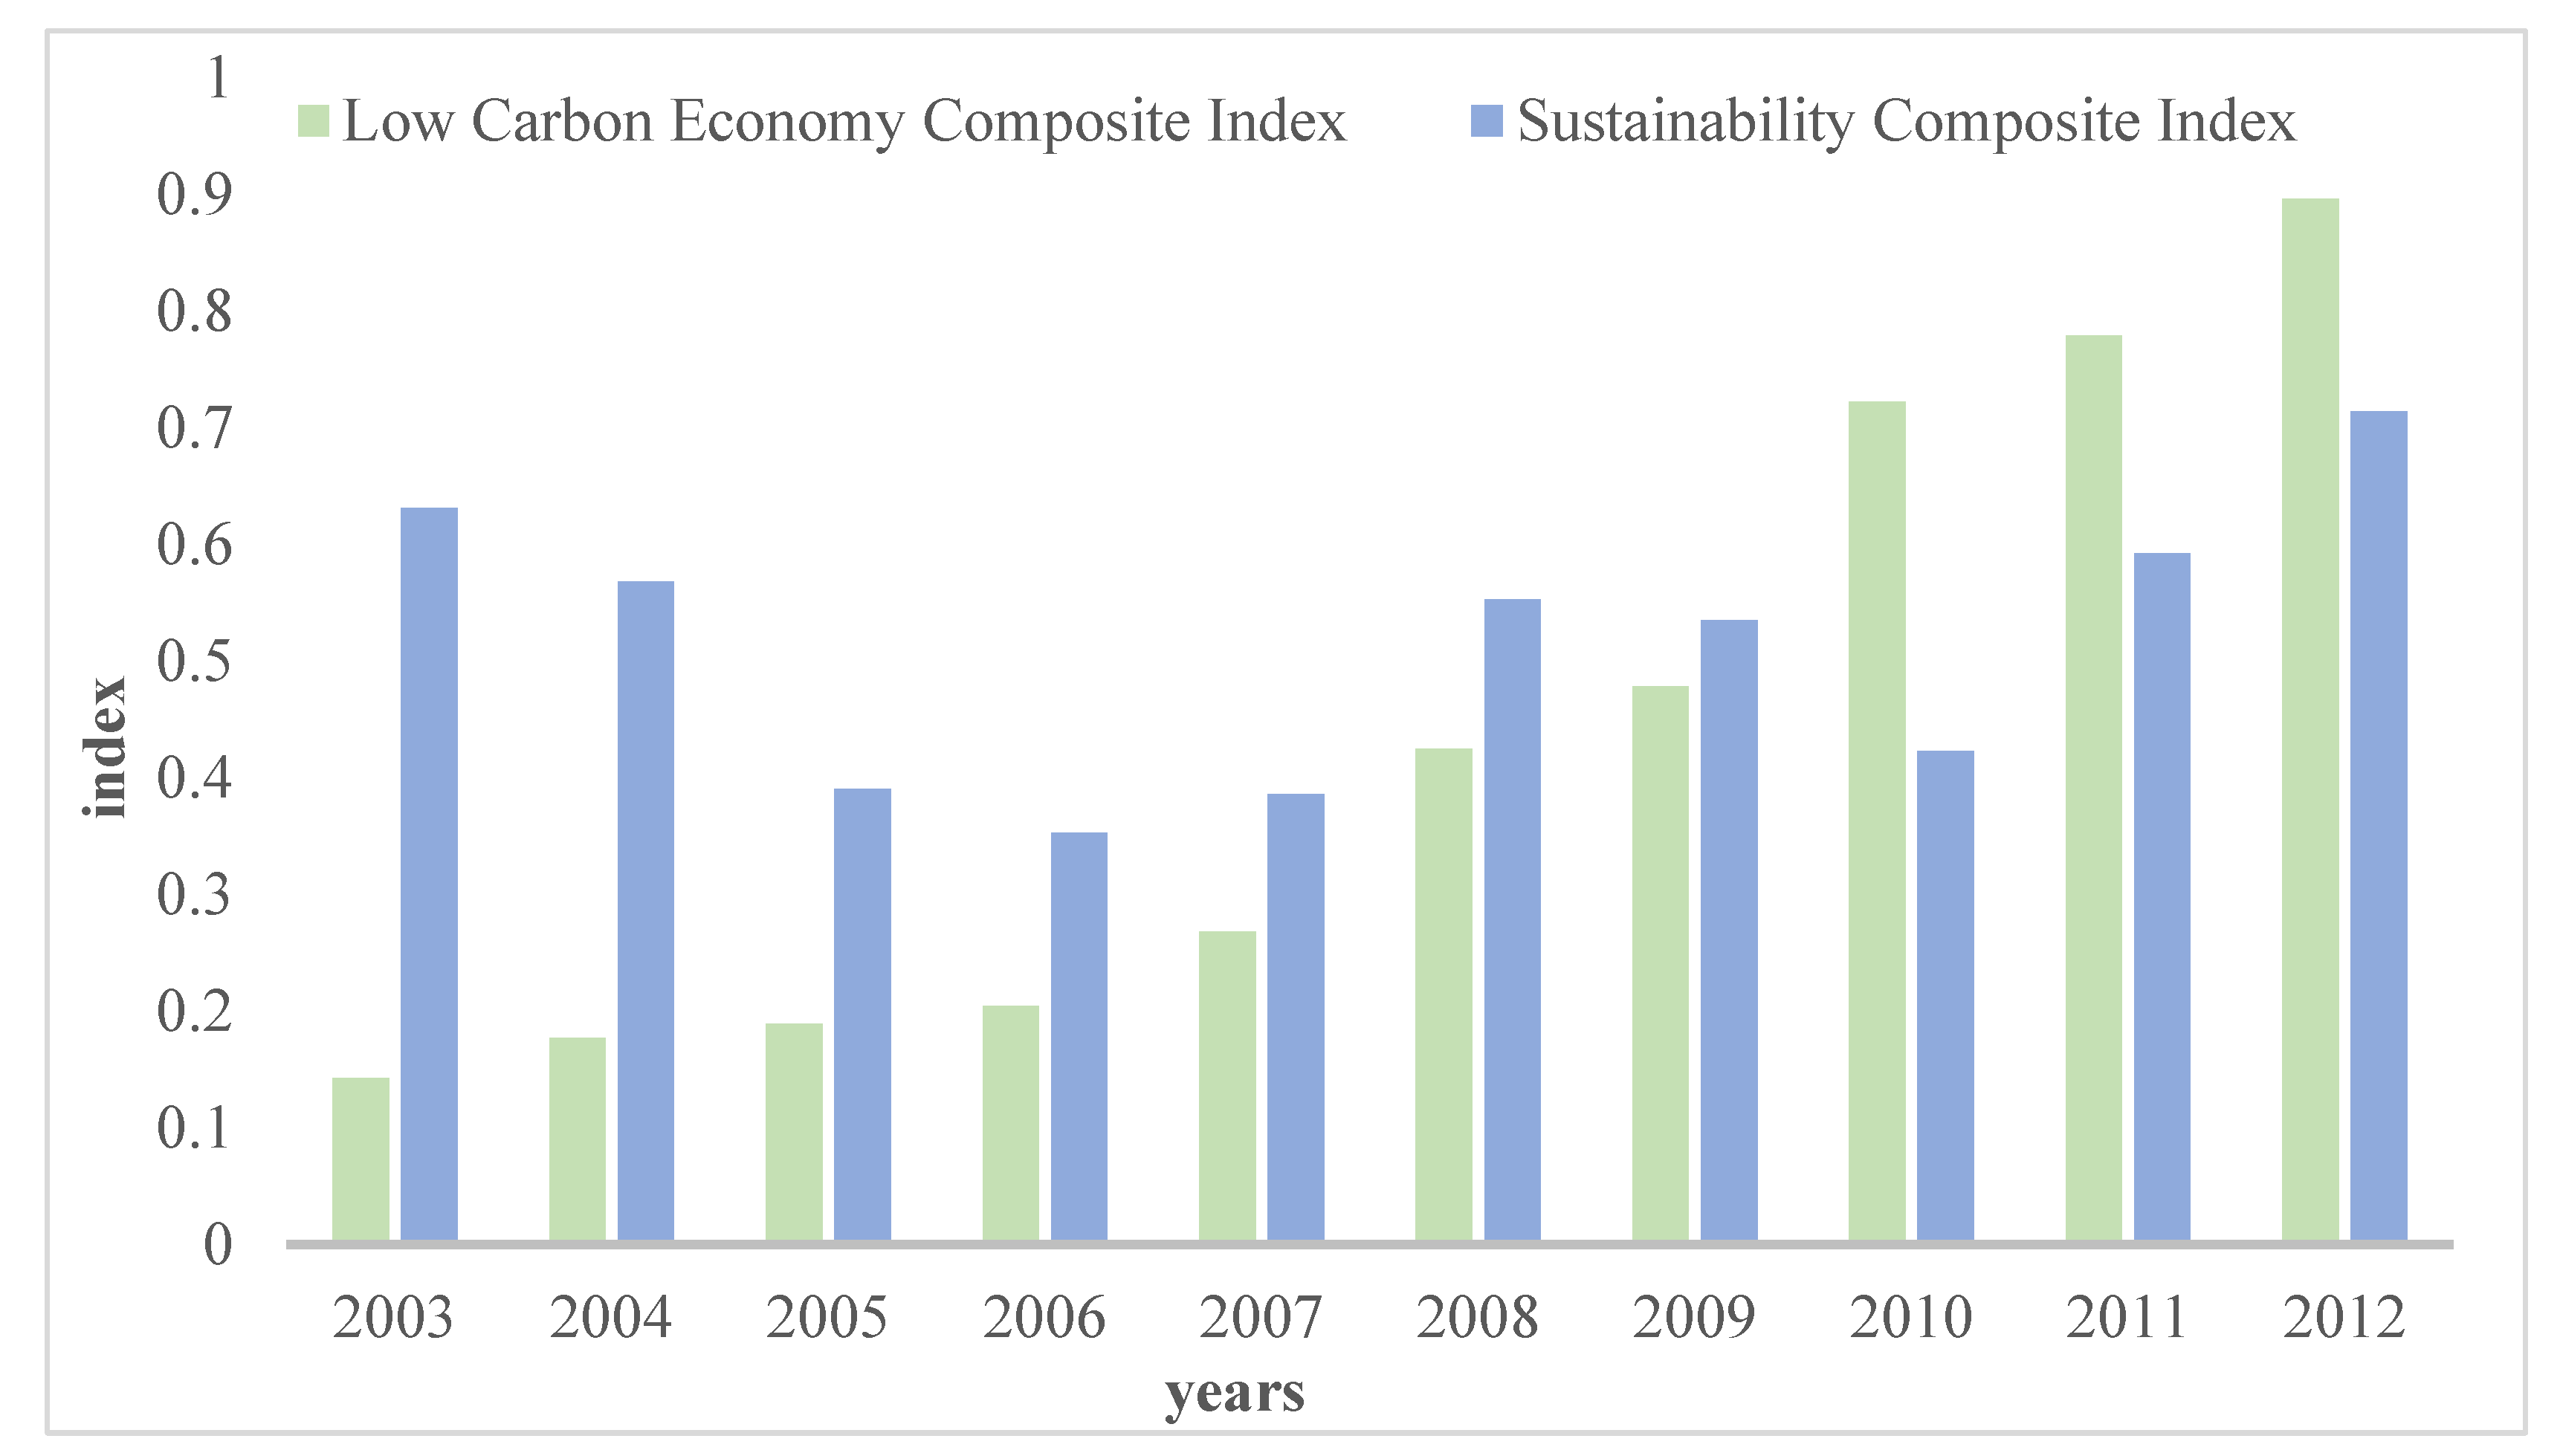
| 2003 | 0.143 | 0.631 | 2008 | 0.425 | 0.553 |
| 2004 | 0.177 | 0.568 | 2009 | 0.478 | 0.535 |
| 2005 | 0.189 | 0.390 | 2010 | 0.722 | 0.423 |
| 2006 | 0.204 | 0.353 | 2011 | 0.779 | 0.592 |
| 2007 | 0.268 | 0.386 | 2012 | 0.896 | 0.714 |
| 2003 | 2004 | 2005 | 2006 | 2007 | 2008 | 2009 | 2010 | 2011 | 2012 | |
|---|---|---|---|---|---|---|---|---|---|---|
| V(x) | 0.239 | 0.167 | 0.075 | 0.318 | 0.585 | 0.124 | 0.051 | 0.080 | 0.150 | 0.297 |
| V(y) | −0.097 | −0.013 | −0.033 | 1.342 | 0.933 | −0.336 | −0.209 | 0.399 | 0.206 | 0.269 |
| V(x)/V(y) | −2.479 | −12.85 | −2.241 | 0.237 | 0.627 | −0.369 | −0.223 | 0.200 | 0.728 | 1.104 |
| arctan | −1.561 | −1.493 | −1.151 | 0.233 | 0.561 | −0.354 | −0.220 | 0.197 | 0.629 | 0.835 |
| Angle value | −90°34′ | −86°27′ | −66°22′ | 13°19′ | 32°5′ | −21°44′ | −13°24′ | 11°17′ | 36°34′ | 47°49′ |
| 2003 | 2004 | 2005 | 2006 | 2007 | 2008 | 2009 | 2010 | 2011 | 2012 | |
|---|---|---|---|---|---|---|---|---|---|---|
| A | 0.090 | 0.101 | 0.074 | 0.072 | 0.104 | 0.235 | 0.256 | 0.305 | 0.461 | 0.640 |
| B | 0.774 | 0.745 | 0.579 | 0.556 | 0.655 | 0.978 | 1.013 | 1.145 | 1.371 | 0.610 |
| C | 0.054 | 0.073 | 0.0.65 | 0.067 | 0.100 | 0.231 | 0.255 | 0.284 | 0.453 | 0.632 |
| T | 0.387 | 0.373 | 0.290 | 0.278 | 0.327 | 0.489 | 0.506 | 0.572 | 0.686 | 0.805 |
| D | 0.145 | 0.165 | 0.137 | 0.138 | 0.181 | 0.336 | 0.359 | 0.403 | 0.557 | 0.713 |
Disclaimer/Publisher’s Note: The statements, opinions and data contained in all publications are solely those of the individual author(s) and contributor(s) and not of MDPI and/or the editor(s). MDPI and/or the editor(s) disclaim responsibility for any injury to people or property resulting from any ideas, methods, instructions or products referred to in the content. |
© 2023 by the authors. Licensee MDPI, Basel, Switzerland. This article is an open access article distributed under the terms and conditions of the Creative Commons Attribution (CC BY) license (https://creativecommons.org/licenses/by/4.0/).
Share and Cite
Liu, X.; Ma, L. Sustainable Development of Business Economy Based on Big Data Algorithm under the Background of Low-Carbon Economy. Sustainability 2023, 15, 5840. https://doi.org/10.3390/su15075840
Liu X, Ma L. Sustainable Development of Business Economy Based on Big Data Algorithm under the Background of Low-Carbon Economy. Sustainability. 2023; 15(7):5840. https://doi.org/10.3390/su15075840
Chicago/Turabian StyleLiu, Xuefeng, and Li Ma. 2023. "Sustainable Development of Business Economy Based on Big Data Algorithm under the Background of Low-Carbon Economy" Sustainability 15, no. 7: 5840. https://doi.org/10.3390/su15075840