
A Comparison and Ranking Study of Monthly Average Rainfall Datasets with IMD Gridded Data in India


Abstract
:1. Introduction
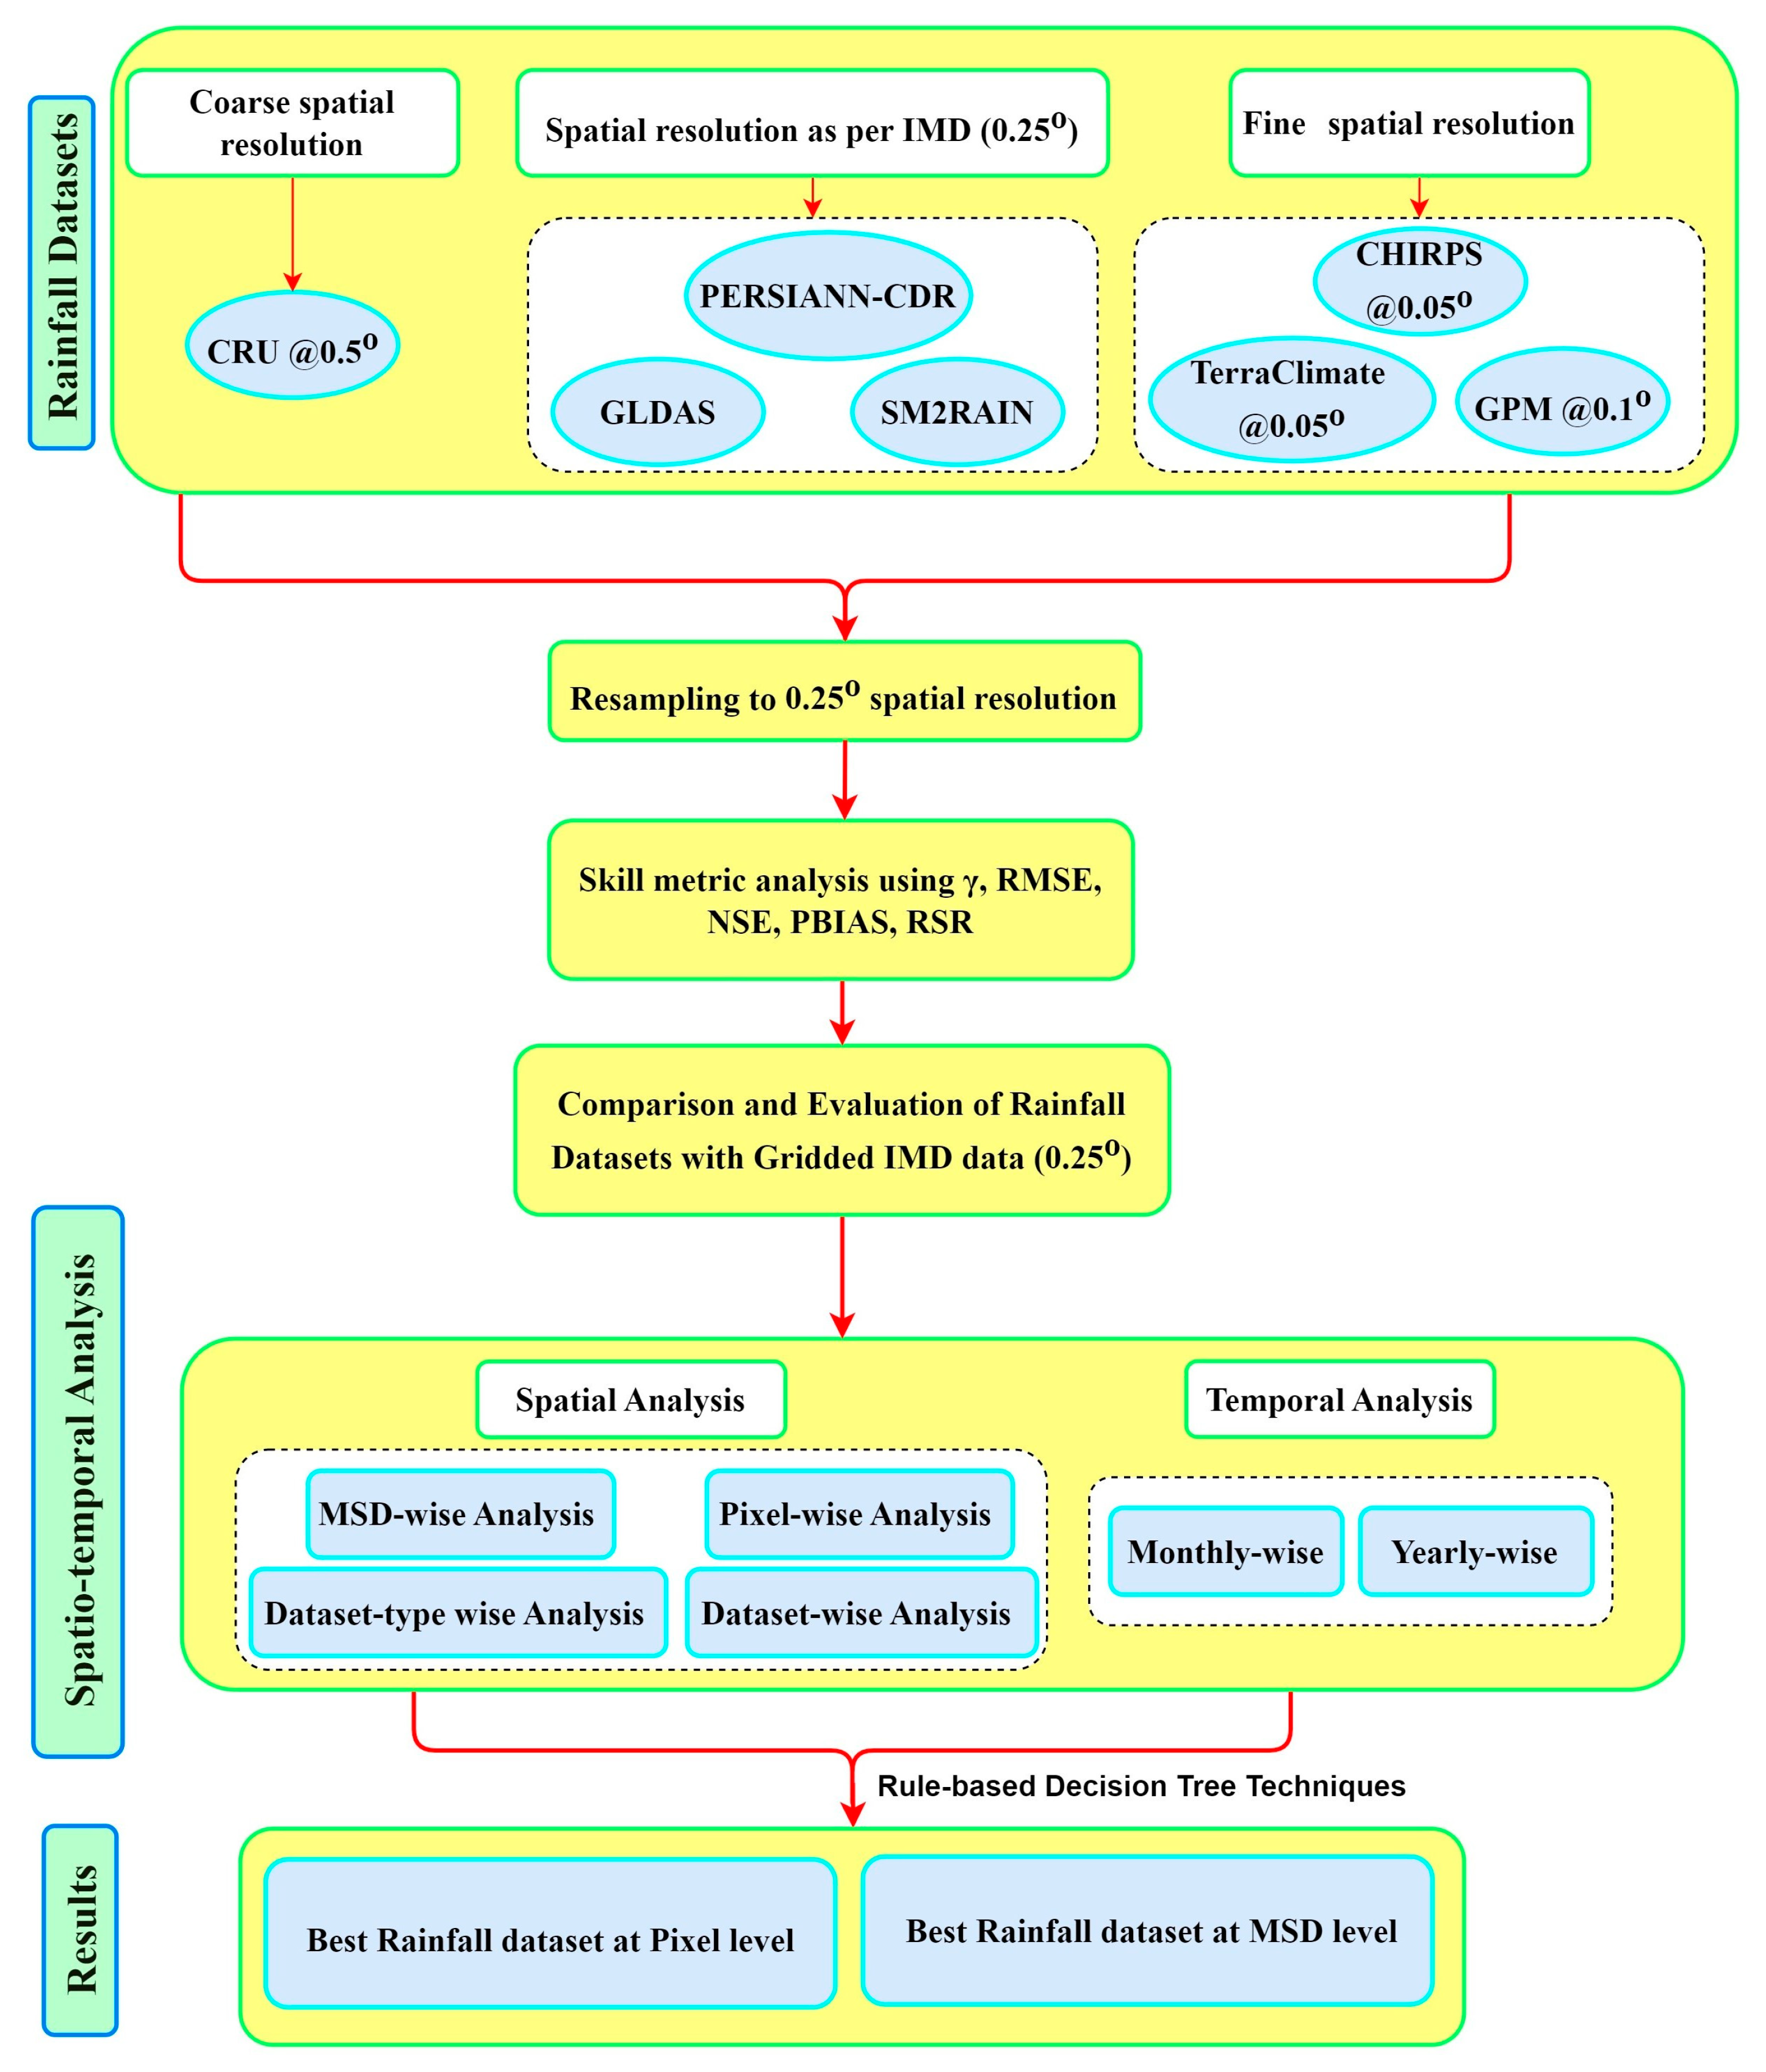
2. Study Area, Datasets Used and Methodology
2.1. Study Area
2.2. Datasets
- (a)
- IMD Gridded rainfall datasets
- (b)
- CHIRPS
- (c)
- CRU
- (d)
- GLDAS
- (e)
- GPM
- (f)
- PERSIANN-CDR
- (g)
- SM2RAIN
- (h)
- TerraClimate
2.3. Methodology

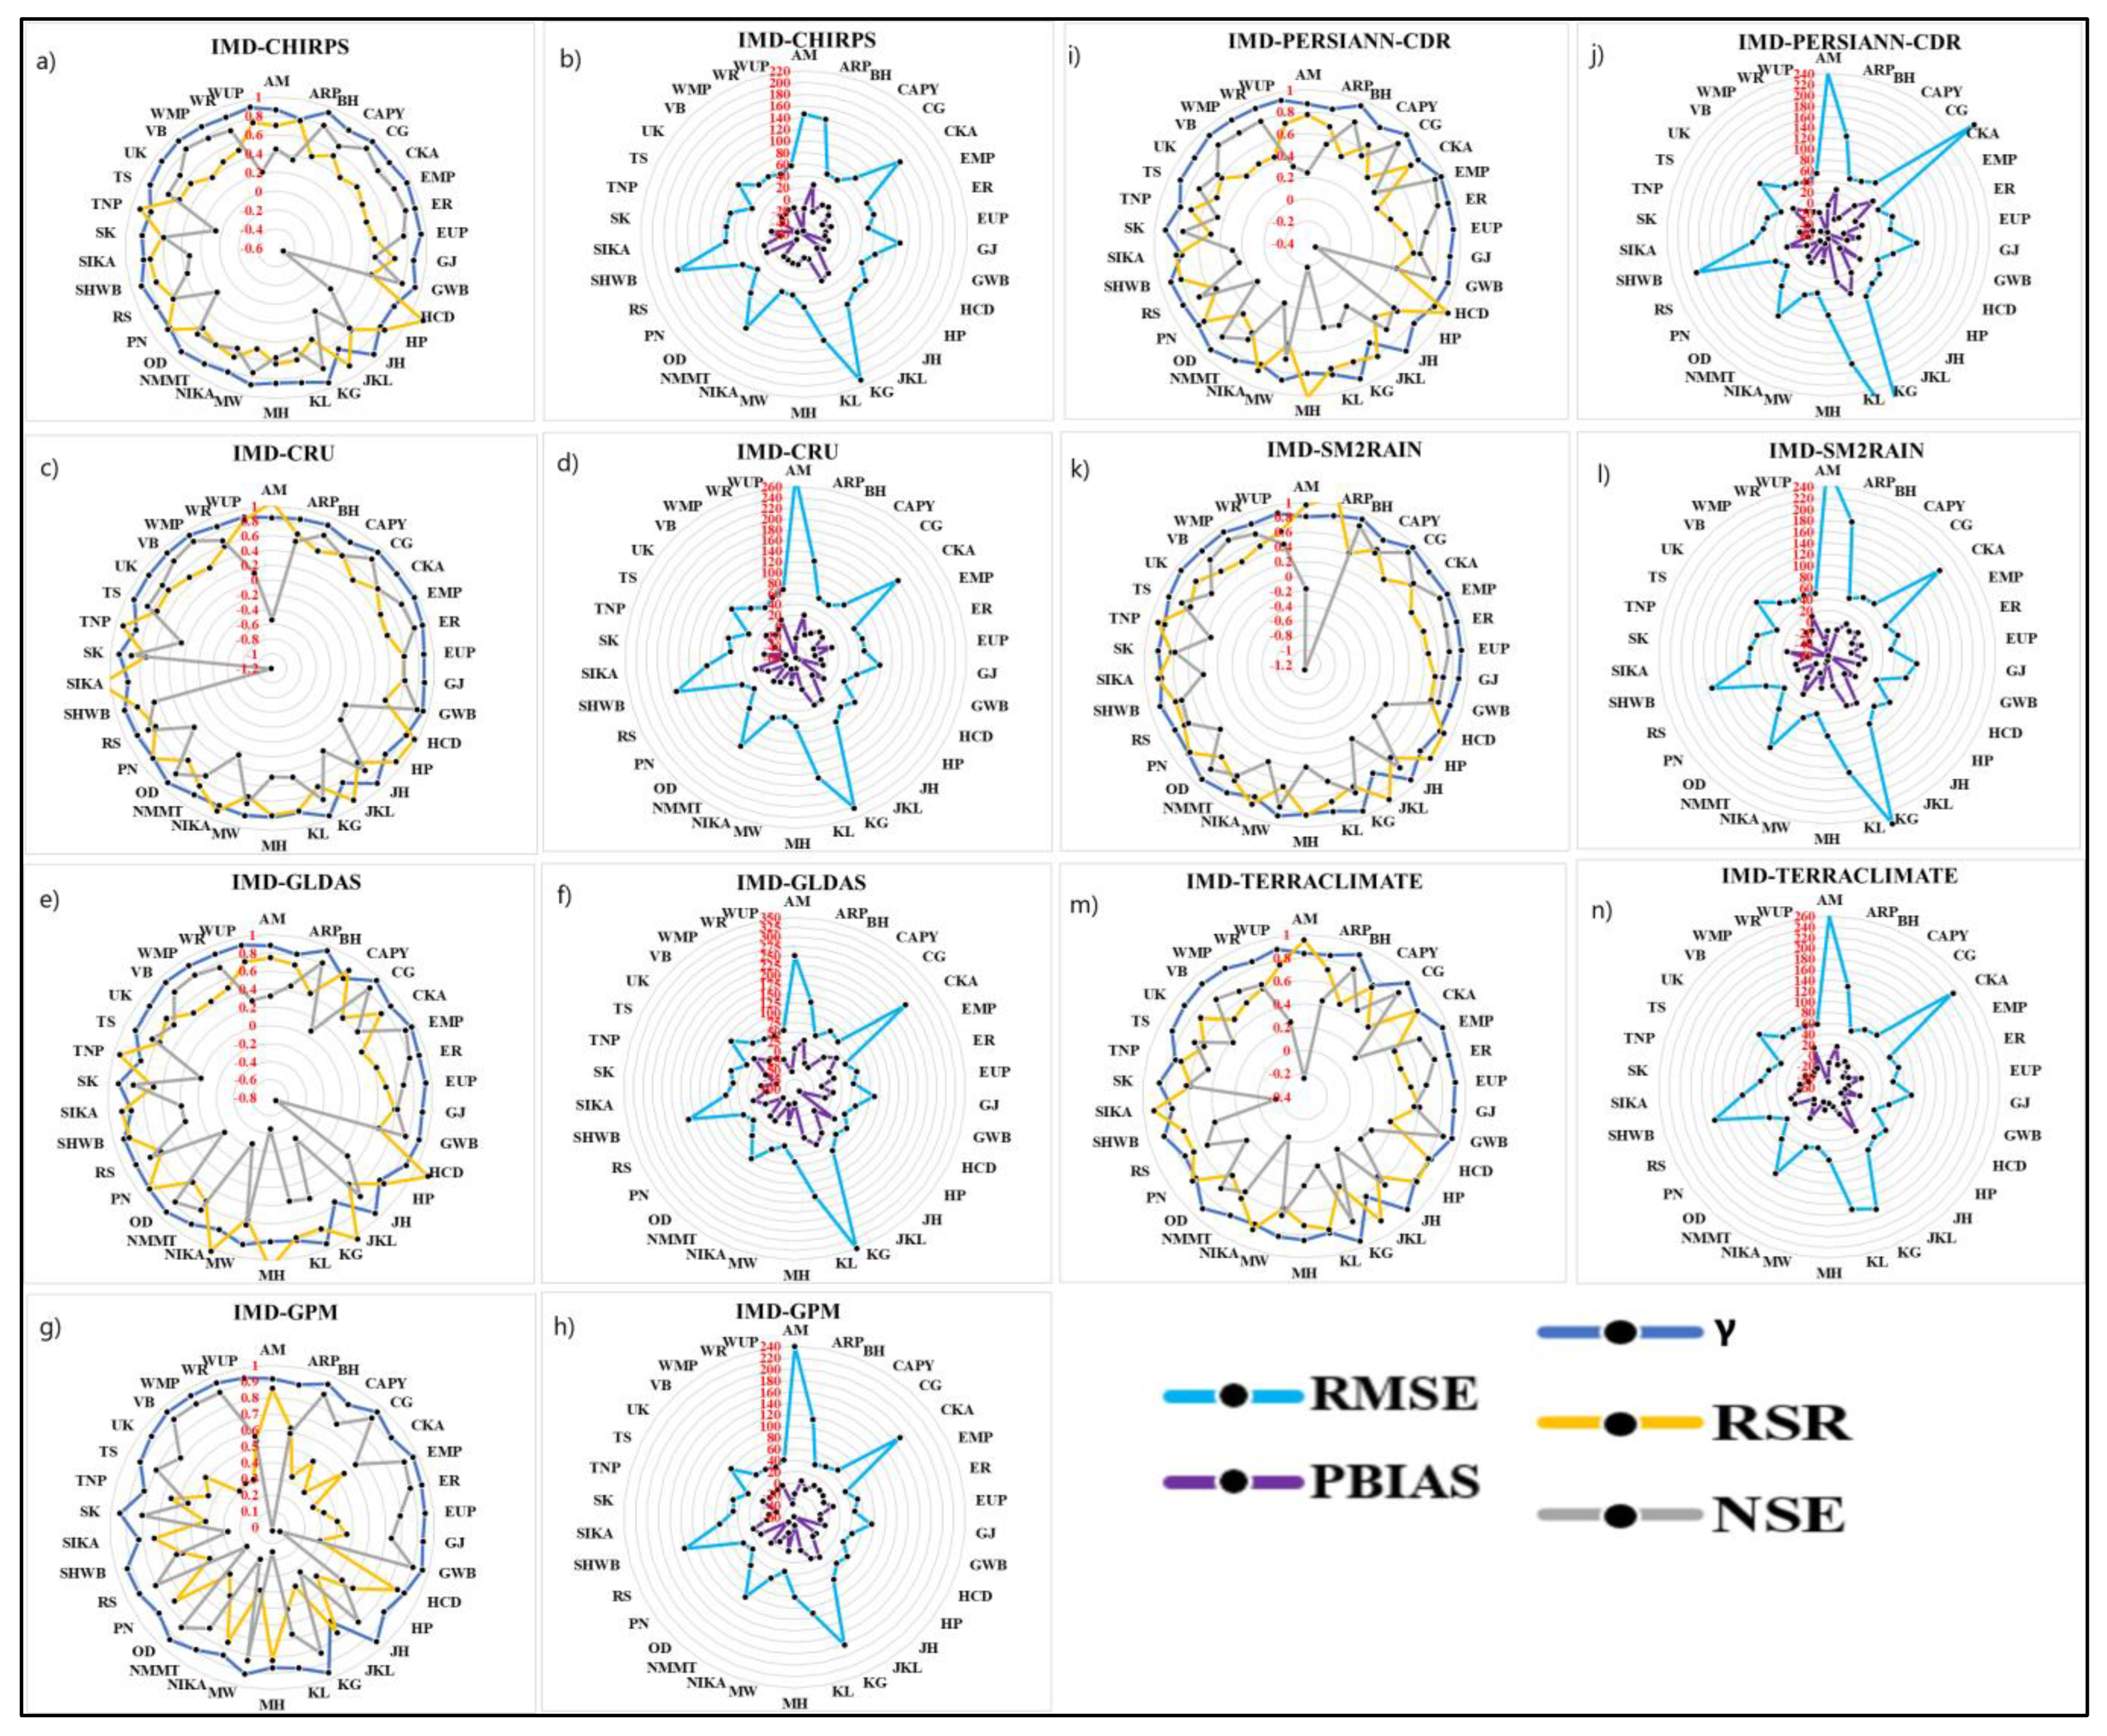
| S.No | Skill Metrics | Equation | Range | Source |
|---|---|---|---|---|
| 1 | Pearson Correlation Coefficient () | −1 and 1. Where 0 is no correlation, 1 is a total positive correlation, and −1 is a total negative correlation | (Pearson 1895) [54] | |
| 2 | Root Mean Square Error (RMSE) | A smaller value indicates good performance. | (Moriasi et al. 1983) [53] | |
| 3 | Nash–Sutcliffe Efficiencies (NSE) | -Infinity to 1. If this parameter is closer to 1, the model is further accurate. | (Nash and Sutcliffe 1970) [55] | |
| 4 | Percentage Bias | * 100 | A smaller percentage indicates good performance. | (Gupta et al. 1999) [56] |
| 5 | RMSE-observations standard deviation ratio (RSR) | 0 to ∞. ≤0.7 indicating a good-performing range. | (Chu and Shirmo-hammadi 2004) [57] |
3. Results
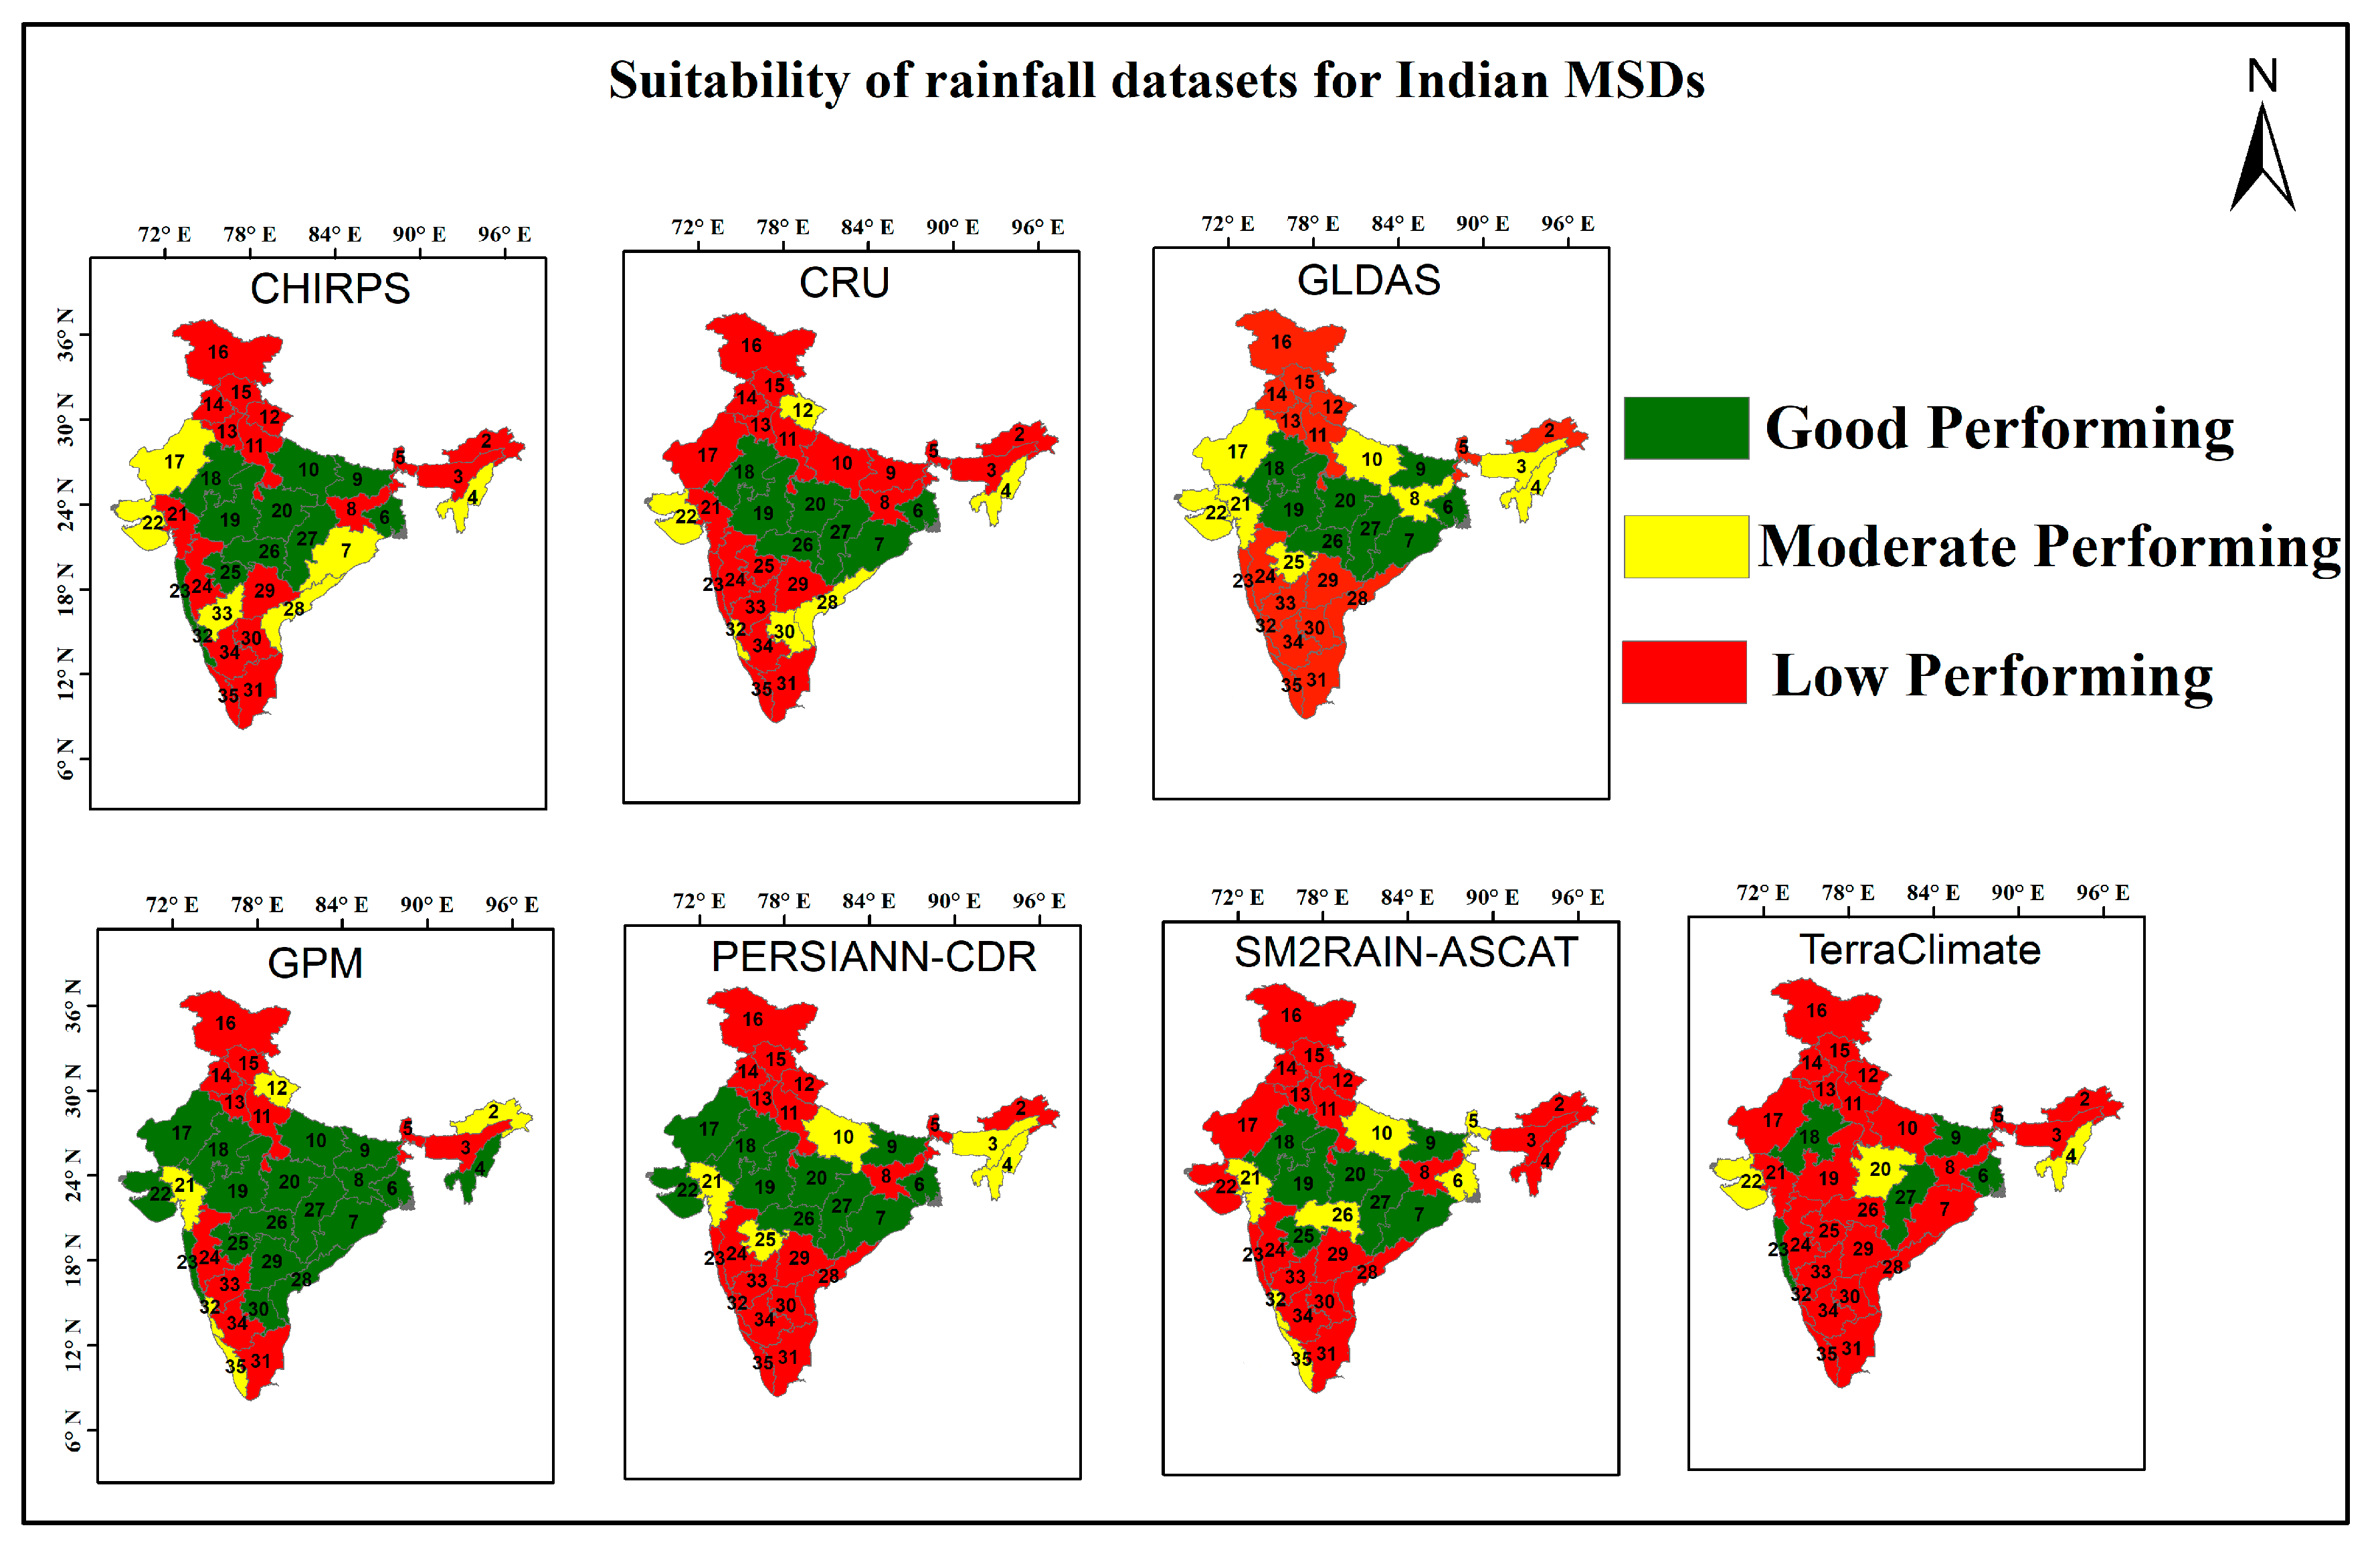
3.1. Dataset-Wise Suitability Analysis
3.1.1. CHIRPS
3.1.2. CRU
3.1.3. GLDAS
3.1.4. GPM
3.1.5. PERSIANN-CDR
3.1.6. SM2RAIN
3.1.7. TerraClimate
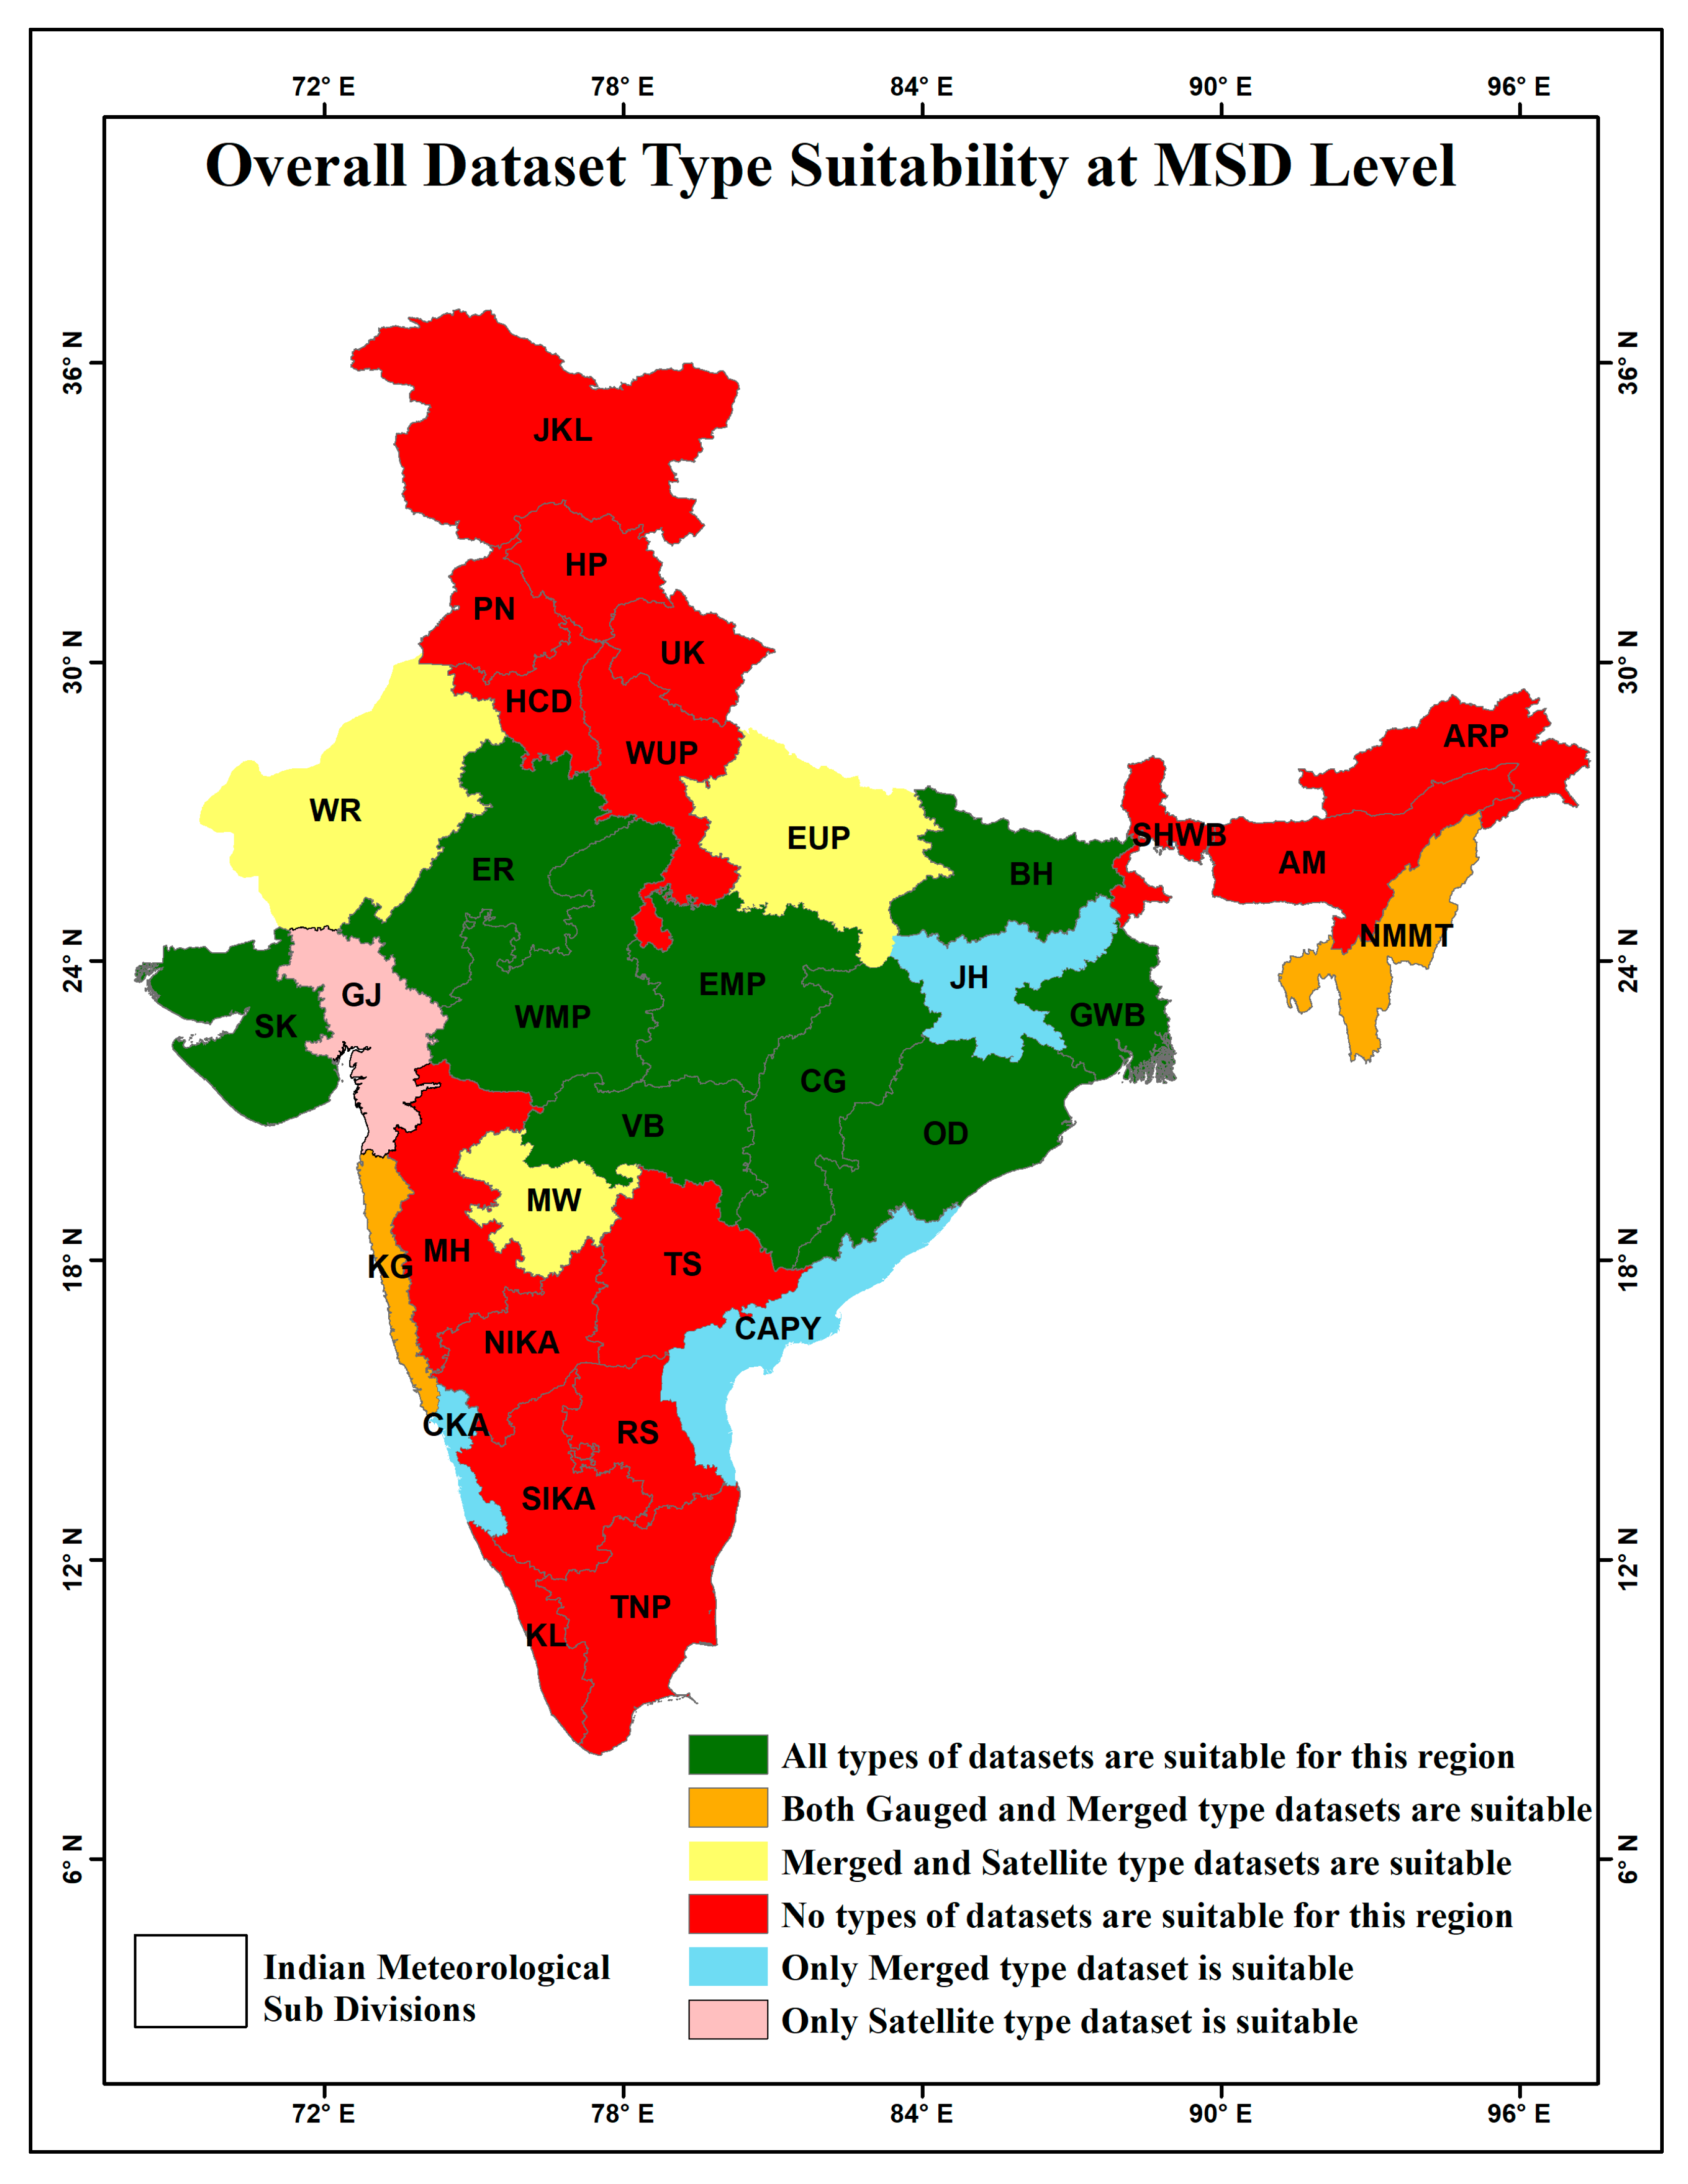
3.2. Rainfall Dataset Type Suitability for MSDs
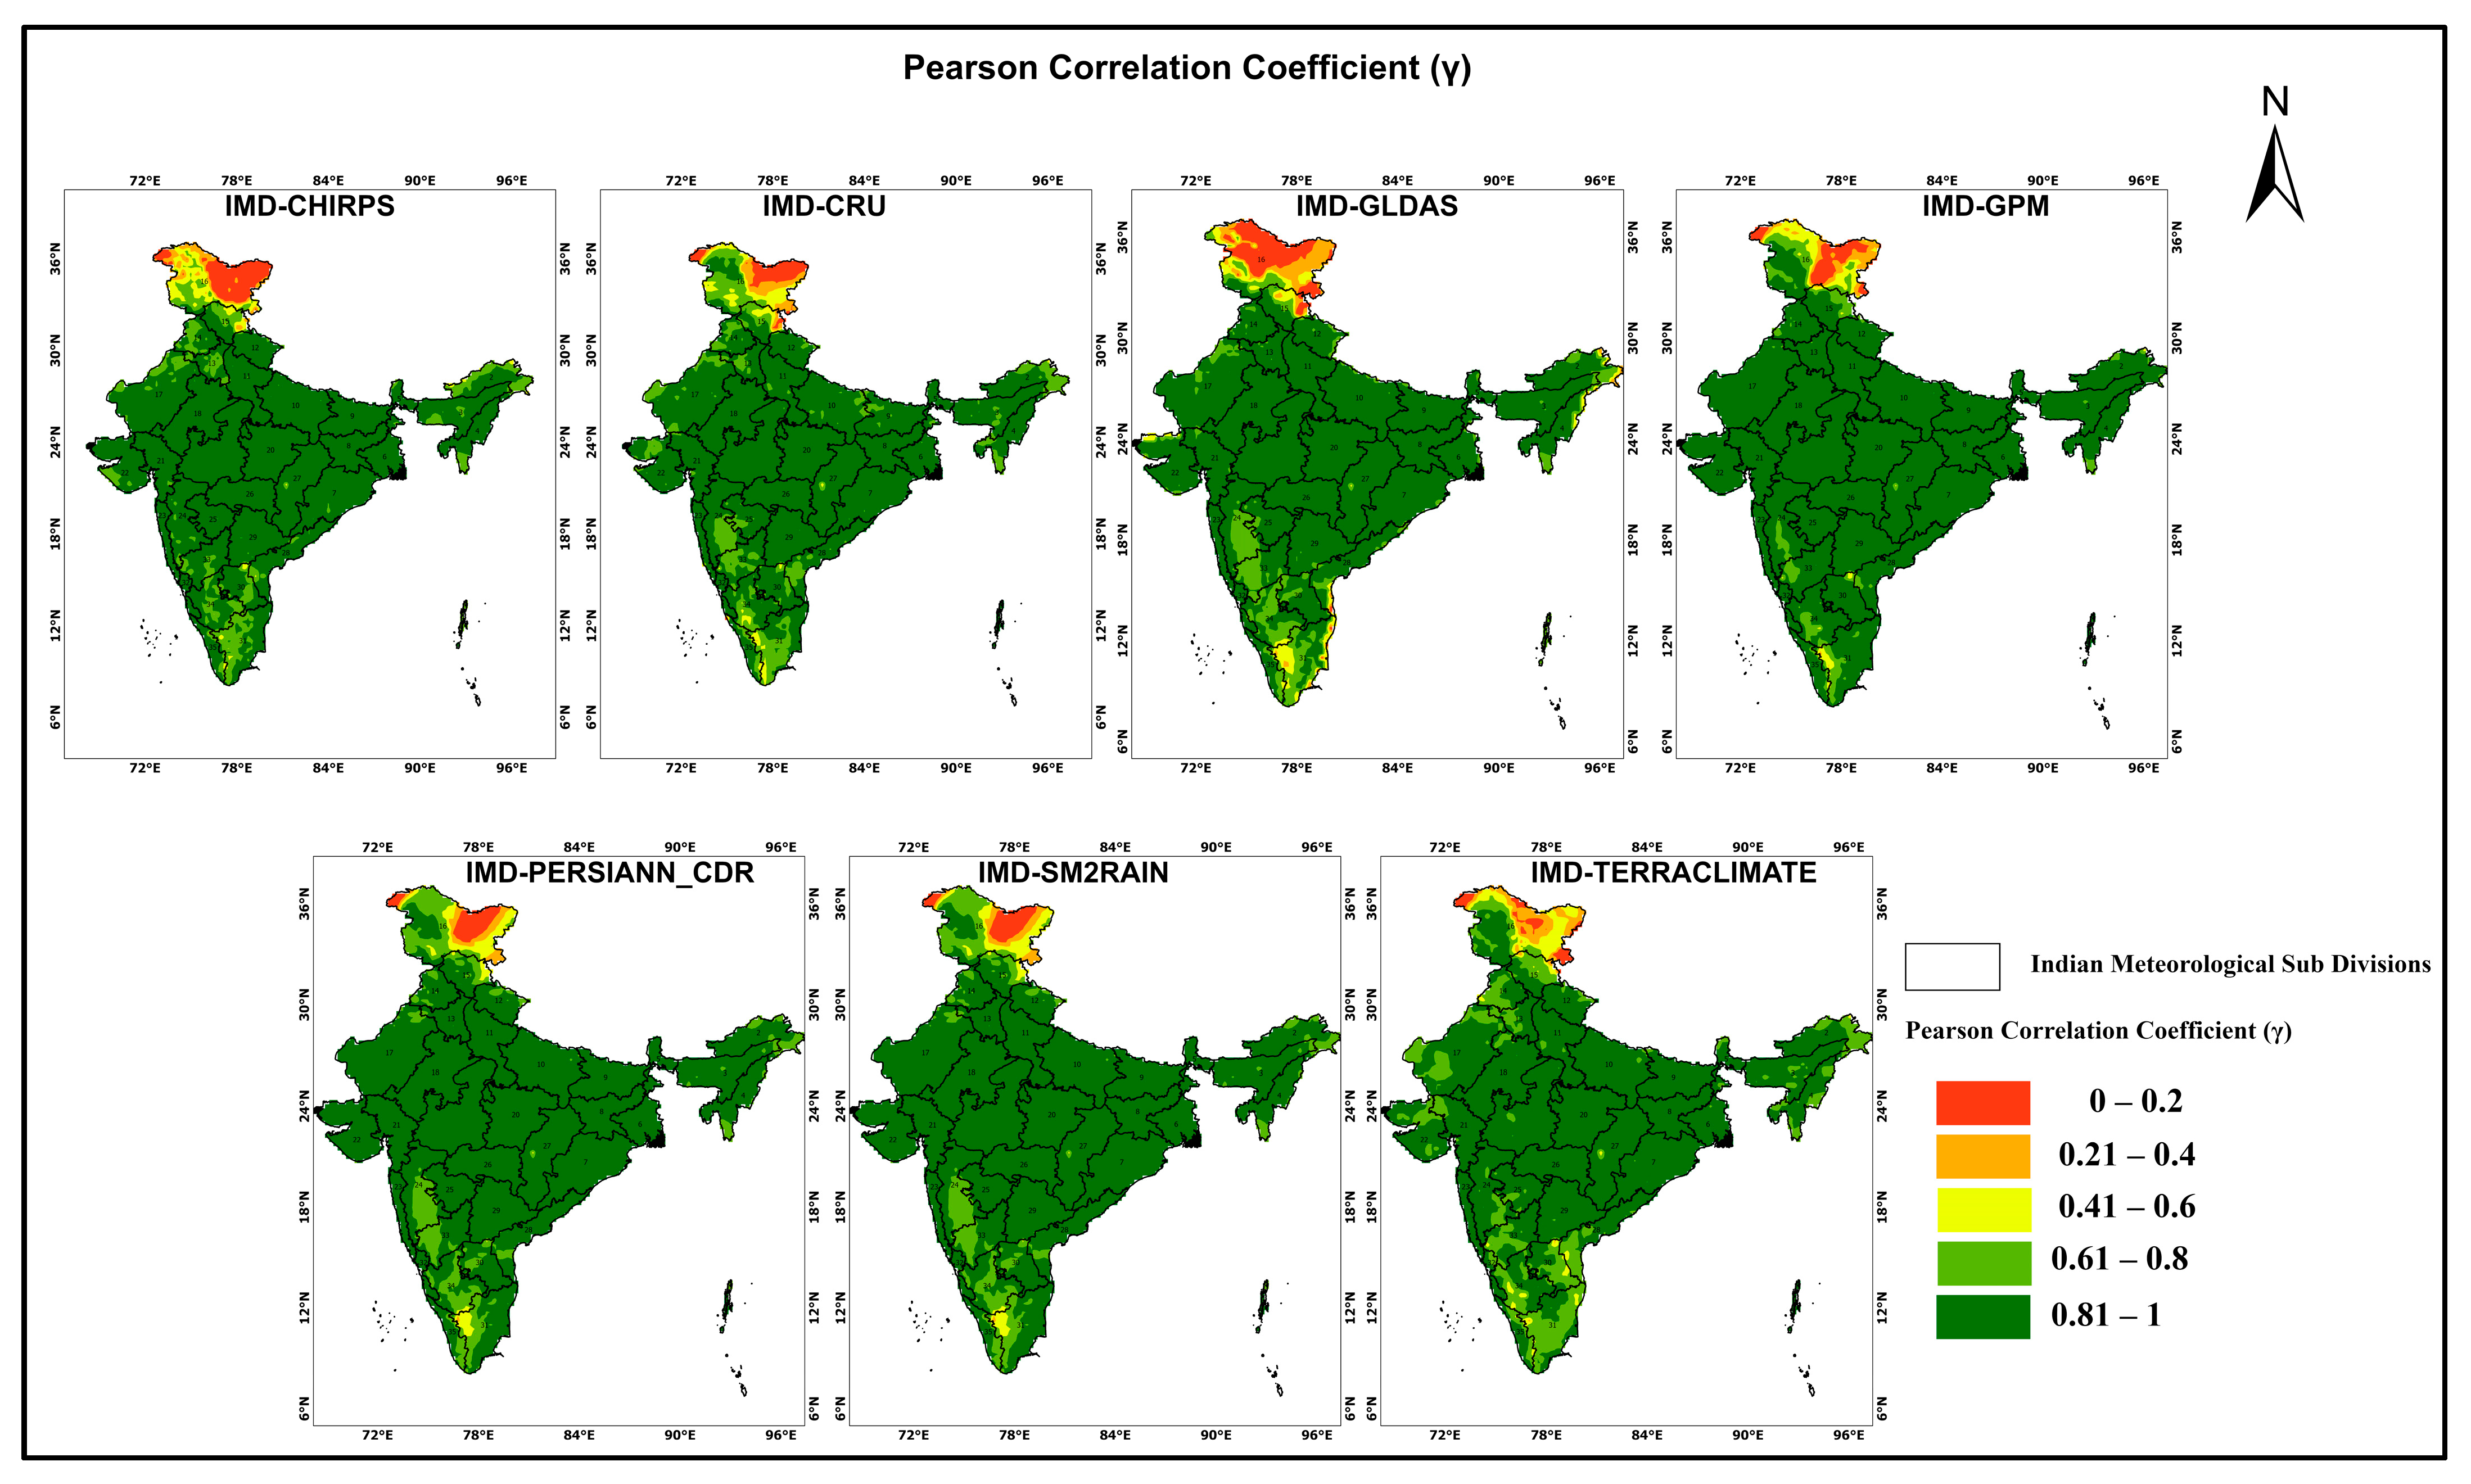
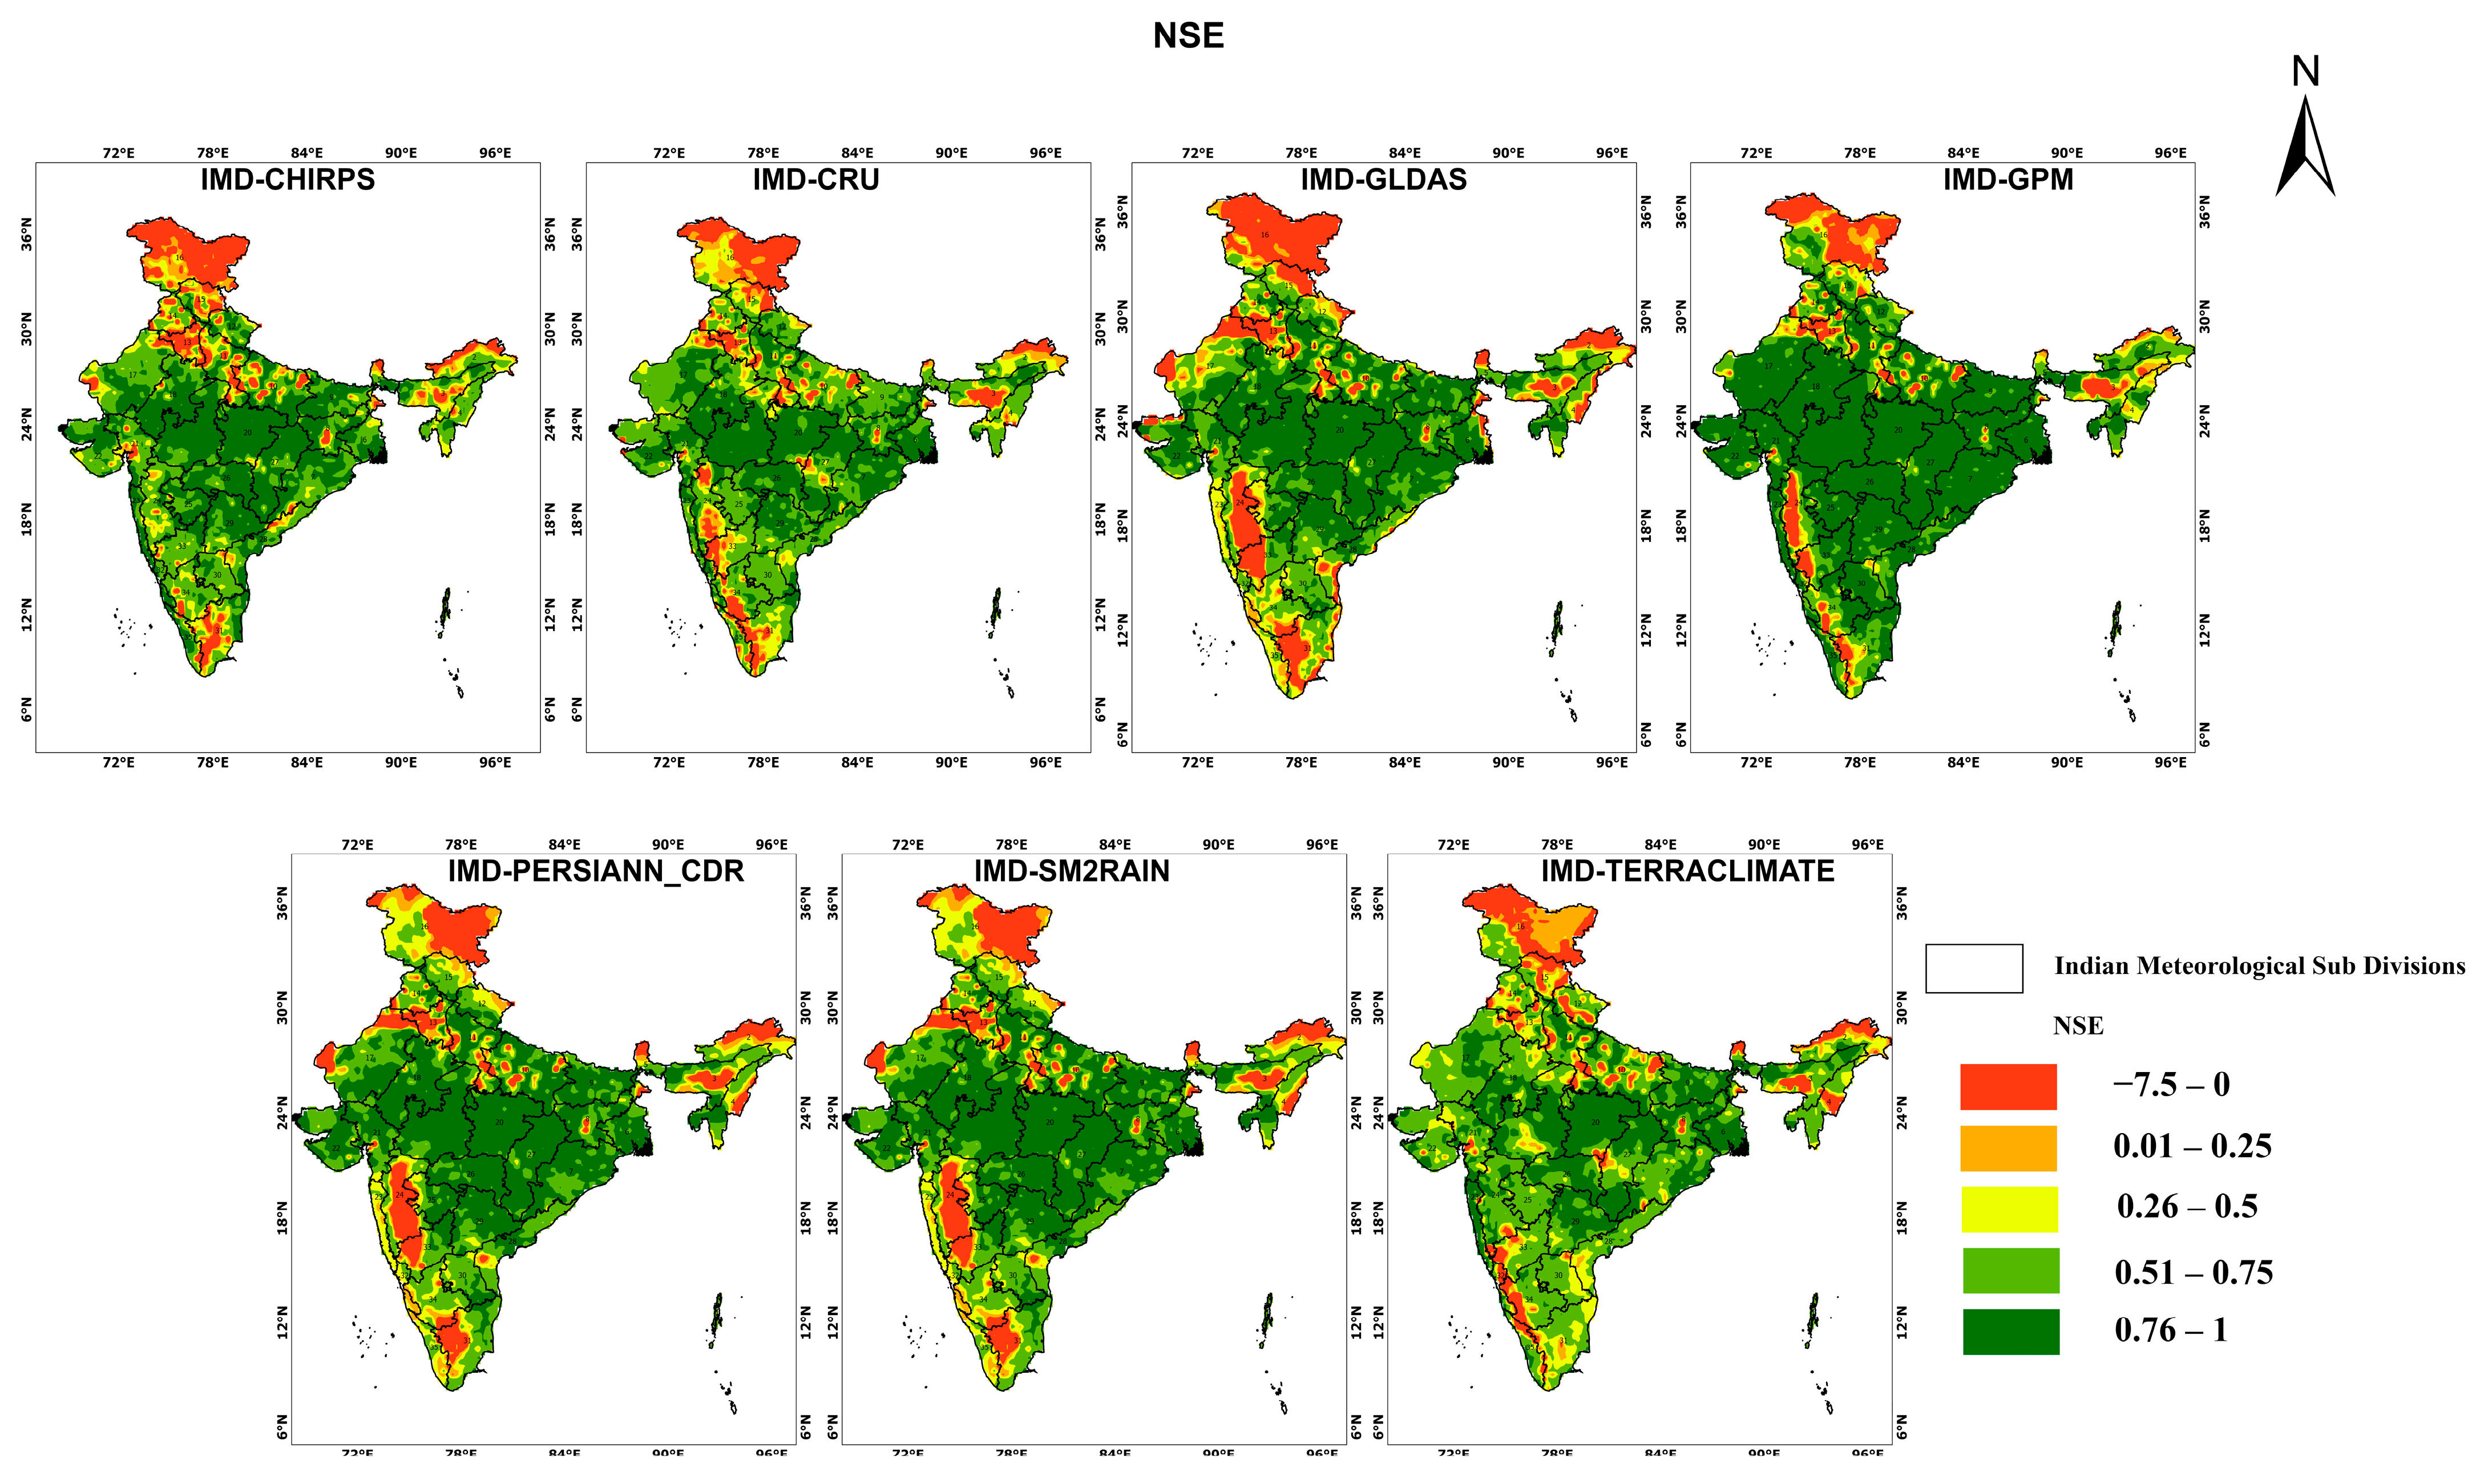
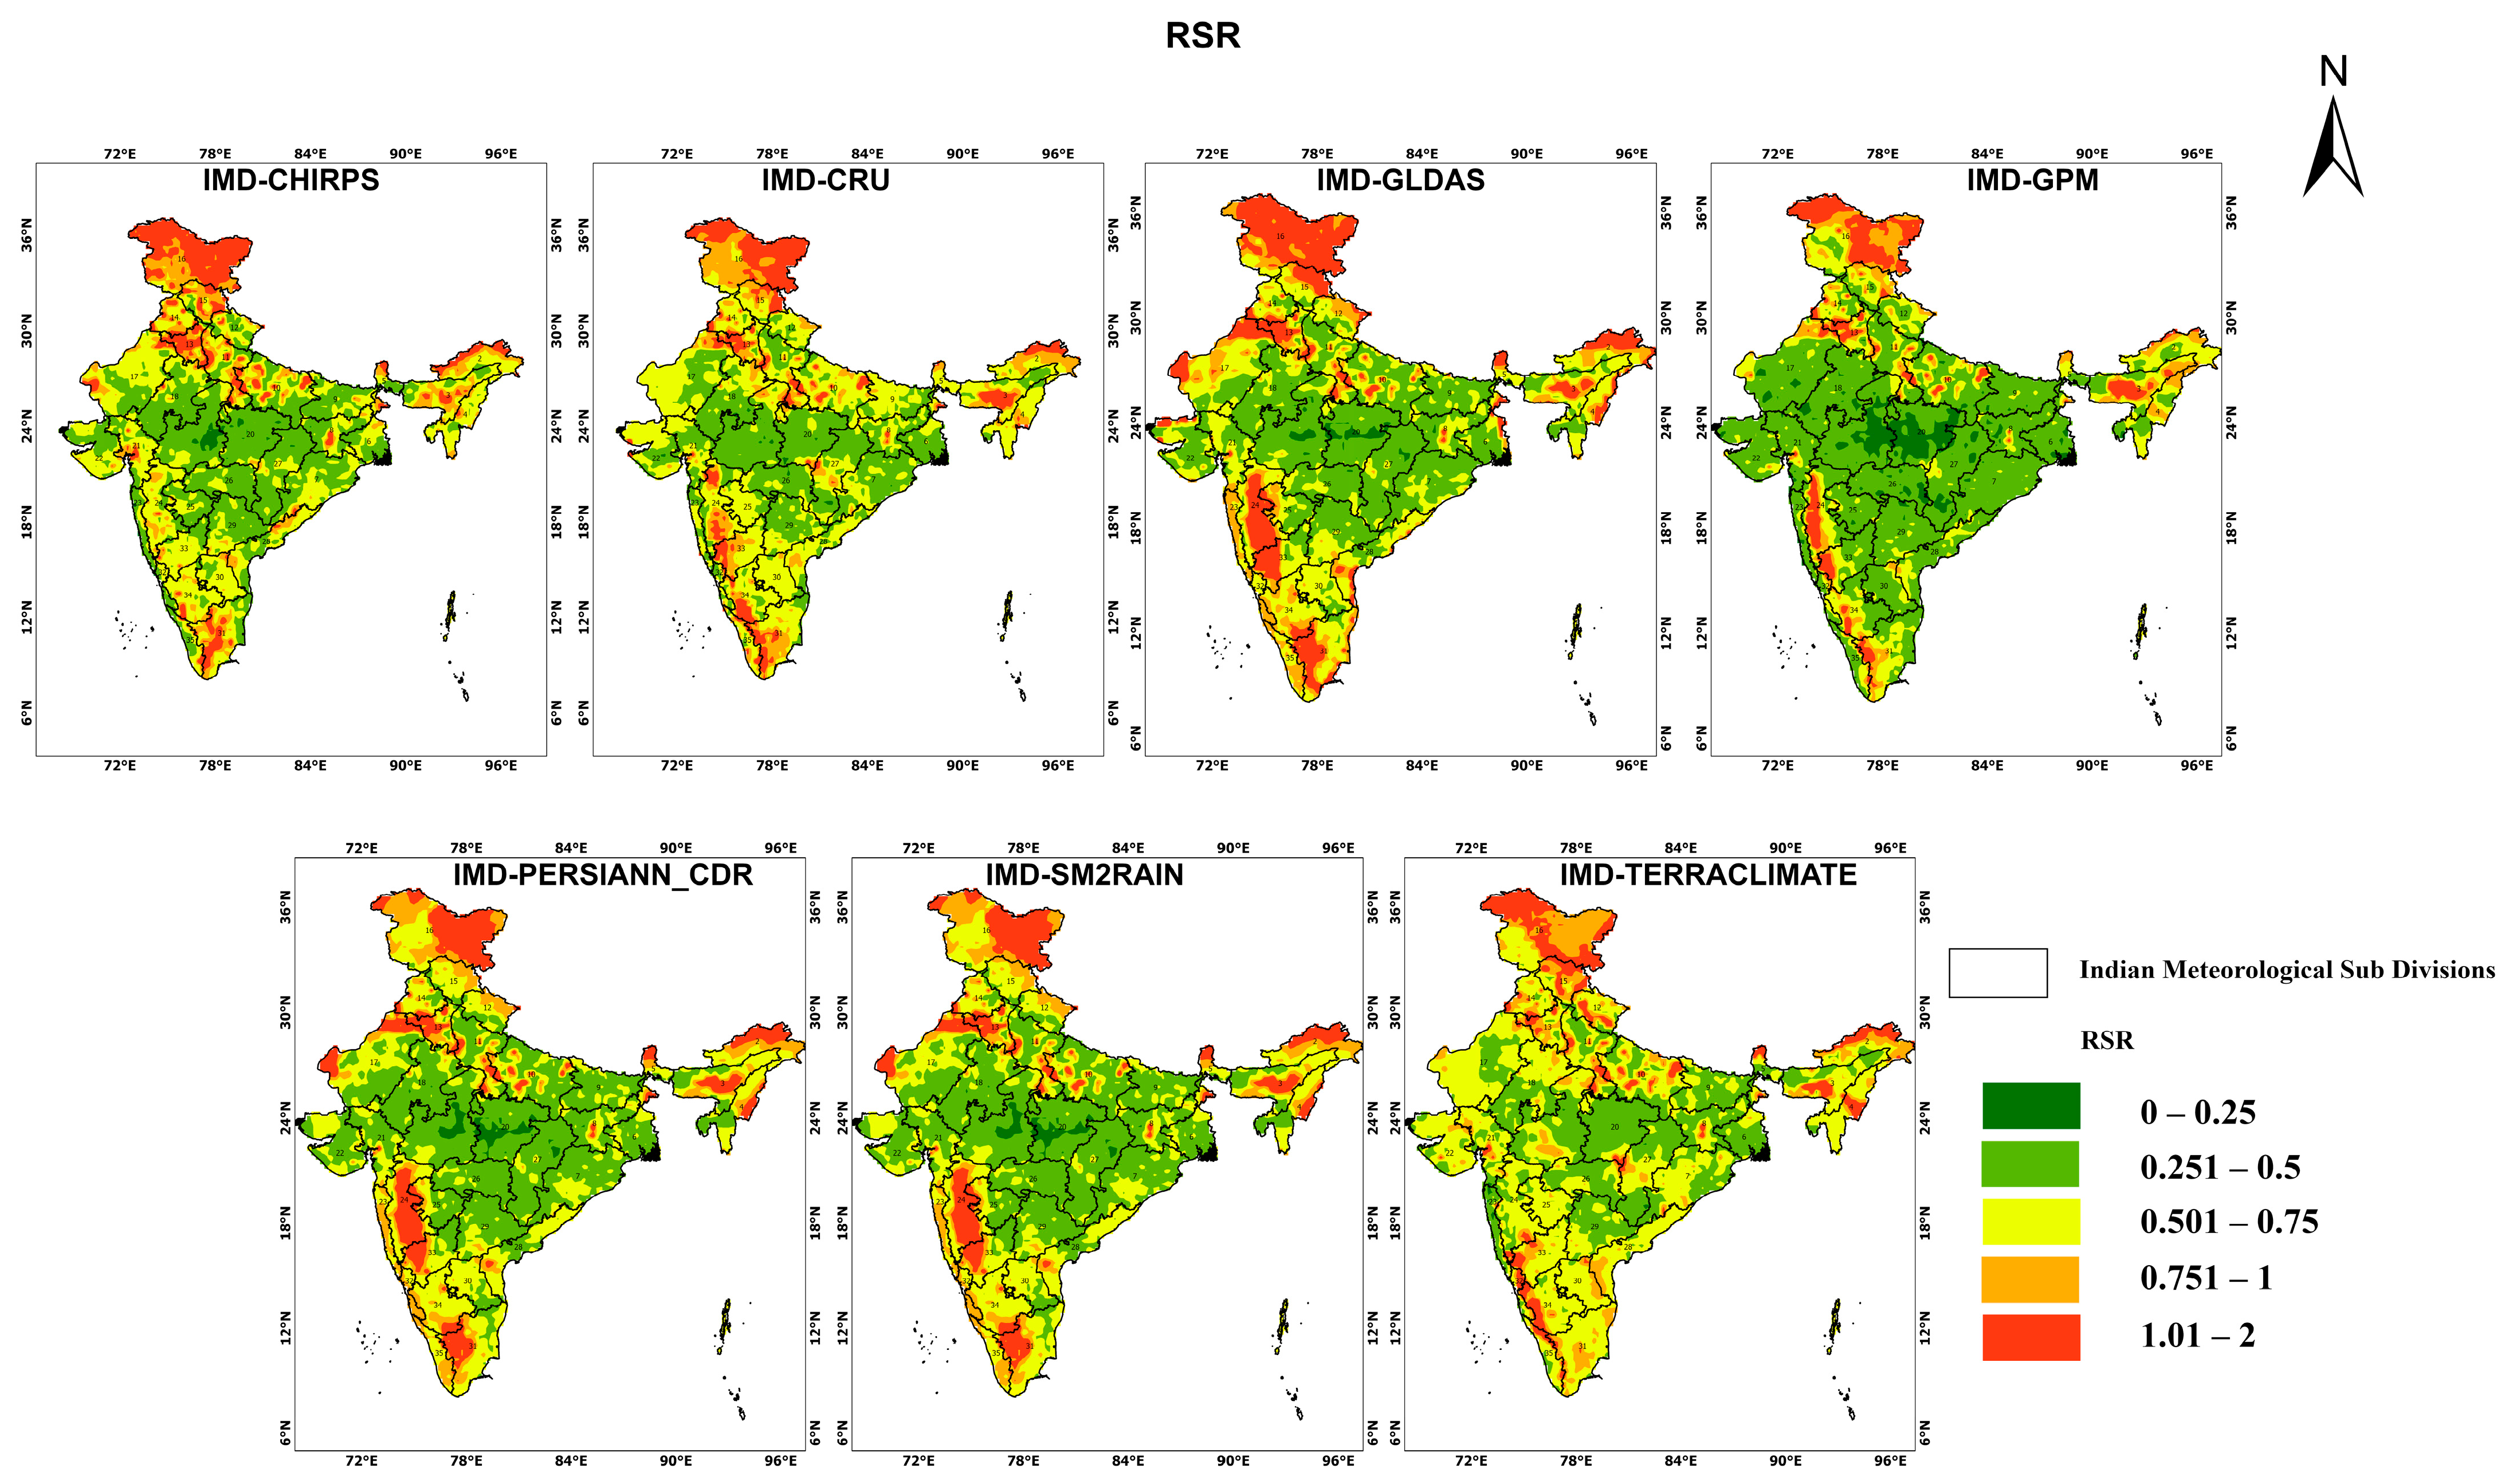
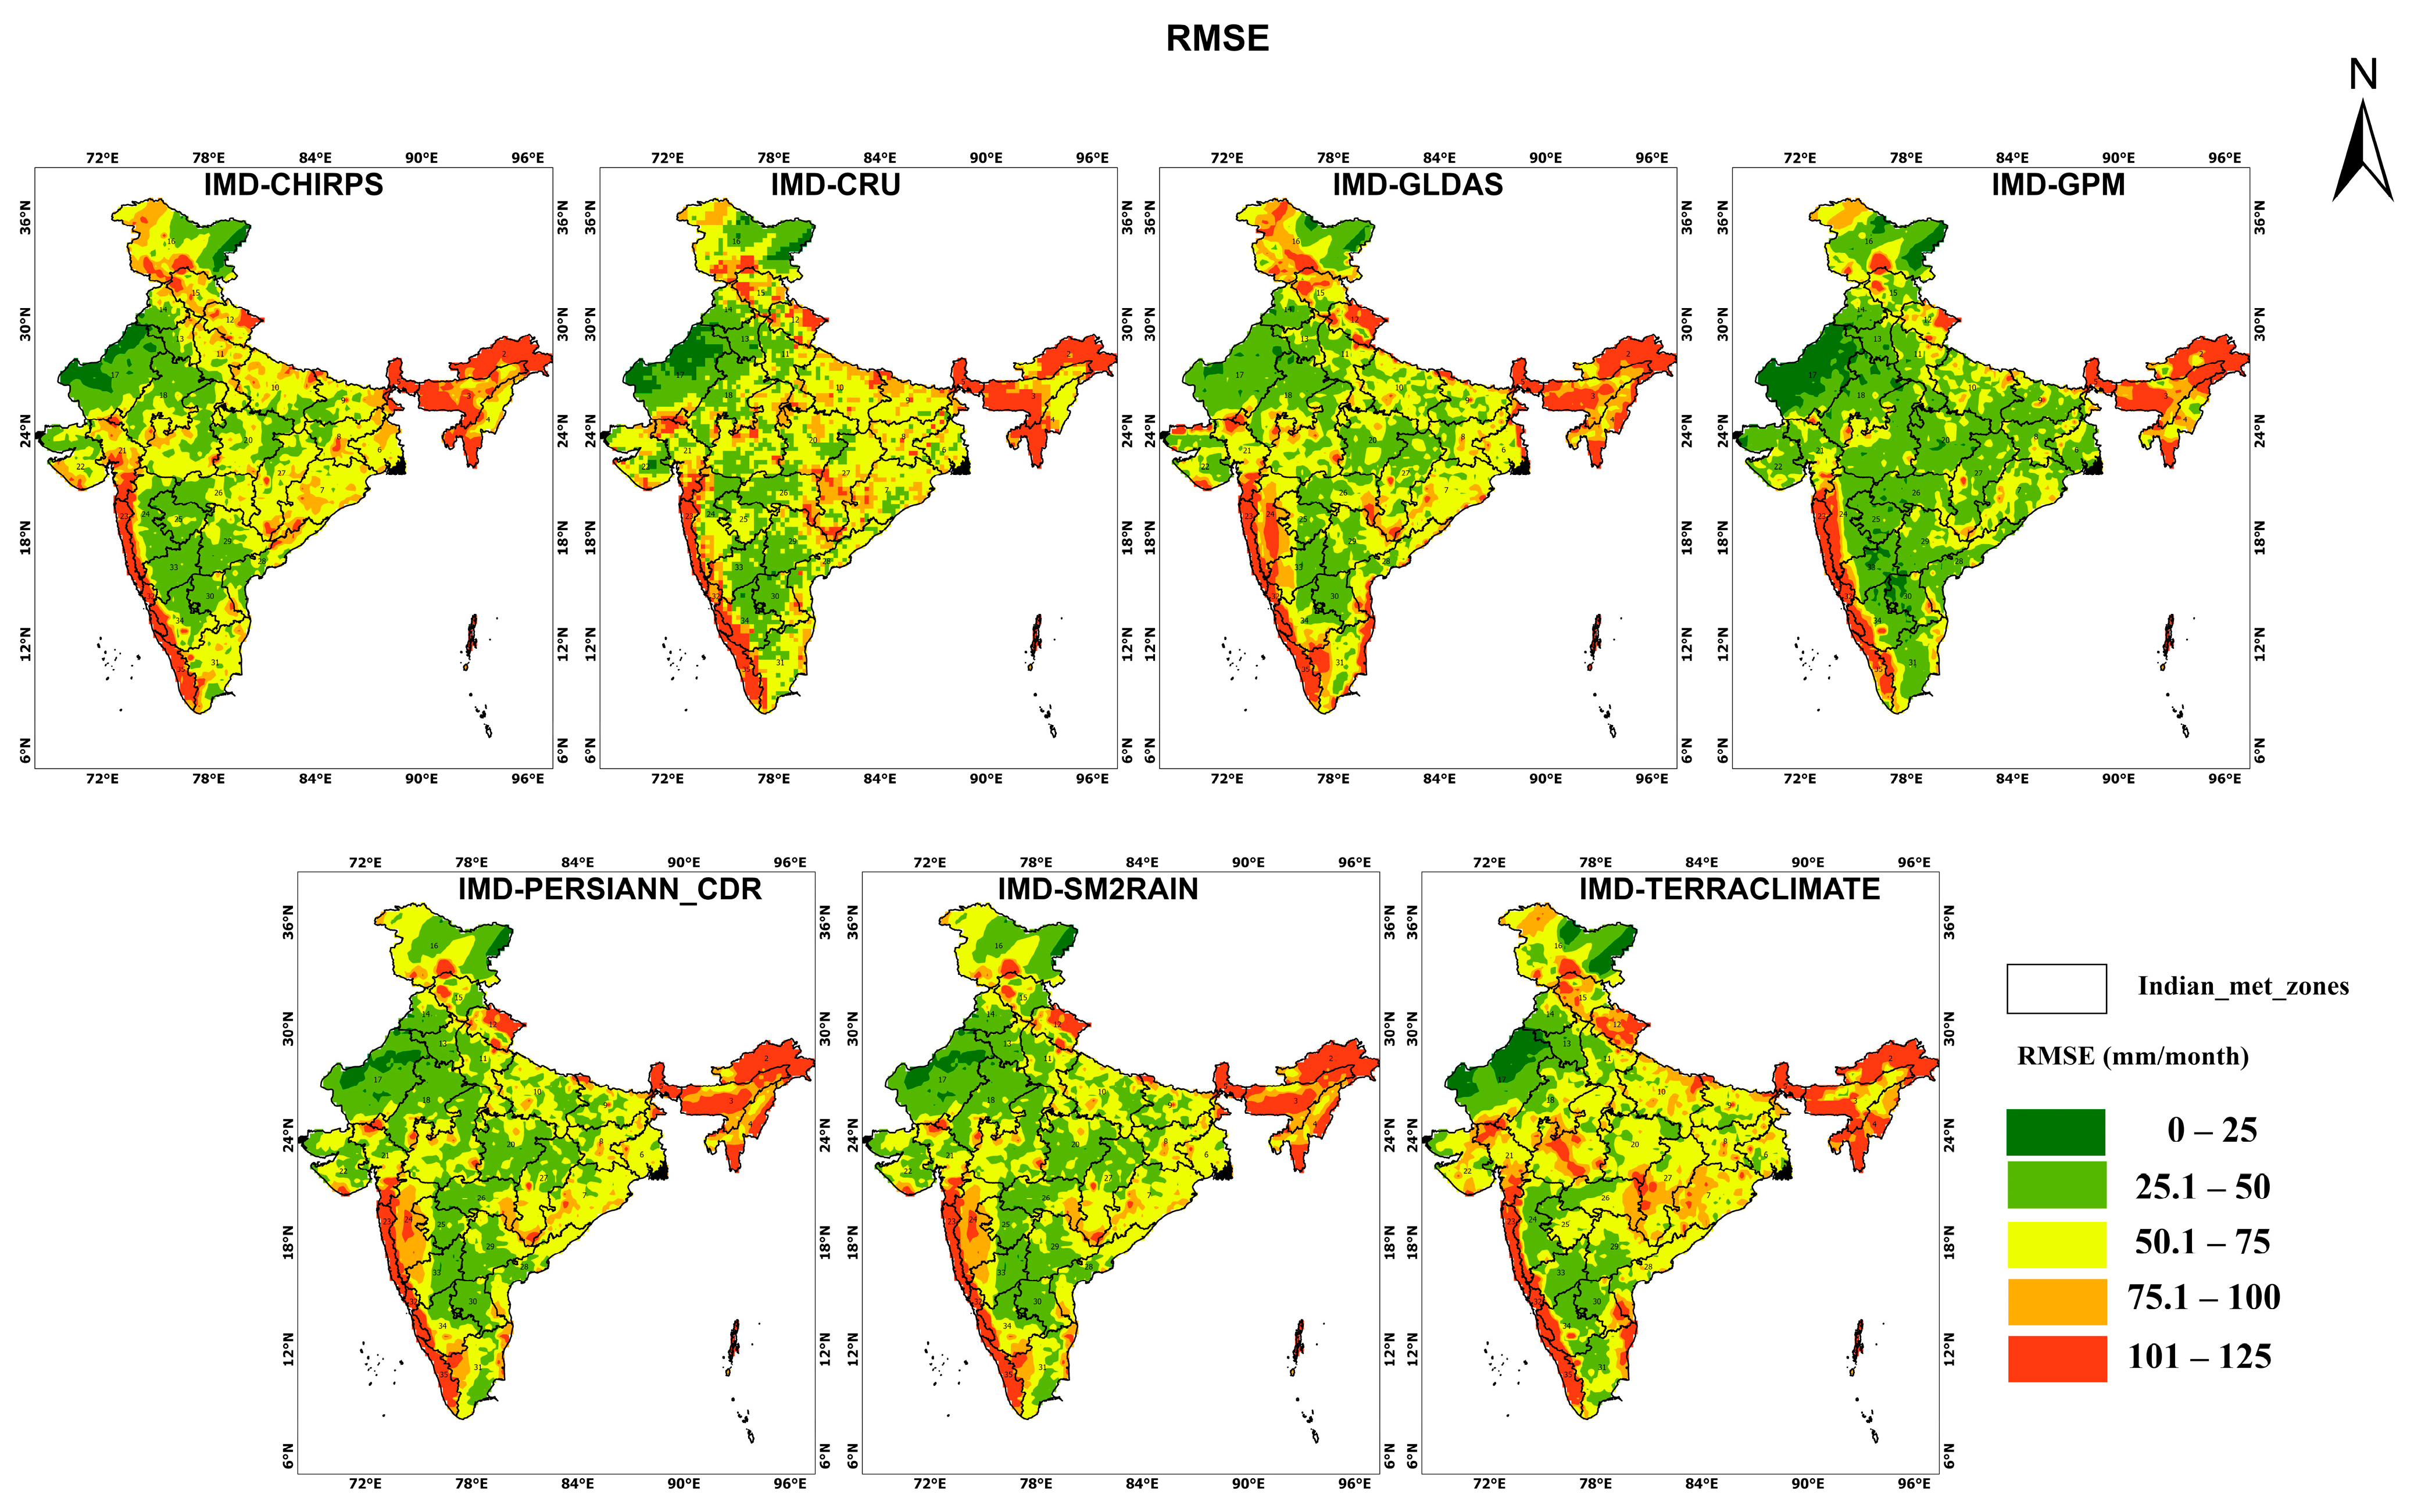
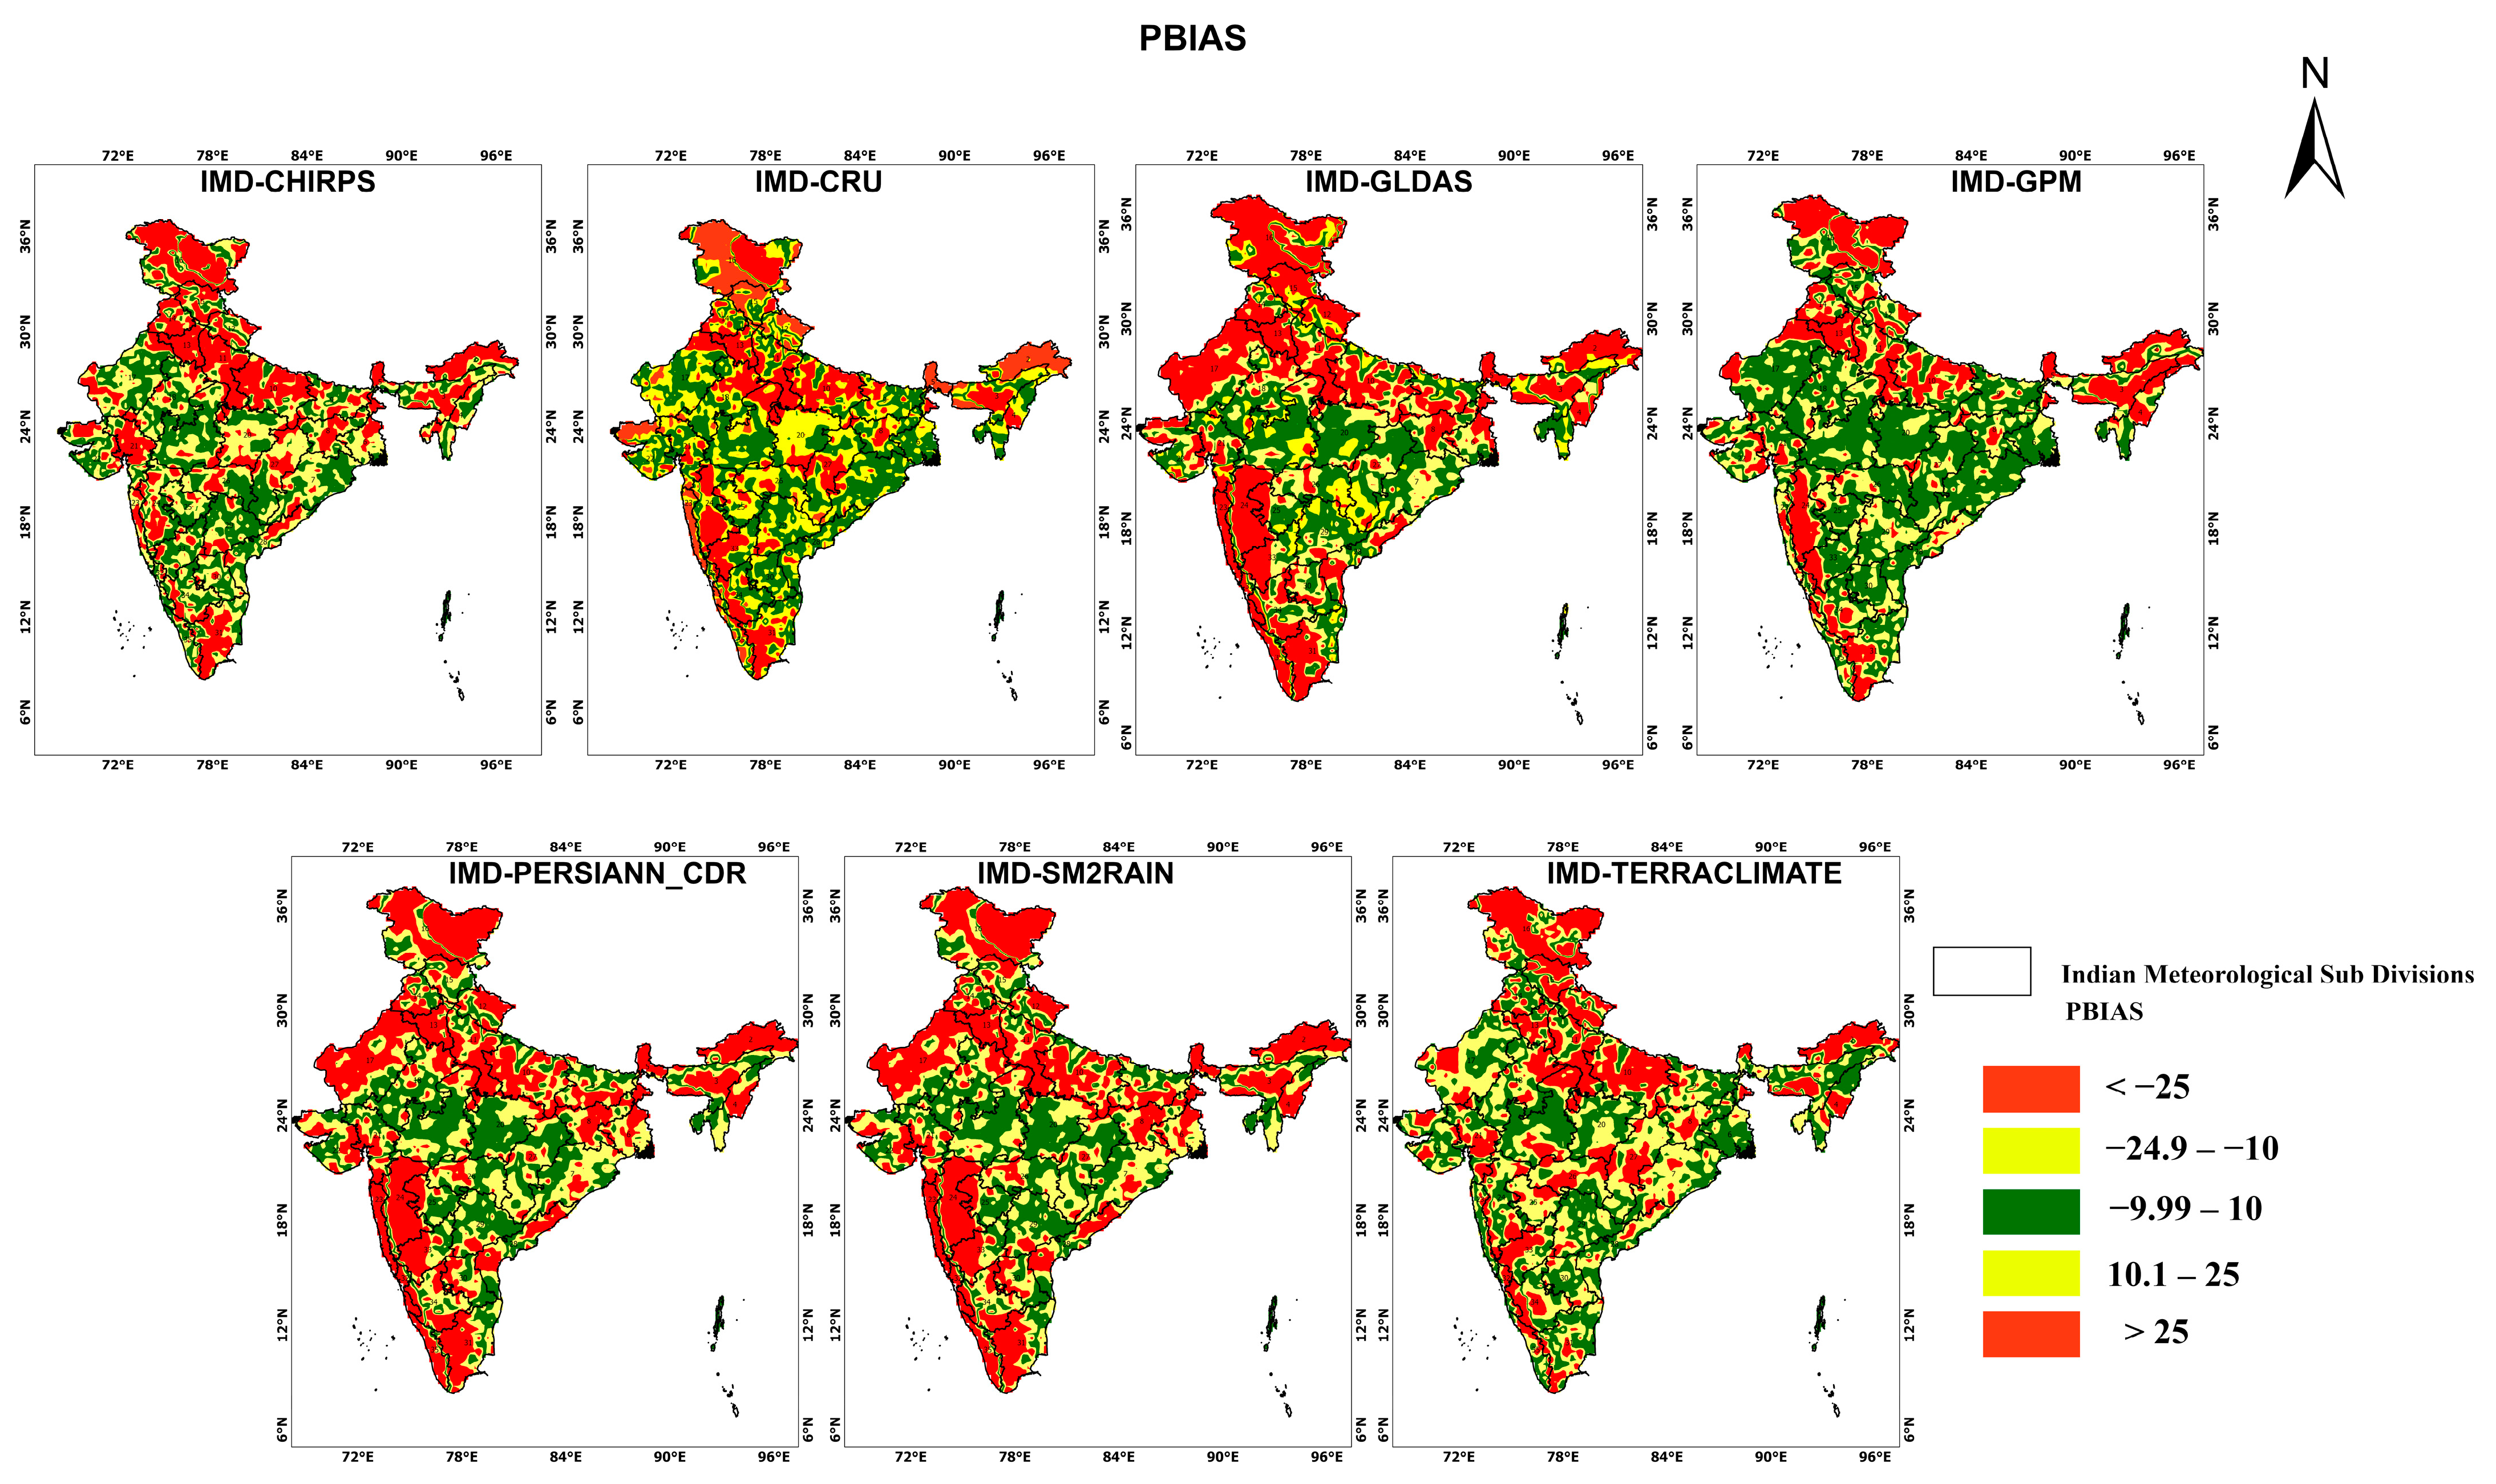
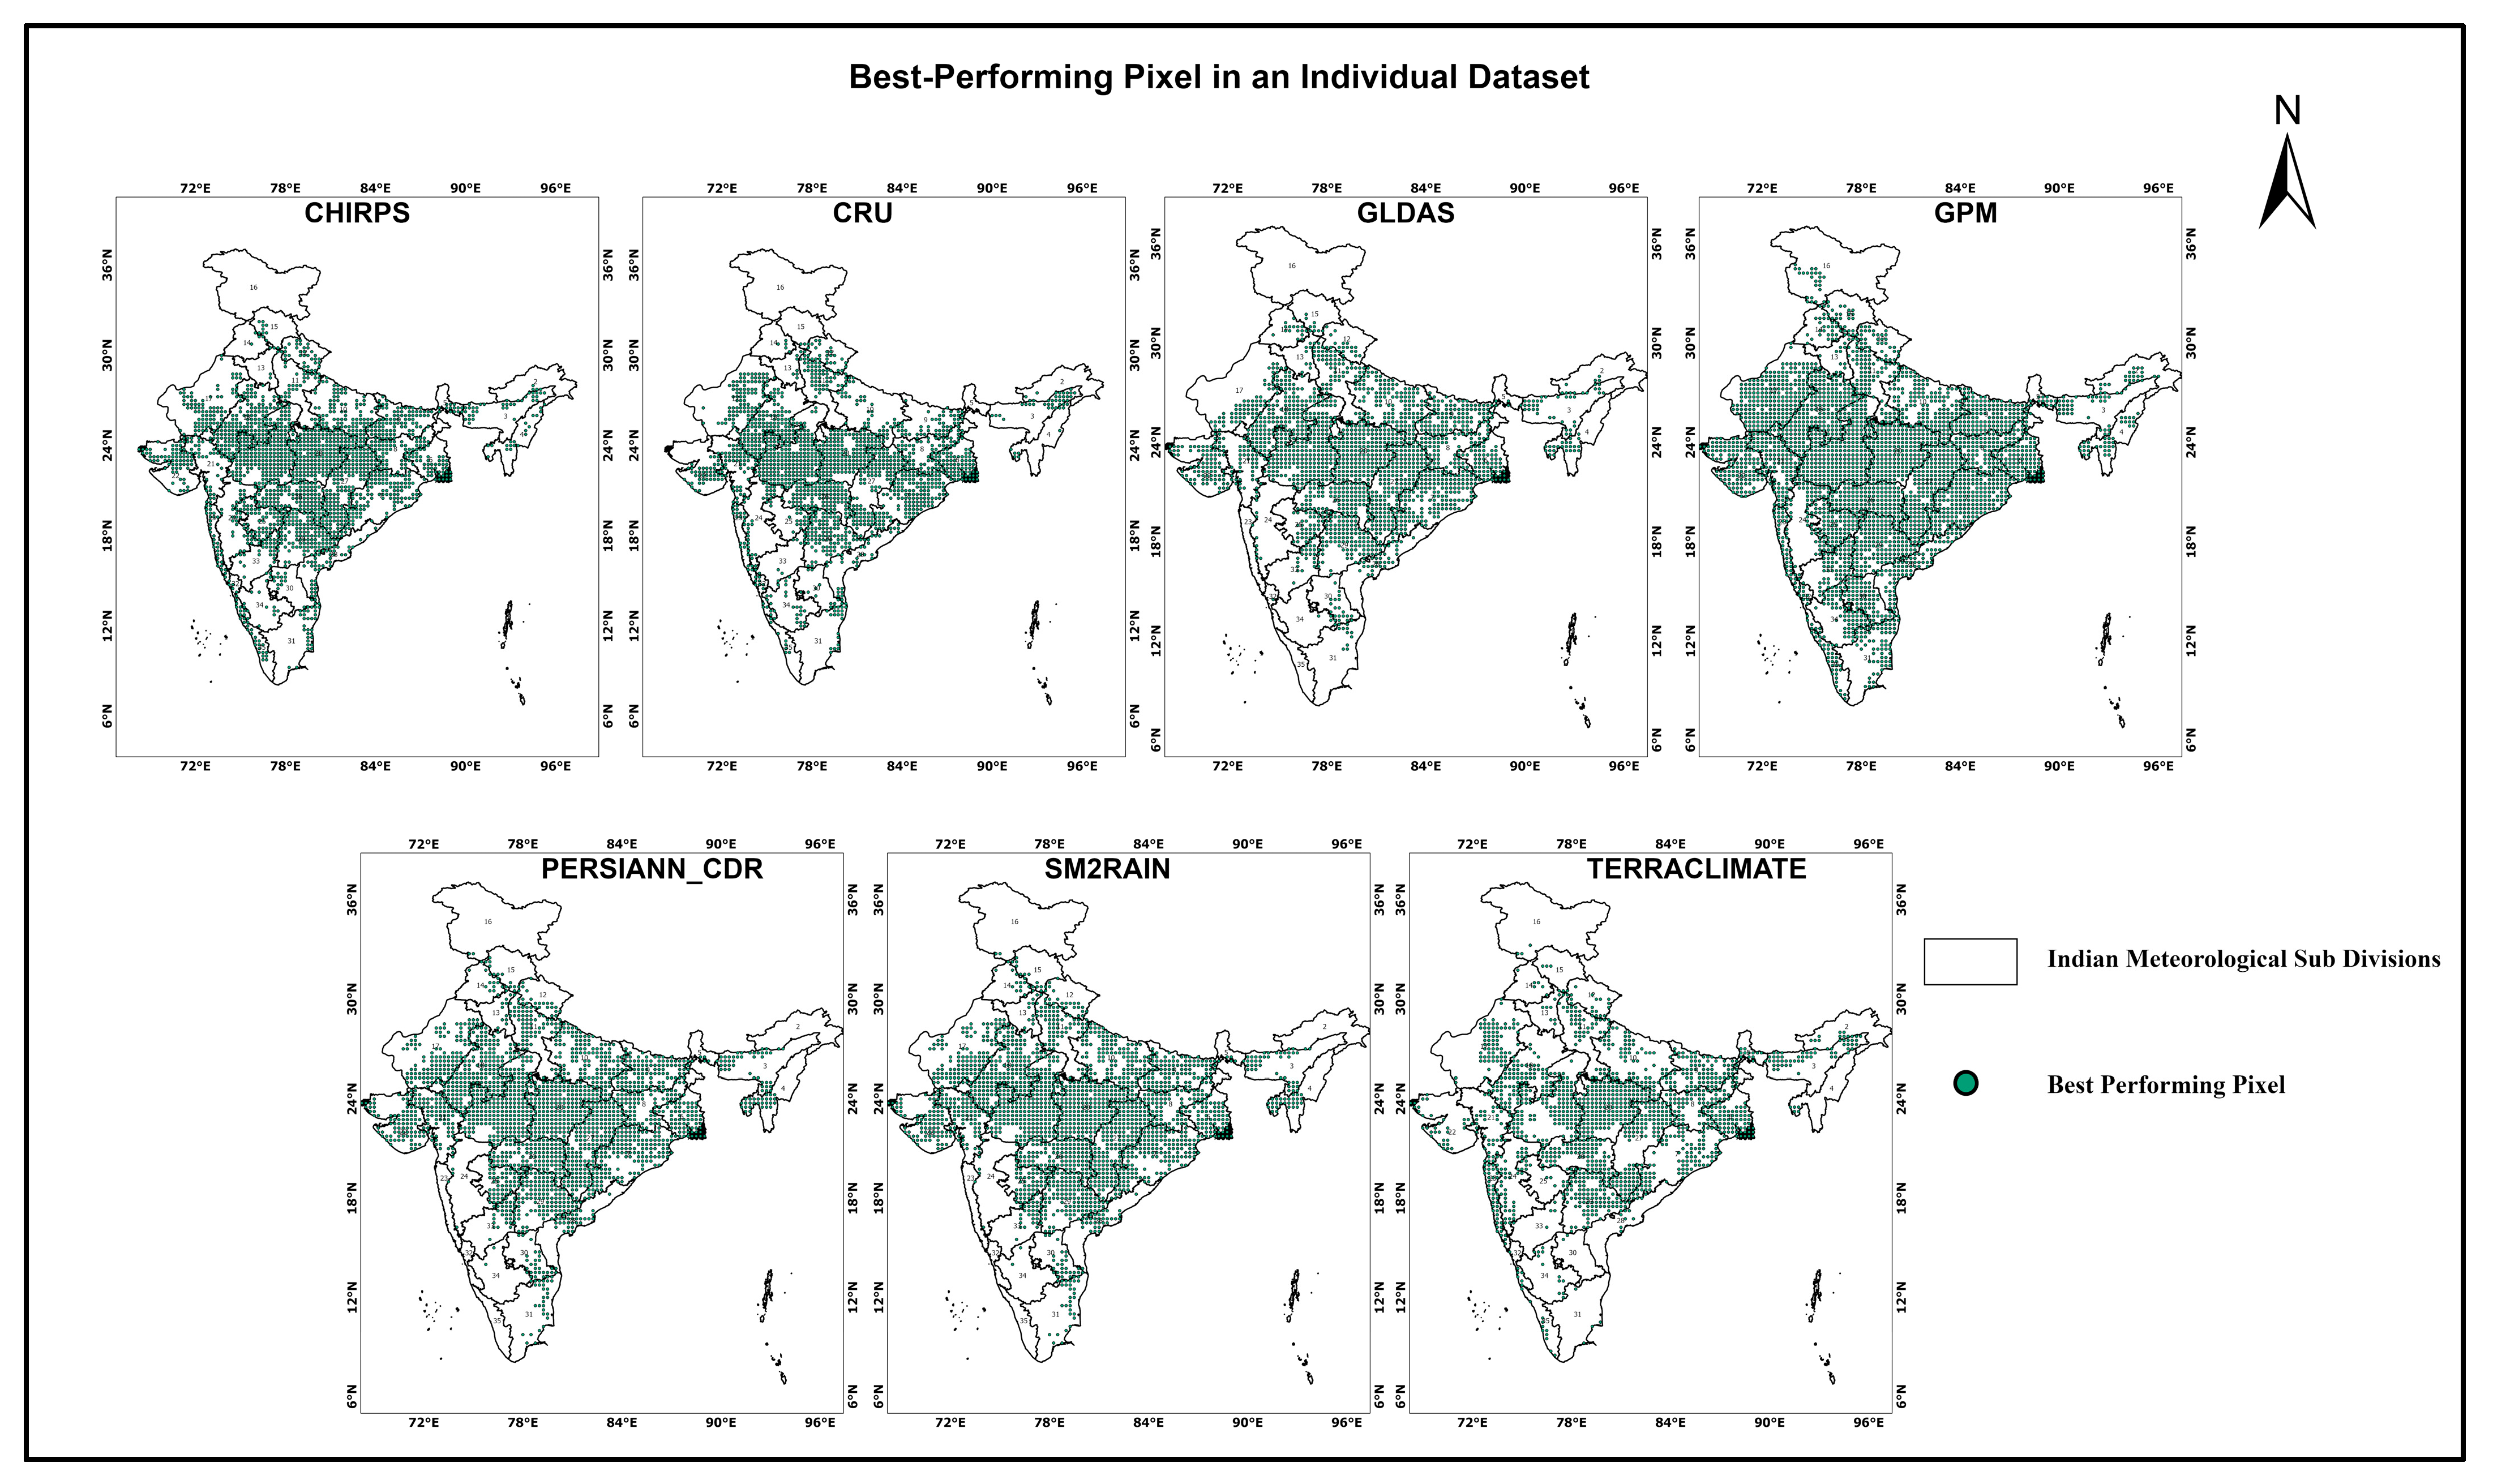
3.3. Pixel Wise Analysis
India as a Whole
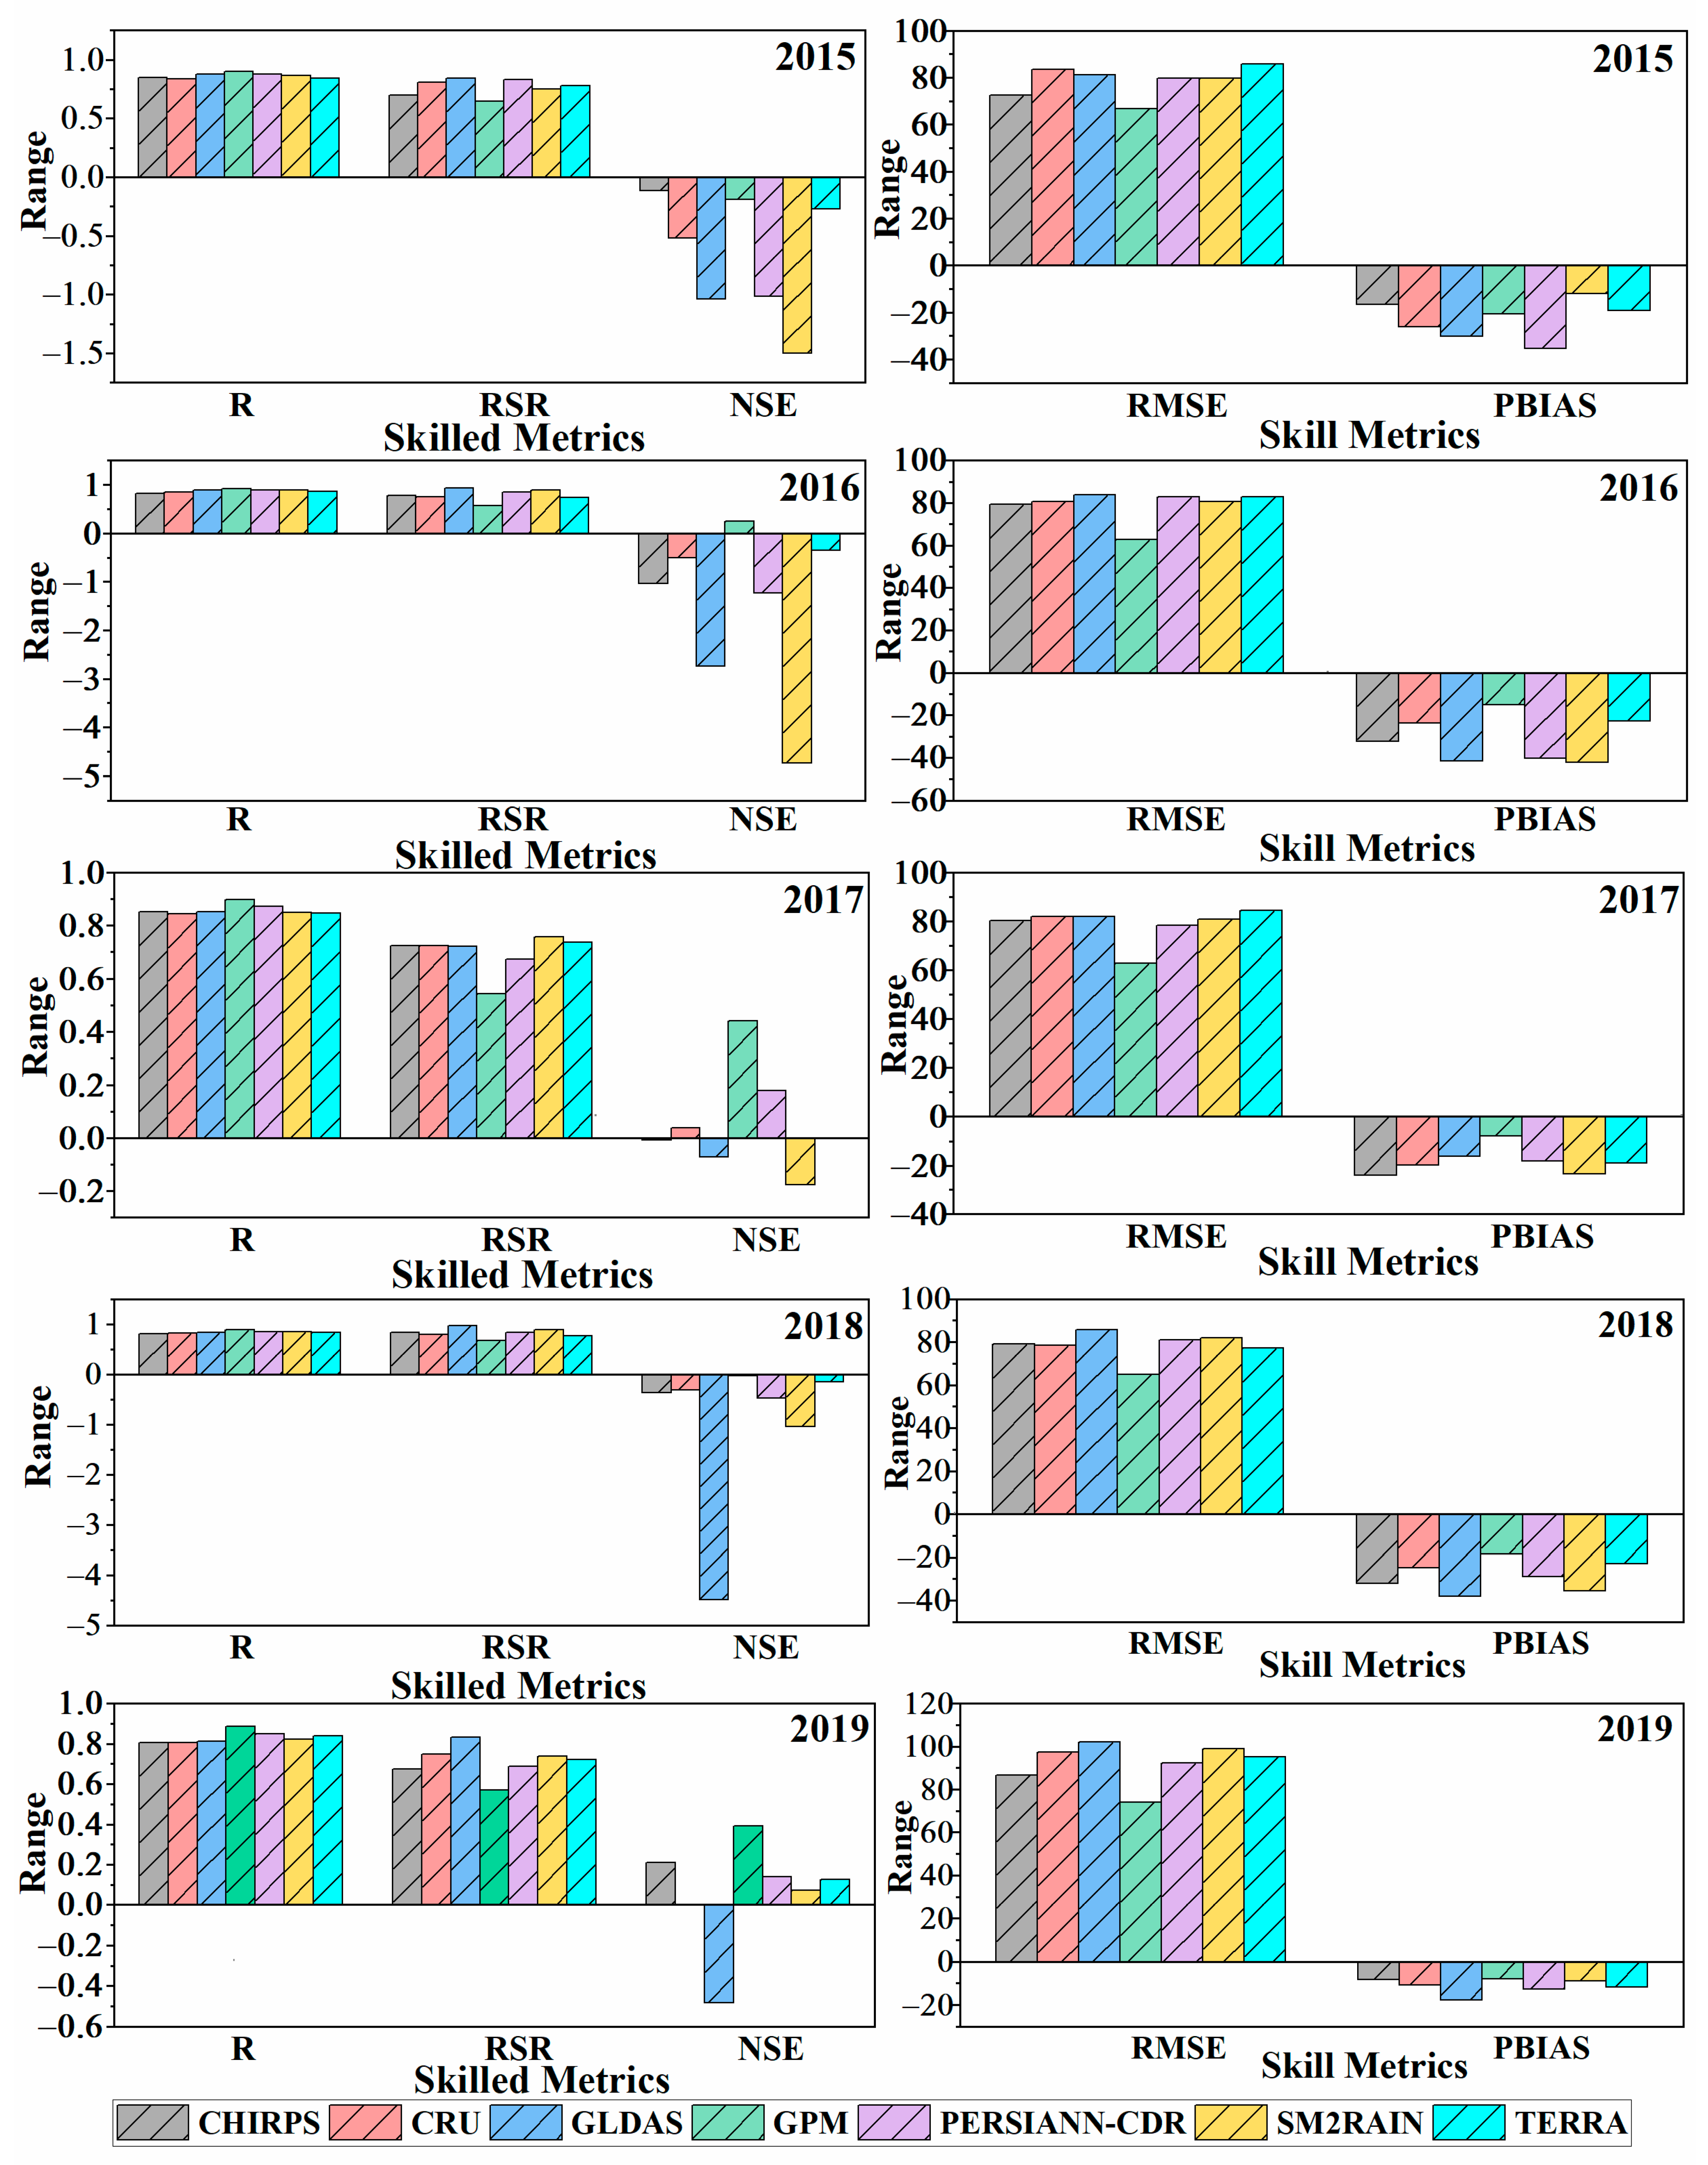
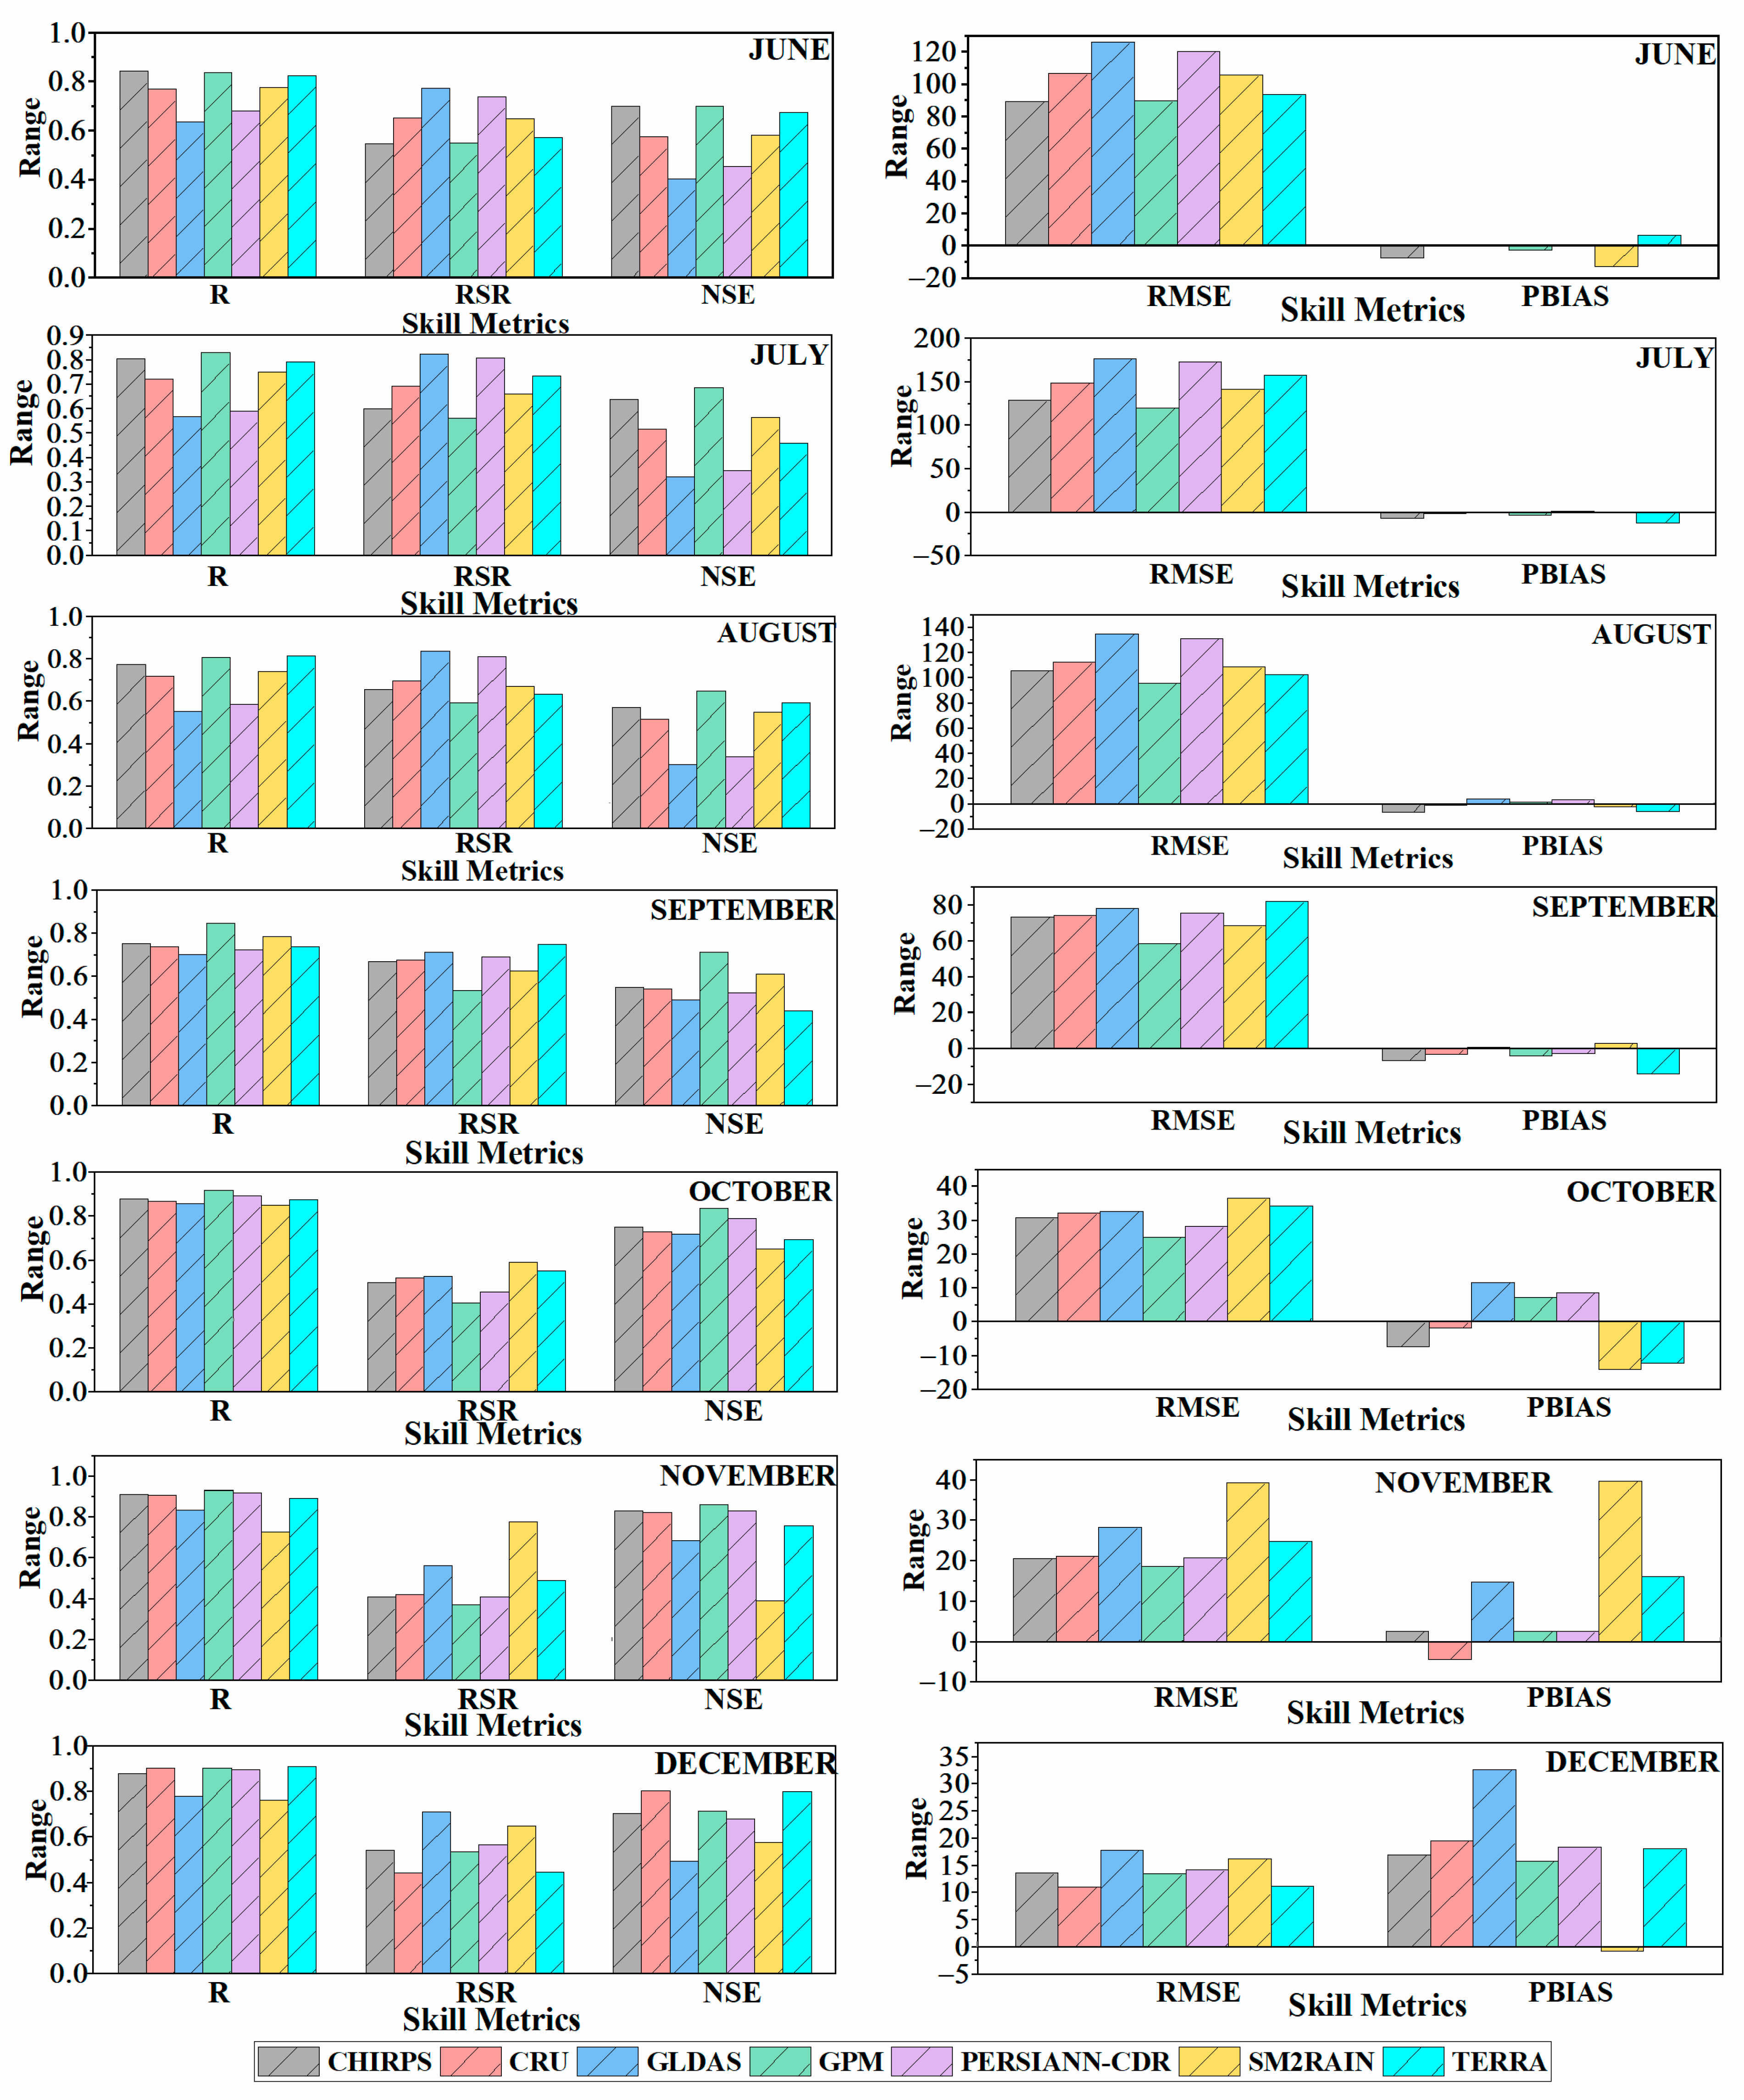
3.4. Temporal Analysis of Rainfall Datasets for India
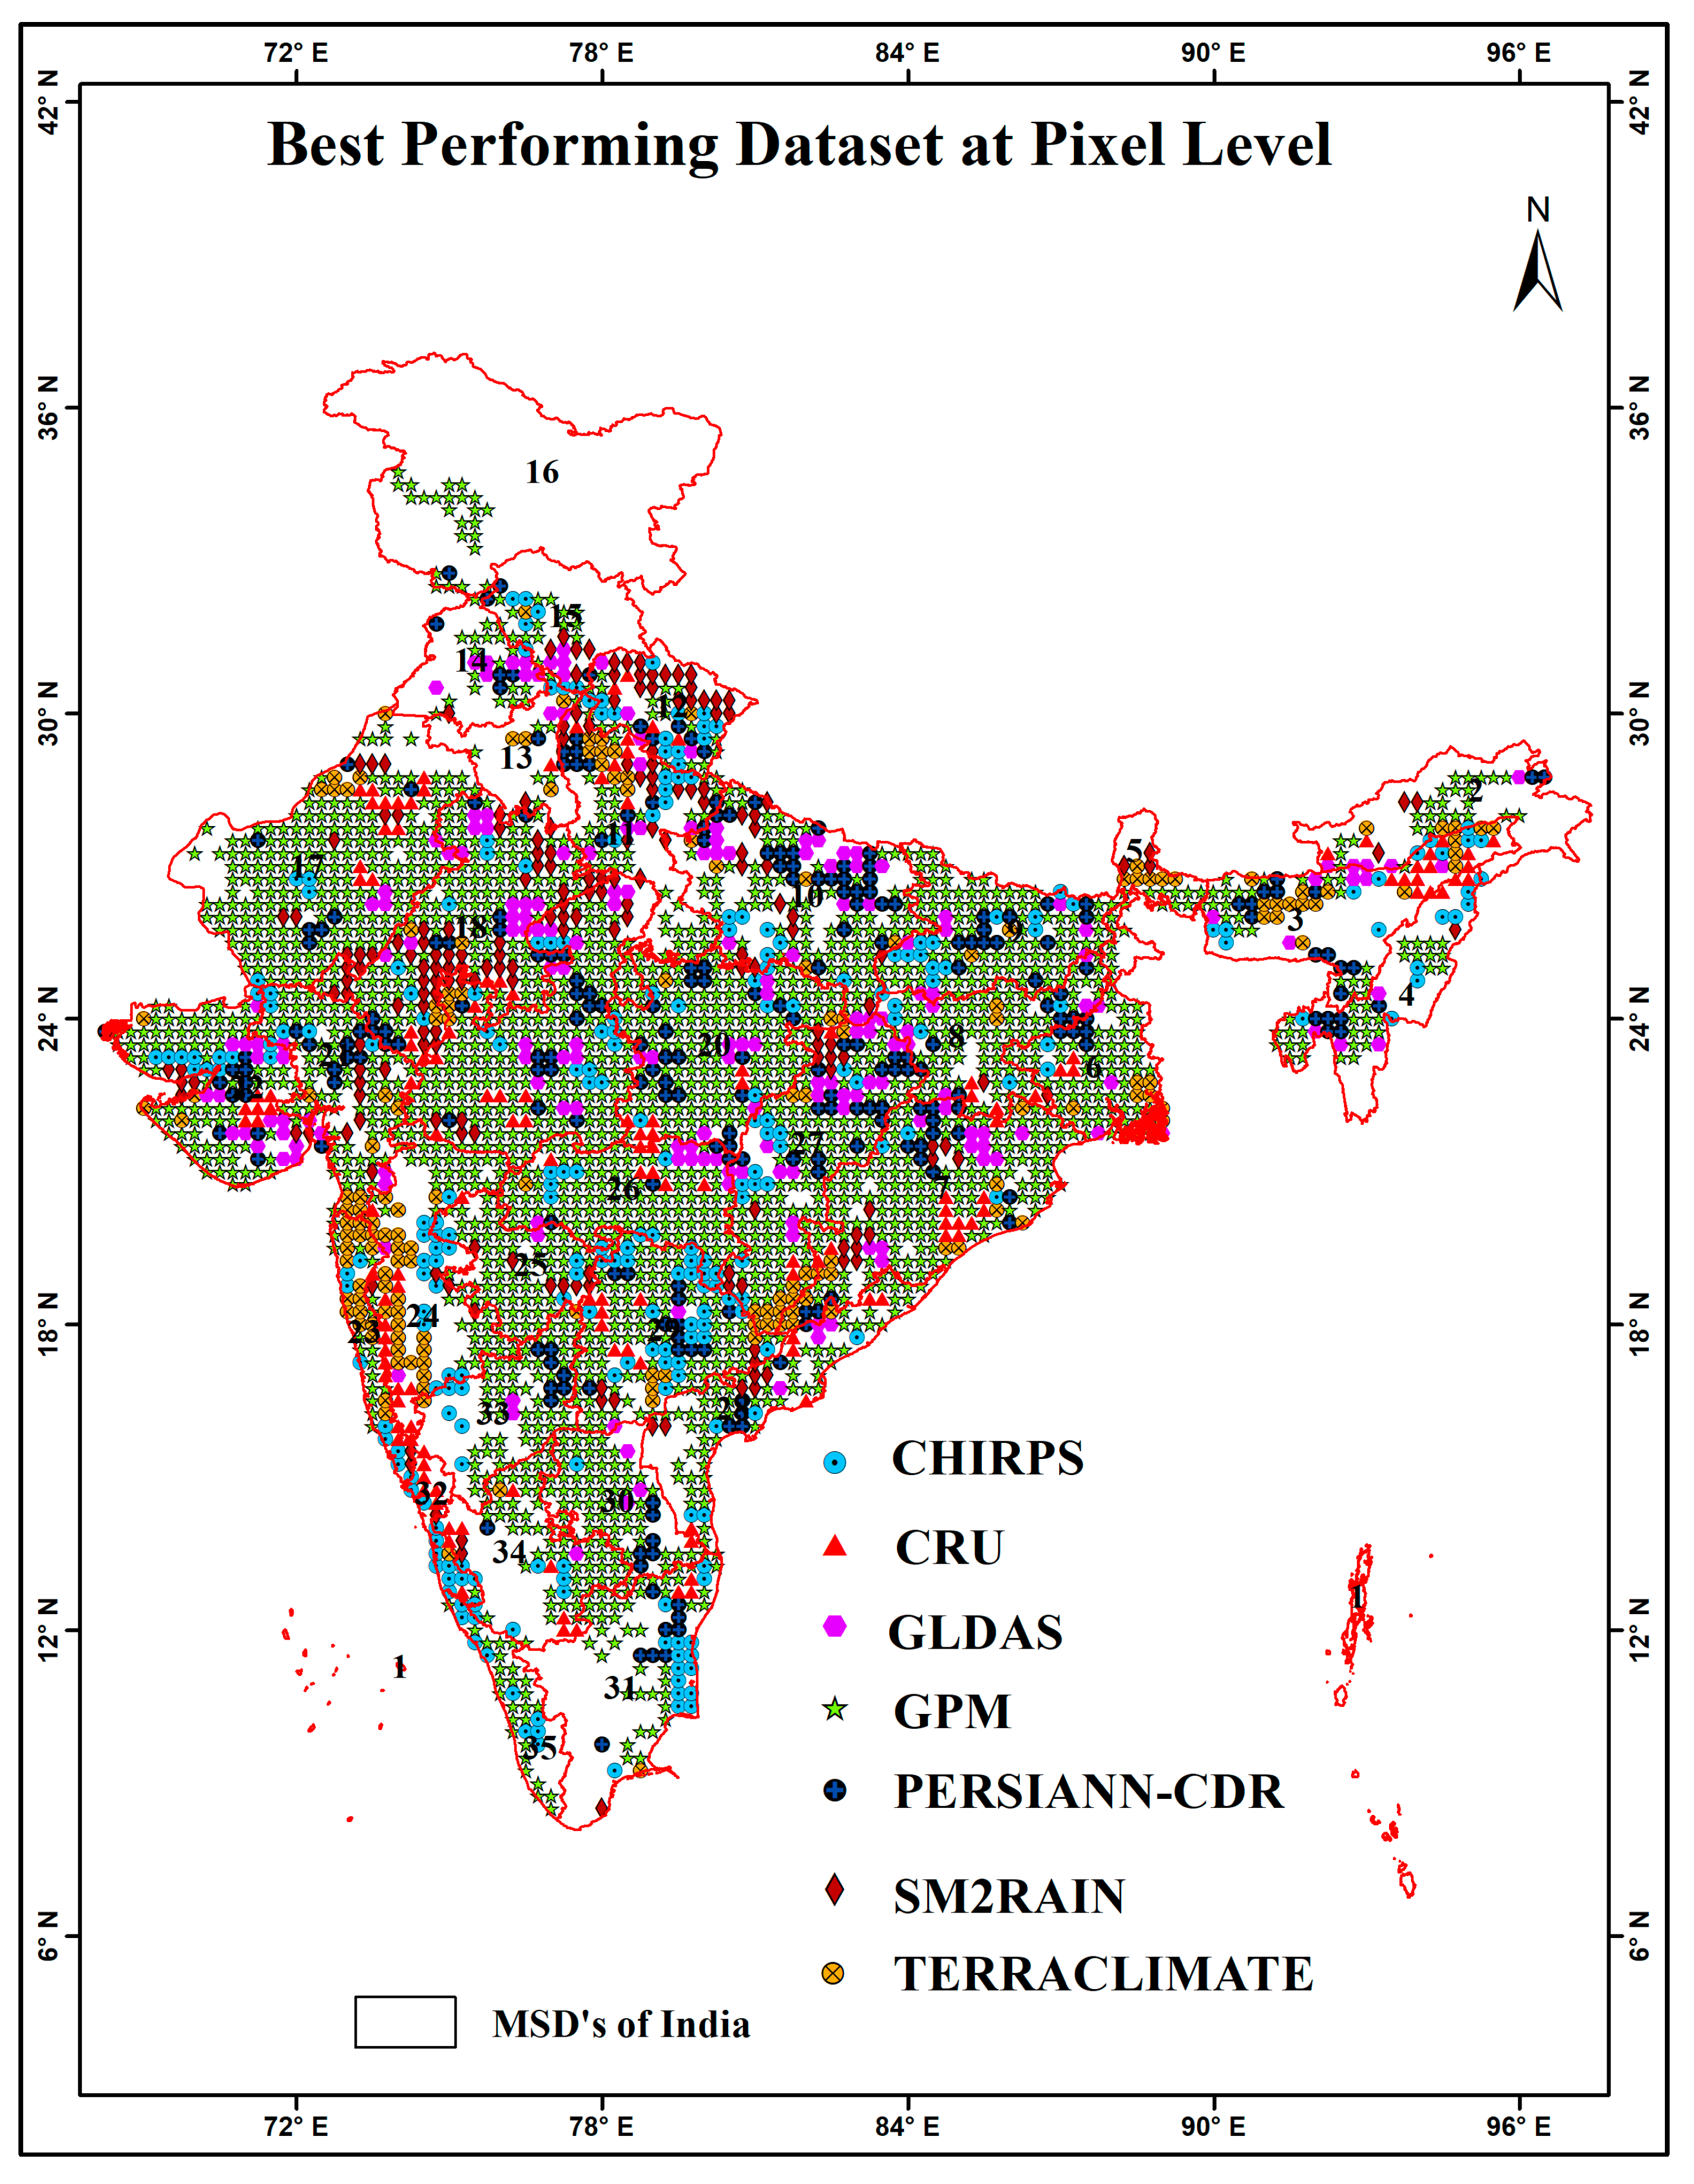
3.5. Good-Performing Datasets at the Pixel Level for India
4. Discussion
5. Summary and Conclusions
Author Contributions
Funding
Institutional Review Board Statement
Informed Consent Statement
Data Availability Statement
Acknowledgments
Conflicts of Interest
References
- Huang, J.; van den Dool, H.M. Monthly Precipitation-Temperature Relations and Temperature Prediction over the United States. J. Clim. 1993, 6, 1111–1132. [Google Scholar] [CrossRef]
- Hou, A.Y.; Skofronick-Jackson, G.; Kummerow, C.D.; Shepherd, J.M. Global Precipitation Measurement. In Precipitation: Advances in Measurement, Estimation and Prediction; Springer: Berlin/Heidelberg, Germany, 2008; pp. 131–169. ISBN 9783540776543. [Google Scholar]
- Kucera, P.A.; Ebert, E.E.; Turk, F.J.; Levizzani, V.; Kirschbaum, D.; Tapiador, F.J.; Loew, A.; Borsche, M. Precipitation from Space: Advancing Earth System Science. Bull. Am. Meteorol. Soc. 2013, 94, 365–375. [Google Scholar] [CrossRef]
- Stillman, S.; Ninneman, J.; Zeng, X.; Franz, T.; Scott, R.L.; Shuttleworth, W.J.; Cummins, K. Summer Soil Moisture Spatiotemporal Variability in Southeastern Arizona. J. Hydrometeorol. 2014, 15, 1473–1485. [Google Scholar] [CrossRef]
- Toté, C.; Patricio, D.; Boogaard, H.; van der Wijngaart, R.; Tarnavsky, E.; Funk, C. Evaluation of Satellite Rainfall Estimates for Drought and Flood Monitoring in Mozambique. Remote Sens. 2015, 7, 1758–1776. [Google Scholar] [CrossRef] [Green Version]
- Xu, R.; Tian, F.; Yang, L.; Hu, H.; Lu, H.; Hou, A. Ground Validation of GPM IMERG and Trmm 3B42V7 Rainfall Products over Southern Tibetan Plateau Based on a High-Density Rain Gauge Network. J. Geophys. Res. 2017, 122, 910–924. [Google Scholar] [CrossRef]
- Ayehu, G.T.; Tadesse, T.; Gessesse, B.; Dinku, T. Validation of New Satellite Rainfall Products over the Upper Blue Nile Basin, Ethiopia. Atmos. Meas. Tech. 2018, 11, 1921–1936. [Google Scholar] [CrossRef] [Green Version]
- Charan, V.S.; Naga Jyothi, B.; Saha, R.; Wankhede, T.; Das, I.C.; Venkatesh, J. An Integrated Geohydrology and Geomorphology Based Subsurface Solid Modelling for Site Suitability of Artificial Groundwater Recharge: Bhalki Micro-Watershed, Karnataka. J. Geol. Soc. India 2020, 96, 458–466. [Google Scholar] [CrossRef]
- Salio, P.; Hobouchian, M.P.; Skabar, Y.G.; Vila, D. Evaluation of High-Resolution Satellite Precipitation Estimates over Southern South America Using a Dense Rain Gauge Network. Atmos. Res. 2015, 163, 146–161. [Google Scholar] [CrossRef]
- Feidas, H.; Kokolatos, G.; Negri, A.; Manyin, M.; Chrysoulakis, N.; Kamarianakis, Y. Validation of an Infrared-Based Satellite Algorithm to Estimate Accumulated Rainfall over the Mediterranean Basin. Theor. Appl. Climatol. 2009, 95, 91–109. [Google Scholar] [CrossRef]
- Barrett, E.C.; Martin, D.W. The Use of Satellite Data in Rainfall Monitoring; Academic Press: London, UK, 1981. [Google Scholar]
- Kidd, C. Satellite Rainfall Climatology: A Review. Int. J. Climatol. 2001, 21, 1041–1066. [Google Scholar] [CrossRef]
- Rahman, S.H.; Sengupta, D.; Ravichandran, M. Variability of Indian Summer Monsoon Rainfall in Daily Data from Gauge and Satellite. J. Geophys. Res. Atmos. 2009, 114. [Google Scholar] [CrossRef]
- Hou, A.Y.; Kakar, R.K.; Neeck, S.; Azarbarzin, A.A.; Kummerow, C.D.; Kojima, M.; Oki, R.; Nakamura, K.; Iguchi, T. The Global Precipitation Measurement Mission. Bull. Am. Meteorol. Soc. 2014, 95, 701–722. [Google Scholar] [CrossRef]
- Sorooshian, S.; AghaKouchak, A.; Arkin, P.; Eylander, J.; Foufoula-Georgiou, E.; Harmon, R.; Hendrickx, J.M.H.; Imam, B.; Kuligowski, R.; Skahill, B.; et al. Advanced Concepts on Remote Sensing of Precipitation at Multiple Scales. Bull. Am. Meteorol. Soc. 2011, 92, 1353–1357. [Google Scholar] [CrossRef]
- Collins, M.; AchutaRao, K.; Ashok, K.; Bhandari, S.; Mitra, A.K.; Prakash, S.; Srivastava, R.; Turner, A. Observational Challenges in Evaluating Climate Models. Nat. Clim. Chang. 2013, 3, 940–941. [Google Scholar] [CrossRef]
- Ebert, E.E.; Janowiak, J.E.; Kidd, C. Comparison of Near-Real-Time Precipitation Estimates from Satellite Observations and Numerical Models. Bull. Am. Meteorol. Soc. 2007, 88, 47–64. [Google Scholar] [CrossRef] [Green Version]
- Kumar Singh, A.; Singh, V.; Singh, K.K.; Tripathi, J.N.; Kumar, A.; Sateesh, M.; Peshin, S.K. Validation of INSAT-3D Derived Rainfall Estimates (HE & IMSRA), GPM (IMERG) and GLDAS 2.1 Model Rainfall Product with IMD Gridded Rainfall & NMSG Data over IMD’s Meteorological Sub-Divisions during Monsoon. MAUSAM 2018, 69, 172–198. [Google Scholar]
- Kumar Singh, A.; Tripathi, J.N.; Singh, K.K.; Singh, V.; Sateesh, M. Comparison of Different Satellite-Derived Rainfall Products with IMD Gridded Data over Indian Meteorological Subdivisions during Indian Summer Monsoon (ISM) 2016 at Weekly Temporal Resolution. J. Hydrol. 2019, 575, 1371–1379. [Google Scholar] [CrossRef]
- Thakur, M.K.; Kumar, T.V.L.; Narayanan, M.S.; Kundeti, K.R.; Barbosa, H. Analytical Study of the Performance of the IMERG over the Indian Landmass. Meteorol. Appl. 2020, 27, e19089. [Google Scholar] [CrossRef]
- Kumar, T.V.L.; Barbosa, H.A.; Thakur, M.K.; Paredes-Trejo, F. Validation of Satellite (TMPA and IMERG) Rainfall Products with the IMD Gridded Data Sets over Monsoon Core Region of India. In Satellite Information Classification and Interpretation; Rustamov, R.B., Ed.; IntechOpen: Rijeka, Croatia, 2019. [Google Scholar]
- Pandey, V.; Srivastava, P.K. Evaluation of Satellite Precipitation Data for Drought Monitoring in Bundelkhand Region, India. In Proceedings of the IGARSS 2019—2019 IEEE International Geoscience and Remote Sensing Symposium, Yokohama, Japan, 28 July–2 August 2019. [Google Scholar]
- Singh, A.K.; Singh, V.; Singh, K.K.; Tripathi, J.N.; Kumar, A.; Soni, A.K.; Sateesh, M.; Khadke, C. A Case Study: Heavy Rainfall Event Comparison Between Daily Satellite Rainfall Estimation Products with IMD Gridded Rainfall Over Peninsular India During 2015 Winter Monsoon. J. Indian Soc. Remote Sens. 2018, 46, 927–935. [Google Scholar] [CrossRef]
- Kommu, R.; Kundapura, S.; Kolluru, V. A Statistical Approach for Comparison of Secondary Precipitation Products; Springer: Singapore, 2021; Volume 99, ISBN 9789811568275. [Google Scholar]
- Gupta, V.; Jain, M.K.; Singh, P.K.; Singh, V. An Assessment of Global Satellite-Based Precipitation Datasets in Capturing Precipitation Extremes: A Comparison with Observed Precipitation Dataset in India. Int. J. Climatol. 2020, 40, 3667–3688. [Google Scholar] [CrossRef]
- Singh, T.P.; Kumbhar, V.; Das, S.; Deshpande, M.M.; Dhoka, K. Comparison of TRMM Multi-Satellite Precipitation Analysis (TMPA) Estimation with Ground-Based Precipitation Data over Maharashtra, India. Environ. Dev. Sustain. 2020, 22, 5539–5552. [Google Scholar] [CrossRef]
- Nair, S.; Srinivasan, G.; Nemani, R. Evaluation of Multi-Satellite TRMM Derived Rainfall Estimates over a Western State of India. J. Meteorol. Soc. Jpn. 2009, 87, 927–939. [Google Scholar] [CrossRef] [Green Version]
- Uma, R.; Kumar, T.V.L.; Narayanan, M.S.; Rajeevan, M.; Bhate, J.; Kumar, K.N. Large Scale Features and Assessment of Spatial Scale Correspondence between TMPA and IMD Rainfall Datasets over Indian Landmass. J. Earth Syst. Sci. 2013, 122, 573–588. [Google Scholar] [CrossRef] [Green Version]
- Prakash, S.; Mitra, A.K.; Momin, I.M.; Rajagopal, E.N.; Basu, S.; Collins, M.; Turner, A.G.; Achuta Rao, K.; Ashok, K. Seasonal Intercomparison of Observational Rainfall Datasets over India during the Southwest Monsoon Season. Int. J. Climatol. 2015, 35, 2326–2338. [Google Scholar] [CrossRef] [Green Version]
- Prakash, S.; Mitra, A.K.; Rajagopal, E.N.; Pai, D.S. Assessment of TRMM-Based TMPA-3B42 and GSMaP Precipitation Products over India for the Peak Southwest Monsoon Season. Int. J. Climatol. 2016, 36, 1614–1631. [Google Scholar] [CrossRef]
- Mitra, A.K.; Kaushik, N.; Kumar Singh, A.; Parihar, S.; Bhan, S.C. Evaluation of INSAT-3D Satellite Derived Precipitation Estimates for Heavy Rainfall Events and Its Validation with Gridded GPM (IMERG) Rainfall Dataset over the Indian Region. Remote Sens. Appl. Soc. Environ. 2018, 9, 91–99. [Google Scholar] [CrossRef]
- Reddy, M.V.; Mitra, A.K.; Momin, I.M.; Mitra, A.K.; Pai, D.S. Evaluation and Inter-Comparison of High-Resolution Multi-Satellite Rainfall Products over India for the Southwest Monsoon Period. Int. J. Remote Sens. 2019, 40, 4577–4603. [Google Scholar] [CrossRef]
- Liu, C.Y.; Aryastana, P.; Liu, G.R.; Huang, W.R. Assessment of Satellite Precipitation Product Estimates over Bali Island. Atmos. Res. 2020, 244, 105032. [Google Scholar] [CrossRef]
- Wang, J.; Wang, H.J.; Hong, Y. Comparison of Satellite-Estimated and Model-Forecasted Rainfall Data during a Deadly Debris-Flow Event in Zhouqu, Northwest China. Atmos. Ocean. Sci. Lett. 2016, 9, 139–145. [Google Scholar] [CrossRef] [Green Version]
- Khan, A.W.; Mahesh, C.; Bushair, M.T.; Gairola, R.M. Estimation and Evaluation of Rainfall from INSAT-3D Improved IMSRA Algorithm during 2018 Summer Monsoon Season. J. Earth Syst. Sci. 2021, 130, 37. [Google Scholar] [CrossRef]
- Durai, V.R.; Bhowmik, S.K.R.O.Y.; Mukhopadhyay, B. Evaluation of Indian Summer Monsoon Rainfall Features Using TRMM and KALPANA-1 Satellite Derived Precipitation and Rain Gauge Observation. MAUSAM 2010, 61, 317–336. [Google Scholar] [CrossRef]
- Dwivedi, S.; Uma, R.; Lakshmi Kumar, T.V.; Narayanan, M.S.; Pokhrel, S.; Kripalani, R.H. New Spatial and Temporal Indices of Indian Summer Monsoon Rainfall. Theor. Appl. Climatol. 2019, 135, 979–990. [Google Scholar] [CrossRef]
- Suresh, A.; Raju, S.S.; Chauhan, S.; Chaudhary, K.R. Rainfed Agriculture in India: An Analysis of Performance and Implications. Indian J. Agric. Sci. 2014, 84, 1415–1422. [Google Scholar]
- Kelkar, R.R.; Sreejith, O.P. Meteorological Sub-Divisions of India and Their Geopolitical Evolution from 1875 to 2020. MAUSAM 2020, 71, 571–584. [Google Scholar]
- Prakash, S. Performance Assessment of CHIRPS, MSWEP, SM2RAIN-CCI, and TMPA Precipitation Products across India. J. Hydrol. 2019, 571, 50–59. [Google Scholar] [CrossRef]
- Harris, I.; Osborn, T.J.; Jones, P.; Lister, D. Version 4 of the CRU TS Monthly High-Resolution Gridded Multivariate Climate Dataset. Sci. Data 2020, 7, 109. [Google Scholar] [CrossRef] [PubMed] [Green Version]
- Amorim, J.D.S.; Viola, M.R.; Junqueira, R.; de Oliveira, V.A.; de Mello, C.R. Evaluation of Satellite Precipitation Products for Hydrological Modeling in the Brazilian Cerrado Biome. Water 2020, 12, 2571. [Google Scholar] [CrossRef]
- Shepard, D. A Two-Dimensional Interpolation Function for Irregularly-Spaced Data. In Proceedings of the 1968 23rd ACM National Conference; Association for Computing Machinery: New York, NY, USA, 1968; pp. 517–524. [Google Scholar]
- Pai, D.S.; Sridhar, L.; Rajeevan, M.; Sreejith, O.P.; Satbhai, N.S.; Mukhopadyay, B. Development of a New High Spatial Resolution (0.25° × 0.25°) Long Period (1901–2010) Daily Gridded Rainfall Data Set over India and Its Comparison with Existing Data Sets over the Region. MAUSAM 2014, 65, 1–18. [Google Scholar] [CrossRef]
- Funk, C.; Peterson, P.; Landsfeld, M.; Pedreros, D.; Verdin, J.; Shukla, S.; Husak, G.; Rowland, J.; Harrison, L.; Hoell, A.; et al. The Climate Hazards Infrared Precipitation with Stations—A New Environmental Record for Monitoring Extremes. Sci. Data 2015, 2, 150066. [Google Scholar] [CrossRef] [Green Version]
- Rodell, M.; Houser, P.R.; Jambor, U.; Gottschalck, J.; Mitchell, K.; Meng, C.J.; Arsenault, K.; Cosgrove, B.; Radakovich, J.; Bosilovich, M.; et al. The Global Land Data Assimilation System. Bull. Am. Meteorol. Soc. 2004, 85, 381–394. [Google Scholar] [CrossRef] [Green Version]
- Huffman, G.J.; Bolvin, D.T.; Braithwaite, D.; Hsu, K.; Joyce, R.; Xie, P.; Yoo, S.-H. NASA Global Precipitation Measurement (GPM) Integrated Multi-Satellite Retrievals for GPM (IMERG). Algorithm Theor. Basis Doc. Vers. 2015, 4. [Google Scholar]
- Ashouri, H.; Hsu, K.-L.; Sorooshian, S.; Braithwaite, D.K.; Knapp, K.R.; Cecil, L.D.; Nelson, B.R.; Prat, O.P. PERSIANN-CDR: Daily Precipitation Climate Data Record from Multisatellite Observations for Hydrological and Climate Studies. Bull. Am. Meteorol. Soc. 2015, 96, 69–83. [Google Scholar] [CrossRef] [Green Version]
- Nguyen, P.; Shearer, E.J.; Tran, H.; Ombadi, M.; Hayatbini, N.; Palacios, T.; Huynh, P.; Braithwaite, D.; Updegraff, G.; Hsu, K.; et al. The CHRS Data Portal, an Easily Accessible Public Repository for PERSIANN Global Satellite Precipitation Data. Sci. Data 2019, 6, 180296. [Google Scholar] [CrossRef] [PubMed] [Green Version]
- Brocca, L.; Hasenauer, S.; Kidd, R.; Dorigo, W.; Wagner, W.; Levizzani, V. Soil as a Natural Rain Gauge: Estimating Global Rainfall from Satellite Soil Moisture Data. J. Geophys. Res. Atmos. 2014, 119, 5128–5141. [Google Scholar] [CrossRef]
- Brocca, L.; Filippucci, P.; Hahn, S.; Ciabatta, L.; Massari, C.; Camici, S.; Schüller, L.; Bojkov, B.; Wagner, W. SM2RAIN-ASCAT (2007–2018): Global Daily Satellite Rainfall Data from ASCAT Soil Moisture Observations. Earth Syst. Sci. Data 2019, 11, 1583–1601. [Google Scholar] [CrossRef] [Green Version]
- Abatzoglou, J.T.; Dobrowski, S.Z.; Parks, S.A.; Hegewisch, K.C. TerraClimate, a High-Resolution Global Dataset of Monthly Climate and Climatic Water Balance from 1958–2015. Sci. Data 2018, 5, 170191. [Google Scholar] [CrossRef] [Green Version]
- Moriasi, D.N.; Arnold, J.G.; Liew, M.W.V.; Bingner, R.L.; Harmel, R.D.; Veith, T.L. Model Evaluation Guidelines for Systematic Quantification of Accuracy in Watershed Simulations. Trans. ASAB 2007, 50, 885–900. [Google Scholar] [CrossRef]
- Pearson, K. VII. Note on Regression and Inheritance in the Case of Two Parents. Proc. R. Soc. Lond. 1895, 58, 240–242. [Google Scholar]
- Nash, J.E.; Sutcliffe, J. V River Flow Forecasting through Conceptual Models Part I—A Discussion of Principles. J. Hydrol. 1970, 10, 282–290. [Google Scholar] [CrossRef]
- Gupta, H.V.; Sorooshian, S.; Yapo, P.O. Status of Automatic Calibration for Hydrologic Models: Comparison with Multilevel Expert Calibration. J. Hydrol. Eng. 1999, 4, 135–143. [Google Scholar] [CrossRef]
- Chu, T.W.; Shirmohammadi, A. Evaluation of the SWAT Model’s Hydrology Component in the Piedmont Physiographic Region of Maryland. Trans. ASAE 2004, 47, 1057. [Google Scholar] [CrossRef]


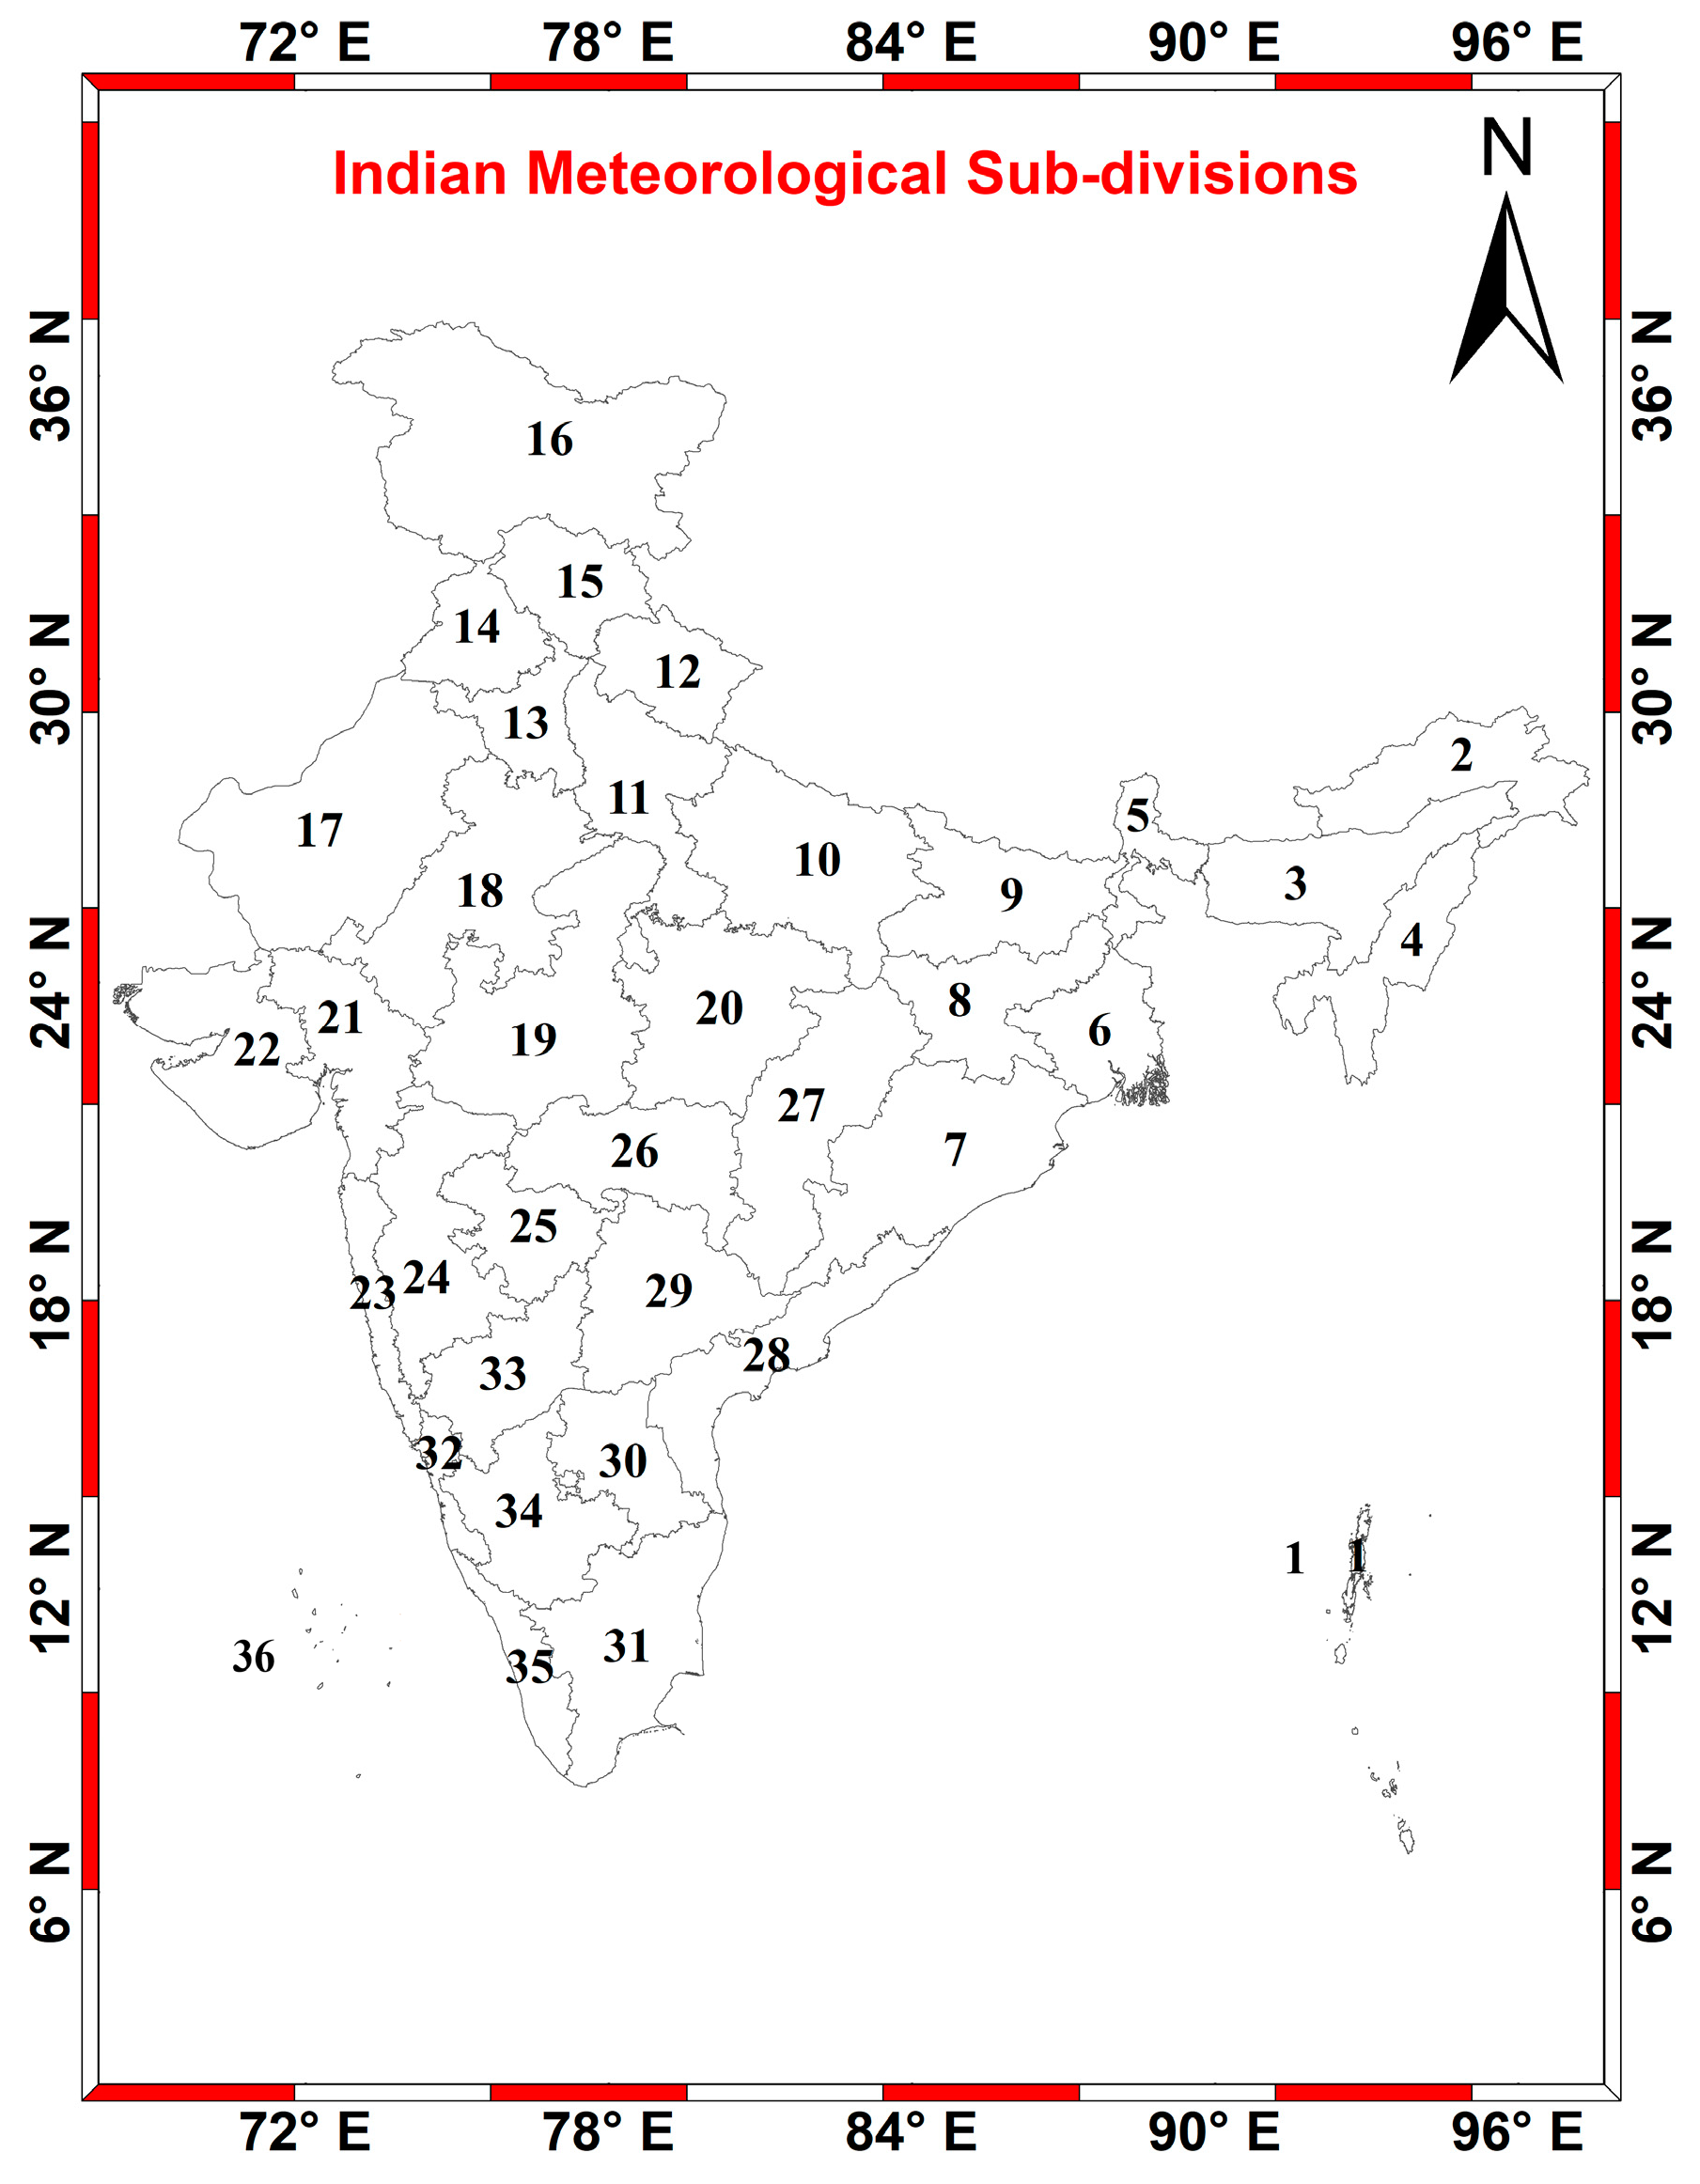
| 1 | Andaman and Nicobar Islands (A and N I) | 13 | Haryana, Chandigarh and Delhi (HC and D) | 25 | Marathwada (MW) |
| 2 | Arunachal Pradesh (ARP) | 14 | Punjab (PN) | 26 | Vidarbha (VB) |
| 3 | Assam & Meghalaya (A and M) | 15 | Himachal Pradesh (HP) | 27 | Chhattisgarh (CG) |
| 4 | Nagaland, Manipur, Mizoram and Tripura (NMMT) | 16 | Jammu and Kashmir and Ladakh (JK and L) | 28 | Coastal Andhra Pradesh and Yanam (C-AP and Y) |
| 5 | Sub-Himalayan West Bengal and Sikkim (SHWB) | 17 | West Rajasthan (W R) | 29 | Telangana (TS) |
| 6 | Gangetic West Bengal (GWB) | 18 | East Rajasthan (E R) | 30 | Rayalaseema (RS) |
| 7 | Odisha (OD) | 19 | West Madhya Pradesh (W MP) | 31 | Tamil Nadu and Puducherry and Karaikal (TN and P) |
| 8 | Jharkhand (JH) | 20 | East Madhya Pradesh (E MP) | 32 | Coastal Karnataka (C-KA) |
| 9 | Bihar (BH) | 21 | Gujarat region (GJ) | 33 | N.I. Karnataka (NI KA) |
| 10 | East Uttar Pradesh (E UP) | 22 | Saurashtra and Kutch (S and K) | 34 | S.I. Karnataka (SI KA) |
| 11 | West Uttar Pradesh (W UP) | 23 | Konkan and Goa (K and G) | 35 | Kerala and Mahe (KL) |
| 12 | Uttarakhand (UK) | 24 | Madhya Maharashtra (MH) | 36 | Lakshadweep (L) |
| Parameter | Dataset and Source | Spatial Resolution | Temporal Resolution | Data Availability |
|---|---|---|---|---|
| Rainfall | IMD Gridded Data https://www.imdpune.gov.in/Clim_Pred_LRF_New/Grided_Data_Download.html (accessed on 15 September 2020) | 0.25° | Daily | 1901–Present |
| CHIRPS (Merged gauge + satellite) https://data.chc.ucsb.edu/products/CHIRPS-2.0/global_monthly/tifs/ (accessed on 15 September 2020) | 0.05° | Monthly | 1981–Present | |
| CRU (Gauged data) https://crudata.uea.ac.uk/cru/data/hrg/cru_ts_4.05/cruts.2103051243.v4.05/ (accessed on 19 June 2021) | 0.5° | Monthly | 1901–Present | |
| GLDAS 2.1 Rain Precipitation Rate (Combination of Model and Gauged data) https://giovanni.gsfc.nasa.gov/ (accessed on 15 September 2020) | 0.25° | Monthly | 2000–Present | |
| GPM (Merged satellite-gauge precipitation estimate - Final Run) https://giovanni.gsfc.nasa.gov/ (accessed on 15 September 2020) | 0.1° | Monthly | 2000–Present | |
| PERSIANN-CDR (Satellite) http://chrsdata.eng.uci.edu/ (accessed on 19 June 2021) | 0.25° | Monthly | 1983–Present | |
| SM2RAIN (Satellite) https://zenodo.org/record/4570192#.YORPVOgzY2x (accessed on 19 June 2021) | 0.25° | Monthly | 2007–Present | |
| TerraClimate (Gauged data) https://www.climatologylab.org/terraclimate.html (accessed on 19 June 2021) | 0.05° | Monthly | 1958–Present |
| Skill Metrics | Good-Performing Range | Moderate-Performing Range | Low-Performing Range |
|---|---|---|---|
| γ | >0.8 | 0.4–0.80 | <0.4 |
| NSE | >0.75 | 0.5–0.75 | <0.50 |
| RMSE | <25 | 25–75 | >75 |
| PBIAS | −10 to +10 | 10 to 25 or −10 to −25 | >25 or <−25 |
| RSR | 0–0.5 | 0.5–0.7 | >0.7 |
| Dataset | NSE | RMSE | RSR | PBIAS | Suitability | |
|---|---|---|---|---|---|---|
| CHIRPS | 0.84 | 0.52 | 69.44 | 0.62 | −14.48 | Moderate-Performing |
| CRU | 0.84 | 0.48 | 73.38 | 0.64 | −10.45 | Moderate-Performing |
| GLDAS | 0.83 | 0.36 | 75.99 | 0.67 | −12.42 | Low-Performing |
| GPM | 0.89 | 0.64 | 57.98 | 0.51 | −8.36 | Good-Performing |
| PERSIANN-CDR | 0.86 | 0.5 | 71.54 | 0.62 | −17.12 | Moderate-Performing |
| SM2RAIN | 0.82 | 0.46 | 74.42 | 0.65 | −8.02 | Moderate-Performing |
| Terraclimate | 0.84 | 0.51 | 74.04 | 0.63 | −7.33 | Moderate-Performing |
Disclaimer/Publisher’s Note: The statements, opinions and data contained in all publications are solely those of the individual author(s) and contributor(s) and not of MDPI and/or the editor(s). MDPI and/or the editor(s) disclaim responsibility for any injury to people or property resulting from any ideas, methods, instructions or products referred to in the content. |
© 2023 by the authors. Licensee MDPI, Basel, Switzerland. This article is an open access article distributed under the terms and conditions of the Creative Commons Attribution (CC BY) license (https://creativecommons.org/licenses/by/4.0/).
Share and Cite
Saicharan, V.; Rangaswamy, S.H. A Comparison and Ranking Study of Monthly Average Rainfall Datasets with IMD Gridded Data in India. Sustainability 2023, 15, 5758. https://doi.org/10.3390/su15075758
Saicharan V, Rangaswamy SH. A Comparison and Ranking Study of Monthly Average Rainfall Datasets with IMD Gridded Data in India. Sustainability. 2023; 15(7):5758. https://doi.org/10.3390/su15075758
Chicago/Turabian StyleSaicharan, Vasala, and Shwetha Hassan Rangaswamy. 2023. "A Comparison and Ranking Study of Monthly Average Rainfall Datasets with IMD Gridded Data in India" Sustainability 15, no. 7: 5758. https://doi.org/10.3390/su15075758