Article

A Study on Local Scour of Large-Diameter Monopile under Combined Waves and Current

1
Ocean College, Zhejiang University, Zhoushan 316000, China
2
Yangjiang Offshore Wind Energy Laboratory, Yangjiang 529500, China
3
School of Naval Architecture, Ocean and Energy Power Engineering, Wuhan University of Technology, Wuhan 430063, China
4
China Energy Engineering Group Guangdong Electric Power Design Institute Co., Ltd., Guangzhou 510000, China
*
Author to whom correspondence should be addressed.
These authors contributed equally to this work.
Sustainability 2023, 15(7), 5746; https://doi.org/10.3390/su15075746
Submission received: 6 March 2023 / Revised: 20 March 2023 / Accepted: 22 March 2023 / Published: 25 March 2023

Abstract

:
The complex-load environment of offshore monopile foundations makes the combination of waves and current, and the variation in water depth, important factors for local scour. A flume test model of flow–pile–soil coupling for large-diameter monopile foundations is established, which comprehensively considers the combined reciprocating action of wave/current and the influence of tide depth. The precision of the experiment is ensured by the extension method of series models. The results show that the local scour caused by tides and the wave–current combination is obviously different from the unidirectional wave–current combination. The equilibrium scour depth obtained by the test is found to have some deviation from the predicted scour-depth equation. The maximum scour depth decreased with the increase in water depth within the range of 3 to 6 times the pile diameter. The bed shear-stress equation was generally consistent with the scouring-depth rule measured by the model, which can be considered to evaluate the rationality of the test results.

1. Introduction

Offshore wind power has been one of the main development directions of new energy around the world in recent years. From the perspective of the current development of offshore wind power, the monopile foundation, which is of high economic value, constitutes about 70% of the wind farms around the world [1]. However, a large range of local-scour holes are usually formed around the piles before the scour protection is implemented, due to the severe offshore environment [2,3]. The local scour is often the key factor leading to structural failure and is primarily influenced by the type and characteristics of water flow, seabed sediments and piers [4,5,6,7,8]. In recent decades, the methods to reduce the impact of local scour can be mainly classified into two categories: (a) take scour protection measures to slow down or avoid local scour [9,10]; and (b) employ local-scour depth prediction methods during the design stage to proactively mitigate adverse effects on structure.
The future trajectory of offshore wind power is headed towards the deployment of far-sea, large-scale wind farms, and utilization of large-scale wind turbines, which implies that the development of large-diameter monopile foundations is an inevitable trend. However, previous experiments mainly focus on small-diameter monopiles. Large-diameter monopiles are defined as when D/L > 0.1, where D is the diameter of the monopile and L is the wavelength [11]. Large-diameter monopiles can withstand larger loads and improve the economic benefits of a single wind turbine. However, they will also affect the Keulegan–Carpenter (KC) number and slenderness ratio, which results in large-diameter monopiles being more sensitive to scouring caused by combined waves and current [12]. The scour around the pile under the combined waves and current is a complex process, and has received a lot of attention [13,14,15]. The previous studies show that the wave and current work together to enhance their ability to displace and carry sands, and that the current plays a dominant role in the local scour around monopile foundations [16,17,18].
The equilibrium-scour depth is a key factor in engineering practice for offshore wind-power foundations. It is of great significance for improving the safety of offshore structures to accurately predict the equilibrium scour depth. The mainstream view is that the equilibrium-scour depth under the combined waves and current is greater than that under conditions of current only or wave only [19,20]. Sumer and Fredsøe [21] present a different perspective: that the superposition of waves only promotes the scour process and does not affect the equilibrium-scour depth, which is different from the current mainstream view. In engineering applications, equilibrium-scour-depth prediction is usually overestimated for safety, but it is still necessary to study the effect of combined waves and current on scour depth. In experiments designed to simulate ocean conditions more realistically, such as the combination of non-directional reciprocating waves and current, researchers generally fail to reach a consensus regarding an effective approach for controlling multiple variables simultaneously, and, hence, there is no specific explanation for the scour development mechanism under the combined wave–current condition due to lack of experiments.
Liang et al. [4] presented flume tests of pier groups embedded in sand to observe scour depth and evaluated design methods from different countries. The study derived a new scour prediction equation which agrees well with observations and can help reduce overdesign and construction costs. Qi and Gao [12] discussed the impact of wave–current combination on local scour at offshore monopile foundations with a physical model of the scour depth under the combined waves and current. The experimental results show that the horseshoe vortex is one of the main controlling mechanisms for scouring development under combined waves and current. An empirical equation is given for predicting equilibrium scour depth, which may provide a guide for offshore engineering practice.
Singh et al. [14] established a combined wave–flow experiment on a rough bed to study the effect of surface waves on turbulence. The results confirmed the finding that the thickness of the turbulent boundary layer increases with the presence of surface waves, compared to current-only flow. Høgedal and Hald [15] used design tools to predict scour depth, and the results showed that the extreme local-scour depths at most locations were too conservative in design. A design without scour protection was practical, as evidenced by the cost comparison of some projects, suggesting the need for new design methodologies to precisely predict scour depths. Gazi et al. [19] presented an equation for predicting the equilibrium scour depth around a pier under the influence of collinear waves and current. The predicted equilibrium-scour depths were validated against experimental and numerical results, demonstrating good agreement.
In previous studies, numerical simulations and physical model experiments on local scour around monopiles mainly focused on the effects of flow-only, tide-only and unidirectional wave–current conditions. However, the investigation of local scour around monopiles under combined waves and current considering the variation in water depth, has received scant attention in the literature. In particular, the effect of scour depth in the range of water depth h from 3 to 6 times the pile diameter D after considering the wave–current condition is still unclear. The present study aims to address the limitations of prior research by examining the scouring mechanism and influential factors of large-diameter monopile foundations subjected to the combined effects of waves and current. In this study, taking an offshore wind-farm project in Guangdong, China as the background, according to the actual hydrology and sea conditions of the project site, a large-diameter monopile foundation, flow-field-conditions-and-sediment-characteristics-coupling physical test model considering the influence factors of tidal level and water depth under the combined waves and current is established. A series of flume tests were conducted to investigate the local-scour characteristics under the coupled action of fluid–solid–soil.

2. Prediction Equation of Equilibrium-Scour Depth

The local scour depth S is determined by factors such as tide level, current, waves, sediments, and the form and size of structures. Generally, the local-scour depth may be expressed as:
S = f ( u , H , T , h , d 50 , γ s , ω , U c , D )
where u is the approach velocity, H the wave height, T the wave period, h the water depth, d 50 the median particle size of the sediment, γ s the sediment weight, ω the sediment settling velocity, U c the starting velocity and D the characteristic dimension of the structure.
Some researchers have used the dimensional analysis method to deduce the scour-depth-prediction equation under specific sea conditions, and it is combined with field-measured data to obtain the range of the influencing parameters through numerical fitting. It should be mentioned that the development of scour depth is affected by the combined action of many factors. However, it cannot fully reflect the process of scour depth development under the action of multiple factors.
The K C number mentioned above is an important parameter governing the scouring process, and it is defined as:
K C = U w m T / D
where U w m is the maximum velocity of the undisturbed wave-induced oscillatory flow at the sea bottom above the wave boundary layer, D the pile diameter and T the wave period.
Sumer et al. [22] derived the following empirical expression for the scour depth under combined waves and current:
S / D = S c / D 1 e x p A K C B
where S c is the scour depth for the current-only case, and the parameters A = 0.03 + 0.75 U c w 2.6 and B = 6 e x p ( 4.7 U c w ) . The range of validity of Equation (2) is limited to 4 < K C < 25 , and Equation (3) is the prediction equation only for the condition of the combined waves and current.
To enhance the applicability of the study to the target offshore wind farm, two scour-depth-prediction equations specified in the Chinese energy standards for offshore wind-power construction are given as follows [23]:
l g ( S h ) = 1.2935 + 0.1917 l g β
β = F r 2 H L U r N s R e * = H 2 L u 3 D [ u + ( 1 / T u / L ) H L / 2 H ] 2 ( γ s γ γ ) v g 2 h 4 d 50
in which F r = u / g h represents the ratio of the inertial force of the water flow to gravity and U r = H L 2 / h 3 represents the nonlinear degree of the wave. N s is the particle sediment number and R e * the Reynolds number of the pile; h is the approaching water depth, u the approaching velocity, H the wave height, L the wavelength, T the wave period, d 50 the median particle size of the sediment, γ s the sediment weight, and γ the water weight.
F r = u / g h = u c + 0.2 H h C / g h
S h = 17.4 k 1 k 2 ( B h ) 0.326 ( d 50 h ) 0.167 F r 0.628
in which k 1 and k 2 are the horizontal and vertical arrangement coefficients of foundation piles, respectively, and both are taken as 1 for monopiles. B is the average water blocking width and C is the wave propagation speed; the meaning of other parameters is as above.

3. Experimental Set Up

The maximum scour depth of the prototype was calculated by the extension method of series models, for which 1/50 and 1/100 scale models were determined. Considering test accuracy, a 1/75 scale model was added to provide a more accurate prediction.
The experiments were conducted in a wave–current flume with a length of 46 m, width of 1.5 m and depth of 1.0 m in Ocean College, Zhejiang University. One end of the flume was equipped with a push-plate wave generator, which can generate regular waves, solitary waves and random waves with a maximum wave height of 20 cm; the other end was a slope wave-absorbing beach filled with barbed wire, where the waves break, thereby dissipating wave energy and avoiding the impact of reflected waves on the work area. The back of the wave-making plate and the front of the wave-absorbing beach were provided with outlet/return ports, which can generate two-way flow with a maximum flow rate of 1 m/s under the drive of the centrifugal pump at the bottom of the flume. A sand table with a length of 20 m, a width of 1.5 m and a depth of 0.15 m was set up in the middle section of the flume as a scouring area, and a slope with a slope of 1/20 was set at both ends and covered with a cement plastering surface to prevent the wave breaking or serious deformation caused by the sudden change in the overflow section. Its overall layout is shown in Figure 1.
The reduced-scale models of three monopiles with diameters of 7.0, 7.5 and 8.0 m, as shown in Figure 2, were arranged on the sand table with a spacing of 4 m in one test in order to reduce the experimental workload without compromising experimental accuracy. Based on the observation of the pre-test, it was found that the incident wave height and approaching flow velocity were essentially uniform for all three piles, and the influence of the piles on the flow field could be neglected. Thus, it was considered feasible to install three wind-turbine monopiles simultaneously in a single water tank.
Working conditions at representative points 1 # and 3 # were screened based on wave characteristics and water depth in the field area. Table 1 gives a summary of the prototype working conditions. Prototype conditions in the field area were simulated at scales of 1:50, 1:75, and 1:100, the specific model scale is shown in Table 2.
According to the sediment exploration situation in the field, the prototype sediment of the field is modulated as shown in Table 3, where D / d 50 is much larger than 50; thus, the scour depth is independent of particle size [24].

4. Results and Discussion

4.1. Development Mechanism of Scour Hole

As shown in Figure 3, when the wave and current advance to scour in the same direction on the horizontal bed, the two sides of the pile firstly generated narrow and long longitudinal grooves under the action of the horseshoe vortex. At the same time, sediment incipient motion occurred downstream of the pile due to the increase in local shear stress, and multiple fish-scale scour holes appeared (see Figure 3(1a)). Afterwards, the width and depth of the flushing groove increased, and the sediment accumulated behind the pile side (see Figure 3(1b)). The two flushing grooves were closed in front of the pile with the further development of the scour hole (see Figure 3(1c)). The alteration of the terrain generated a change in the flow field, resulting in an increase in the magnitude of the horseshoe vortex, which consequently amplified the erosive effect on the bed, finally forming a scour hole with an inverted cone shape in the first half and a groove shape in the second half. The fish-scale-shaped scour hole in the downstream transformed into a sand pattern (see Figure 3(1d)).
After changing the direction of water flow, the sediment from the previous accumulation area began to slump into the scour hole (see Figure 3(2a)). Over time, the sediment accumulated on the back-wave surface had basically fallen into the scour hole, resulting in an attenuated depth and an expansion in the direction of the head wave (see Figure 3(2b)). The scouring process resulted in the reappearance of an inverted conical scour on the side of the pile that was exposed to the current and back wave, and its depth progressively increased (see Figure 3(2c)). At the end of the first tidal cycle, the morphology of the scour hole was largely similar to that observed under unidirectional flow conditions; however, the presence of accumulation regions both upstream and downstream of the pile was observed, with the accumulation range being distant from the pile (see Figure 3(2d)). The morphology of the scour hole underwent periodic alterations in accordance with the aforementioned rules during the subsequent tidal cycles. When the ebb tide (wave current in the same direction) ended, the inverted conical scour hole appeared on the head-wave surface of the pile, and when the high tide (wave current in the reverse direction) ended, it appeared on the back-wave surface.

4.2. Scour Hole Shape

We performed tests under eight working conditions, and two of them were selected as illustrations because the results of the others are similar to these two. The results are shown in Figure 4 and Figure 5. The shape of the scour holes after scouring equilibrium is observed to be regular and symmetrical, when it is generally inverted-cone-shaped. The maximum scour depth occurs on the upstream surface of the pile in high-tide work conditions, and the textures caused by wave action exist both upstream and downstream of the pile. Due to the periodic reversal of flow direction, the scour range is large, and the accumulation area outside the scour hole is far away from the pile. Overall, the scouring processes were similar under each scale group, except for the change in hydrodynamic scale and the constant test sand, which caused variations in sand-texture depth, range, and density. Under combined waves and current, the scour hole shape was typically “horseshoe-shaped”, distinct from the shapes observed under unidirectional flow or combined wave and current or tidal current.

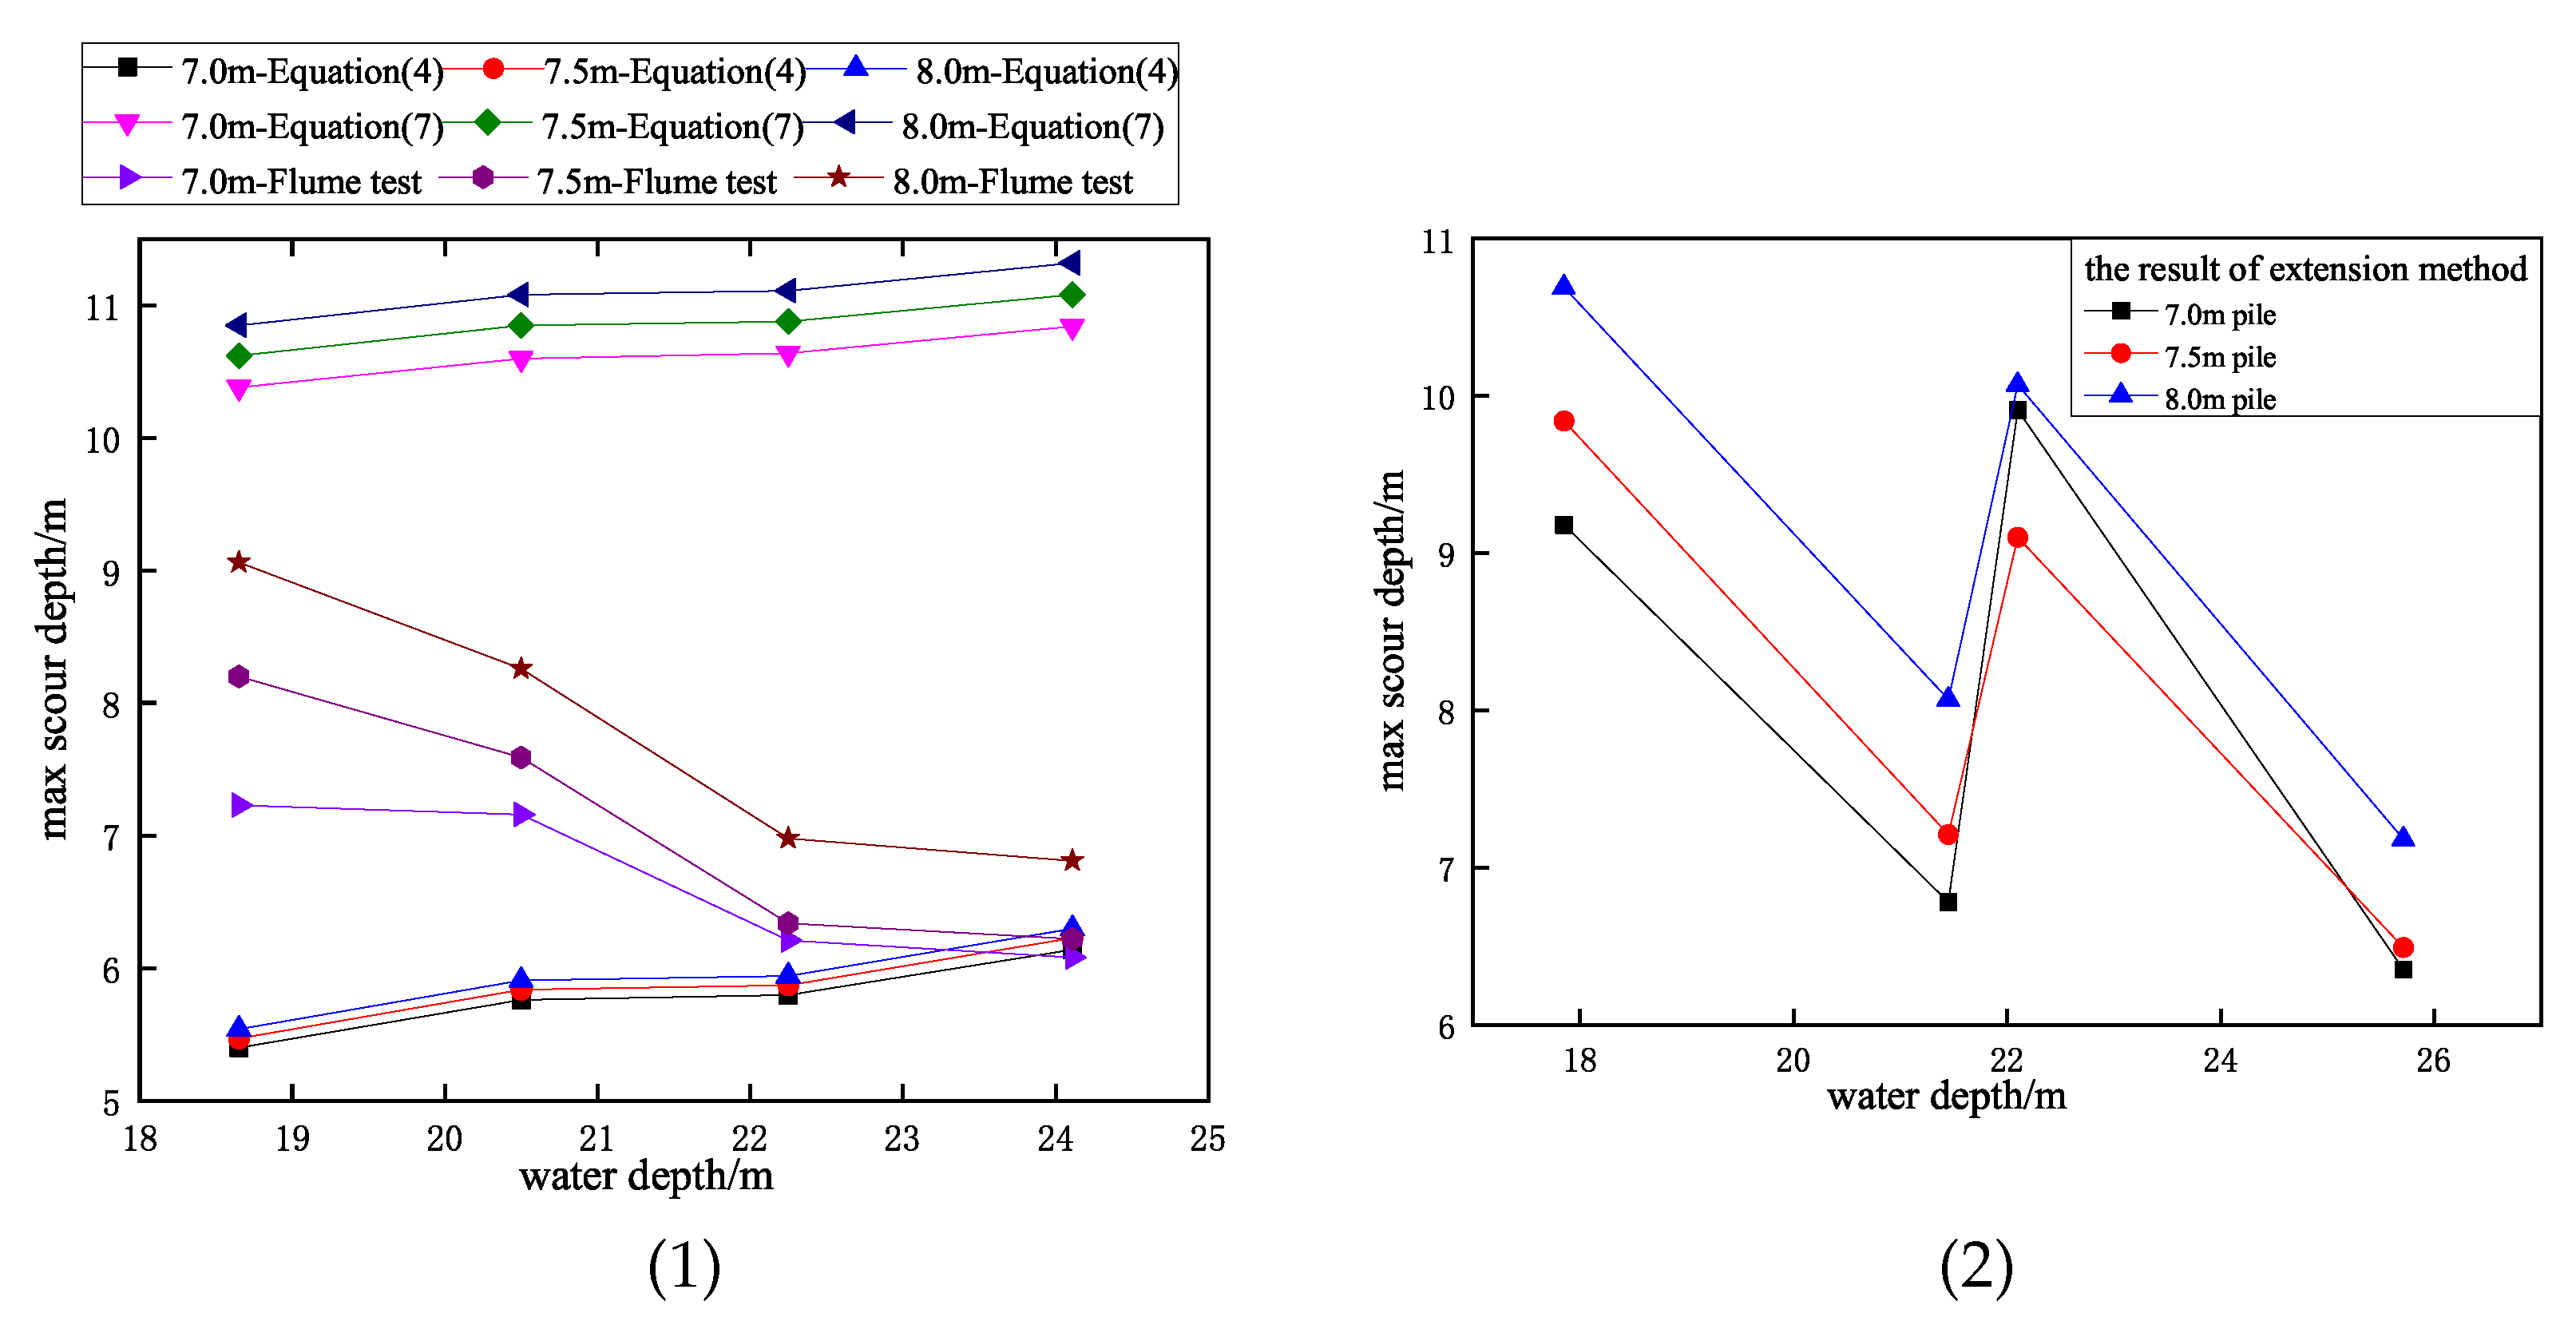
4.3. Maximum Scour Depth

The scour test was conducted under sea conditions with a 2-year return period by adjusting the current and wave-making parameters for high tide and ebb tide, respectively. The adjusted parameters were inputted and scouring was initiated. The model tidal period was calculated from the time scale and the water-flow direction was reversed every half tidal period. The criterion for reaching the equilibrium scour is that the maximum bed elevation near each model at the end of three consecutive tidal cycles is the same as the rest after the scour hole morphology is developed sufficiently. The complete crater pattern was scanned with a topographic vehicle and the maximum scour depth was recorded. For the 50-year return period, only short-term scouring was carried out to reflect the influence of severe weather such as a storm surge or typhoon, resulting in an unequilibrium state of scouring. The extension curve of the series model is shown in Figure 6 and the corresponding relationship between the maximum scour depth and water depth is shown in Figure 7.
Figure 6 shows that the data of the series of three scale-model tests have a linear relationship under different tide levels. Therefore, model tests at two different scales of 1:50 and 1:100 using prototype sand and with another model test with a 1:75 scale as a correction group, can effectively improve the accuracy of predicting the maximum scour depth of the prototype. As shown in Figure 7(1), the maximum scour depth decreases as the the water depth increases under the 2-year return period condition. Despite the lower flow velocity and wave height under low-water-level conditions compared to those under high-water-level conditions, the wave flow induces greater sediment transport in the bed under low-water-level conditions. However, the same pattern was not observed in Figure 7(2), which can be attributed to the fact that scour under the 50-year-return-period condition is unequal. Therefore, in the subsequent analysis of bed shear stress, the results under the 50-year-return-period condition will not be taken into account. Equation (4) is mainly based on the empirical formula obtained from the coarse sand model. Therefore, it is similar to the result of the medium sand in this experiment under the condition of a high tide level after the influence of the wave–current on the bed is reduced under the condition of a high tide level. However, the maximum scouring depth increases with the increase in water depth according to Equation (4), which is quite different from the test results. Equation (7) is mainly applicable to the tidal effect of the viscous bed, which is consistent with the test results in trend, but is significantly larger in the maximum scour depth.

4.4. Bed Shear-Stress Analysis

The prediction equation of equilibrium-scour depth is highly empirical and is significantly affected by the properties of mud sand and wave current conditions, and, hence, it cannot accurately reflect the microscopic stress characteristics of a single sand particle, which results in a large difference between the prediction equation and flume test. In this section, the bed shear stress under each working condition is calculated to quantitatively characterize the shearing action of waves and currents on the bed sediment.

4.4.1. Bed Shear Stress under the Action of Current Alone

The vertical velocity of the constant open-channel current satisfies the logarithmic distribution law, and the frictional flow velocity u * near the bed can be obtained from the average flow velocity of the flow section. The shear stress τ c can be obtained from the following equation:
τ c = ρ u * 2
u u * = 1 κ In z z 0
z 0 = Δ 30 1 e x p u * Δ 27 υ + υ 9 u *
where κ = 0.4 is the Karman constant, u the average flow velocity of the section, z the height of the target point from the bed and taken as 0.37 times the water depth, ρ the water density, z 0 the distance between the velocity zero point and the bed, and Δ the rough height of the bed surface, which can be taken as 2.5 times the median particle size of the sediment.

4.4.2. Bed Shear Stress under the Action of Wave Alone

The bed shear stress generated by waves is defined as follows:
τ w = 1 2 f w ρ u b m 2 = ρ u * 2
where u b m is the maximum value of the horizontal trajectory velocity of the bottom water-quality point, which is obtained from the linear wave theory; u * the wave friction velocity; and f w the wave friction coefficient, which satisfies the following relationship for the medium sand bed in the turbulent smooth zone:
1 4 f w + 2 l g 1 4 f w = l g R e 1.55
where R e = u * A m / υ , and A m is the horizontal movement amplitude of the bottom water point.
The wave friction coefficient f w and the bed shear stress τ w under different water depths, and significant wave heights and wave periods can be obtained iteratively from Equations (11) and (12).

4.4.3. Bed Shear Stress under the Combined Action of Waves and Current

Based on the assumption that the sand grains are in the viscous bottom layer of wave and current motion, the vertical-flow velocity profile is linear, and the energy is equal to the sum of wave energy and water-flow energy according to the coexistence of wave and flow. The relationship between the bed shear stress of the combination of steady flow and linear wave and the interaction of the two alone is [25]:
τ c w = τ c + τ w s i n θ 2
where θ is the wave phase, and τ c and τ w can be calculated according to the aforementioned methods. It is feasible to estimate the τ c w of the engineering site with this method since the time scales of the wave and tidal current cycles are very different.
The bed shear stress under 2-year-return-period working conditions was calculated to quantitatively characterize the drag effect of waves and current on the bottom bed sediment. As shown in Figure 8, the trend of equilibrium-scour depth is completely consistent with the bed shear stress. In general, it is reasonable to consider whether the maximum-scouring-depth relationship is correct under the same sediment grading condition through the bottom-bed shear-stress analysis.

5. Conclusions

This paper obtained the local scour characteristics of a single offshore wind-turbine foundation under the combined action of wave and current through flume experiments, considering the changes in water-depth conditions and tidal influences. The conclusions are summarized as follows:
  • The shape of the scour hole is noticeably different under the combined effects of tidal and wave–current compared to unidirectional flow. The scour holes exhibit a symmetrical “horseshoe” shape on both sides, and the maximum scour depth is typically located near the upstream surface of the pile;
  • When subjected to the combined action of waves and current, the maximum scour depth in the field area decreases with increasing water depth when the water depth h is within the range of 3–6 D, and D / d 50 is much larger than 50;
  • There exists a significant difference between the maximum scour depth obtained through the series-model extension test and the calculation results of the scour empirical equation and the wave–current-scour empirical equation, which could be attributed to the wind-power pile foundation and bridge-site selection factors. As a result, more physical model tests and measurements are required to re-derive the empirical equation for the scour depth of offshore wind-power monopile foundations. The existing empirical equation is inadequate for project-site requirements since the test in this study considered the influence of tidal level and wave–current reciprocation. More data are needed to amend the existing model for further improvement;
  • The bed shear-stress equation is in good agreement with the model’s prediction of the maximum scour depth. As a result, it is possible to assess the rationality of the test results using bed shear stress, and it also somewhat resolves the issue of cross-interference caused by tide level, flow velocity, waves, sediment gradation, and other factors. This method can predict not only the increase law of the maximum scour depth of equilibrium scour under general sea conditions, but also the deepening of the maximum scour depth caused by short-term severe sea conditions. Therefore, it can be applied in engineering practice to evaluate the local-scour depth law of wind-power piles at different locations.
Future research needs more experiments on local scour in simulated complex environments to obtain universally applicable data. Moreover, the lack of generalizability of empirical equations derived from specific regions underscores the requirement for further research into the impact of sediment particle size on scour depth in various soil types.

Author Contributions

Conceptualization, H.L. and Z.T.; methodology, H.L., Z.T. and R.Z. (Rongsheng Zhang); validation, R.Z. (Rongsheng Zhang) and C.Z.; formal analysis, C.Z.; resources, X.S.; data curation, S.F.; writing—original draft preparation, Z.T.; writing—review and editing, H.L., Z.T. and C.Z.; visualization, C.Z.; supervision, R.Z. (Ronghua Zhu). All authors have read and agreed to the published version of the manuscript.

Funding

Research funded by Key-Area Research and Development Program of Guangdong Province (China Grant No. 2022B0101100001)|Science and Technology Special Fund Project of Yangjiang (China Grant No. SDZX2020001).

Institutional Review Board Statement

Not applicable.

Informed Consent Statement

Not applicable.

Data Availability Statement

The data that support the findings of this study are available from the corresponding author upon reasonable request.

Acknowledgments

The authors would like to acknowledge the support of Ocean College, Zhejiang University for providing the test sites.

Conflicts of Interest

The authors declare no conflict of interest.

References

  1. Fraile, D.; Mbistrova, A.; Pineda, I.; Tardieu, P.; Miró, L. Wind in Power 2017: Annual Combined Onshore and Offshore Wind Energy Statistics; WindEurope: Brussels, Belgium, 2018; p. 25. [Google Scholar]
  2. Matutano, C.; Negro, V.; López-Gutiérrez, J.S.; Esteban, M.D. Scour prediction and scour protections in offshore wind farms. Renew. Energy 2013, 57, 358–365. [Google Scholar] [CrossRef] [Green Version]
  3. Sørensen, S.P.H.; Ibsen, L.B. Assessment of foundation design for offshore monopiles unprotected against scour. Ocean Eng. 2013, 63, 17–25. [Google Scholar] [CrossRef]
  4. Liang, F.; Wang, C.; Huang, M.; Wang, Y. Experimental observations and evaluations of formulae for local scour at pile groups in steady currents. Mar. Georesources Geotechnol. 2017, 35, 245–255. [Google Scholar] [CrossRef]
  5. Sheppard, D.M.; Miller, W., Jr. Live-bed local pier scour experiments. J. Hydraul. Eng. 2006, 132, 635–642. [Google Scholar] [CrossRef] [Green Version]
  6. Bayram, A.; Larson, M. Analysis of scour around a group of vertical piles in the field. J. Waterw. Port Coast. Ocean Eng. 2000, 126, 215–220. [Google Scholar] [CrossRef]
  7. Sumer, B.M.; Fredsøe, J. Scour below pipelines in waves. J. Waterw. Port Coast. Ocean Eng. 1990, 116, 307–323. [Google Scholar] [CrossRef]
  8. Rambabu, M.; Rao, S.N.; Sundar, V. Current-induced scour around a vertical pile in cohesive soil. Ocean Eng. 2003, 30, 893–920. [Google Scholar] [CrossRef]
  9. Lin, Y.; Lin, C. Effects of scour-hole dimensions on lateral behavior of piles in sands. Comput. Geotech. 2019, 111, 30–41. [Google Scholar] [CrossRef]
  10. Valela, C.; Rennie, C.D.; Nistor, I. Improved bridge pier collar for reducing scour. Int. J. Sediment Res. 2022, 37, 37–46. [Google Scholar] [CrossRef]
  11. Rance, P. The potential for scour around large objects. In Scour Prevention Techniques Around Offshore Structures; Society for Underwater Technology: London, UK, 1980; pp. 41–53. [Google Scholar]
  12. Qi, W.; Gao, F. Equilibrium scour depth at offshore monopile foundation in combined waves and current. Sci. China Technol. Sci. 2014, 57, 1030–1039. [Google Scholar] [CrossRef] [Green Version]
  13. Olabarrieta, M.; Medina, R.; Castanedo, S. Effects of wave–current interaction on the current profile. Coast. Eng. 2010, 57, 643–655. [Google Scholar] [CrossRef]
  14. Singh, S.K.; Raushan, P.K.; Debnath, K. Combined effect of wave and current in rough bed free surface flow. Ocean Eng. 2018, 160, 20–32. [Google Scholar] [CrossRef]
  15. Høgedal, M.; Hald, T. Scour Assessment and Design for Scour for Monopile Foundations for Offshore Wind Turbines; Copenhagen Offshore Wind: Copenhagen, Denmark, 2005; pp. 1–10. [Google Scholar]
  16. Kemp, P.; Simons, R. The interaction between waves and a turbulent current: Waves propagating with the current. J. Fluid Mech. 1982, 116, 227–250. [Google Scholar] [CrossRef] [Green Version]
  17. Kemp, P.; Simons, R. The interaction of waves and a turbulent current: Waves propagating against the current. J. Fluid Mech. 1983, 130, 73–89. [Google Scholar] [CrossRef] [Green Version]
  18. Eadie, R.W., IV; Herbich, J.B. Scour about a single, cylindrical pile due to combined random waves and a current. In Proceedings of the 20th International Conference on Coastal Engineering, Taipei, Taiwan, 9–14 November 1986; pp. 1858–1870. [Google Scholar] [CrossRef]
  19. Gazi, A.H.; Purkayastha, S.; Afzal, M.S. The equilibrium scour depth around a pier under the action of collinear waves and current. J. Mar. Sci. Eng. 2020, 8, 36. [Google Scholar] [CrossRef] [Green Version]
  20. Guan, D.w.; Xie, Y.x.; Yao, Z.s.; Chiew, Y.M.; Zhang, J.s.; Zheng, J.h. Local scour at offshore windfarm monopile foundations: A review. Water Sci. Eng. 2022, 15, 29–39. [Google Scholar] [CrossRef]
  21. Sumer, B.M.; Fredsøe, J. Scour around pile in combined waves and current. J. Hydraul. Eng. 2001, 127, 403–411. [Google Scholar] [CrossRef]
  22. Sumer, B.M.; Fredsøe, J. The Mechanics of Scour in the Marine Environment; World Scientific: Singapore, 2002. [Google Scholar]
  23. China Renewable Energy Engineering Institute. Code for Design of Wind Turbine Foundations for Offshore Wind Power Projects; China Water & Power Press: Beijing, China, 2018. [Google Scholar]
  24. Lee, S.O.; Sturm, T.W. Effect of sediment size scaling on physical modeling of bridge pier scour. J. Hydraul. Eng. 2009, 135, 793–802. [Google Scholar] [CrossRef]
  25. Cao, Z.; Kong, L.; Jiao, G. Initiation of sediment movement for a wave- current coexistent system. Acta Oceanol. Sin. 2003, 25, 113–119. [Google Scholar] [CrossRef]
Figure 1. Schematic diagram of the experimental system.
Sustainability 15 05746 g001
Figure 2. The scaled monopile models(1/100 blue, 1/75 yellow, 1/50 white).
Sustainability 15 05746 g002
Figure 3. The development process of the scour hole (the labels a to d denote chronological order). (1) The same direction of wave flow and (2) the opposite direction of wave flow.
Sustainability 15 05746 g003
Figure 4. Condition 2: 1# Low water level, 2-year return period (scaled models of 7 m, 7.5 m, and 8 m from left to right). (a) Physical map, (b) contour map and (c) 3D topographic map.
Sustainability 15 05746 g004
Figure 5. Condition 8: 3# Low water level, 50-year return period (scaled models of 7 m, 7.5 m, and 8 m from left to right). (a) Physical map, (b) contour map and (c) 3D topographic map.
Sustainability 15 05746 g005aSustainability 15 05746 g005b
Figure 6. Series-extension model curve. (a) 1# Low water level, (b) 1# high water level, (c) 3# low water level and (d) 3# high water level.
Sustainability 15 05746 g006aSustainability 15 05746 g006b
Figure 7. Variation in maximum scour depth under different tidal levels. (1) 2-year return period and (2) 50-year return period.
Sustainability 15 05746 g007
Figure 8. Comparison of model-predicted scour depth and bed-shear-stress trend (under 2-year-return-period condition). (1) Variation in scour depth and (2) variation in bed shear stress.
Sustainability 15 05746 g008
Table 1. Prototype conditions.
Condition NumberCondition NameWater Depth (m)Flow Rate (m/s)Significant Wave Height (m)Average Period (s)
11# High, 2 year20.501.174.407.71
21# Low, 2 year18.651.174.077.60
31# High, 50 year22.101.446.809.14
41# Low, 50 year17.851.445.806.27
53# High, 2 year24.111.174.747.73
63# Low, 2 year22.251.174.417.61
73# High, 50 year25.711.447.289.18
83# Low, 50 year21.451.446.318.44
Table 2. Sandy substrate model scale.
NameExpressionNumerical Value
geometric scale λ L = L m / L p 1 / 50 = 0.02
1 / 75 0.0133
1 / 100 = 0.01
time scale λ τ = τ m / τ p = λ L 1 / 2 ( 1 / 50 ) 1 / 2 0.1414
( 1 / 75 ) 1 / 2 0.1155
( 1 / 100 ) 1 / 2 = 0.1
speed scale λ V = V m / V p = λ L 1 / 2 ( 1 / 50 ) 1 / 2 0.1414
( 1 / 75 ) 1 / 2 0.1155
( 1 / 100 ) 1 / 2 = 0.1
wave height scale λ H w = L m / L p 1 / 50 = 0.02
1 / 75 0.0133
1 / 100 = 0.01
wave length scale λ L w = L m / L p 1 / 50 = 0.02
1 / 75 0.0133
1 / 100 = 0.01
wave period scale λ τ w = τ m / τ p = λ L 1 / 2 ( 1 / 50 ) 1 / 2 0.1414
( 1 / 75 ) 1 / 2 0.1155
( 1 / 100 ) 1 / 2 = 0.1
Table 3. Site sediment gradation.
Particle-Size Interval (mm)>2.002.00∼0.500.50∼0.250.25∼0.075<0.075
Content (%)17.926.717.532.85.1
Disclaimer/Publisher’s Note: The statements, opinions and data contained in all publications are solely those of the individual author(s) and contributor(s) and not of MDPI and/or the editor(s). MDPI and/or the editor(s) disclaim responsibility for any injury to people or property resulting from any ideas, methods, instructions or products referred to in the content.

