1. Introduction
Many countries have adopted measures for transitioning to low-carbon economies in response to a growing knowledge of climate change’s dangers. Substituting fossil fuels with renewable energy sources is a fundamental method of decarbonization. This delivers environmental and climate benefits, such as reduced CO
2 and other pollution emissions [
1,
2].
Achieving this economic potential has become an additional justification for climate change policies such as the OECD’s 2009 Green Growth Plan, which aims to stimulate economic recovery within a green framework for long-term sustainable growth [
3,
4]. By 2040, renewable energy sources are anticipated to account for 50% of power generation in the European Union, 30% in China and Japan, and over 25% in the United States and India [
5].
Nonetheless, Iraq’s current RE capacity is considered minor compared to the country’s estimated potential to generate electricity via gas, oil, and steam-powered stations. In 2021, 80% of the energy produced was derived from fossil fuels, while just 2% came from hydroelectric plants [
6]. Moreover, several droughts have significantly impacted older hydropower plants and water-based generators [
7]. There is also the issue of dams erected in neighboring countries, such as Turkey’s Elisso Dam on the Tigris, which reduces Iraq’s share of available water [
8].
Similarly, most recent projects in the power generation sector in this country rely on the availability of hastily built stations, such as gas turbines or combined cycle stations, which were initially fossil-fuel-based power plants [
9]. Even though these projects have just started, the government needs to produce more electricity to meet national demand. Several types of research in Iraq have focused on the electricity situation and the possibilities for alternative power sources, as stated in [
6,
10,
11]. As previously described, the problem of carbon dioxide gas emissions originating primarily from fossil energy sources in power plants and industry is one of the most severe environmental issues worldwide [
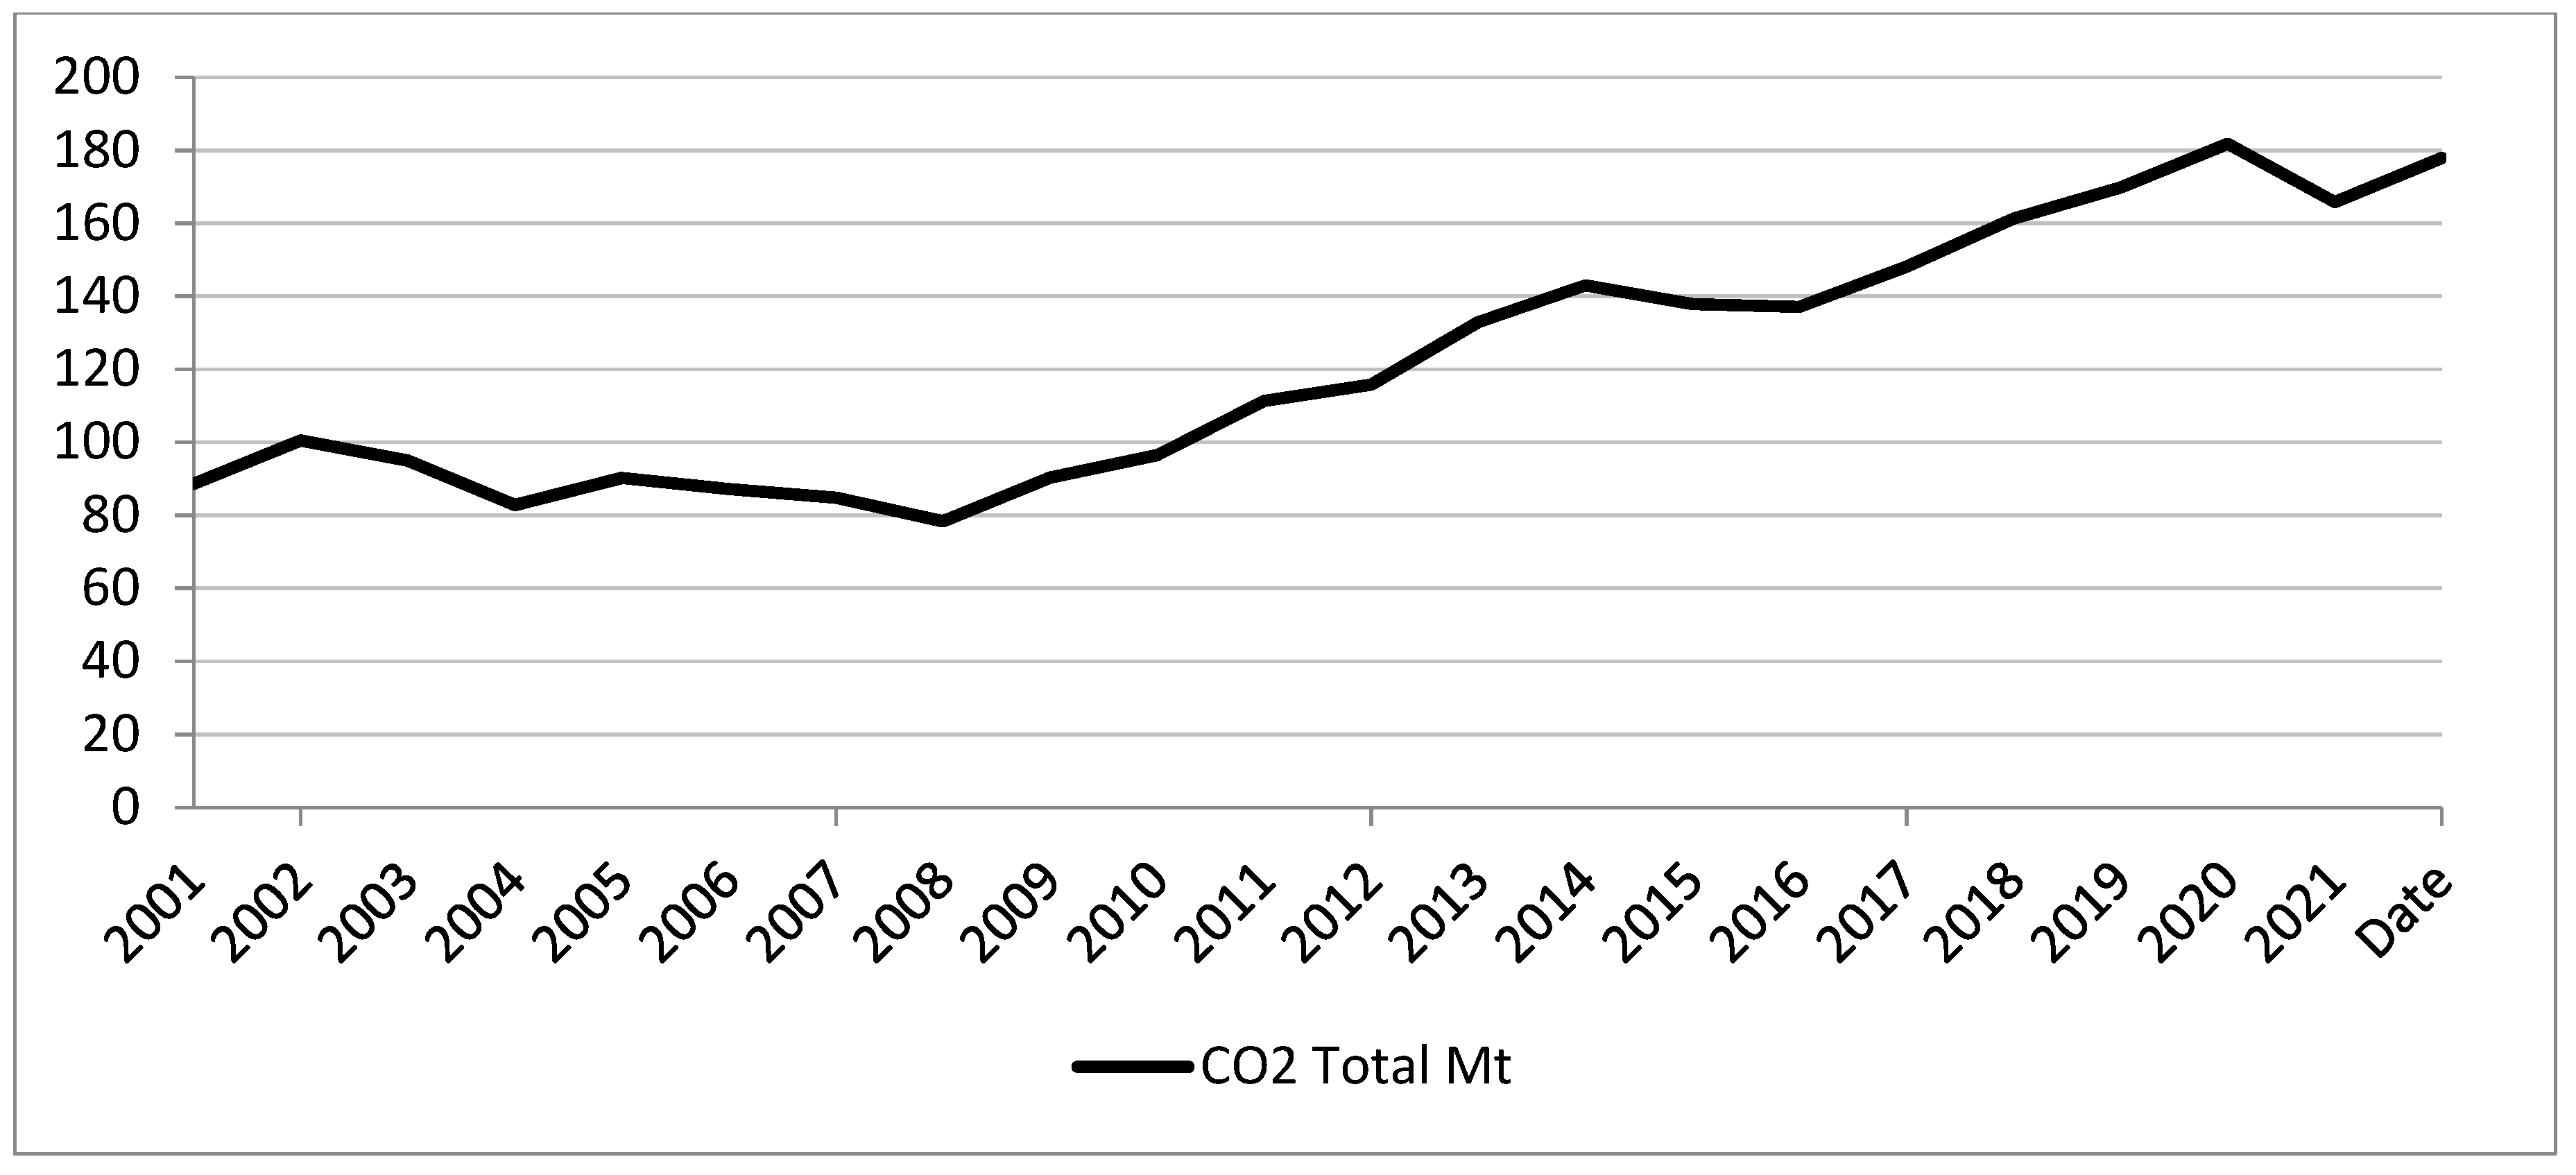
12], because the emission of these toxic gases causes severe changes that influence the present and future state of the planet, such as the rising of the Earth’s temperature, the melting of ice in the polar regions, and health problems caused by air pollution. Iraq is highly dependent on electricity generated from fossil fuels. In addition, gas-burning operations from oil-refining activities, aging factories with increasing emissions, and the unrestrained expansion in the number of automobiles on the road, as indicated in
Table 1 and
Figure 1, have significantly boosted Iraq’s carbon emissions [
13].
Since Iraq is a signatory to the Kyoto Protocol on climate change and carbon emissions regulation, Iraq should restart efforts to decrease these emissions by increasing reliance on renewable-energy-producing stations, such as solar plants, which may significantly cut carbon emissions [
14]. If electricity is generated using photovoltaics, at least 89% of air emissions related to power generation might be eliminated [
15]. The global trend in the power generation industry is to install more environmentally friendly generation plants using renewable energy sources; this country’s planning should follow this global trend to ensure operationally efficient and environmentally friendly power generation for the present and future generations [
16].
Agriculture is an integral part of the Iraqi economy and culture. It can play an essential role in the distributed generation of sustainable energy. During the last few years, considerable efforts have been made in Iraq towards the adoption of renewable energy technologies, especially in the agricultural sector [
17]. In particular, the country has a notable opportunity to use photovoltaic (PV) systems: according to NASA, the country receives energy from insolation of 2310 kWh/m
2/year [
18]. If this opportunity is pursued, particularly in agriculture by cultivating arid areas, Iraq could reduce carbon dioxide emissions by nearly 40,000 metric tons per year [
19] compared to a similar expansion of fossil capacity. This would help to improve the atmosphere in Iraq and reduce severe issues of climate change such as dust storms [
20]. The existing and future adoption of RE technologies in Iraq is influenced by various techno-socioeconomic factors, including the financial and fiscal incentives provided by the government. For instance, the government now gives customs exemptions to import RE components such as solar panels and nanoparticle fertilizers and has set new plans to convert from traditional energies (TE) to RE [
21]. The spread of these technologies in the future will also rely on further development, qualification, and learning experience [
22]. A priori knowledge of the likely distribution of RE technologies and their time variations is necessary for macro-level policy interventions and planning [
23]. Furthermore, for formulating and applying policies in this area, the issues of studying the effects and returns to scale are of considerable importance [
24].
This study investigated the mitigation of climate change via the transition from traditional energy use to cleaner energy use by applying RE technologies in agriculture, such as irrigation water pumping systems for arid areas and nanoparticles fertilizer, and quantifying the economics of using RE in households, including the following parameters: the cost of the solar irrigation system; the cost of nanoparticle fertilizers; nutrient supplements; proctors for pest and disease hotspots; management costs; crop yield and quality. We also quantified the adoption impacts of this project via evaluation techniques such as a before-and-after adoption comparison.
2. Expanding Renewable Energy Sources and the Economy
The subsequent sub-sections expand on the empirical studies relevant to the topic. Increases in pollution have long been positively connected with economic expansion in the literature. Nonetheless, nonrenewable energy use and globalization are considered to be the primary drivers of rising carbon emissions [
25,
26,
27]. Moreover, they are dangerous to human health [
16,
28,
29]. Renewable energy, renewable investment, fiscal decentralization, financial inclusion, policy instruments about the environment, financial development, environmental research and development, exports, reduced composite risk, eco-innovation, and environmental innovation are a few examples of what scholars have deemed appropriate for environmental recovery without compromising economic growth [
30,
31,
32,
33,
34,
35,
36,
37,
38,
39,
40,
41]. Most of this research asserts that renewable energy is a potential environmental sustainability component. Thus, it is vital to evaluate the pertinent research on the relationship between renewables and economic growth.
Research on the impacts on gross employment has been conducted for various countries and regions, such as the UK [
42], the EU [
43,
44], Germany, [
45,
46], Greece [
47], the Middle East [
48], Brazil [
49], and the U.S. [
50,
51], and various types of renewable energy technology.
There are many studies on the feasibility of renewable energy adoption in Iraq [
6,
8,
10,
11,
19,
20,
52,
53,
54]. Such studies have investigated the beneficial and essential effects that the adoption of renewable energy sources has had on the expansion of the Iraqi economy. They have also argued that if there is good economic growth, other variables such as trade openness, industrial value adding, financial development, and technical innovation will change in tandem.
3. Probability of Using Solar Power in Iraq
It is well-known that Iraq has long periods of daylight unobstructed by cloudcover. Baghdad, for example, collects over 3000 h of solar radiance each year. The hourly sunlight intensity can range from 416 W/m
2 in January to 833 W/m
2 in June [
8]. In terms of measured sunlight, Iraq has higher values than Spain [
55]. Even though solar technology has enormous promise, adoption remains poor. While the worldwide average horizontal surface irradiance is 170 W/m
2 per year, the substantial sun irradiation in the deserts of western Iraq offers them particularly good potential for electric power generation [
56].
German Aerospace Center research shows that the average power density in Iraqi deserts is between 270 W/m
2 and 290 W/m
2, with a maximum of 2310 kW h/m
2/year [
57,
58]. Deserts make up around 31% of Iraq’s land area. Nonetheless, Iraq still benefits from being a leading provider of fossil fuels to the global energy market [
10]. This is why the Iraqi government is not keen on using solar energy. Because of this, neither the Iraqi government nor the Iraqi people value renewable energy. While this region must develop renewable energy technology, it can only be done through the efforts of concerned individuals and non-governmental organizations (NGOs) rather than through official programs.
The energy problem has expanded into a complex set of interrelated issues in the past decade. Despite Iraq’s rich reserves of fossil fuels, the country’s post-1991 reconstruction led to a severe energy crisis [
59]. Moreover, fossil fuel reserves are dwindling and will likely deplete within the next century. To combat this, solar power is the only reliable option, because it offers a continuous power supply while reducing carbon dioxide emissions from burning fossil fuels and other types of biofuels. Given this climate advantage, solar energy might be seriously explored as a means of reducing the impact of global warming [
60].
4. Iraq’s Current Efforts in Solar Energy
Due to rising demand, Iraq is suffering from a critical shortage of electrical power. As the population and economy of Iraq are growing, more electricity is required. As of 2022, Iraq had a population of 40 million people, up from 14 million in 1980, and projections indicate that number will climb to almost 64 million by 2050 [
61].
To sustain economic growth and compensate for everyday power shortages, more electricity must be produced.
The Ministry of Energy estimated a peak demand of 12,000 MW for electricity in 2008, but only about 6000 MW was actually produced. This shortfall is expected to reach 25,117 MW by 2025.
Table 2 shows the most likely scenario for Iraq’s electricity production in the upcoming year.
In 2019, the Ministry of Higher Education and Scientific Research hosted the National Conference on Renewable Energies and Their Applications, where participants reviewed the country’s renewable energy strategy and explored the potential for implementing it [
12]. Topics during the conference included renewable energy and energy efficiency in Iraq [
63]. The conference featured presentations and discussions on the practical applications of solar energy in Iraq and the economic viability of its implementation. Unfortunately, solar energy is still not widely used in Iraq. Iraq’s Ministry of Industry issued an order mandating the use of solar energy for various purposes, including but not limited to home water heating, street lighting in Baghdad, and agricultural drip irrigation. Several efforts were made to produce flat solar collectors for water heating by assembling components from other countries. Several corporations also began the production of solar cells [
19]. Now, solar cells are being used to provide lighting for several streets in Iraq. The use of solar cells in homes was found to be relatively uncommon. Commercial enterprise in Iraq has yet to back up renewable energy projects. Almost all development is organized with funding from the government [
12].
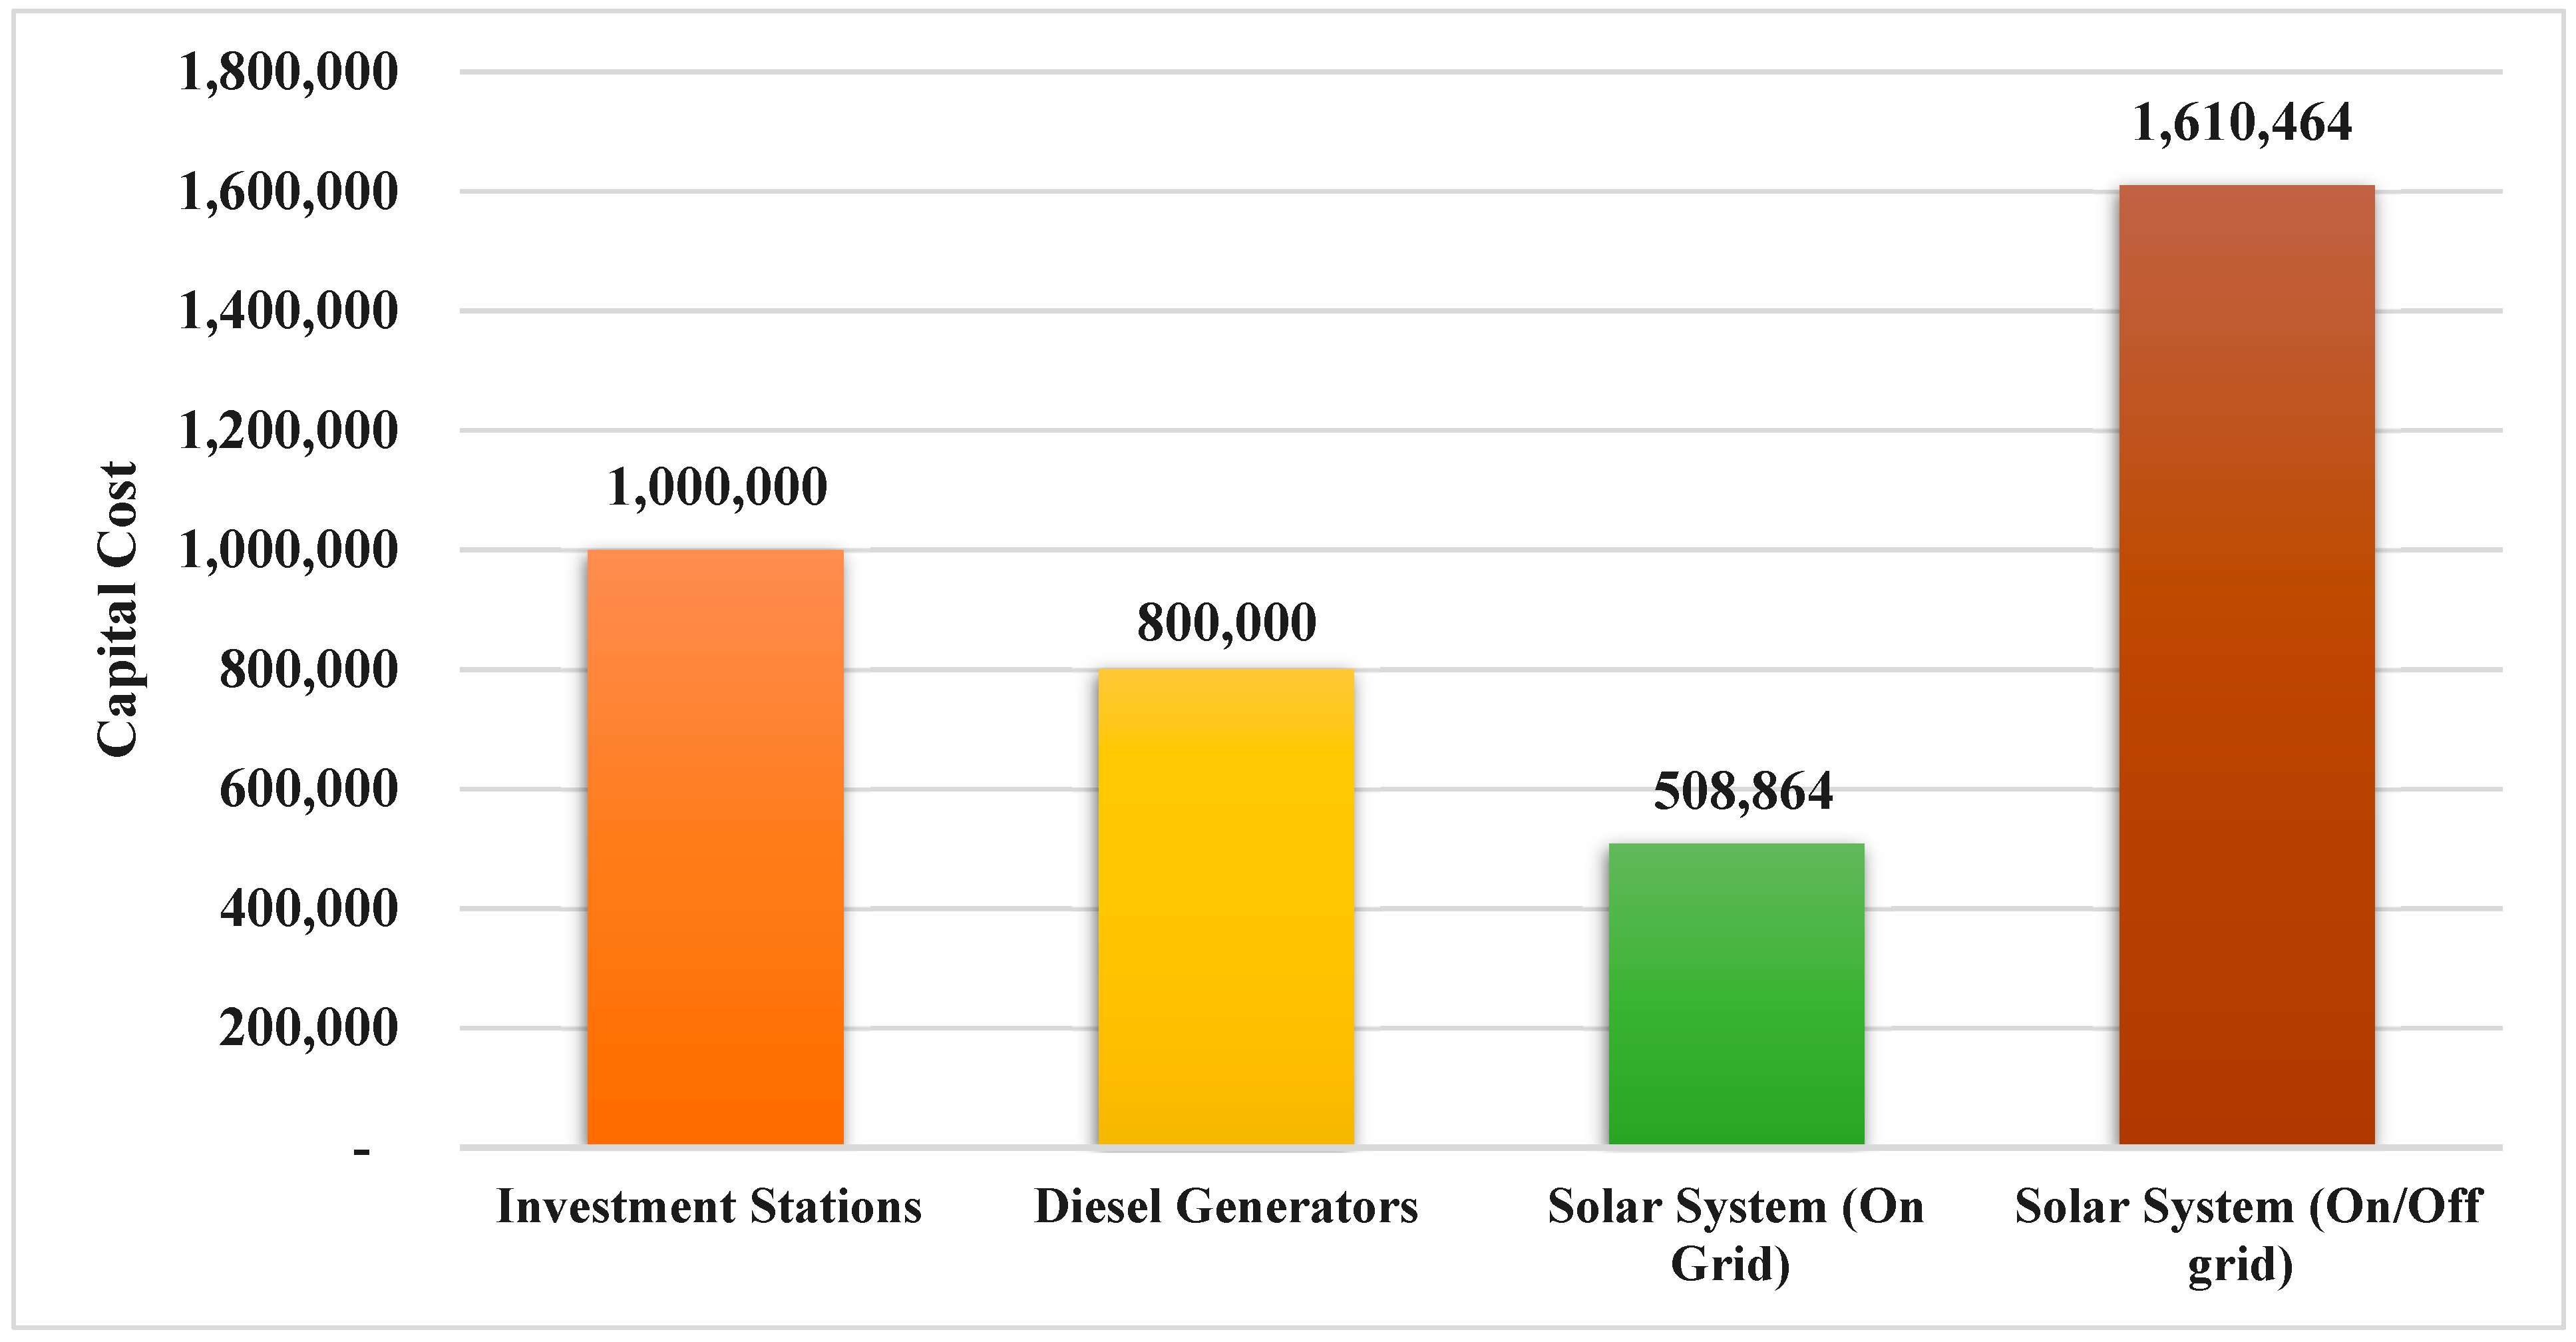
5. Economic Feasibility of Solar Energy Compared to Other Energy Sources
The economic feasibility of a clean alternative electrical power source and other power sources in Iraq are compared and presented in
Table 3 and
Figure 2. Cost estimates per KWH were made after thoroughly analyzing the three technologies [
64].
As the intricacy of individual installations affects the final price tag, gathering more data is necessary for an accurate estimate. The infrastructure needed to link the projects to the grid is separate from the system costs. In addition, the price of land directly impacts the amount of money available for investment [
65].
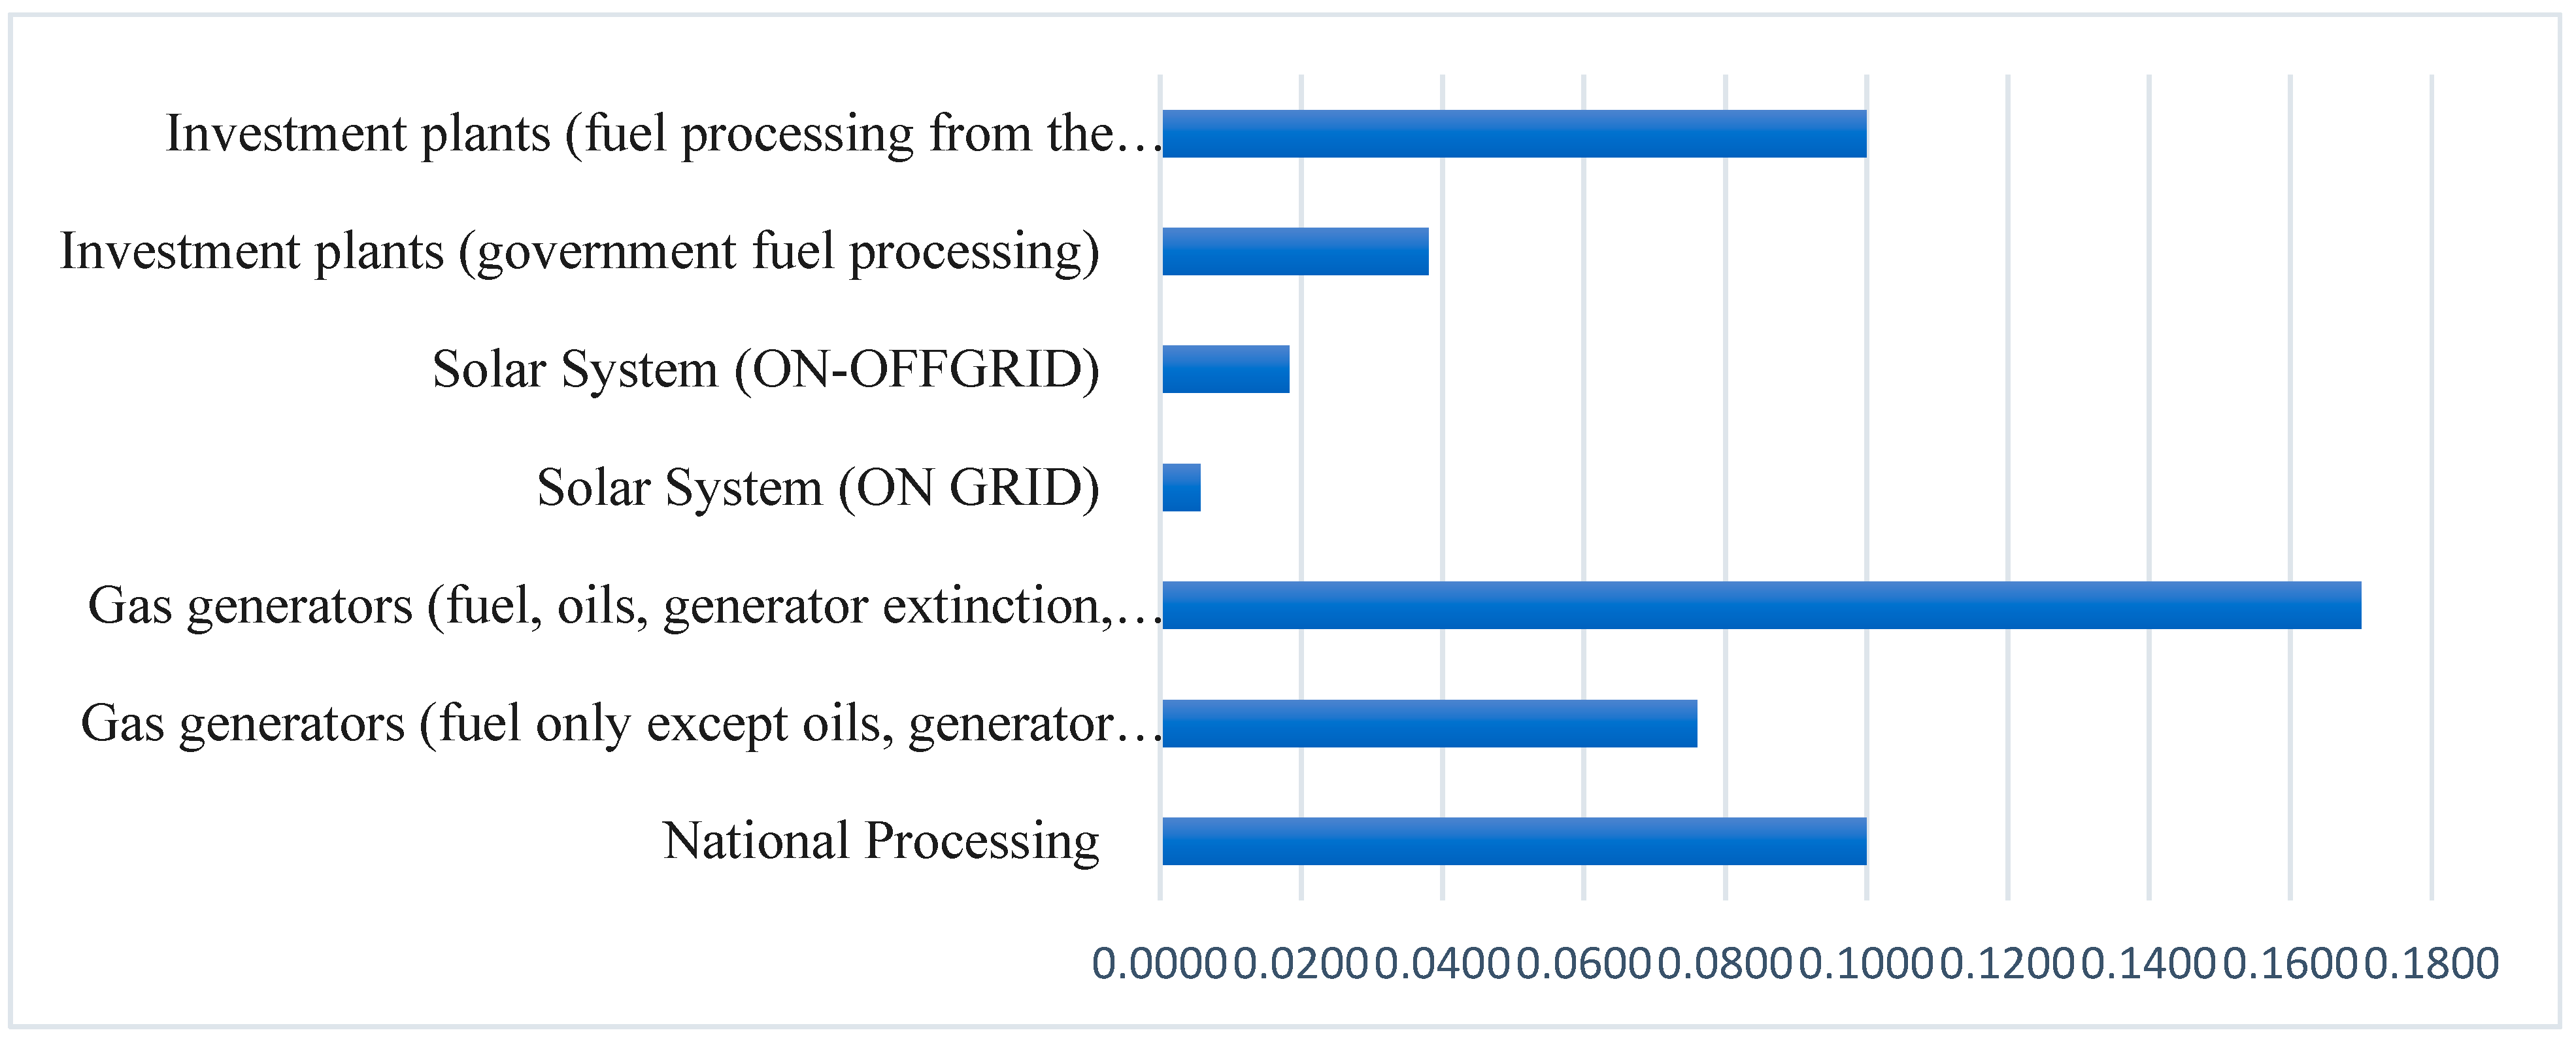
First, we determined the operating costs of diesel generators by calculating how much it would cost to run generators with a 1 Mwt output 24 h a day. When compared to other sources of power generation, solar energy’s operational costs are significantly lower than those of the government (81%), diesel generators (75%), and investment stations (51%) [
64]. Operating the system exclusively during daylight hours and without reliance on batteries reduces operational and capital expenses for the solar system by less than half; here, batteries are the critical element in raising the prices of solar capital and operational systems (
Table 4 and
Figure 3).
Predictions for the future of solar energy in Iraq indicate decreased costs.
The cost of photovoltaic (PV) systems has dropped by 10% over the past year. However, PV may need help becoming cost-competitive with other renewable energy sources in Iraq.
6. Environmental Impacts of Solar Energy
Operating PV systems have no adverse effects on the surrounding environment. They produce no unwanted noise, waste products, or harmful pollutants. The power produced by PV systems helps preserve the environment [
66]. Both developed and underdeveloped nations are affected. For instance, PV plants in industrialized countries prevent the release of one ton of carbon dioxide into the atmosphere for every kilowatt-hour (kWh) of electricity they produce. When reducing greenhouse gas emissions, the actual energy mix in each country is what matters most. In Germany, PV systems do not emit 650 g of carbon dioxide into the atmosphere for every kilowatt-hour produced [
67].
In this scenario, brown and hard coal account for a relatively large share of primary energy sources. Some countries, such as Norway and Switzerland, get much of the electricity they need from hydropower plants. As a result, PV systems save less carbon dioxide equivalent (CO
2) per kilowatt-hour (kWh) of generated power. One may also argue that PV systems in developing nations are the only viable option for traditional energy sources such as liquid gas and fuel oil. There is a significant reduction in several types of greenhouse gas emissions [
68].
As was previously established, PV systems do not produce any emissions when in operation; thus, any carbon dioxide emissions associated with their life cycle are purely indirect. They are a byproduct of production and may be estimated by dividing the number of emissions created during the production of all required PV system components (including potential replacements) by the amount of energy produced during production [
69].
Suppose any part of the system fails or becomes worn out while in use. It must be replaced immediately. The broken parts can be returned for recycling if they cannot be fixed. This may be more difficult in underdeveloped nations. It is worth noting that the solar module is the longest-lasting component of a PV system [
70].
7. Nanoparticle Fertilizers
Overview and Advantages
One of the world’s major agricultural issues is feeding the world’s fast-rising population. By 2050, the WHO predicts the world’s population will have risen to 10 billion [
71]. The FAO reports that global food production must drastically expand from its current level to feed 3 billion more people; for instance, yearly grain output must increase by 1 billion tons by 2050 [
72,
73]. Nevertheless, because of the fast deterioration of land and water, this target may be difficult to achieve. Nevertheless, environmental worries have slowed the adoption of chemically intensive agriculture. Thus, the modern agricultural industry is seeking to find environmentally friendly substitutes.
Agriculture is a highly significant economic engine and is the fundamental strength of many developing nations. Many countries rely heavily on this sector. Farmers, consumers, and the environment are all harmed by the ever-increasing usage of mineral fertilizers and harmful pesticides.
Nanofertilizers may play a significant part in helping to ensure that future generations have enough to eat [
74].
According to [
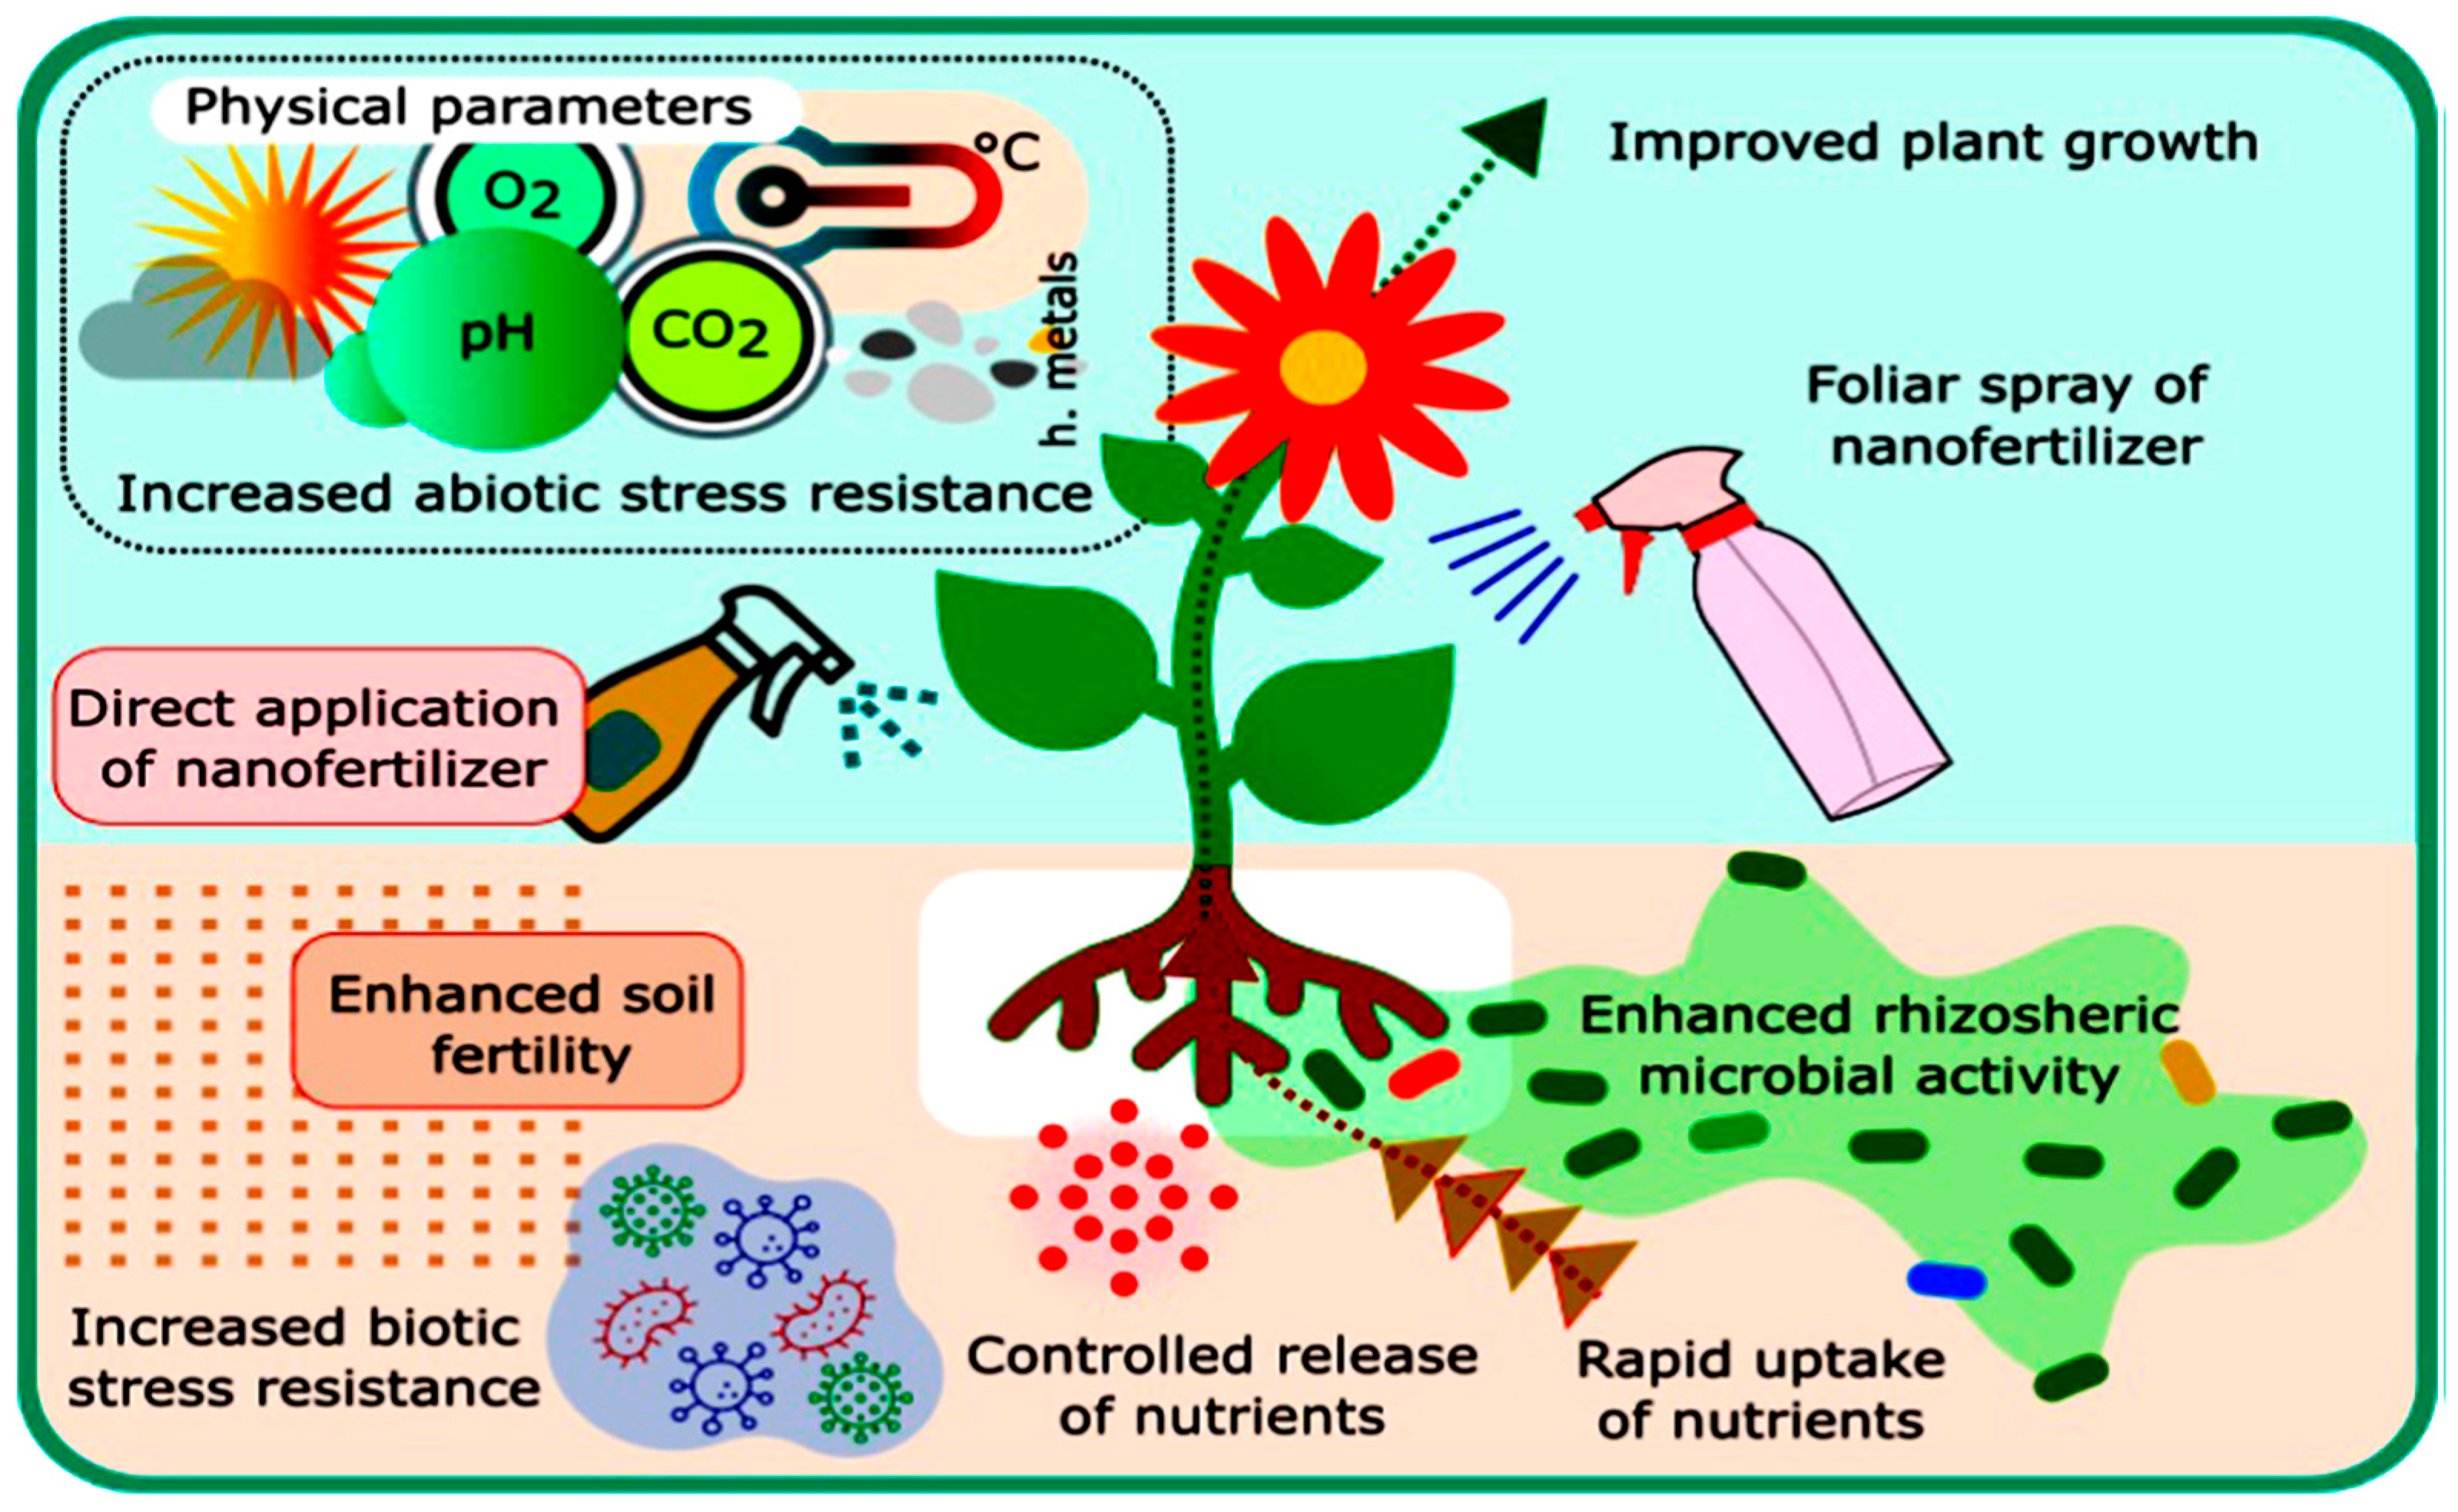
75], the term “Nanofertilizer” refers to both nanoparticles and nano-enabled bulk materials (such as bulk fertilizers covered with nanomaterials) that may be utilized as fertilizers. Uses of zeolite minerals and other naturally occurring nanoparticles are already commonplace in farming. Nevertheless, modern nanotechnology allows for the synthesis of nanoparticles with tailor-made chemical and physical characteristics for specific uses. Several studies have been conducted to determine the effect that various nanomaterials, both inorganic and organic, as well as composites, could have on plant development and yield. However, scientists have been concentrating on nanofertilizers that include micronutrients such as zinc, copper, manganese, and iron. Beneficial effects on plant development have also been shown using nanomaterials such as carbon nanotubes, silver (Ag), titanium oxide (TiO
2), cerium oxide (CeO
2), aluminum (Al), and others that are not generally employed as fertilizers in conventional agriculture (
Figure 4) [
76].
Nanofertilizers greatly enhance the efficiency with which plants utilize nutrients due to the regulated release of nutrients. Reports indicate that using nanofertilizers instead of conventional nitrogen can increase crop yields by as much as 50% [
77].
As a result, nanofertilizers have the potential to vastly boost crop growth and yields, increase fertilizer efficiency, cut down on nutrient losses, and lessen their adverse effects on the environment compared to traditional fertilizers [
78].
8. Impact of Renewable Energy on Agriculture
Sustainable agriculture can refer to a wide range of technologies, from solar panels to biogas. In contrast, fossil fuels such as oil are not replenishable. Hence, it is essential to create chemical-free soil fertilization and pest management methods. Such practices cushion farmers from the impact of oil price increases. Pumping water for irrigation, livestock, or residential use, lighting farm buildings, and powering processing processes are just some of the many agricultural tasks that can be accomplished using electricity generated from renewable sources [
79]. Solar power, wind energy, hydropower, oil derived from plants, sustainably sourced wood, various types of biomasses (plant material), and biogas are all examples of renewable energy (gas produced from the fermentation of manure and crop residues) [
80].
9. Case Study
9.1. Source of Data and Study Area
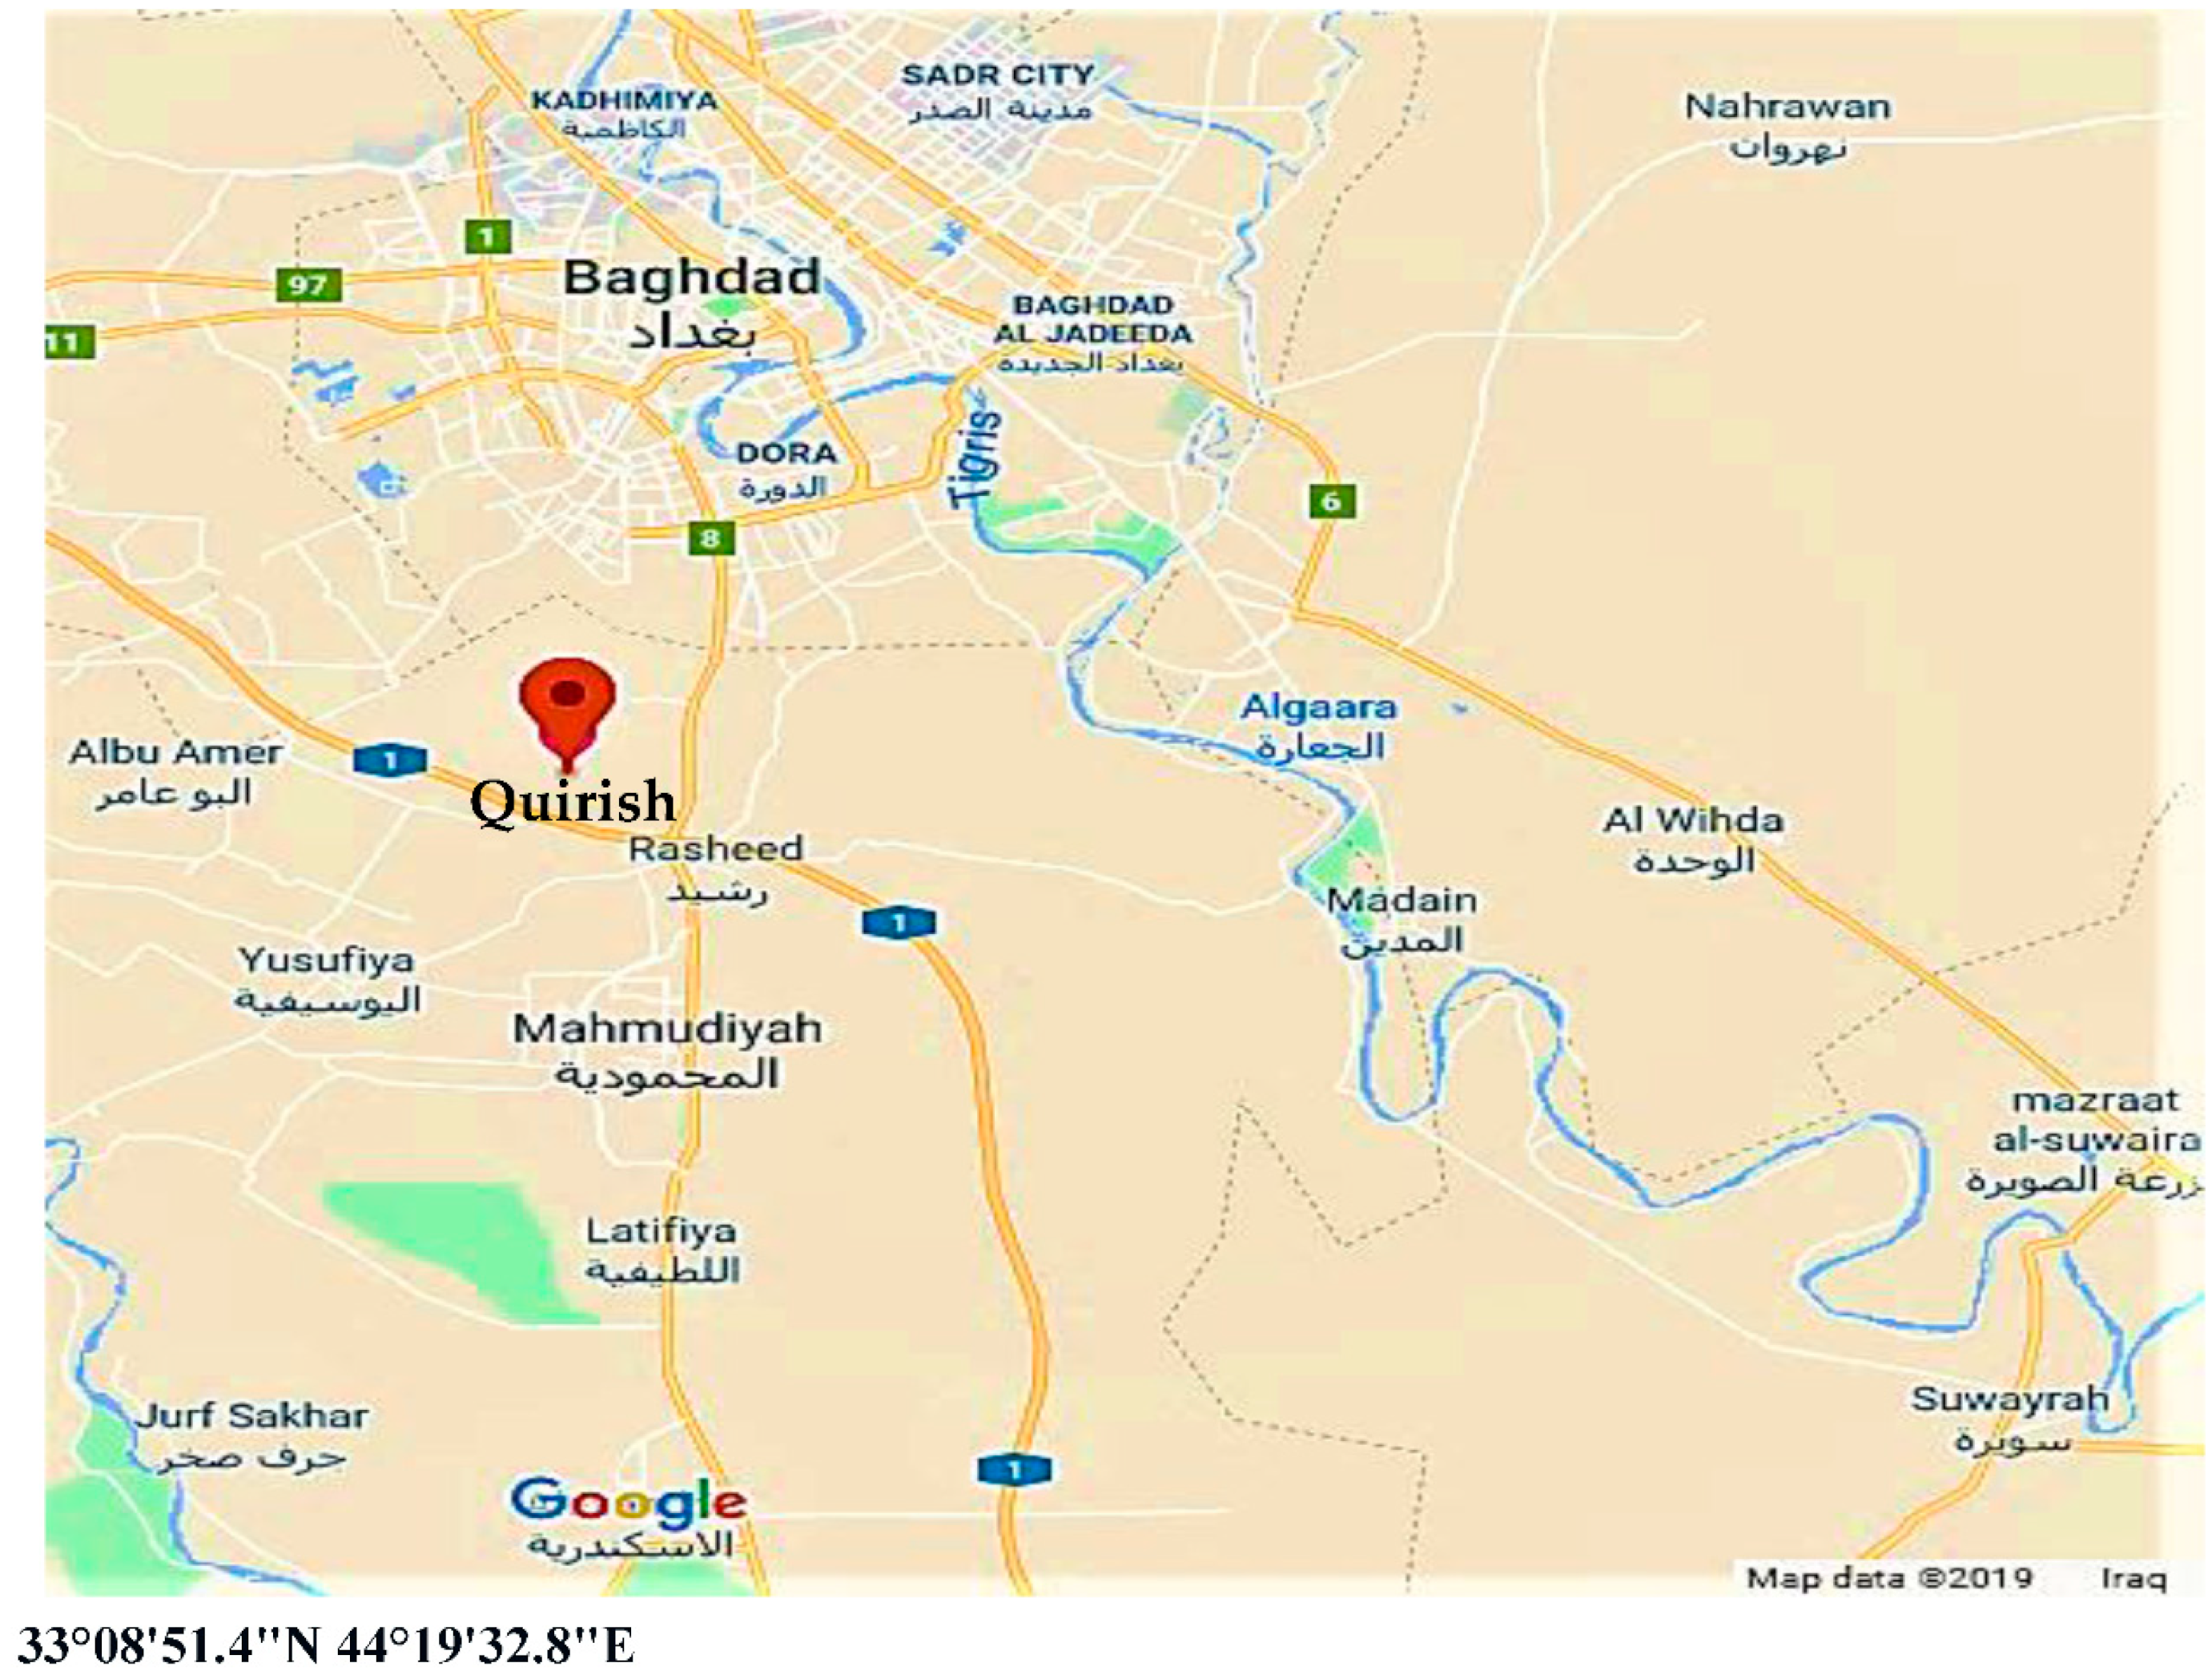
The analysis used information from the FARMSIM model from primary and secondary sources. A household and community survey conducted in the village of Quirish in 2021 as part of the Tony Laos Memorial Fund provided the bulk of the information used in this analysis. Secondary data, such as expert opinions, research articles, and reports from government and non-government agencies, complemented the original data. The data input sheet for the FARMSIM model was used to compile a summary of the survey’s and other sources’ findings about a typical farm’s crop yields, animal numbers, assets, liabilities, and fixed and variable costs.
Quirish is one of the villages located in the Al-Rasheed district in the Baghdad governorate. The Al-Rasheed district is regarded as one of Baghdad’s most important agricultural areas (
Figure 5). The total area is 24,683 ha. About 18,405 ha are cultivation areas in the district; these areas are exploited by planting various vegetable crops. Cucumber is the most important crop grown in the region, accounting for roughly 90% of total crop production, along with tomatoes, okra, eggplant, peas, melons, dates, and citrus. Most farmers are adopting a protected agriculture pattern by using greenhouses [
81].
Most of the farms in the south of Baghdad have suffered a severe shortage of surface water [
52]. Even though it is located on the banks of the Tigris River, the water is not enough to irrigate land because of government intervention to impose fixed water shares to irrigate farms and fines in case of overriding these shares. In addition, most farms are far away from a primary water source (river or water canal).
The best solution for this situation is to dig wells and rely on groundwater to provide the quantities of irrigation water needed to irrigate their agricultural land. On the other hand, farmers face another issue: the high installation, operation, and maintenance costs of diesel irrigation systems. Furthermore, fuel costs are high, which is stressful for the farmer, especially in the summer due to the rising temperatures. Therefore, the irrigation system must continue working more than 20 h daily to provide irrigated water for the land [
82].
We chose to establish the project in the city of Yusufiya in the south of Baghdad for several reasons. First, this region is considered one of Iraq’s most important agricultural regions, especially in the Baghdad governorate. Cucumber is the main crop cultivated in the city, and its production constitutes about 83 percent of Iraq’s cucumber production. Furthermore, most of the farms in this region rely on groundwater to irrigate their lands, which is characterized by a high cost of water pumps and low water quality, which sometimes leads to a decrease in output quantity and quality. We adopted a protected agriculture pattern by renting two greenhouses (9 m × 51.5 m) for two seasons (spring and fall). The greenhouses were rented due to their high construction costs of up to
$2500 each. A solar energy irrigation system was also installed on a well besides the water pump, along with a water purification system to improve water quality and enhance agricultural production [
53].
The NPF was added by foliar feeding to the plants, and we examined the possibility of adding it to the irrigated water to improve the plant’s nutrition and soil.
9.2. Water Desalination System
- I.
Water Quality
The population of Quirish depends on wells to irrigate their farms, which are characterized by high salinity, with the TDS of water ranging between 3000–4500 mg/L in winter and more than 8000 mg/L in summer (
Table 5).
The water’s high salinity leads to the deterioration of the soil and a decline in fertility. This significantly impacts the crops planted in it (low productivity and poor quality) [
83].
Another issue facing farmers is that there is no local water distribution network for domestic use; moreover, they cannot use the wells to meet their daily needs due to the poor water quality and high salinity.
The primary and only water source for domestic use is the Reverse Osmosis (RO) water system, which was established by the UN in 2004 as a temporary measure for water availability until the government provided a water distribution network for the entire village [
10]. However, this measure has not yet been implemented, and the population continues to rely on this system to provide water for their domestic use [
84].
- II.
Carefree Water Conditioners
The Carefree Water Conditioner is an in-line catalytic water purification device. It functions by combining the following [
85]:
This approach separates the metal particles in water, hence altering their behavior. Previously attracted particles now reject one another and split into smaller, more distinct particles. This permits mineral particles and salts to pass through the system with minimal obstruction [
86].
This natural water treatment system has helped tens of thousands of people worldwide solve their water problems and improve their water quality. Beneficiaries include householders, farmers, vineyards, market gardeners, golf courses, nurseries, local councils, government departments, hospitals, and commercial and industrial interests [
87].
The Carefree Water Conditioner is patented for several innovations. One of these innovations is the system’s ability to significantly reduce the amount of salt in the soil and improve the water supply, which is usually an expensive process in agriculture. Most farmers get their water for irrigation from groundwater, which has a very high level of salt in it [
88]. The government has not yet solved this problem, but these devices enable farmers to stay in agriculture, which is important for them since most do not have any other source of income [
89].
10. Micro- and Macro-Level Assumptions
To demonstrate the full potential of these new technologies, we first assumed complete adoption of the alternative agricultural technologies (alternative scenarios) modeled in this study in crop production and water irrigation. Farmers’ concerns about acquiring irrigation instruments such as solar pumps due to the high capital cost were partially addressed by making loans accessible to farmers to purchase solar irrigation pumps through the Agricultural Cooperative Bank of Iraq. Regarding nanofertilizer-related crop production technology, we estimated a 60% adoption rate, which is double the initial adoption rate from the household data survey (30%).
Second, easy market access is crucial, since farmers’ income is primarily determined by how much of their crop and animal stock (including livestock products) they sell at markets. It was presumed that farmers could easily access markets and operate purely competitively, with prices set only by supply and demand. In the Yousifia district, prices and market access are affected by many factors, including competition from imported crops and the availability of crops. On average, farmers said they traveled 21 km (13 miles) to markets, according to the survey. However, in the economic prediction for the next five years, the market selling price of each crop sold in Year 1 was expected to be the same as the average selling price of that crop in Year 5.
11. Methodology
11.1. FARMSIM Model Description
A “FARMSIM,” a Monte Carlo simulation model for farms, is a tool for comparing existing methods with more advanced ones. The model was developed for the sample by programming in Microsoft Excel. The Simetar add-in was used to estimate pricing and yield characteristics. Probability distributions, random variable simulations, and probabilistic estimation are all examples of probability distributions that classify technologies according to key output variables (KOVs) [
90]. FARMSIM was set to simulate a five-year planning horizon for a farm with various crops and animals. The simulation was run 500 times and generated 500 values for each of the significant outputs listed below. The empirical probability distributions were set by variables (KOVs) that compared how farming is done now and how it could be done in the future [
91]. Technological advancements allow policymakers to perform quantitative analyses of the most likely outcomes of alternatives to current technology on the environment to compare the base and alternative probability distributions.
FARMSIM can model the production and use of up to four types of crops and animals each year. These include cattle, dairy cows, sheep, and chickens [
24]. When it comes to growing crops and raising animals, farm families are the first claimants. The extra food they make is used to buy food for their needs. Using standard accounting methods, income, expenses, net cash income, annual cash flows, and net worth can be determined. The model’s KOVs can include any of the model’s endogenous variables. However, net annual cash income, annual ending cash reserves, net present value, benefit–cost ratios (BCR), and internal rates of return (IRR) still receive the bulk of the media’s consideration [
24].
11.2. FARMSIM Economic Equations
Equations in the FARMSIM model describe annual production, marketing, financial management, and consumption. The model has four major components: financial, agricultural, and human resources [
92] (
Appendix A).
11.3. Crop Model
Farm families can grow and consume up to 15 crops and foodstuffs yearly. The crops used in the model are based on the local crops grown and consumed in the region. Because the analyst specifies the order of the crops, the model can be used for various locations and farming systems. Stochastic yield and planted hectares are multiplied to arrive at crop production [
24]. Consumption by the family is measured as the average annual kilograms consumed or a percentage of total production. Employees and landowners can be compensated for excess production. The remainder of the crop is sold after it has been used to meet the needs of the family’s food supply, employee compensation, and rent [
21].
Crop cash receipts are calculated as quantity sold multiplied by the stochastic market price. In the absence of historical data, GRKS probability distributions based on expert opinion are used to simulate market prices; in the presence of historical prices, a multivariate empirical (MVE) probability distribution is used [
90]. When used as an alternative input, the GRKS distribution assigns a piecewise normal distribution with 50% of the density below the midpoint and 50% above the midpoint using three parameters (minimum, midpoint, and maximum) developed by Gray–Richardson–Klose–Schuman [
90].
Planting area multiplied by per-hectare costs for seed, fertilizer, chemicals, weeding, irrigation, land preparation, harvesting, and other cash costs yield the variable cash costs of crop production. Annual inflation rates are used to inflate fixed costs. In the year prior, interest costs for land and machinery loans were added to fixed costs for convenience and interest for cash flow deficit loans. Interest is charged on the total cash cost of variable crop and livestock costs [
93].
This model does not use econometric equations, because all simulated variables are calculated as identities according to standard accounting practices.
11.4. Livestock Model
Livestock production and herd dynamics are modeled in the livestock component of FARMSIM. It includes much information about cattle because this component is the most challenging to understand. Similar models can be found in other livestock industries [
24]. The number of cattle consumed and the number of cattle that die are determined by dividing the total number of cattle on January 1 by the relevant consumption and death fractions [
90]. Endogenous variables, such as the number of cattle sold and bought each year, are used to maintain the number of cows in the herd.
Livestock farming is plagued by several issues, one of which is a risk. The livestock industry accounts for the risk by drawing random values for birth rates, death rates, and prices every year. Each age group of livestock is simulated for death rates: yearling calves, two-year-old heifers, three-year-old heifers, mature cows, and bulls. Profits from selling (culling) animals at various ages can be calculated using simulated stochastic prices for each cohort. Stochastic milk production is used to model the milk production of each mature cow in the herd [
84].
Calves born each year are calculated as the product of how many mature cows there were on January 1, the stochastic annual calving rate, and the number of calves born each year. Half of the calves are considered to be heifers, and the other half are assumed to be bulls. Calves that are consumed by the family, die, or sold reduce the number of calves born, resulting in fewer yearling heifers and bulls on the last day of the year. Calves classified as bulls or heifers have different calving rates, consumption patterns, and market values. Bull calves can be sold or kept, depending on the model’s preference to raise oxen on the farm [
91].
Heifers aged 12–24 months on December 31 equal the number of 12-month-old heifers on January 1 minus the number consumed, killed, and put down. Replacement heifers of 25–36 months old are dynamically simulated using the same procedure. Calves born to replacement heifers are introduced to the herd once they reach the age of 40–48 months old, when they are assumed to be ready to breed again [
83].
In many ways, the dynamics of an ox herd are like those of a dairy herd. Fewer oxen will be on a farm on January 1 because some will have died or been eaten or culled (sold). Oxen raised or purchased to maintain the desired herd size are counted toward the inventory of oxen at the end of the year.
Stochastic milk per cow is multiplied by the number of lactating cows to calculate milk production. Each year, the number of lactating cows equals the number of cows that have given birth. GRKS distributions that are paramaterized by expert opinion can simulate milk production per cow, supplemented by forage production adjustments. When forage production is low (high), stochastic milk per cow is lower (higher). That year’s milk yield will be impacted, but the stochastic fertility rate will also be reduced. Because fewer lactating cows are available in the second year after a drought, milk production will be reduced for two years [
84].
Family milk consumption is a small percentage of total milk production. Milk that is not consumed or used to make butter is auctioned. The stochastic prices for the various age categories, the number of sold cattle, and the receipts for milk, butter, hides, and manure are used to calculate the receipts for cattle. Assuming that only male calves are offered for sale, the receipts for the sale of hides are calculated by multiplying the hide’s price by the number of cattle and oxen killed or consumed.
To arrive at manure receipts, it is necessary to add up the amount of manure produced by all animals, including replacements, calves, and oxen.
For the cattle herd’s cash costs, heads on December 31 are multiplied by the total annual cash costs for the cows, calves, two-year-olds, and three-year-olds. Each year, the assumed inflation rates increase the annual cash costs. The livestock model has the same level of detail for simulating herd dynamics, receipts, and costs for sheep as cattle. Like other livestock, the production, consumption, and sale of eggs affect the flock dynamics of hens.
11.5. Financial Model
The financial model comprises an income statement, a cash flow statement, and a balance sheet. It is possible to see where the yearly revenue comes from by looking at the income statements for various farm animals and crops. Annual cash expenses from crops and livestock, plus fixed costs and interest costs, are summarized in the income statement. Total cash receipts minus total cash expenses equal annual net cash income [
94].
Cash inflows, cash outflows, and ending cash reserves are calculated. Cash inflows equal the sum of beginning cash, net cash income, off-farm income, and interest earned for cash reserves. Cash outflows equal the sum of cash purchases of food, school expenses, family living expenses, income taxes, principal payments, and repayment of cash flow deficits in the previous year [
90].
Ending cash reserves on 31 December equal total cash inflows minus total cash outflows. This is a Key Operational Variable (KOV) for determining the effects of adopting new technology [
24].
Farm assets and liabilities are summarized on the balance sheet. Annual assets equal the value of land, livestock, machinery, and positive cash reserves. Annual liabilities equal remaining debt for initial loans, new debts, and negative cash reserves. Assets minus liabilities are needed to calculate the net worth.
The net present value for the farm family equals the present value of annual family withdrawals, the value of crops and livestock consumed, and the present value of the ending net worth minus the beginning net worth. A 10% discount rate is applied to the net present value. FARMSIM also has the internal rate of return (IRR) and the benefit–cost ratio (BCR), which are related to net present value. The IRR is defined as the discount rate that causes the NPV to be zero. The benefit–cost ratio, or BCR, measures how much a project will earn in the long term compared to how much it will cost in the present. If the ratio is significant, the business or project is profitable. If the benefits’ discounted present value exceeds the cost’s discounted present value, then the project is worthwhile, like the NPV criteria condition [
90].
11.6. Outline Probabilities
The risks associated with the base and alternative scenarios were compared using several metrics. Counting the iterations in which net cash farm income was positive and dividing by 500 (the number of iterations) yielded the probability of a positive net cash farm income. The probability of a positive net cash income was calculated to determine whether the farm will make money in any given year. Similar calculations were included in calculating the probability that annual ending cash was positive, the probability that NPV was positive, which is the probability of economic success, and the probability that the farm increased actual net worth.
12. Scenario Analysis
12.1. Crop Production Scenarios
After entering data into FARMSIM, the baseline and alternative scenarios were simulated for the same timeframe. For each input variable, we provided information for the current (baseline scenario) and alternative farming system (an alternative scenario). The model is designed to accept complete data sets for the baseline and 21 alternative scenarios. Because of the shortage of surface water and the importance of irrigation to agriculture and livestock production in Iraq, we conducted a study on the use of solar irrigation systems in Yusufiya, a city in the south of Baghdad [
94]. Among the components of the scenario analysis were an assessment of water-pumping technologies and fertilizer application scenarios. Most water used for irrigation in the area is groundwater from wells. The motors and solar pumps were evaluated for their capacity and affordability.
Cucumber is the principal crop in Quirish; in this study, we parameterized the model to be consistent with the cucumber cropping system in Quirish and simulated a period of three years with two growing seasons each. In addition to cucumbers, tomatoes, peppers, and barley were also examined in the model. Assuming that there is no difference in how the crops are watered, the main difference in yield between the baseline and alternative scenarios was expected to come from how fertilizer was used and how the water was treated.
Traditional fertilizer (NPK) application rates for cucumbers, tomatoes, peppers, and barley were used in the baseline scenario, while nanoparticle fertilizers (NPF) were used in three alternative scenarios. Notice that the increase in yield from the alternative scenarios for cucumber was mainly due to the application of NPF in the study area. However, the household relied on previously stored seeds (except for cucumber in all scenarios) and used minimal chemicals, as revealed by the research. It was also noted that the farm labor hiring for agricultural production in the baseline scenario was low, since family members performed some of the agricultural tasks and alternative scenarios. The five scenarios under study are summarized below:
Baseline: All Traditional (Traditional Irrigation System and Traditional Fertilizers).
Alternative 1: TR Water System with Nanoparticle Fertilizers.
Alternative 2: Solar Irrigation System with TR Fertilizers.
Alternative 3: All RE (Solar Irrigation System with Nanoparticle Fertilizers).
Alternative 4: All RE with Carefree Water Conditioner.
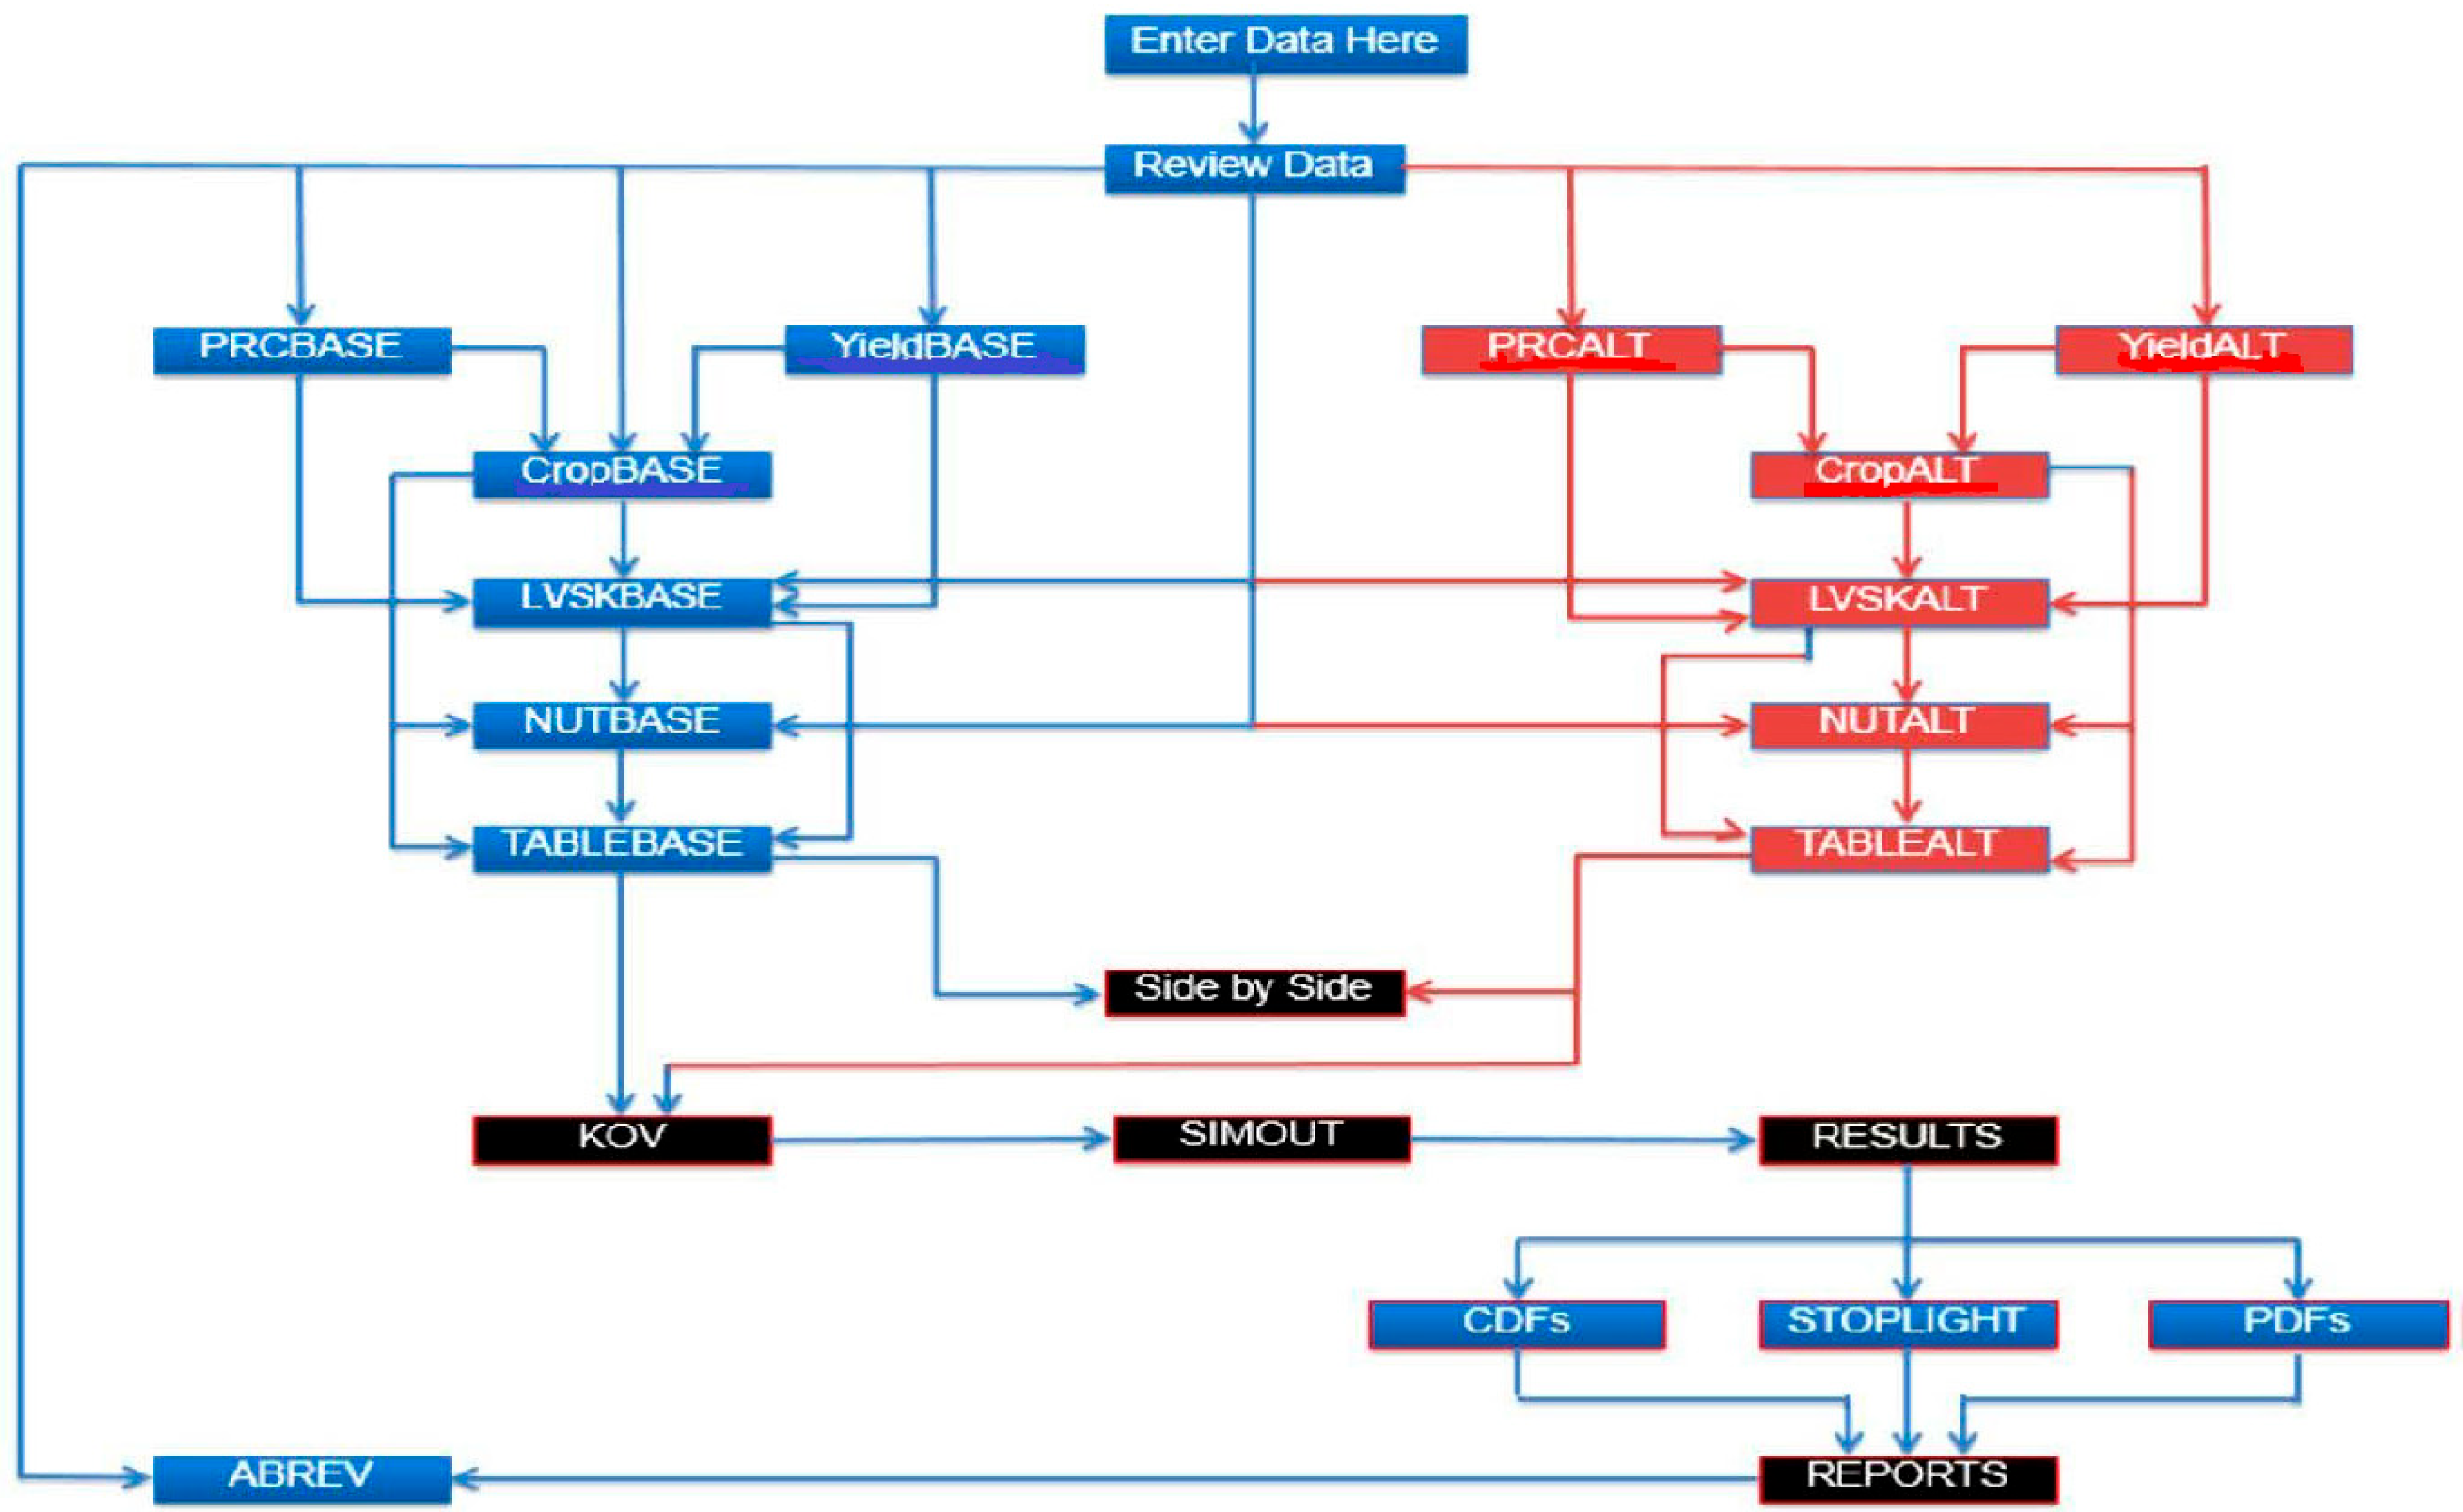
Abbreviations and meaning of different worksheets in FARMSIM [
24] (
Figure 6):
YIELDBASE: stochastic yield worksheet in baseline scenario
PRCBASE: price worksheet in baseline scenario
Crop BASE: crop worksheet in baseline scenario
LVSKBASE: livestock worksheet in baseline scenario
TABLEBASE: table worksheet in baseline scenario
Note: same meaning of the above worksheets applies to the alternative scenarios (CropALT …)
KOV: key output variable
SIMOUT: simulation output
Figure 6.
FARMSIM Flowchart (Excel Worksheet Organization) [
24].
Figure 6.
FARMSIM Flowchart (Excel Worksheet Organization) [
24].
12.2. Scenario Ranking
Utility-based methods were used to rank the various alternative scenarios in addition to profitability evaluations.
The mean, standard deviation, and coefficient of variation are just a few metrics that can be used to gauge the degree of risk associated with various scenarios. While some of these approaches take risk into account, they are not strong enough to rank scenarios without unambiguously taking the decision maker’s risk preference into account. This means that utility-based ranking methods are better for the decision-maker when comparing alternative farming scenarios.
SIMETAR incorporates four utility-based ranking functions that the FARMSIM model can utilize to order various farming scenarios: Meyer’s Stochastic Dominance concerning a Function (SDRF), Certainty Equivalent (CE), Stochastic Efficiency for a Function (SERF), and Risk Premiums (RP). We chose SERF because of its many advantages over alternative approaches when determining the riskiest options. When Hardaker et al. (2004) [
92] combined the use of CE and Meyer’s range of risk-adjustment coefficients (SERF) to rank risky alternatives, they created the stochastic efficiency (SERF) method. SERF looks at CEs with a risk-aversion utility function of U (r
1(z), r
2(z)) and then compares them to an LRAC (lower risk-aversion coefficient) or a URAC (upper risk-aversion coefficient) [
90]. Risk-averse individuals may have an LRAC greater than zero, while risk-neutral individuals may have an LRAC equal to 0. All risky alternative scenarios are ranked according to their CE, and the SERF approach uses the highest CE value for each RAC to choose the most preferred scenario. The CE results are summarized in a chart for each RAC value [
93].
13. Results and Discussion
FARMSIM was used to simulate and forecast five years of RE technology adoption in agriculture in Quirish, south of Baghdad. To compare the scenarios in terms of their financial outcomes, the CDF, PDF, and Stoplight charts illustrate the results.
13.1. Net Present Value (NPV)
The NPV (Net Present Value) is a crucial indicator of whether an investment or project will be profitable over a specific period. The cumulative distribution function (CDF) of the results of the NPV simulation showed the value of using RE technology. Cucumbers irrigated with solar irrigation and the Carefree Water Conditioner (Alt. 4) performed better than expected when fertilized with nanoparticle fertilizers. The CDF values for all 500 simulation runs were left of the baseline scenario. The All RE with Carefree Water Conditioner scenario (Alt. 4) had the highest NPV values at all probability levels.
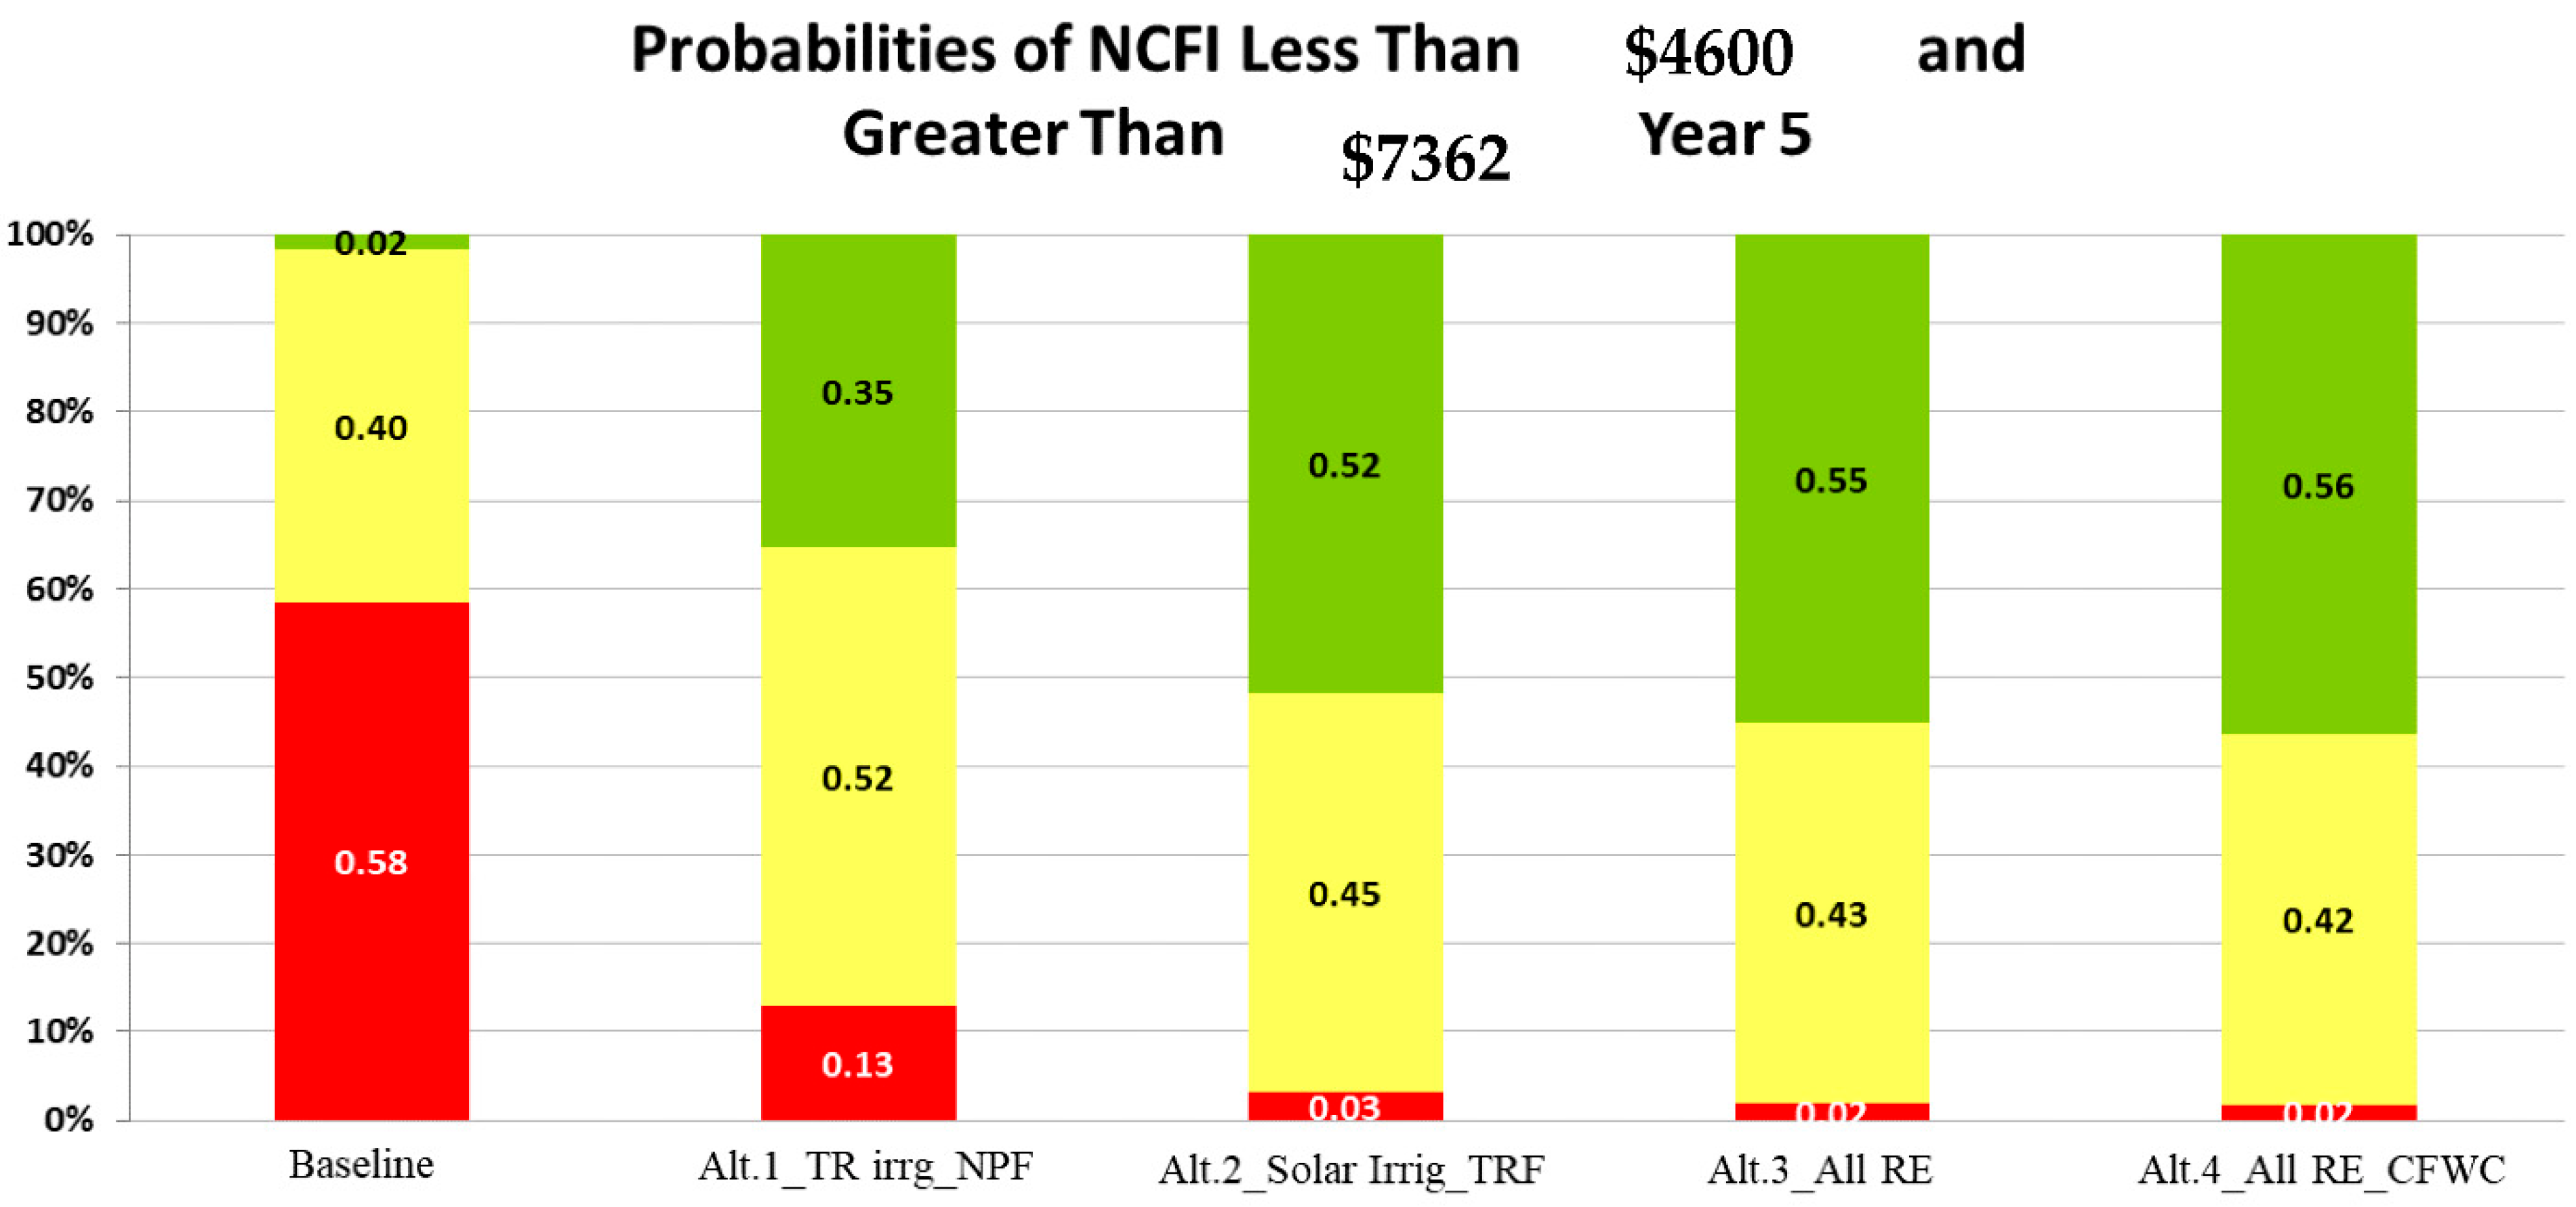
13.2. Net Cash Farm Income (NCFI)
The annual NCFI calculates the farm’s baseline and alternative profit scenarios. At each probability level, the All RE with Carefree Water Conditioner scenario (Alt. 4) produced the highest NCFI, followed by the All RE scenario (Solar Irrigation System with Nanoparticle Fertilizers), the Solar Irrigation System with TR Fertilizers scenario, and the TR Water System with Nanoparticle Fertilizers scenario (Alts. 3, 2, and 1).
Figure 7 shows the probability of NCFI being less than
$4600 (red), greater than
$7362 (green), and in the middle of the two target values (yellow) in year five on the Stoplight chart. The lower bound is the average NCFI of the worst-performing scenario (baseline scenario), and the upper bound is the best-performing alternative scenario (Alt. 4). According to the NCFI simulation results (
Figure 7), there is a 58% chance of NCFI being less than
$4600 and a 2% chance of NCFI being more than
$7362 for a typical farm or household in the baseline scenario. In contrast, the annual NCFI for the All RE with Carefree Water Conditioner scenario (Alt. 4) has a 56% chance of exceeding
$7362, a 42% chance of falling between
$4600 and
$7362, and a 2% chance of falling below
$4600. All three alternative scenarios (Alts. 1, 2, and 3) did better than the base scenario and made more money. There was a 47% chance of exceeding
$7362, a 47% chance of falling between
$4600 and
$7362, and a 6% chance of falling below
$4600.
Considering the higher NPV and profit, the values from alternative scenarios are linked to the expansion of irrigated land and increased crop and livestock product production and sales.
13.3. Benefit–Cost Ratio (B/CR) and Internal Rate of Return (IRR)
Even though alternative RE farming technologies may generate the most income and profit, they may not have the highest economic return on investment. For this reason, the BCR and IRR were used to evaluate the economic feasibility of the various alternative technologies.
If the BCR was >1 and the IRR was greater than the discount rate (>0.10%), any alternative scenario in the study was deemed viable and profitable compared to the baseline scenario (both metrics are based on the present value of the difference). The All RE scenario (Solar Irrigation System with Nanoparticle Fertilizers), with an average BCR value of (19.51), had the highest BCR values of the four scenarios examined in
Table 2. The TR Water System with Nanoparticle Fertilizers scenario and the All RE with Carefree Water Conditioner scenario had the same BCR value of 19.44. Note that the Solar Irrigation System with TR Fertilizers scenario had the lowest BCR value (9.75) among the alternatives.
This outcome is partly explained by the investment costs (RE technology use), which were higher for Alt. 1 and Alt. 4 and lower for Alt. 2 than the benefits from using RE. Although the TR Water System with Nanoparticle Fertilizers had the lowest net profit, its BCR value was ranked first, alongside the All RE with Carefree Water Conditioner scenario. A similar outcome was observed in the IRR, with the TR Water System with Nanoparticle Fertilizers scenario showing a higher investment return. The All RE with Carefree Water Conditioner scenario had an average IRR of 5.09, which is higher than the other alternative scenarios (Alt. 3 average IRR of 5.06). The Solar Irrigation System with TR Fertilizers scenario had the lowest return on investment, at 2.47.
13.4. Baseline and Alternative Scenarios Ranking
Deciding among risky alternatives can be challenging. Decision-makers rank risky alternatives based on their income and risk utility. Utility is the best metric for ranking situations. However, many ranking procedures (such as the mean, standard deviation, PDF, CDFs, and coefficient of variation) ignore utility altogether [
24].
Because of its many benefits over alternative ranking methods, we employed SERF to determine the most desirable risky situation.
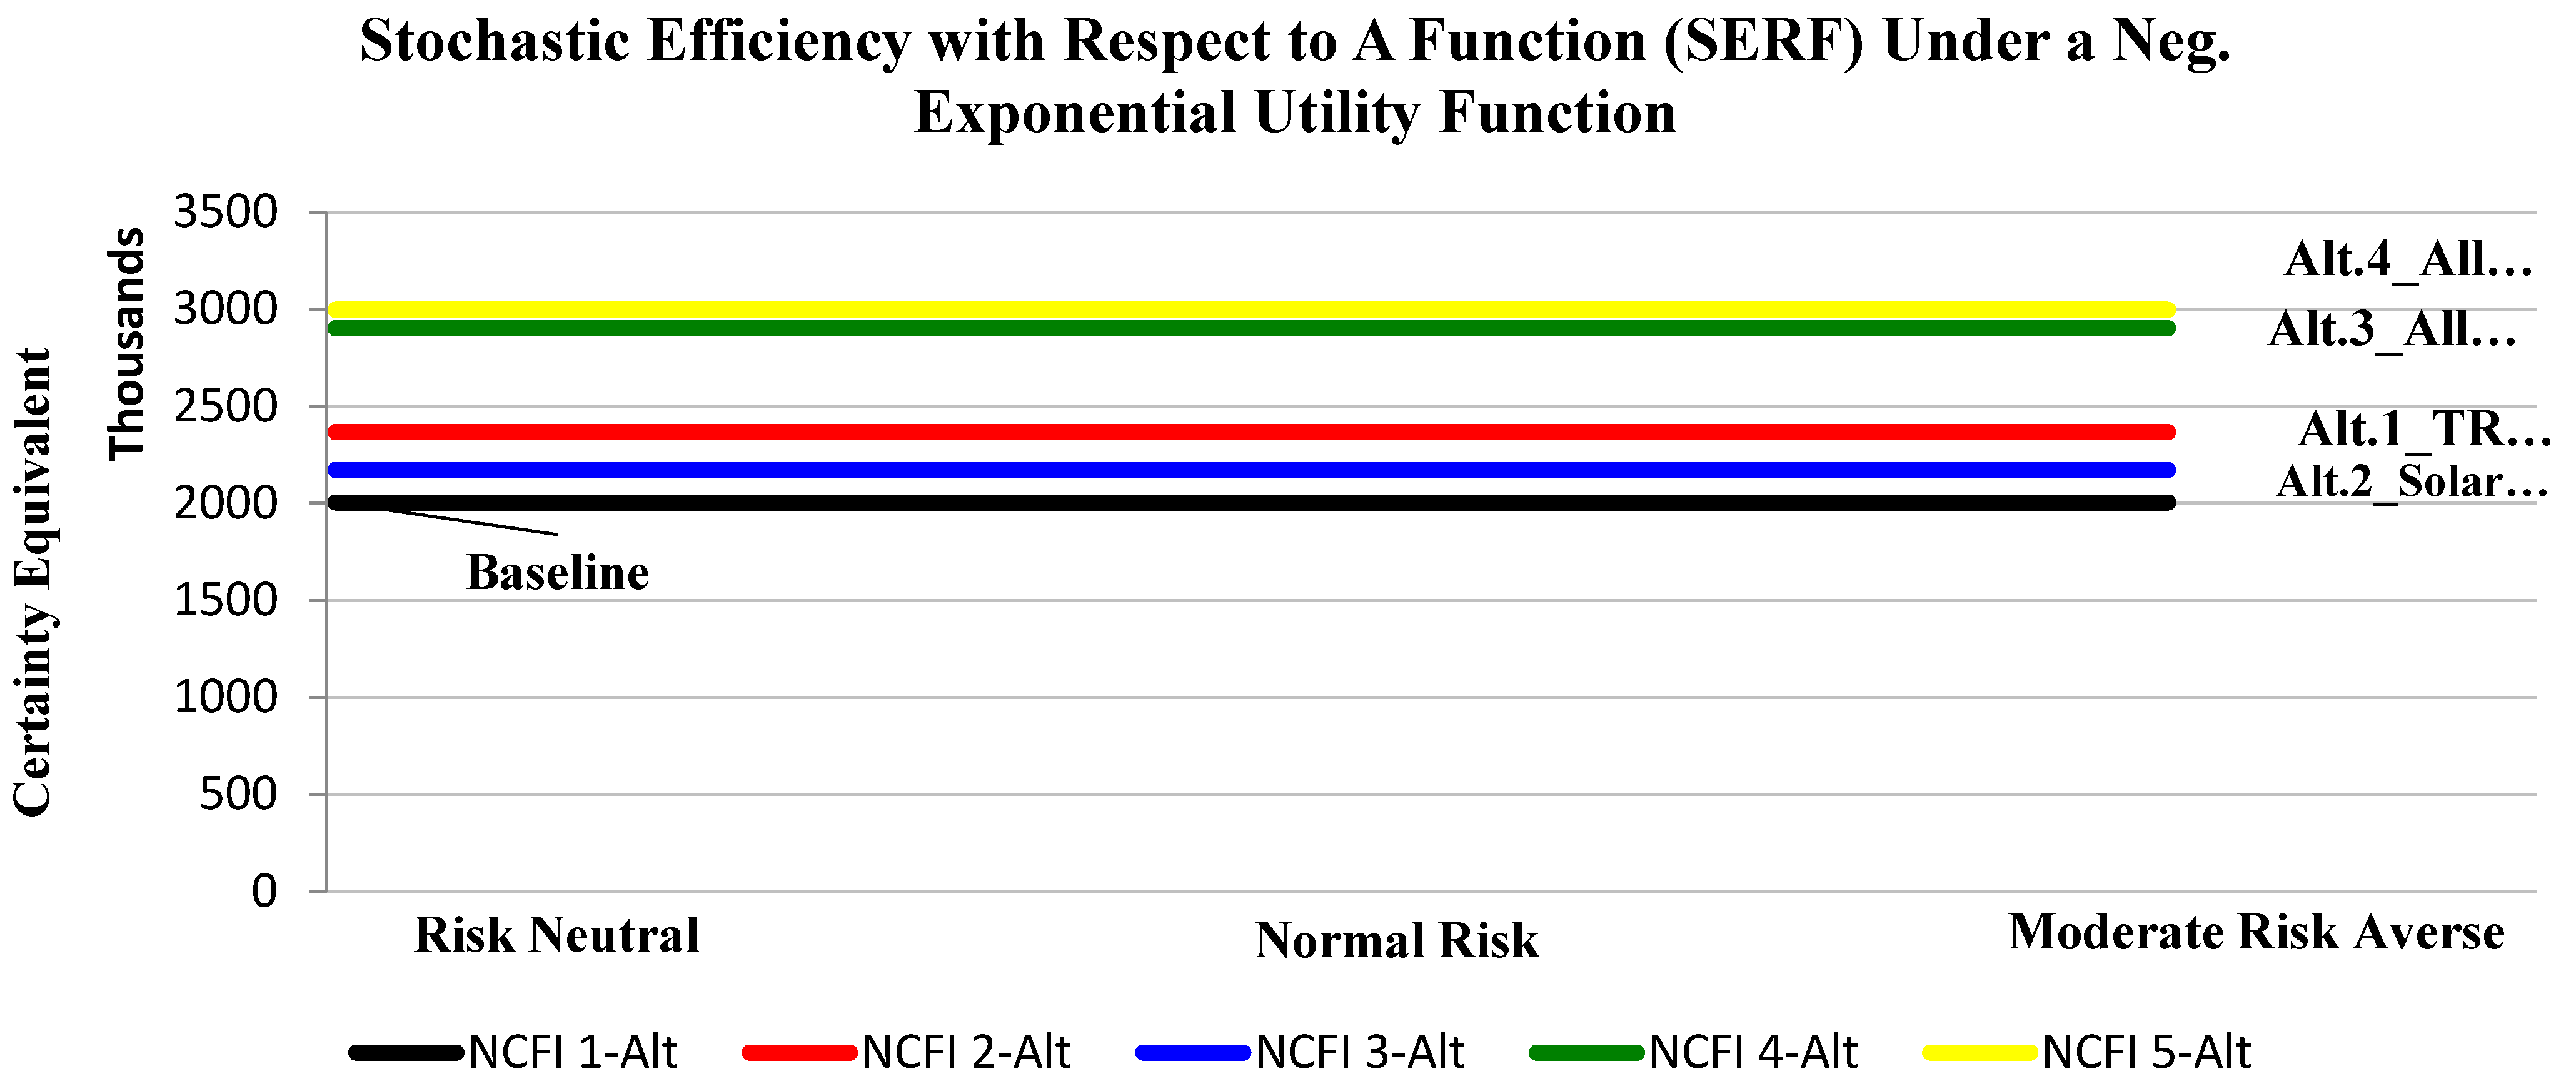
This study assigned a ranking to each of the five scenarios, including the baseline and four alternative scenarios, based on the simulation outcomes for NCFI in year 3.
Figure 8 shows that the All RE with Carefree Water Conditioner scenario (Alt. 4) is the most desirable scenario across all risk aversion degrees, ranging from 0 to 0.00025.
Alternative 4 is the best choice because the confidence equivalence values at all levels are much higher than those of the other options. The ranking of the scenarios continues with the All RE (Solar Irrigation System with Nanoparticle Fertilizers) and TR Water System with Nanoparticle Fertilizers scenarios (Alts. 3 and 1), which are ranked slightly higher than the Solar Irrigation System with TR Fertilizers scenario. All of these scenarios involve using nanoparticle fertilizers (Alt. 2).
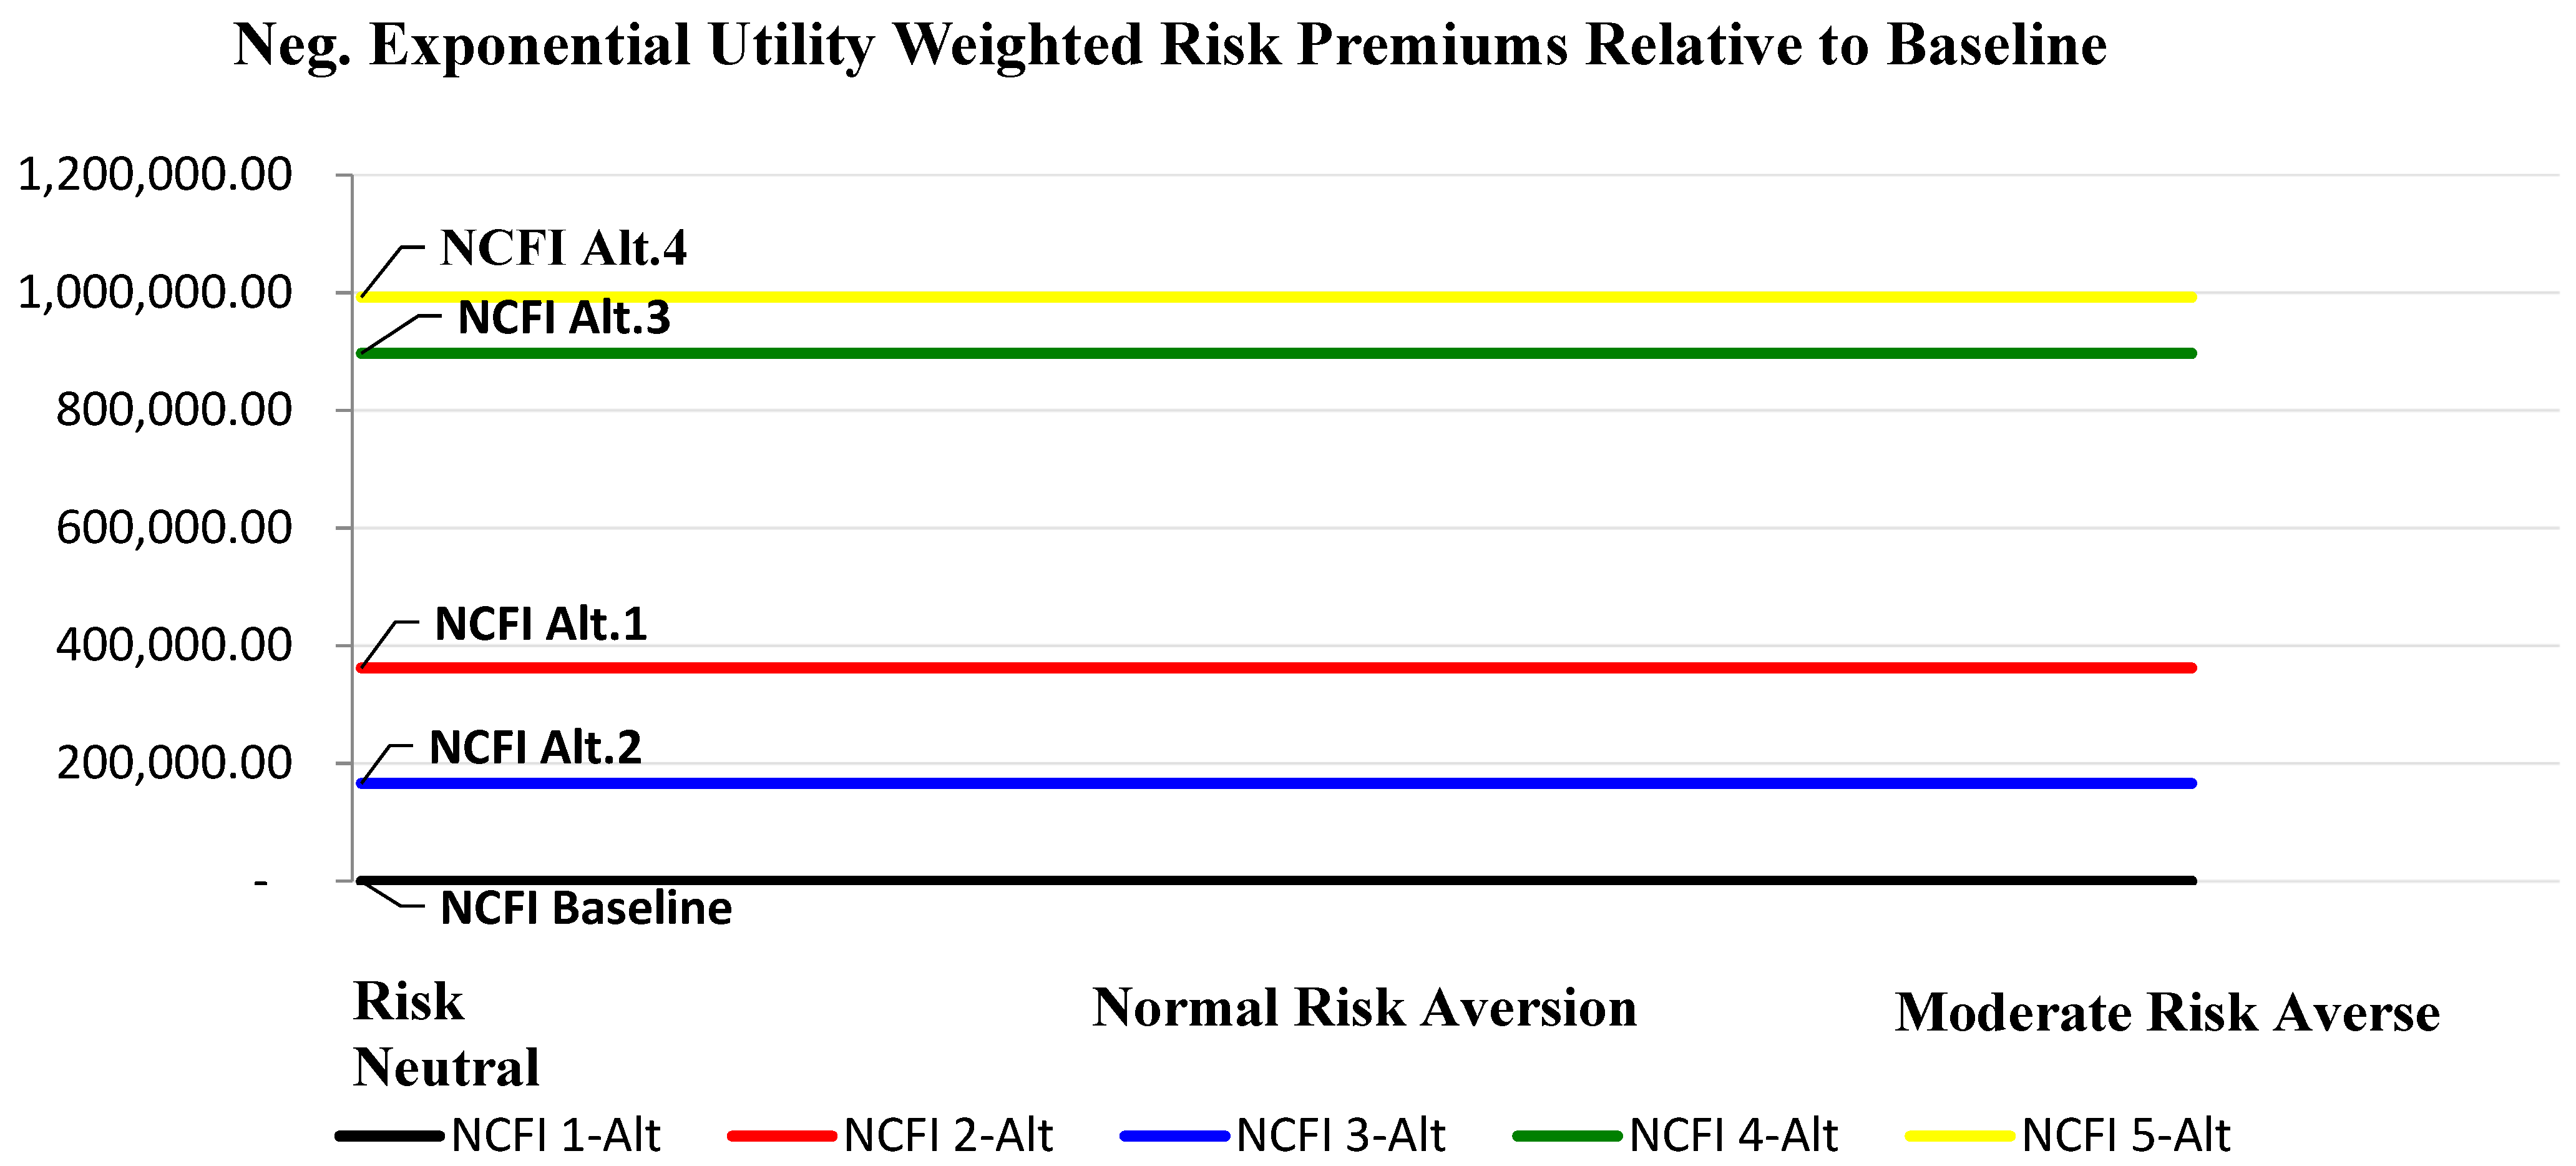
Risk premium (RP) charts can be generated in Simetar with the SERF option (
Figure 9). The chart illustrates, over a range of risk aversion levels, the premium that is placed on each risky scenario compared to the baseline scenario [
91]. If the range-based RP for an alternative scenario is more significant than zero, then that scenario is favored over the baseline. Contrarily, if the RP is hostile, the preferred scenario is the baseline one, not the alternate one. Moreover, the dissimilarity in RP indicates the amount of NCFI improvement that a decision maker should expect from implementing a higher-ranking alternative scenario instead of a baseline scenario. Alternative 4 in this study, the All RE with Carefree Water Conditioner scenario, had the highest risk premium compared to the other alternatives and the baseline. Scenario 4 (Alt. 3), All RE (Solar Irrigation System with Nanoparticle Fertilizers), had the next highest premium, (
Table 6).
14. Conclusions and Recommendations
This study aimed to assess the impacts of using renewable energy technologies in irrigation and nanoparticle fertilizers on agri-food production in the village of Quirish in the Al-Rasheed district in Baghdad.
A baseline scenario with traditional fertilizer application and irrigation was compared to four other scenarios that used nanoparticle fertilizers, solar irrigation systems, and a Carefree Water Conditioner on cucumber crops.
In the alternative scenarios, traditional fertilizer with a solar irrigation system was applied to grow cucumbers. The TR Water Irrigation System with NPF and All RE scenarios were applied in the irrigation system and NPF was used to grow cucumbers in both seasons, “fall and spring”, in 2019, 2020, and 2021. The All RE with CareFree Water Conditioner scenario was only run for 2020 and 2021.
The farm made the most money from the All RE with Carefree Water Conditioner scenario. The best-performing scenarios that followed were also All RE. The baseline scenario was the least preferred of all five scenarios analyzed. The cost–benefit analysis indicated that the All RE (Alt. 3) scenario had the highest return due to its low investment cost. Depending on the cost of the irrigation tool and the family’s socioeconomic status, they might choose between an All RE approach or RE with Carefree Water Conditioner approach. Both options are profitable but require different amounts of money to get started. Although solar technology is the most expensive of all these tools, it may be increasingly used in the future, given its environmental cleanness and low maintenance cost, instead of the motor pump, which has high maintenance costs and is less environmentally friendly.
Based on these results, renewable energy and nano-fertilizers are highly recommended for Iraqi agriculture due to their high quality and low cost. We also recommend providing farmers with guidance on using these technologies through the activation of agricultural extension via agricultural associations.
We recommend using Carefree Water Conditioners when freshwater is scarce, especially in dry seasons or for groundwater with high salinity levels.
The most important result of the study is that the government needs to help Iraqi farmers switch to solar pumps by subsidizing up to 50% of their costs for 15 years. This makes farming more profitable for the farmer and makes the national agricultural product more competitive. At the same time, the government can recoup its investment by raising fuel subsidies for agriculture to make up the difference.
Nano-fertilizers should be used on grain crops like wheat, barley, rice, and corn, and more research should be done to compare their economic viability to traditional fertilizers.


