
Managing Collaborative Risks of Integrated Open-Innovation and Hybrid Stage-Gate Model by Applying Social Network Analysis—A Case Study

 , ,
, ,
Abstract
:1. Introduction
2. Literature Review
2.1. Open Innovation
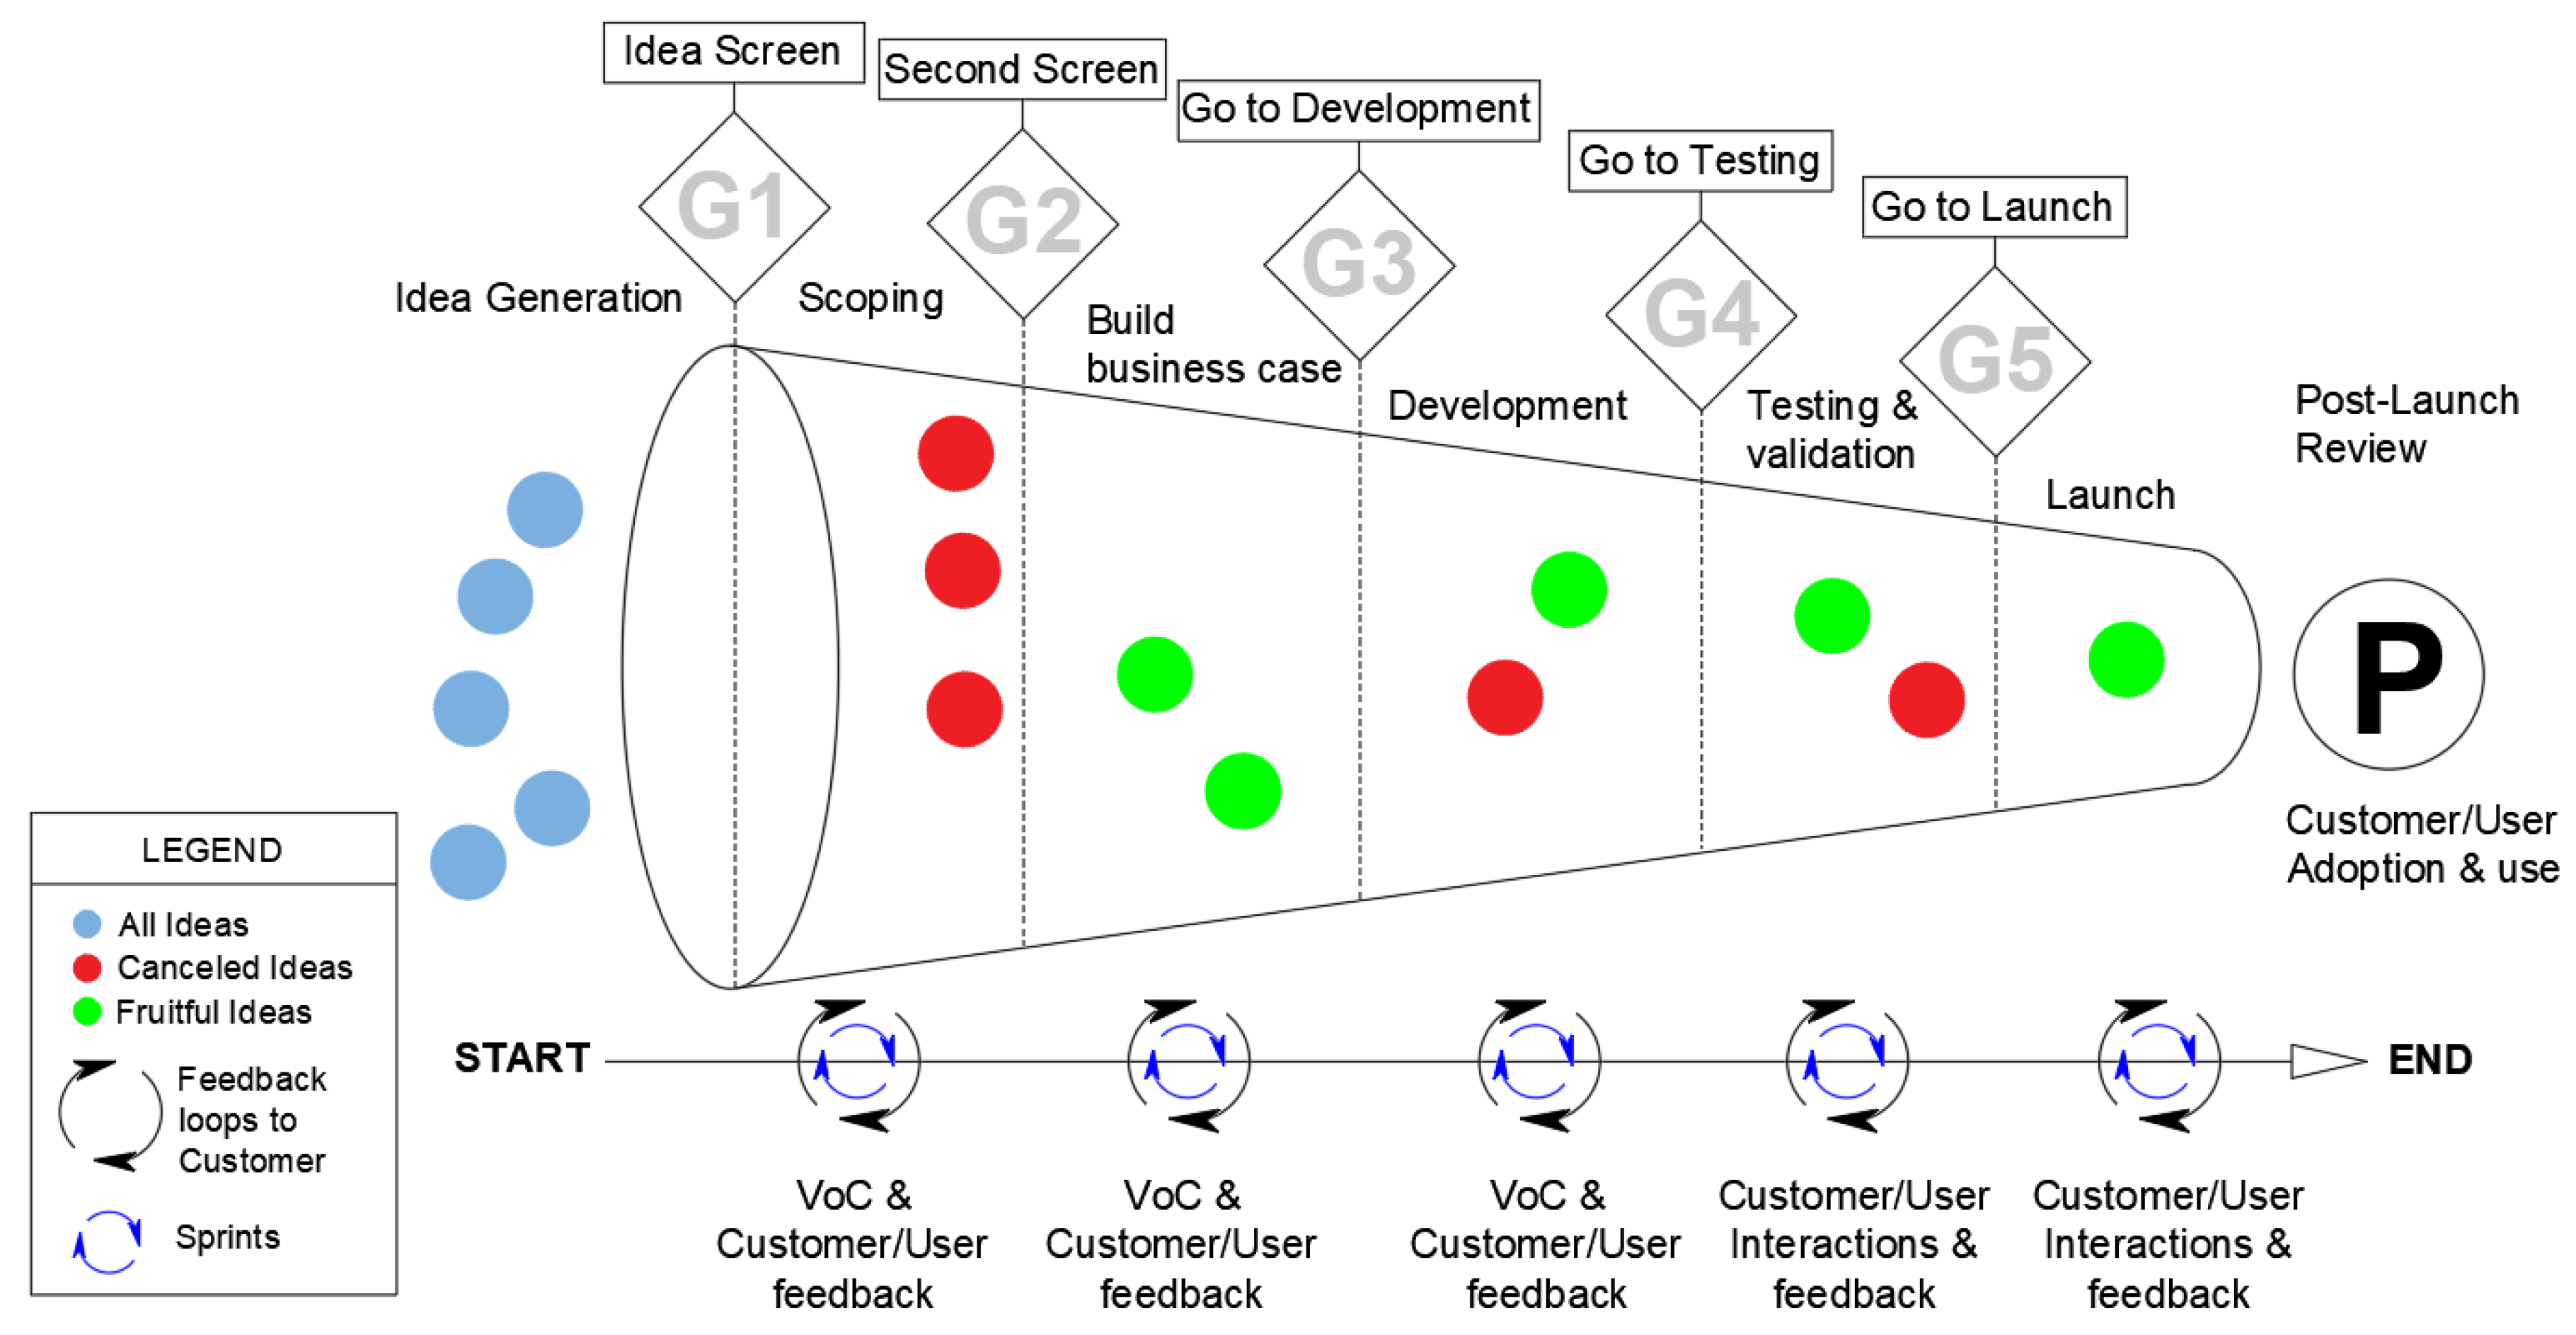
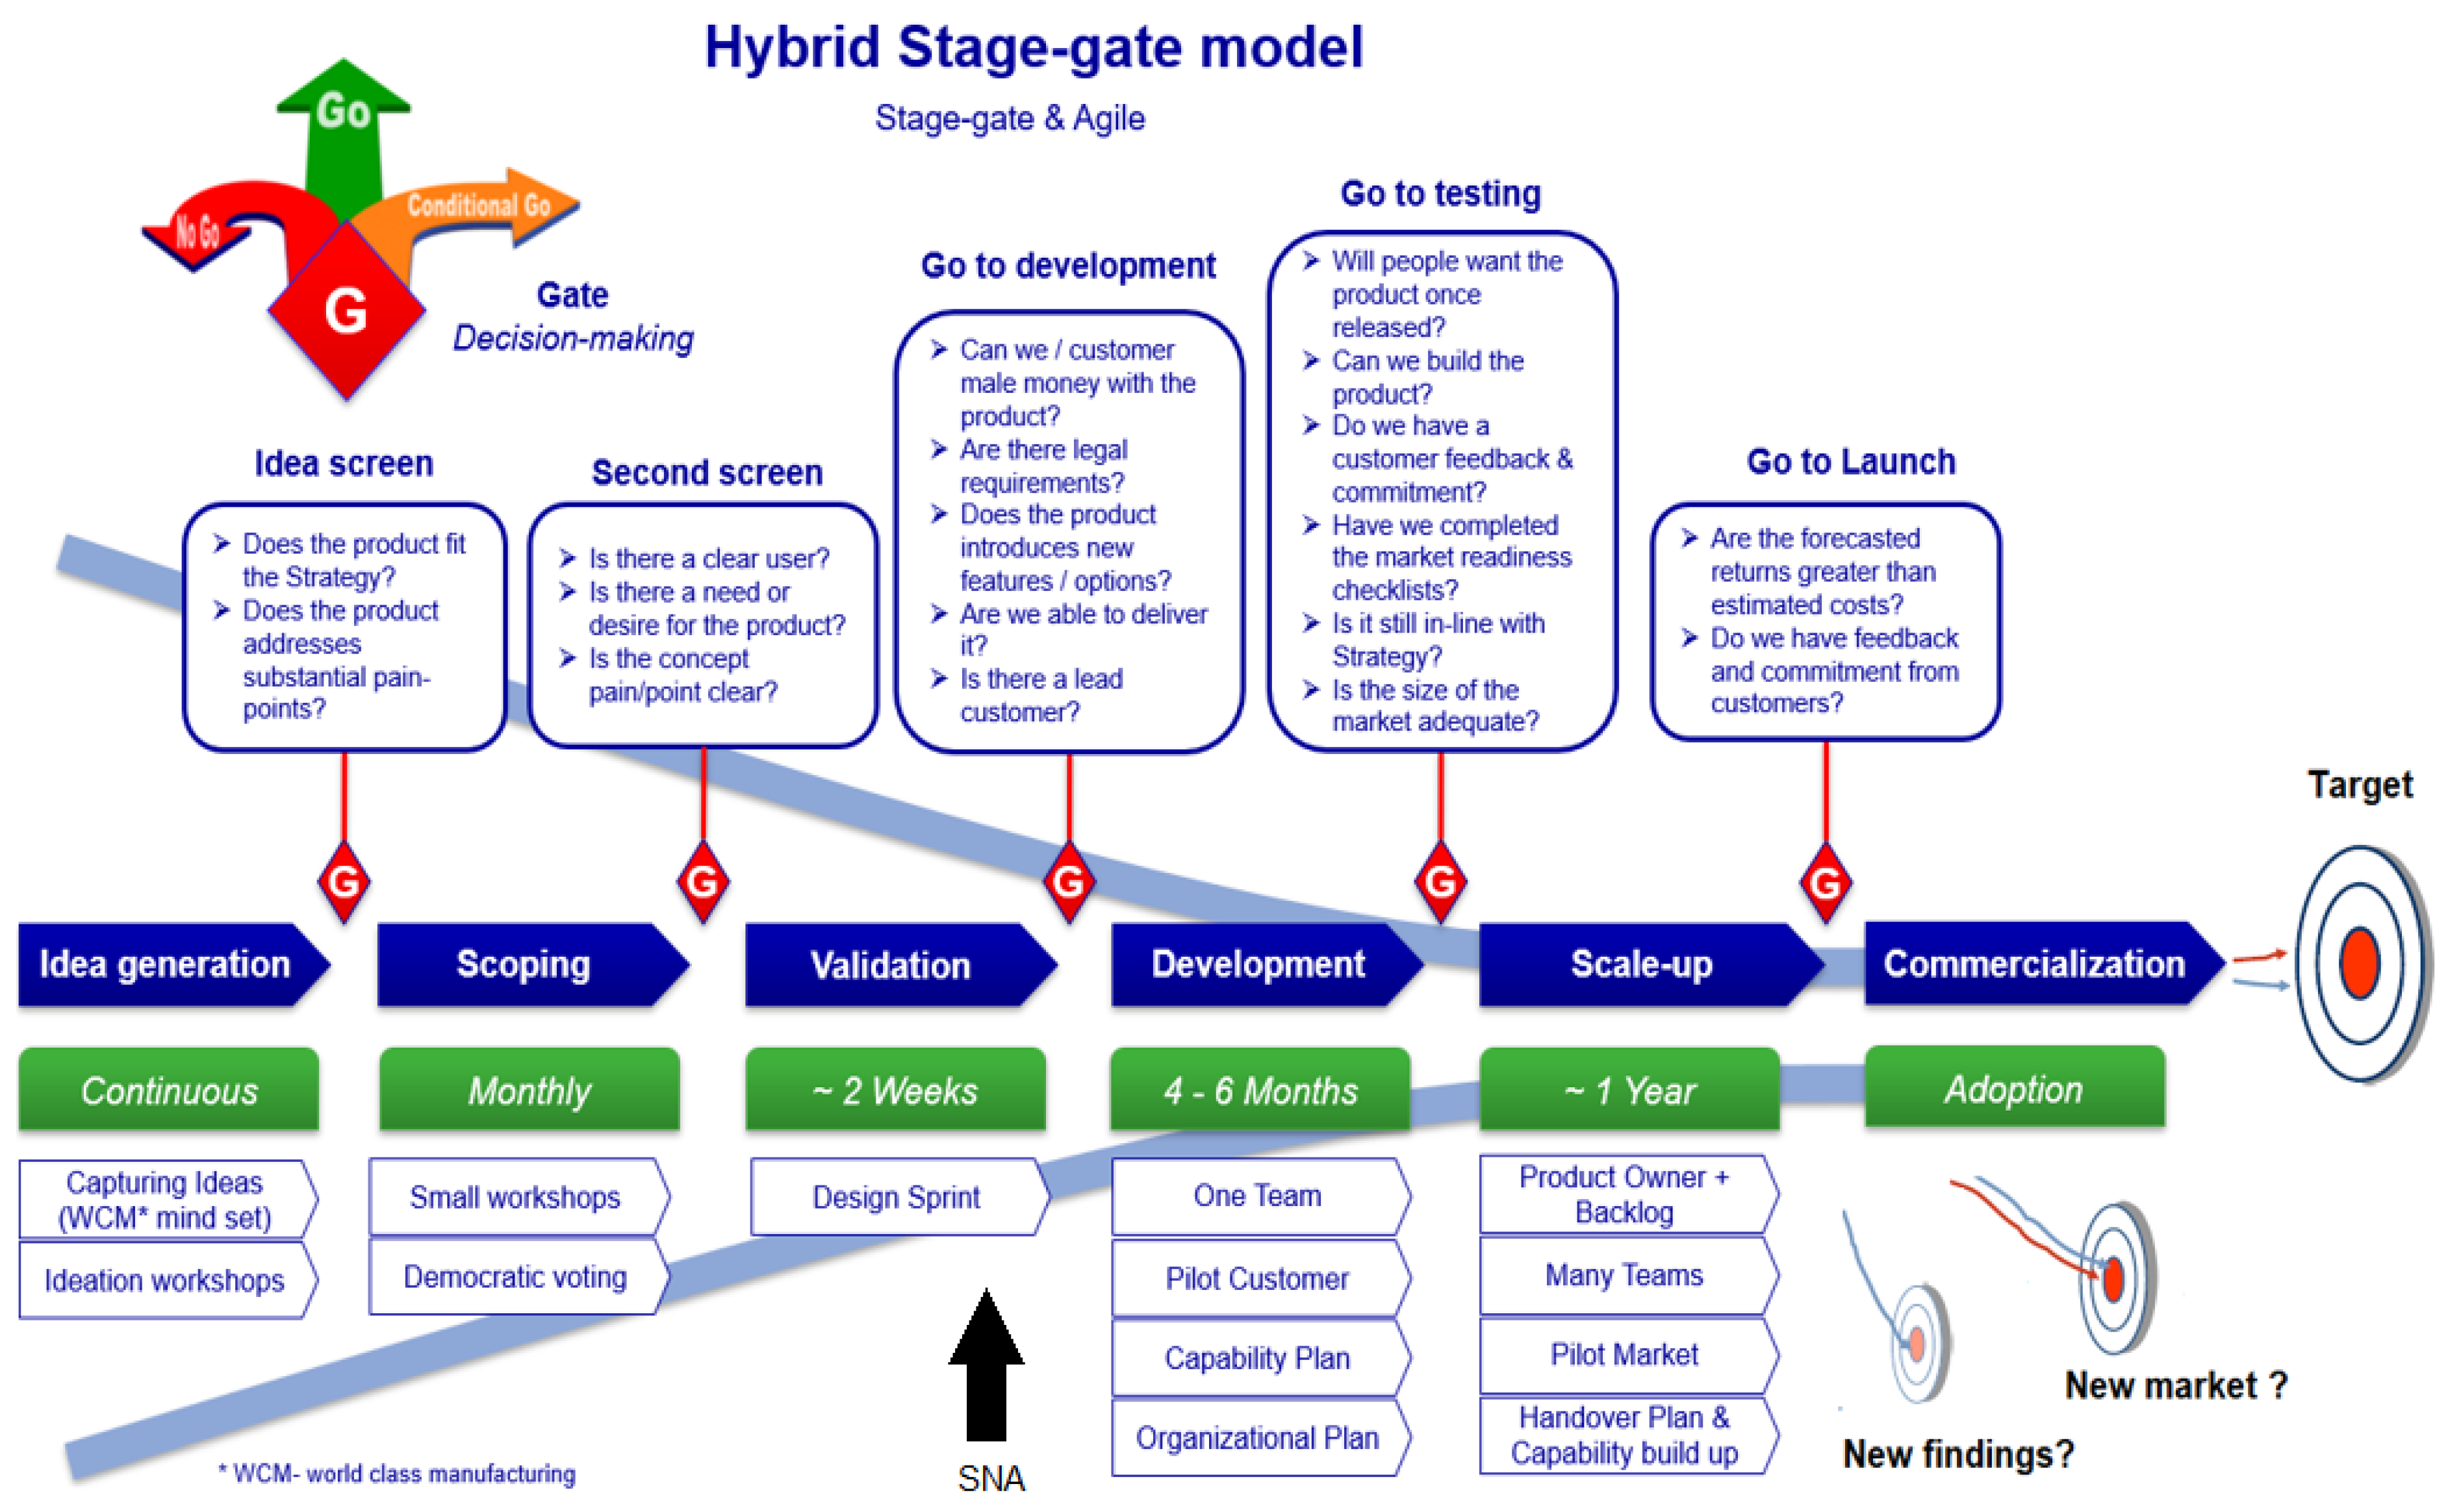
2.2. The Hybrid Stage-Gate Model
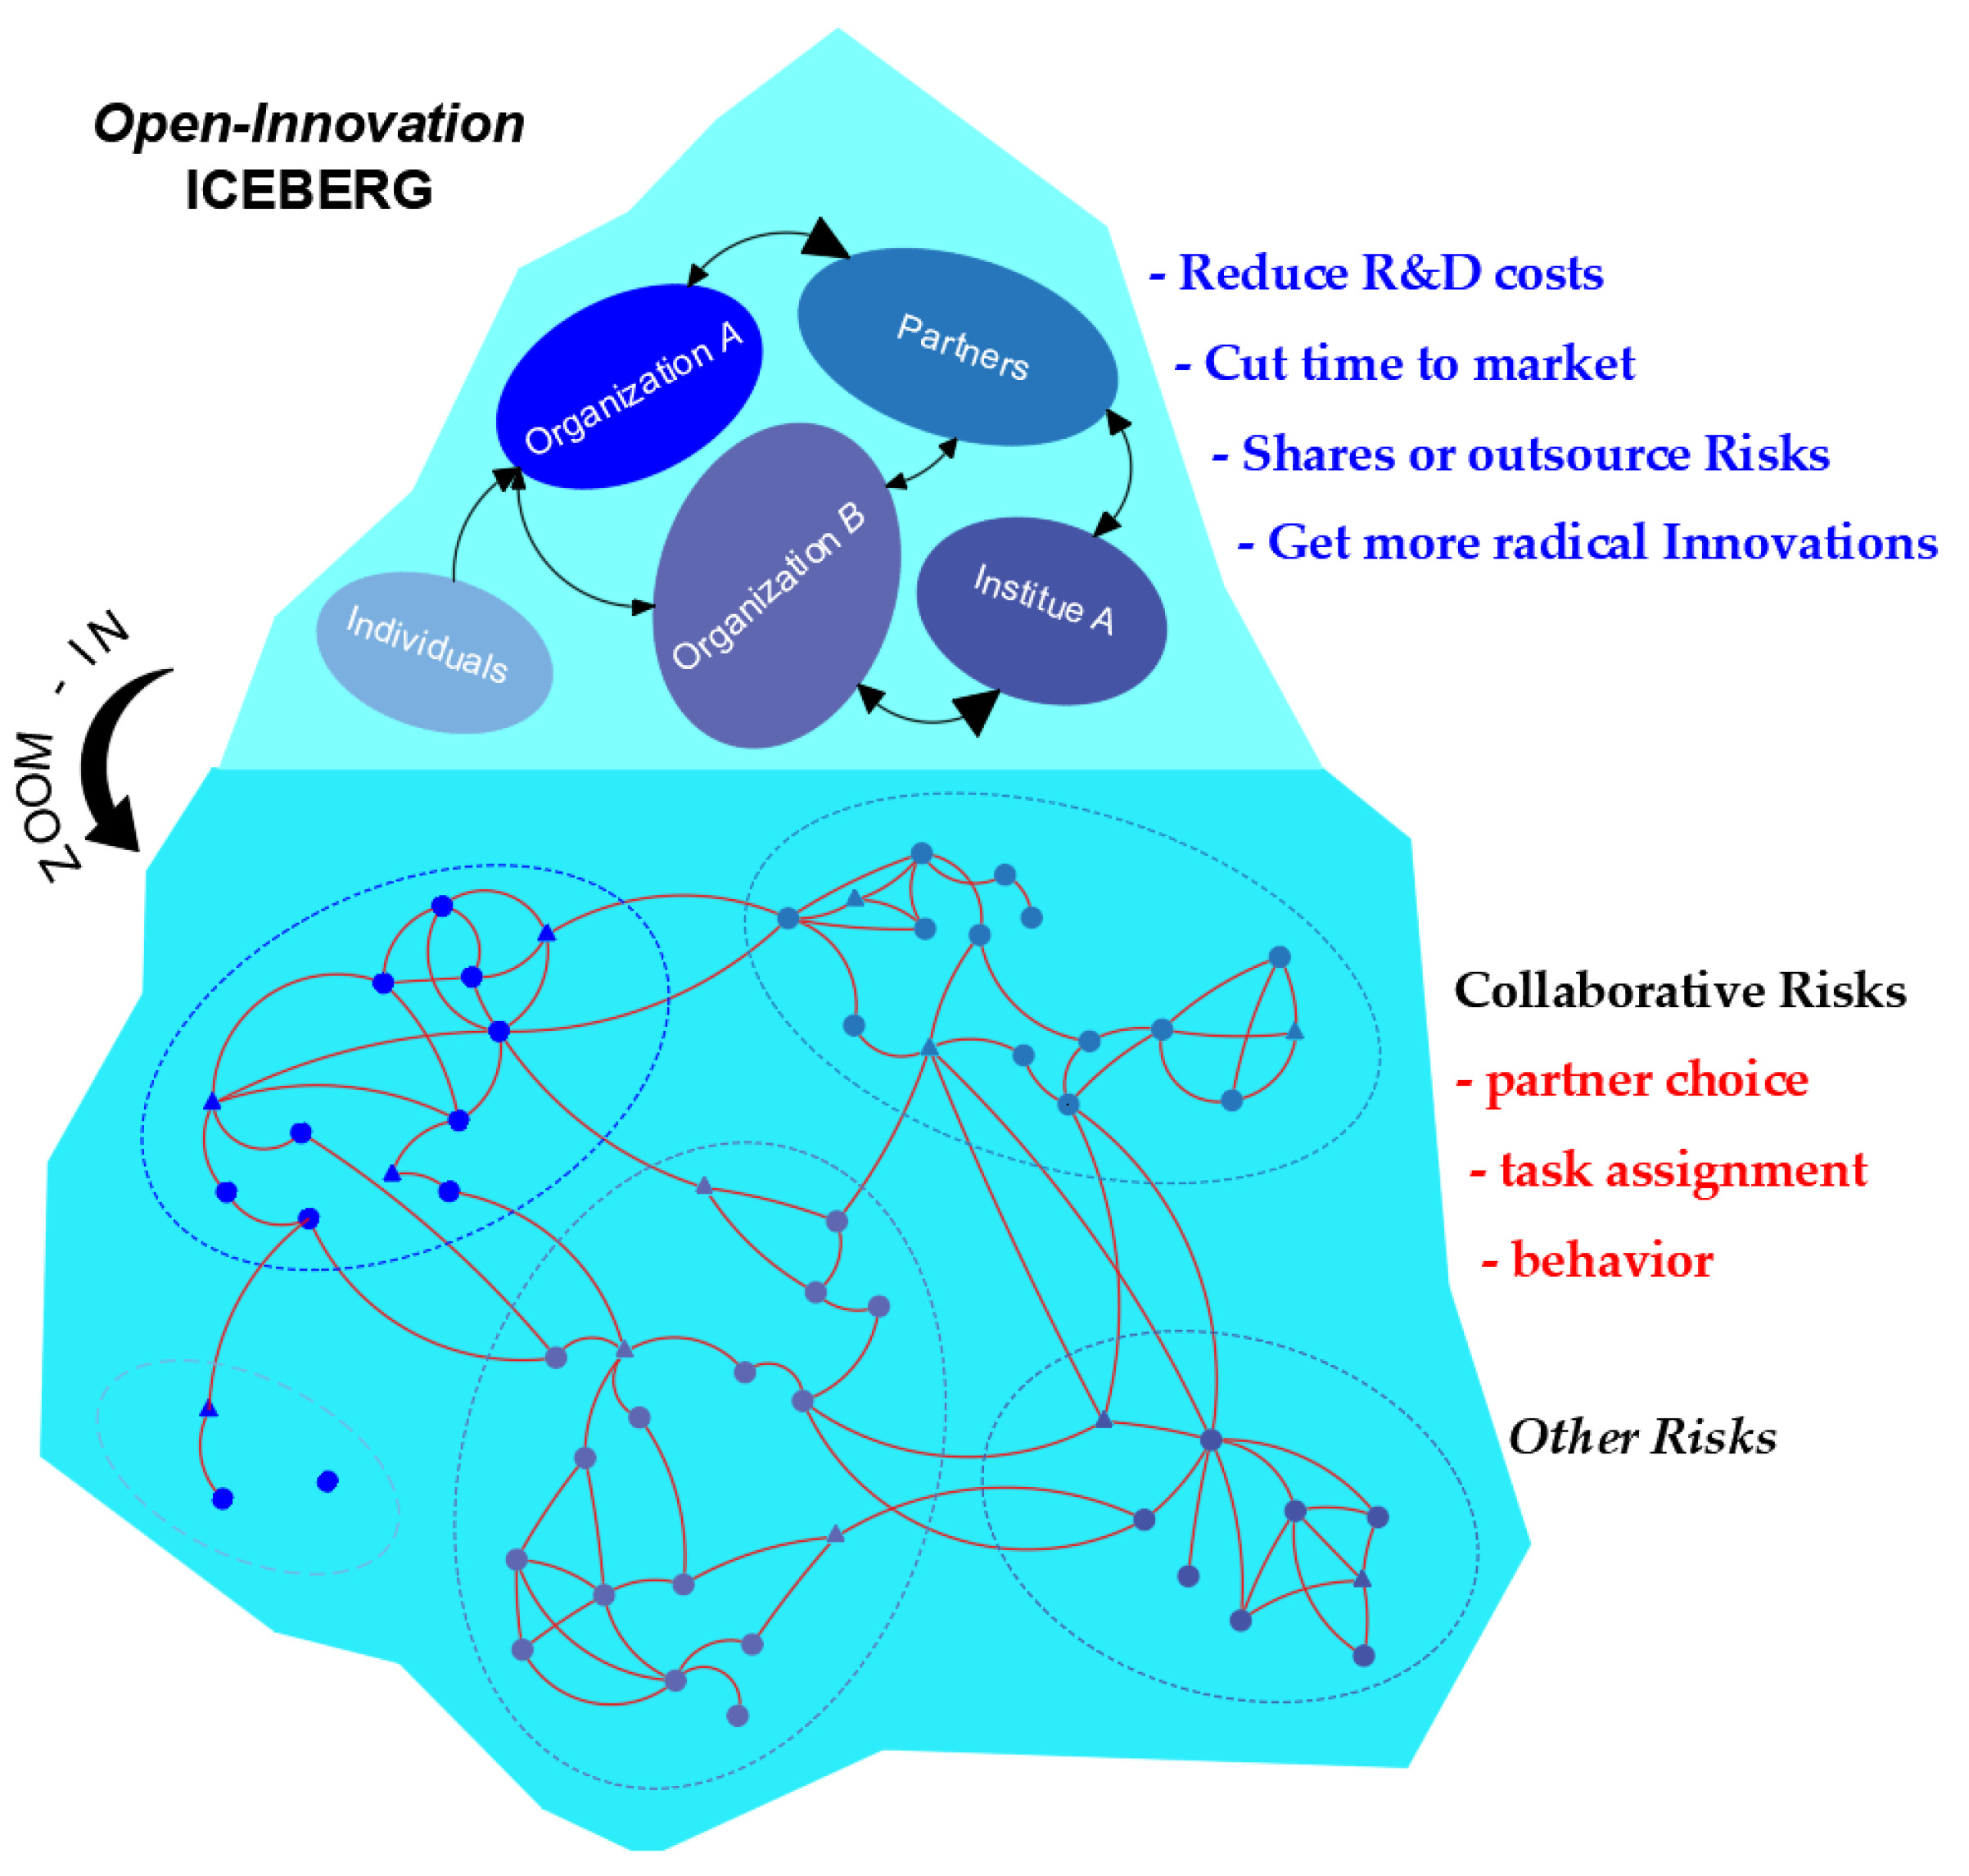
2.3. Open Innovation and Collaborative Risks
2.4. Social Network Theory
3. Methodology and Materials
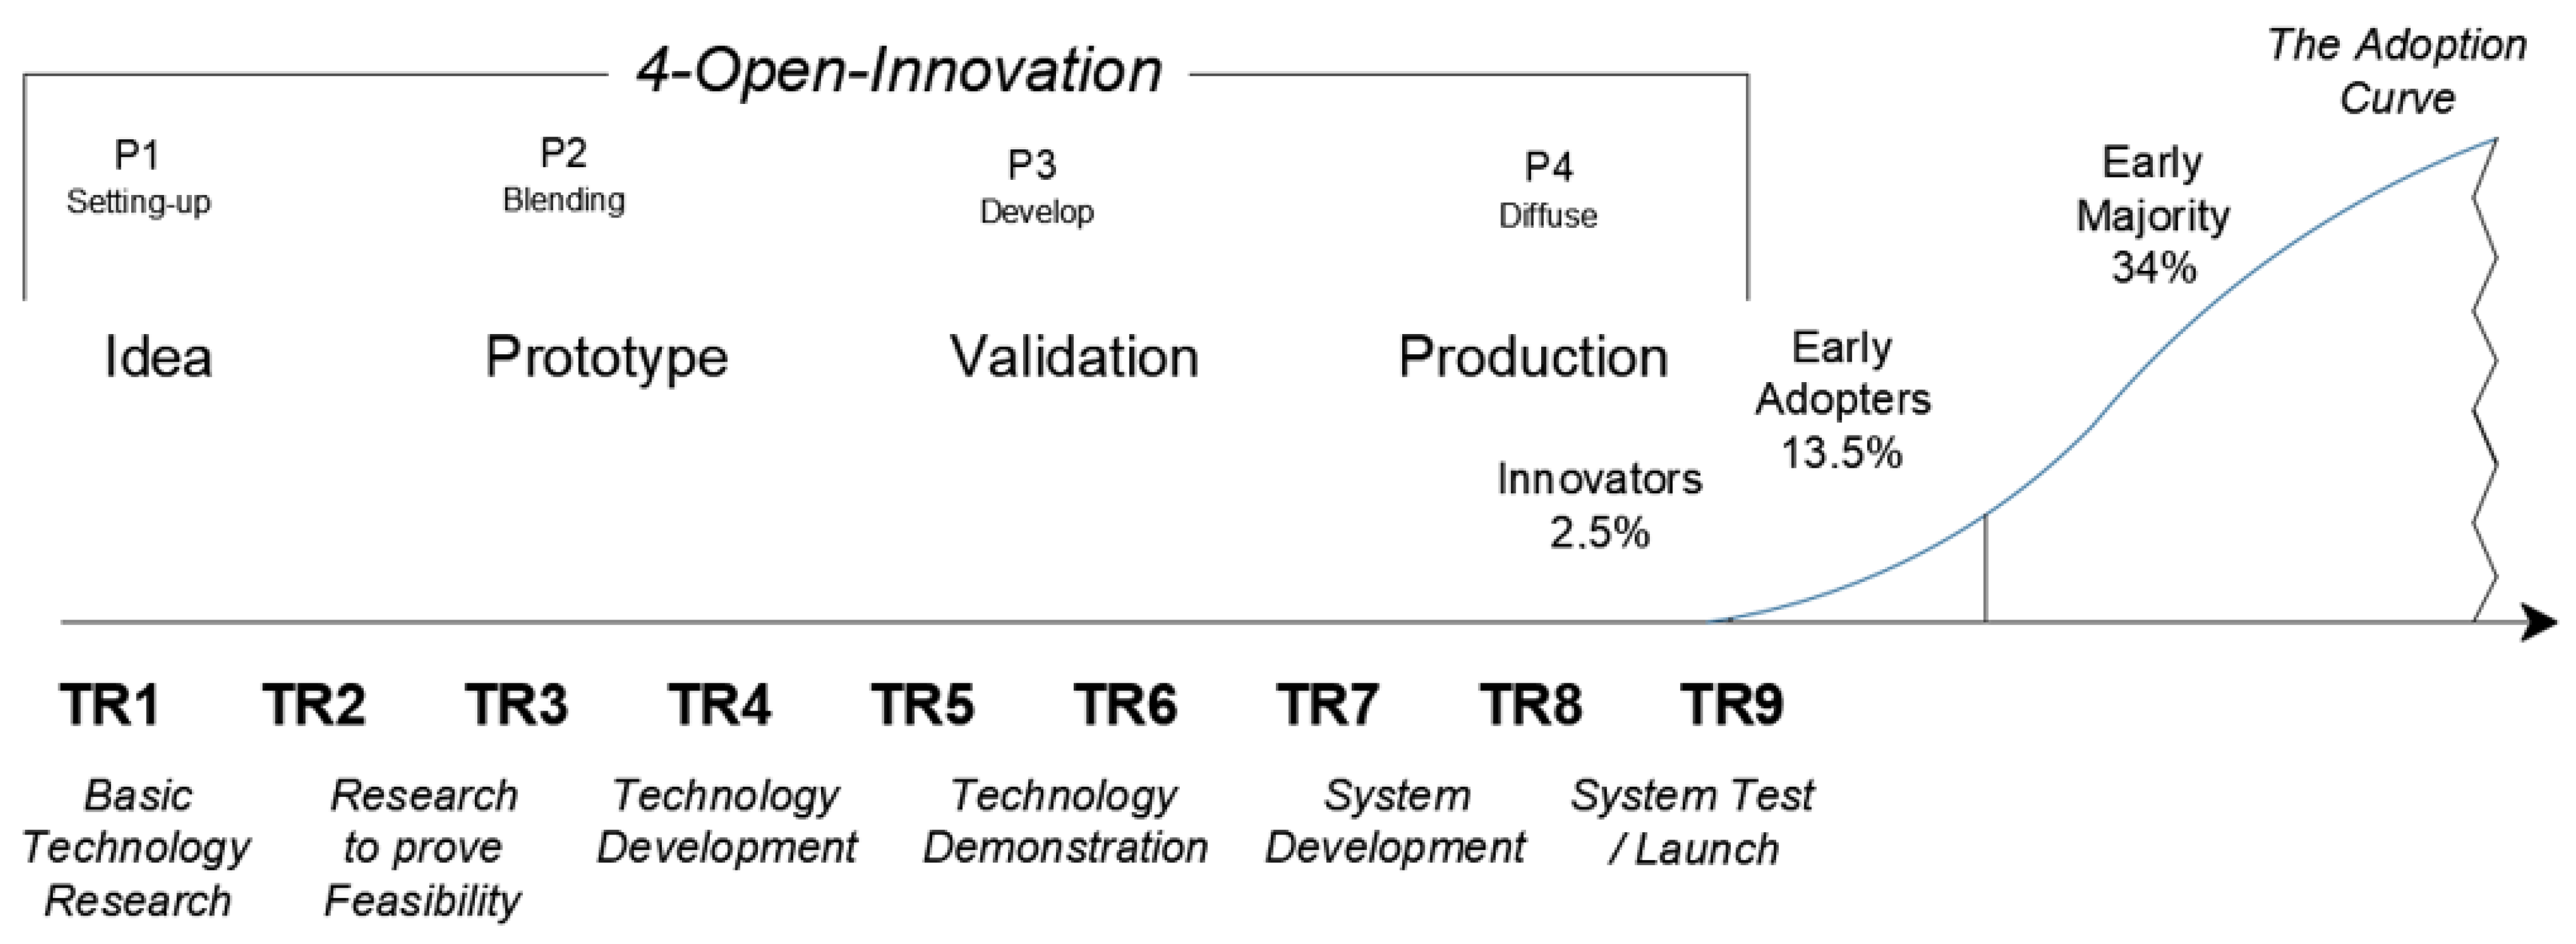
4. Application of the 4-Open-Innovation Model—A Case Study
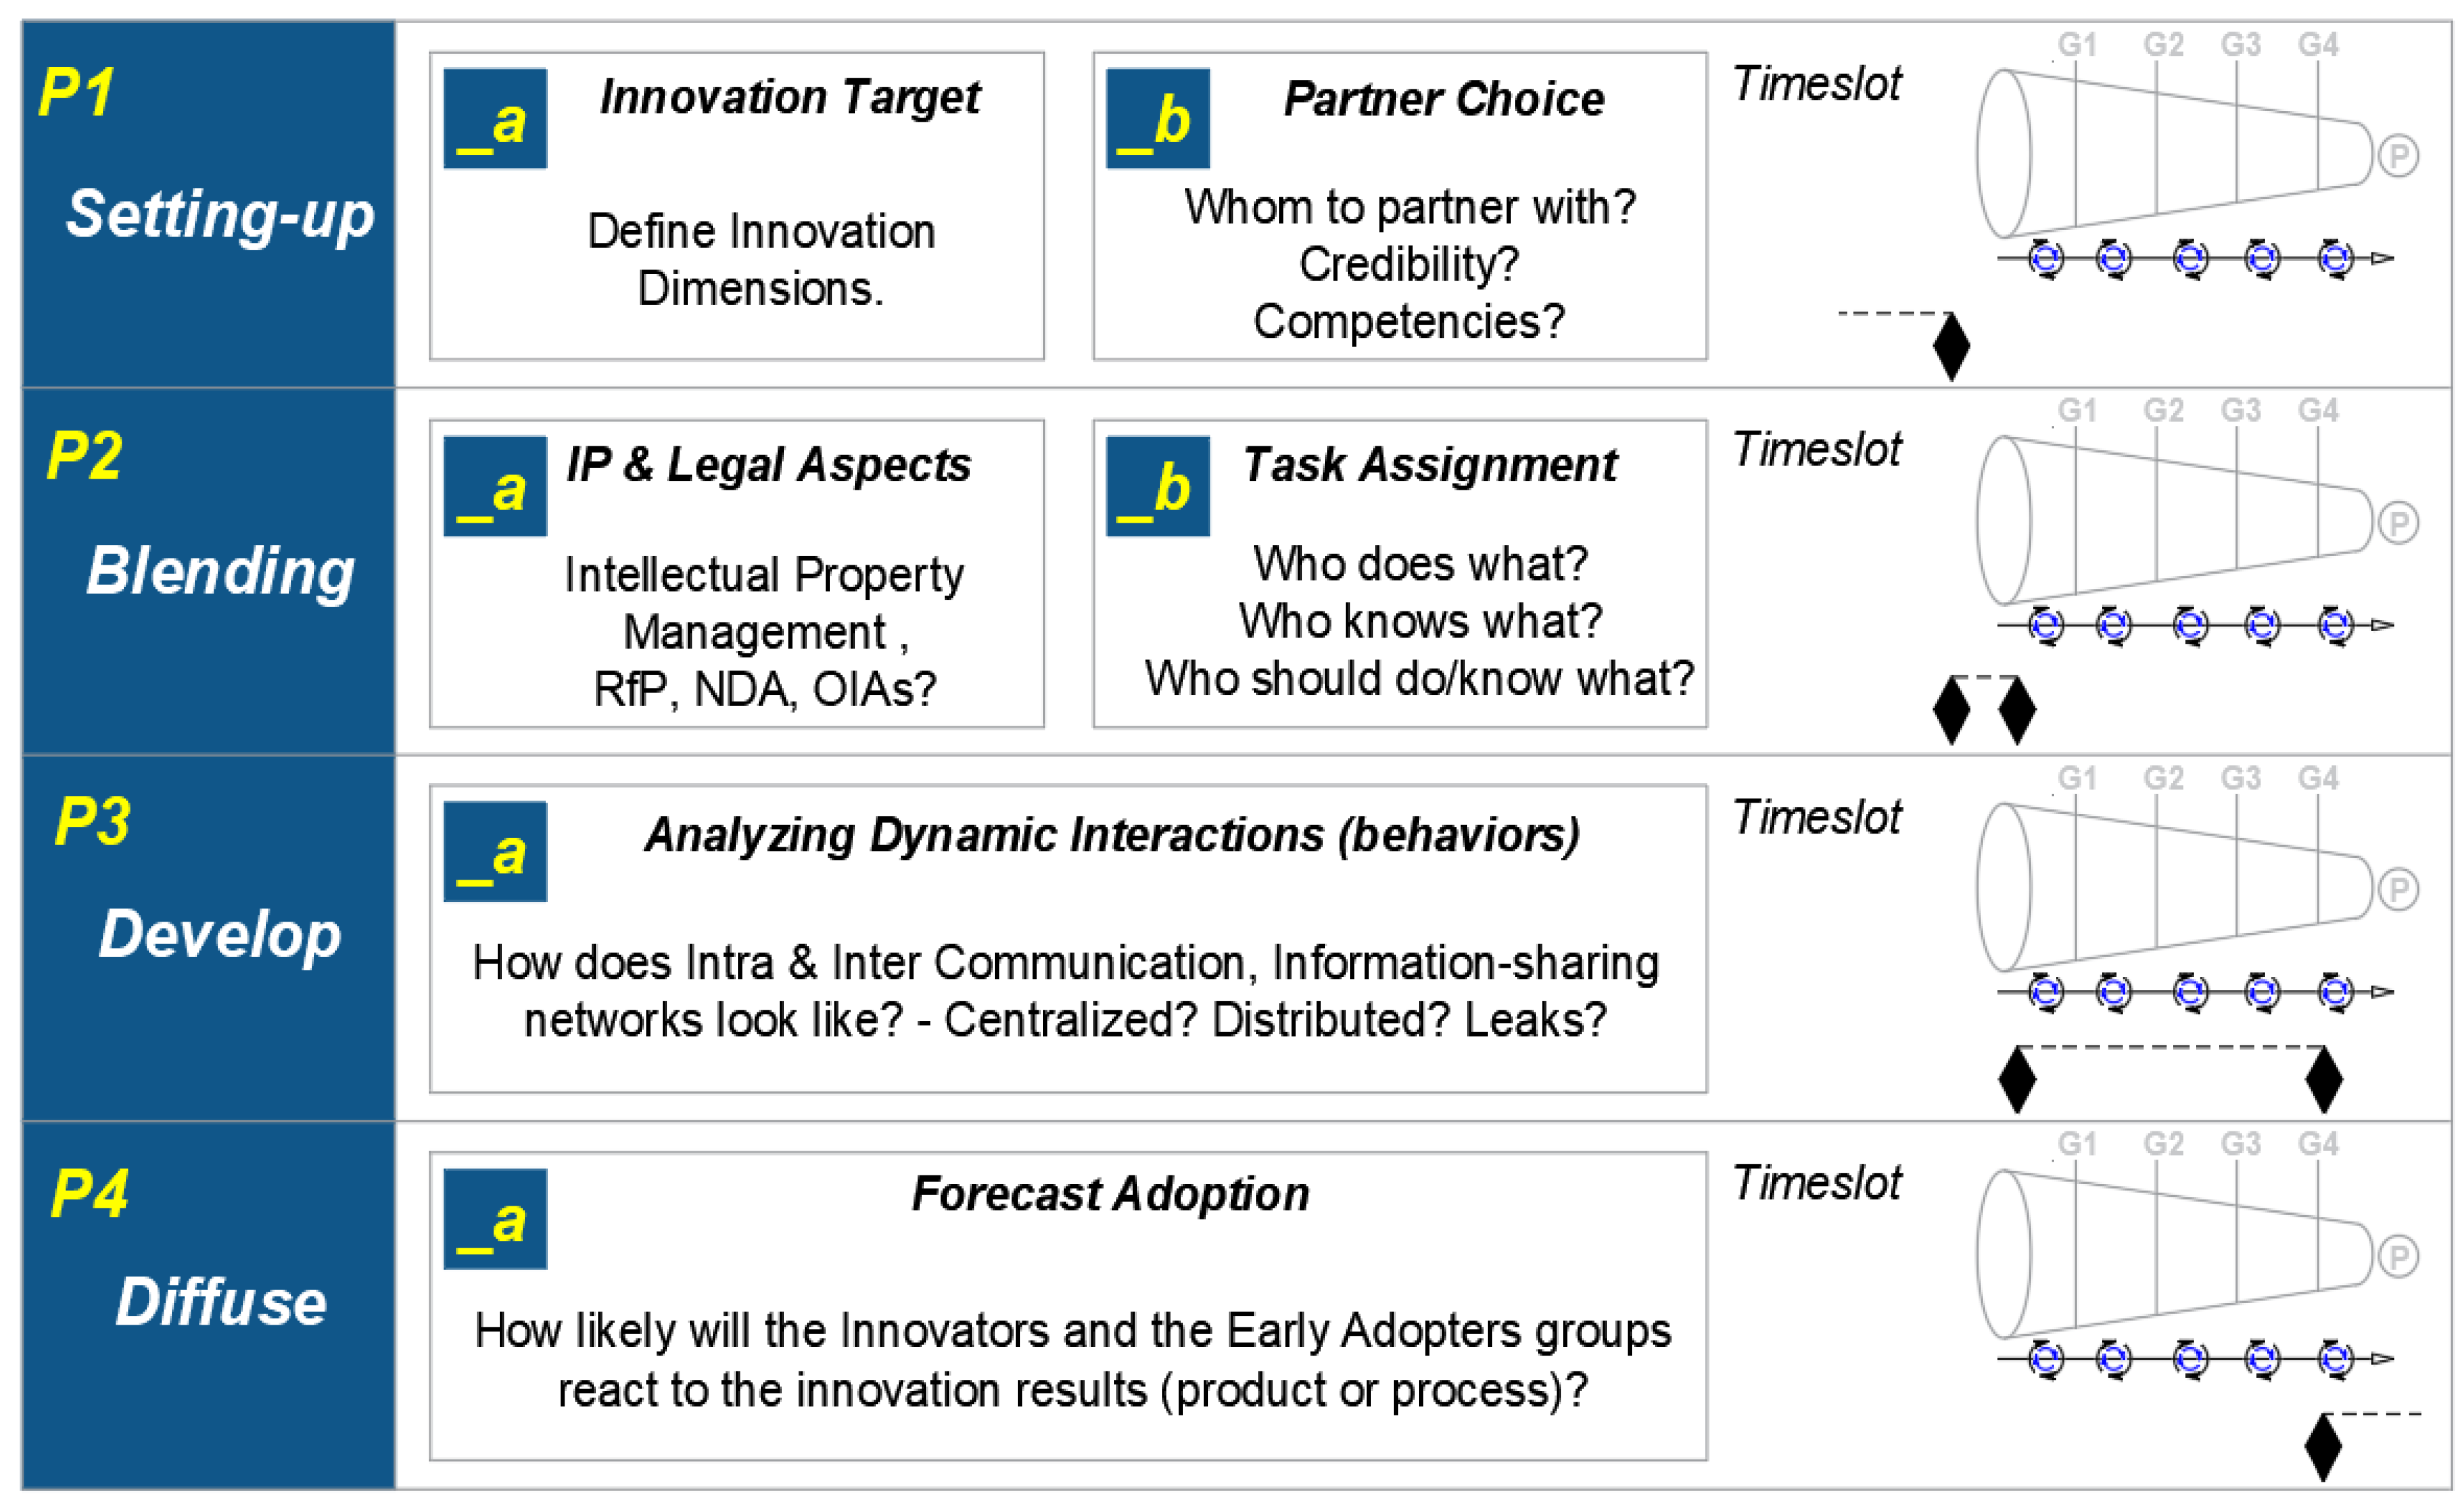
4.1. P1, Setting Up, P1_a—Innovation Target
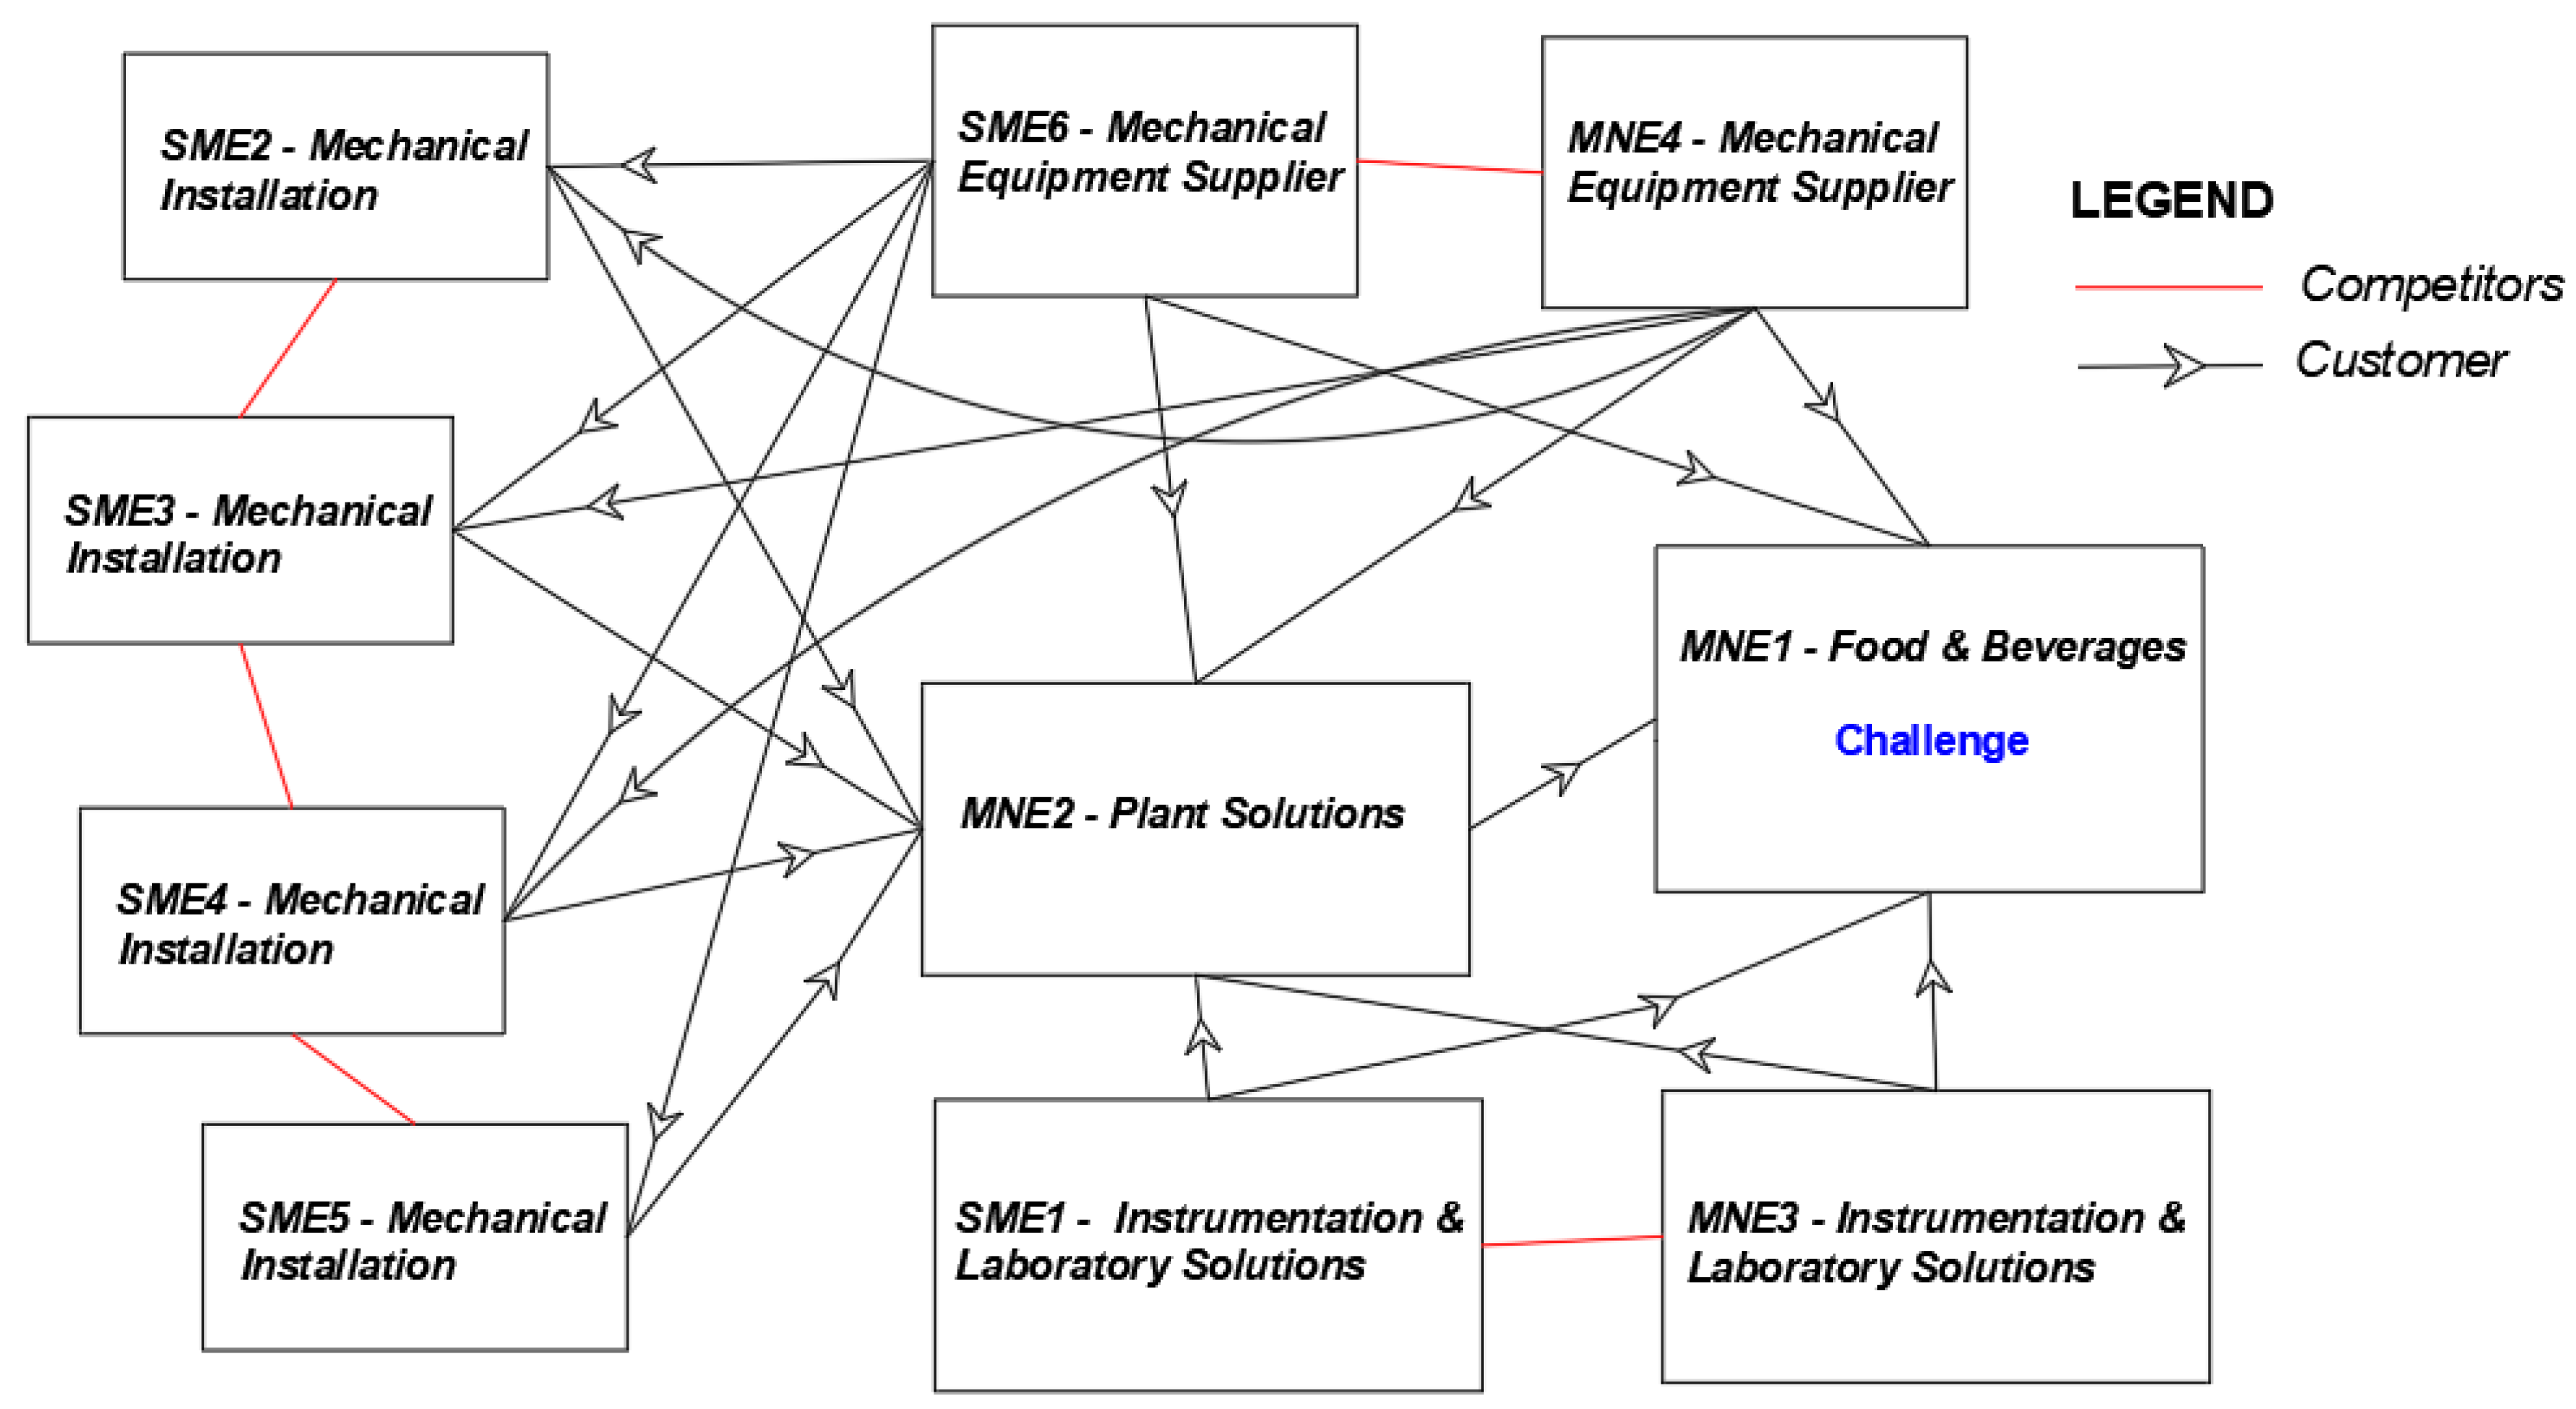
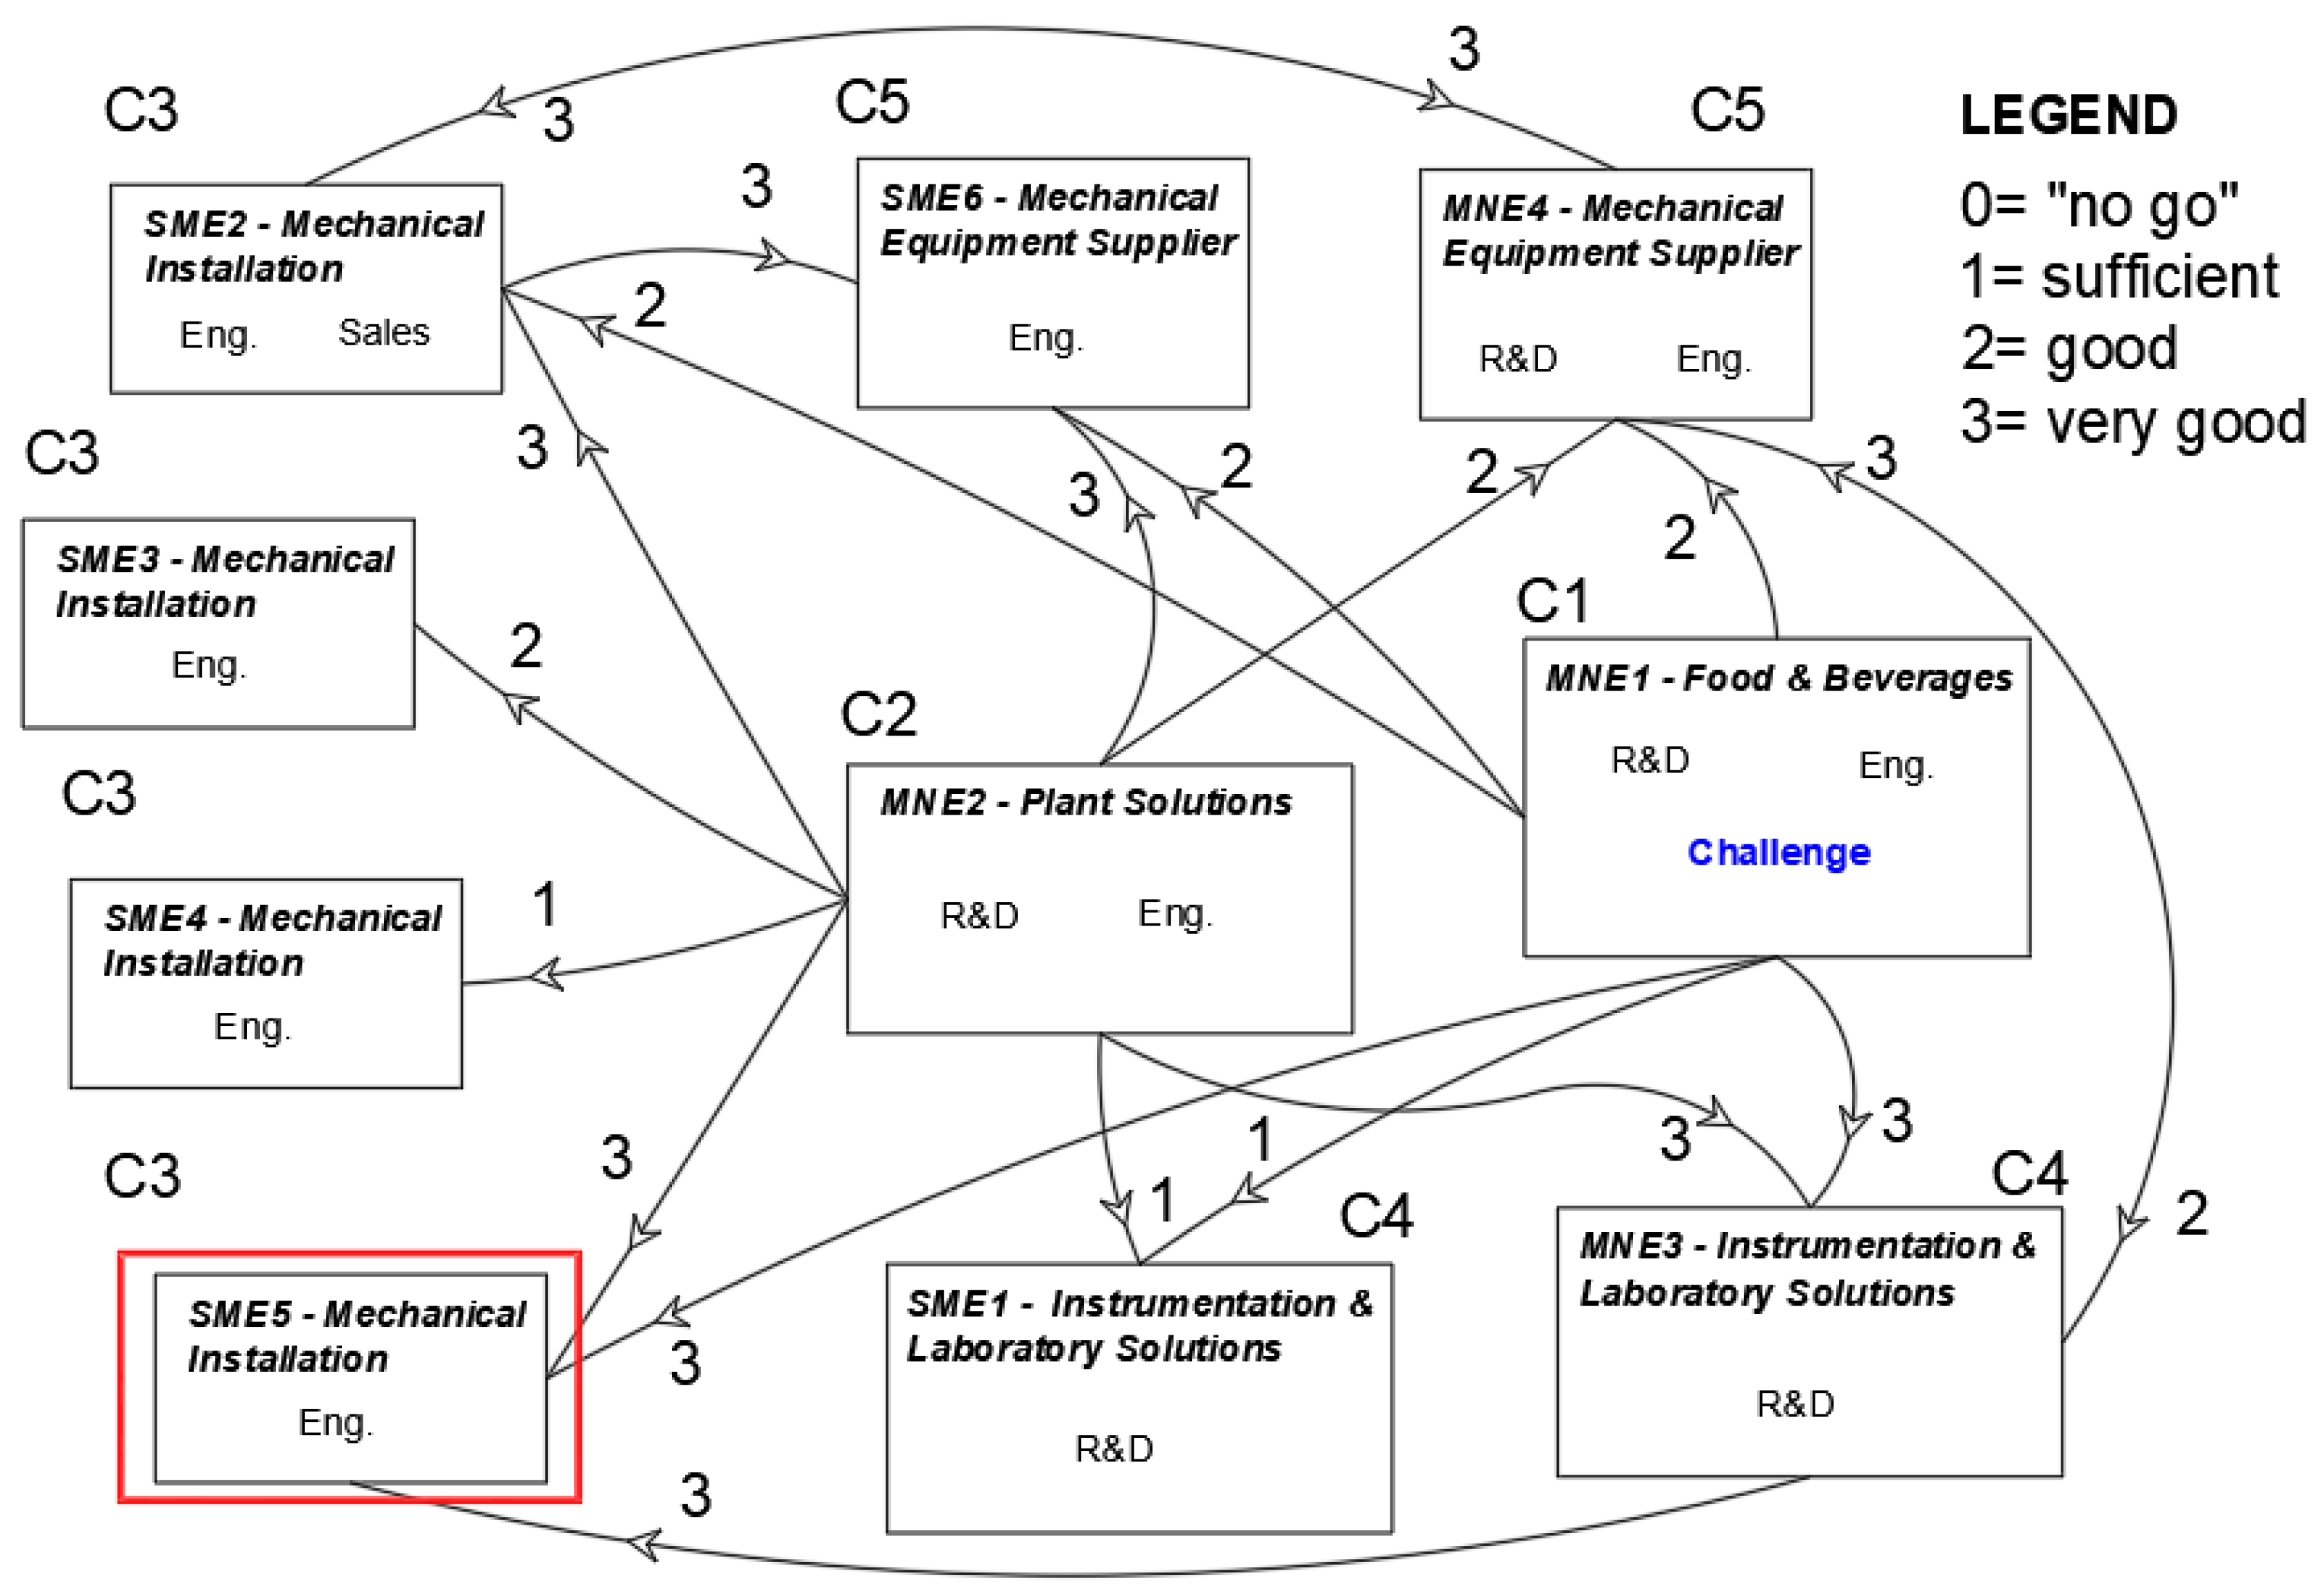
4.2. P1, Setting Up, P1_b—Partner Choice
4.3. P2, Blending, P2_a—IP and Legal Aspects
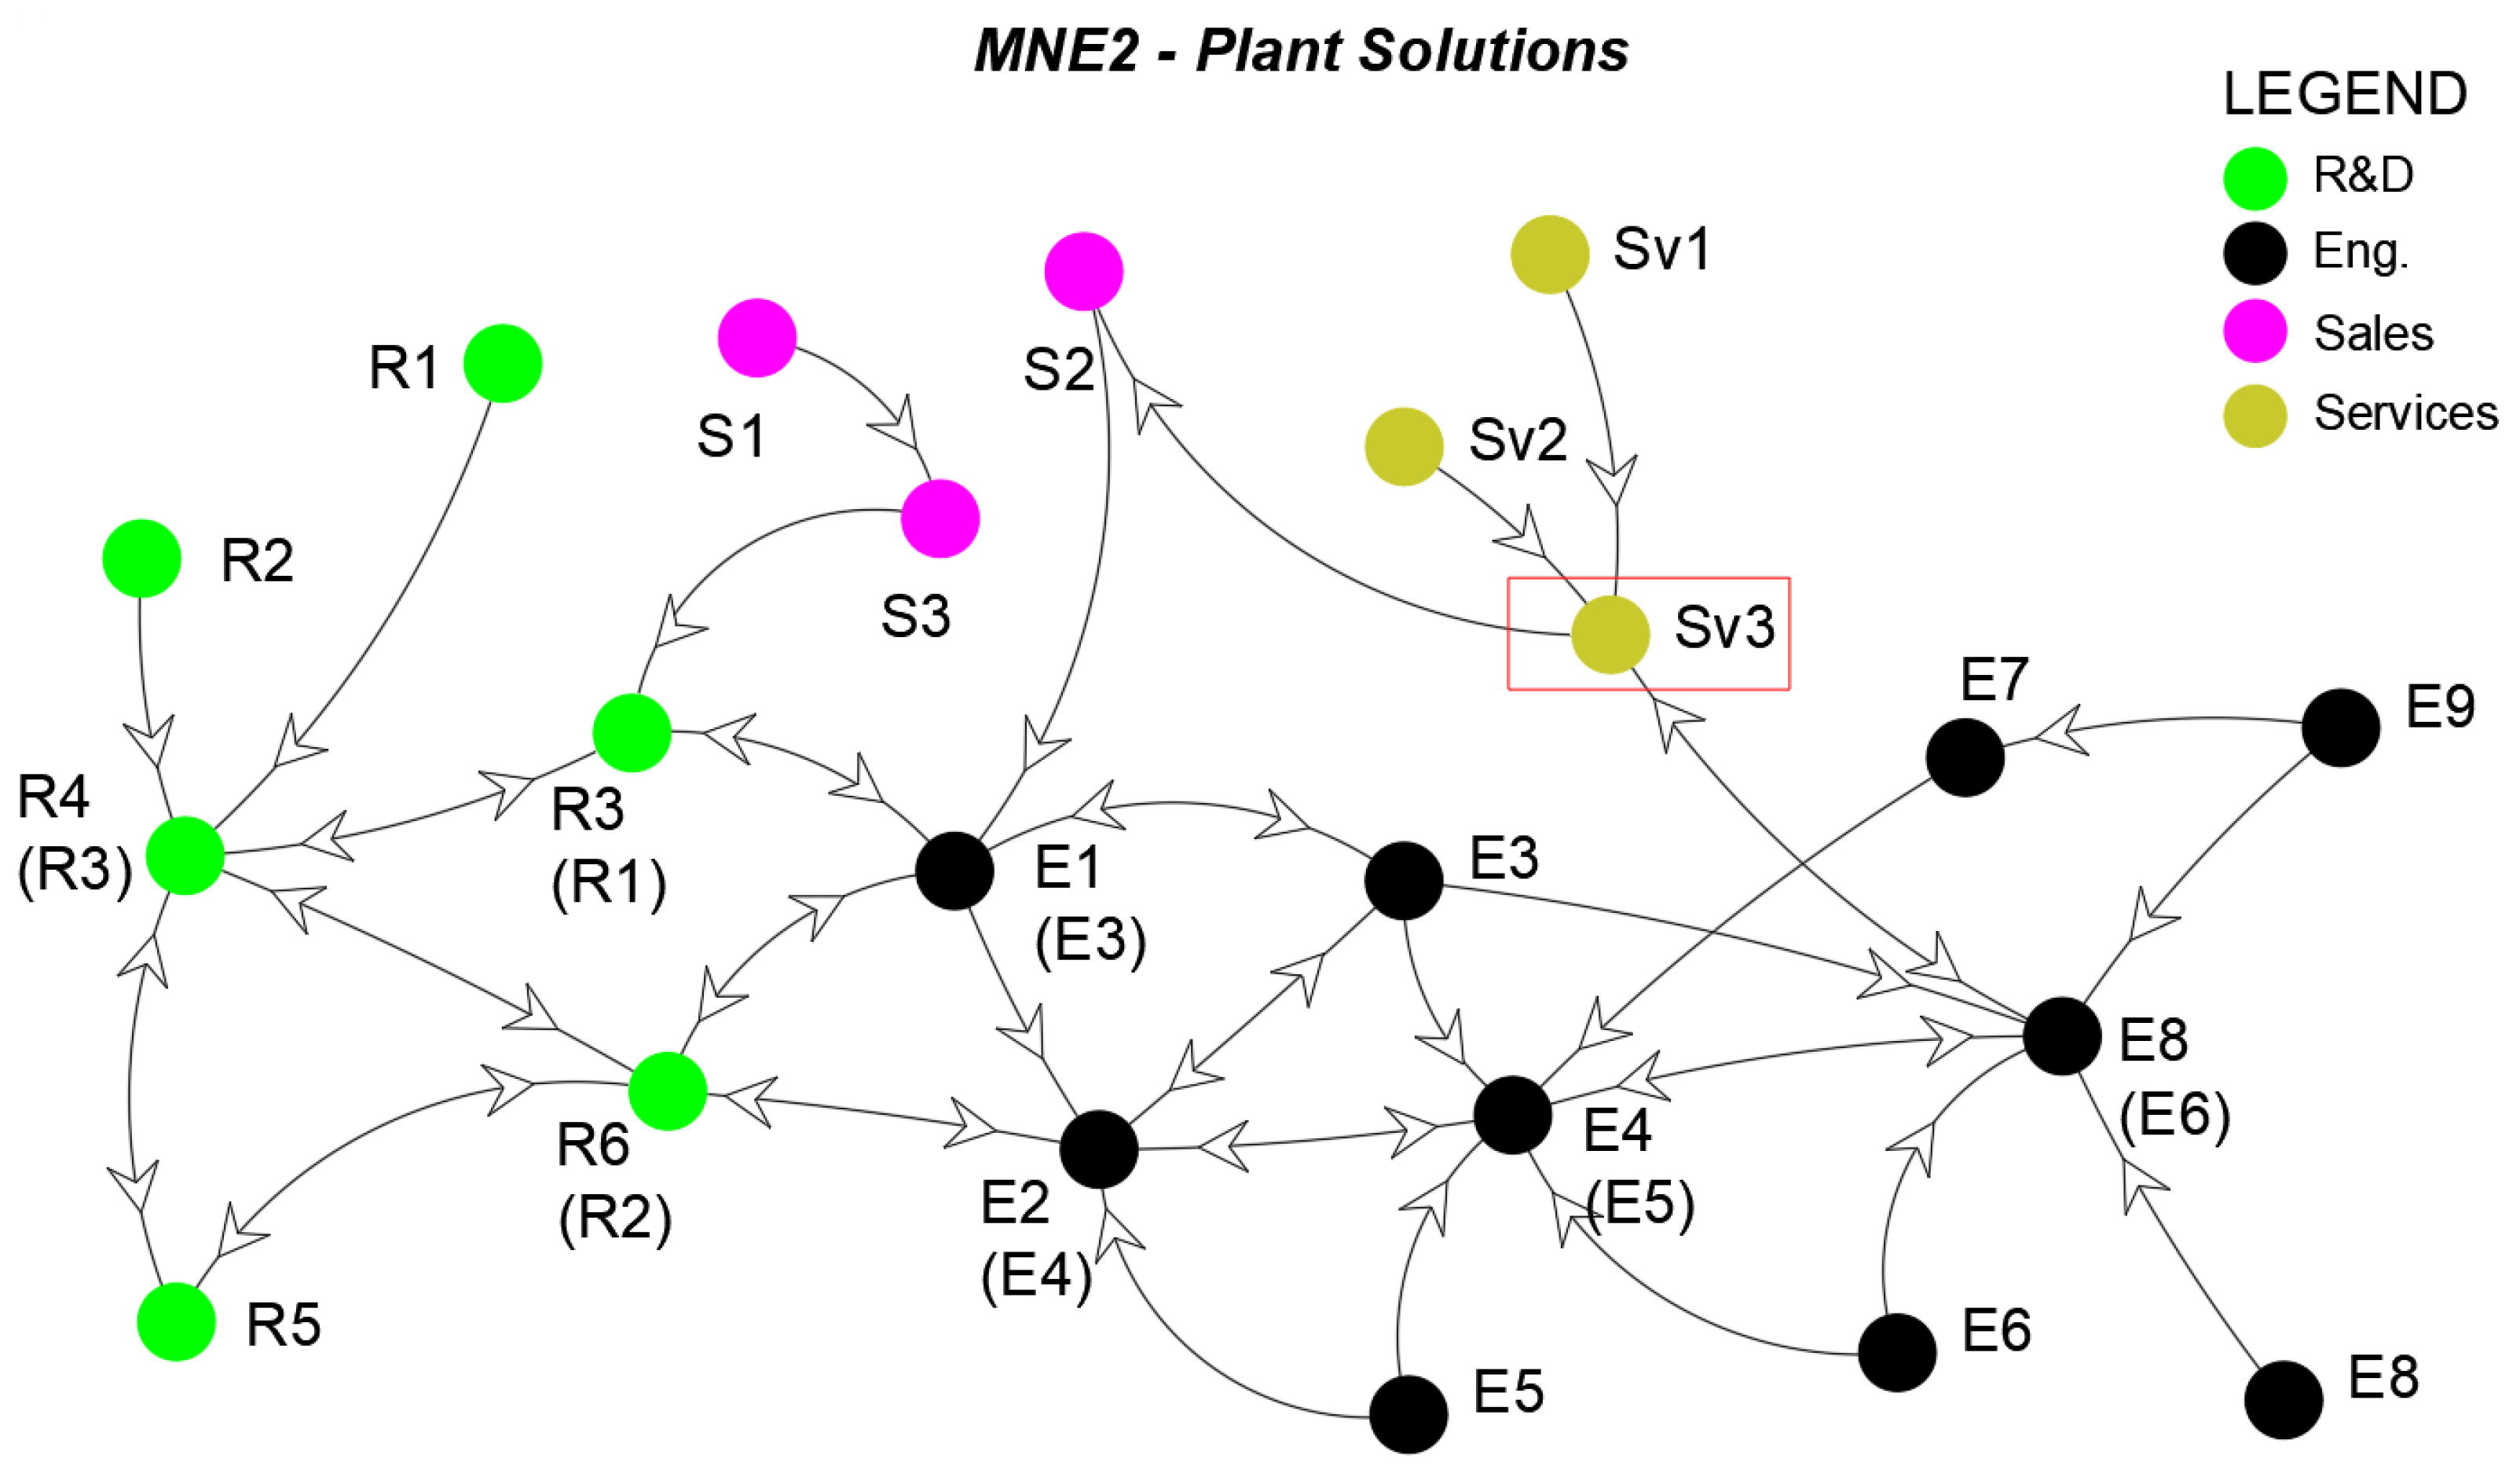
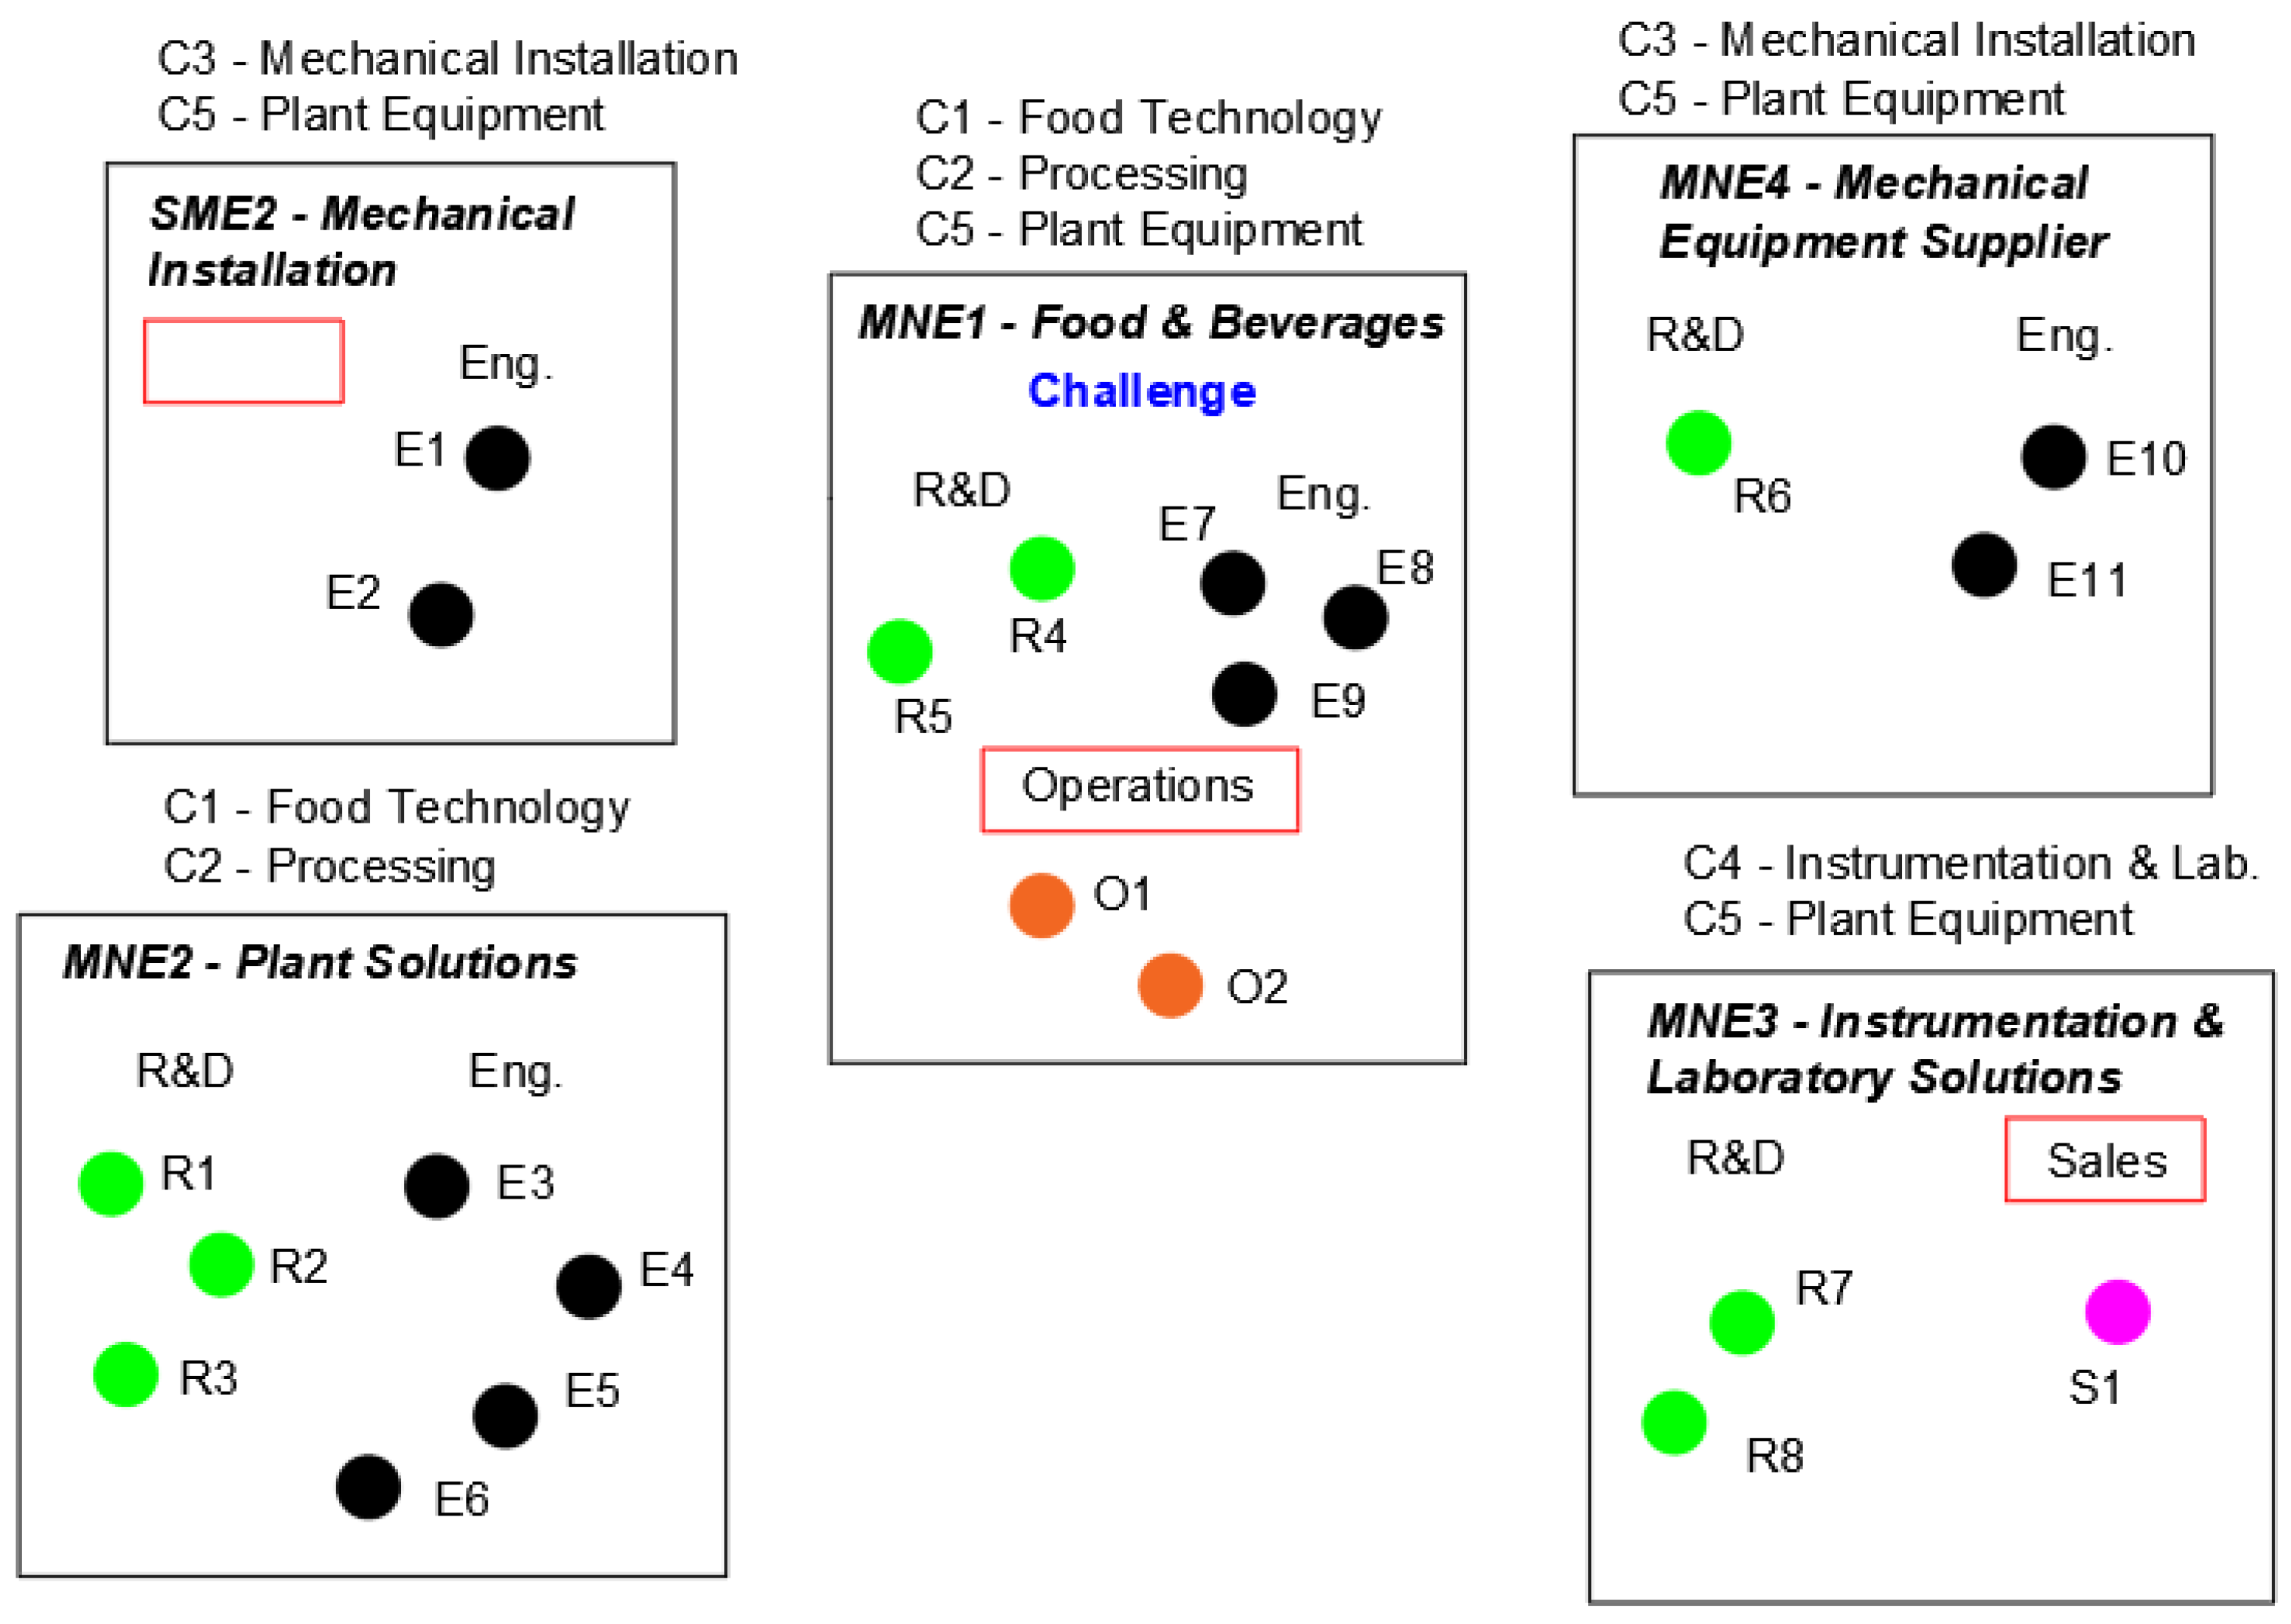
4.4. P2, Blending, P2_b—Task Assignment
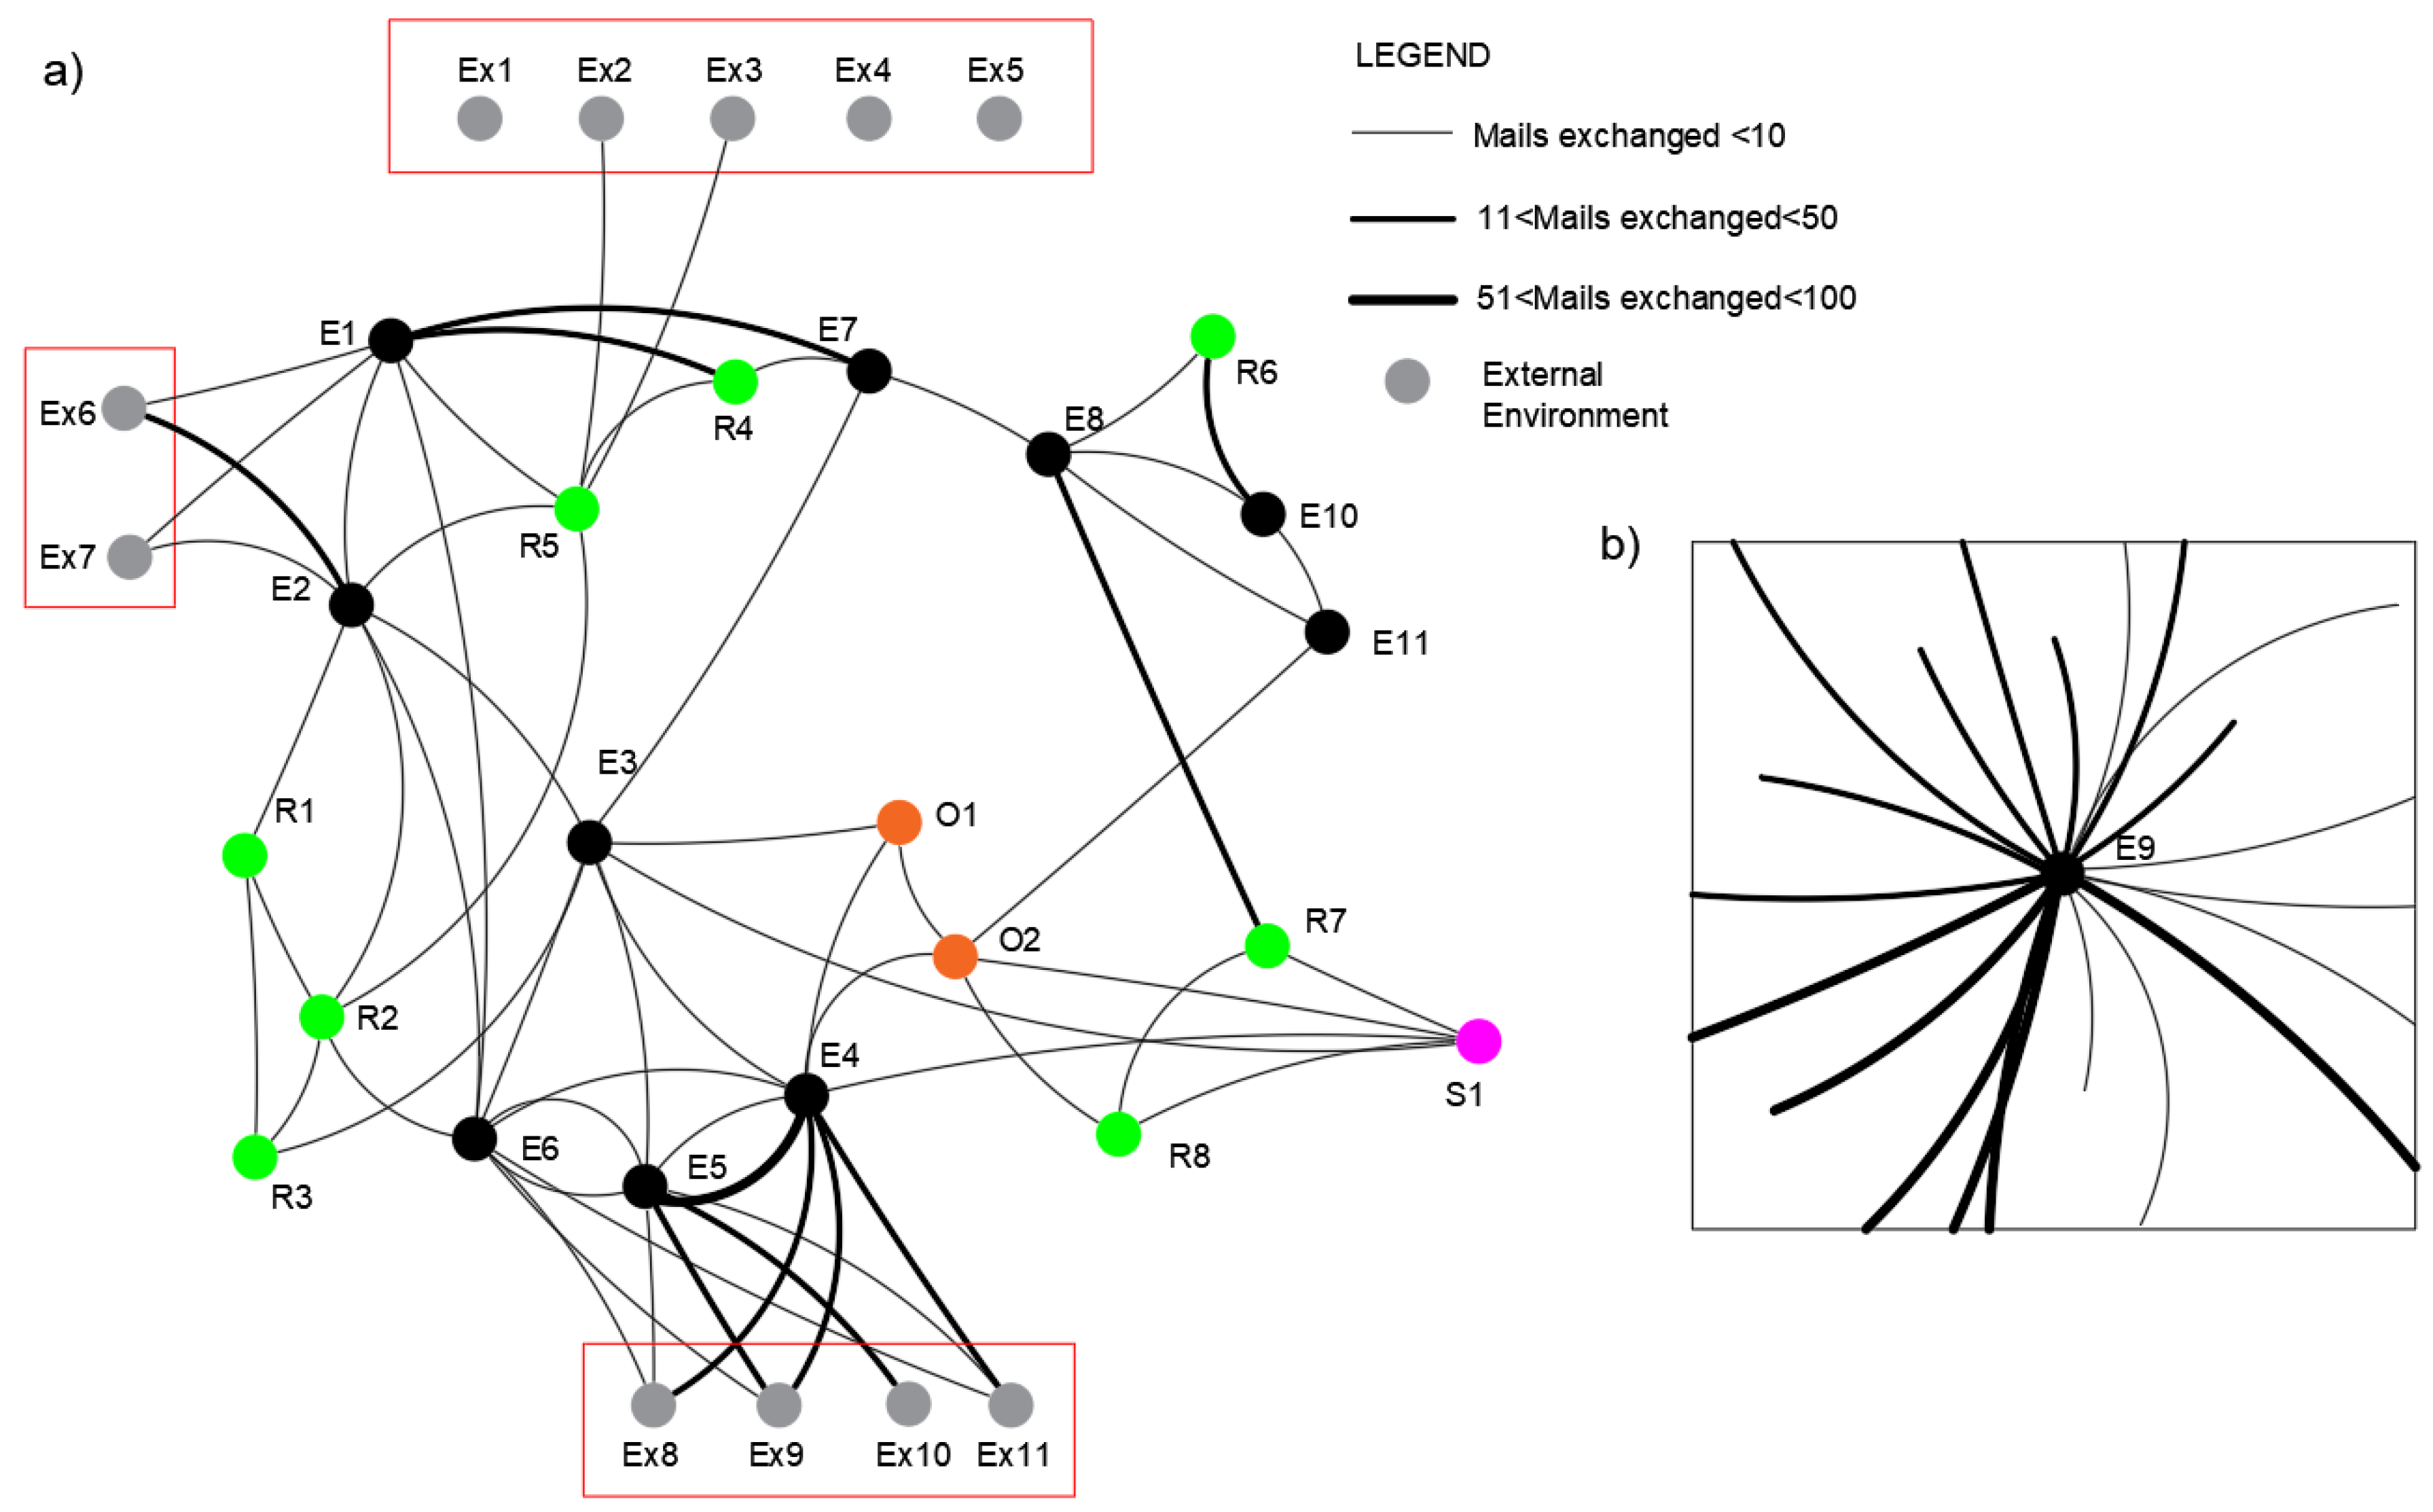
4.5. P3, Developing, P3_a—Monitoring Dynamic Development (Behaviors)
4.6. P4, Diffusing, P4_a—Forecast Adoption (Behaviors)
5. Conclusions, Implications, and Further Developments
5.1. Academic Implications
5.2. Managerial Implications
5.3. Suggestions for Future Research
Author Contributions
Funding
Conflicts of Interest
References
- Saraiva, C.; Mamede, H.S.; Silveira, M.C.; Nunes, M. Transforming physical enterprise into a remote organization: Trans-formation impact: Digital tools, processes, and people. In Proceedings of the 2021 16th Iberian Conference on Information Systems and Technologies (CISTI), Madrid, Spain, 22–25 June 2021; pp. 1–5. [Google Scholar]
- Nunes, M.; Abreu, A.; Saraiva, C. Identifying Project Corporate Behavioral Risks to Support Long-Term Sustainable Coop-erative Partnerships. Sustainability 2021, 13, 6347. [Google Scholar] [CrossRef]
- Porter, M.E. Competitive Advantage: Creating and Sustaining Superior Performance; Simon and Schuster: New York, NY, USA, 1985. [Google Scholar]
- Baroto, M.B.; Abdullah, M.M.B.; Wan, H.L. Hybrid Strategy: A New Strategy for Competitive Advantage. Int. J. Bus. Manag. 2012, 7, 120. [Google Scholar]
- Lapersonne, A. The Hybrid Competitive Strategy Framework: A Managerial Theory for Combining Differentiation and Low-Cost Strategic Approaches Based on A Case Study of a European Textile Manufacturer; The University of Manchester: Manchester, UK, 2018. [Google Scholar]
- Pretorius, M. When Porter’s generic strategies are not enough: Complementary strategies for turnaround situations. J. Bus. Strategy 2008, 29, 19–28. [Google Scholar] [CrossRef] [Green Version]
- Lutfihak, A.; Evrim, G. Disruption and ambidexterity: How innovation strategies evolve? Procedia Soc. Behav. Sci. 2016, 235, 782–787. [Google Scholar]
- Lee, K.; Woo, H.; Joshi, K. Pro-innovation culture, ambidexterity and new product development performance: Polynomial regression and response surface analysis. Eur. Manag. J. 2017, 35, 249–260. [Google Scholar] [CrossRef]
- Bouncken, R.; Brem, A.; Kraus, S. Multi-cultural teams as sources for creativity and innovation: The role of cultural diversity on team performance. Int. J. Innov. Manag. 2016, 20, 1650012. [Google Scholar] [CrossRef] [Green Version]
- Rizy, C.; Feil, S.; Sniderman, B.; Ellen Egan, M. Global Diversity and Inclusion Fostering Innovation Through a Diverse Workforce. Available online: https://images.forbes.com/forbesinsights/StudyPDFs/Innovation_Through_Diversity.pdf (accessed on 14 January 2020).
- Workday Studios. In Good Company—Michael Arena, Chris Ernst, Greg Pryor: Organizational Networks. 2018. Available online: https://www.youtube.com/watch?v=6faV0v0yVFU (accessed on 12 July 2019).
- Arena, M. Adaptive Space: How GM and Other Companies are Positively Disrupting Themselves and Transforming into Agile Organizations; McGraw Hill Education: New York, NY, USA, 2018. [Google Scholar]
- Hamel, The Why, What, and How of Management Innovation. From the February 2006 Issue. Available online: https://hbr.org/2006/02/the-why-what-and-how-of-management-innovation (accessed on 15 February 2020).
- Cross, R. Networks and Innovation: Rob Cross, Mack Institute for Innovation Management. 2013. Available online: https://www.youtube.com/watch?v=-ECSFbgWSFo (accessed on 2 March 2019).
- International Project Management Survey-Preliminary Results. 2023. Available online: https://www.researchgate.net/publication/369140929_What_do_project_stakeholders_say_about_3_critical_project's_aspects_and_their_importance_in_driving_projects_to_success (accessed on 10 March 2023).
- Dyer, J.H.; Gregersen Christensen, H.; Christensen, C.M. 2009 The Innovator’s DNA—From the December 2009 Issue. Available online: https://hbr.org/2009/12/the-innovators-dna (accessed on 15 January 2020).
- White, L., Jr. Tibet, India, and Malaysia as sources of western medieval technology. Am. Hist. Rev. 1960, 65, 512–526. [Google Scholar] [CrossRef]
- Henry, C. The Era of Open Innovation. MIT Sloan Management. Review 2003, 44, 35–41. [Google Scholar]
- Santos, R.; Abreu, A.; Anes, V. Developing a Green Product-Based in an Open Innovation Environment. Case Study: Electrical Vehicle. In Collaborative Networks and Digital Transformation. Proceedings of the PRO-VE 2019. IFIP Advances in Information and Communication Technology, Turin, Italy, 23–25 September 2019; Camarinha-Matos, L., Afsarmanesh, H., Antonelli, D., Eds.; Springer International Publishing: Cham, Switzerland; Volume 568.
- Bénézech, D. The Open Innovation model: Some issues regarding its internal consistency. J. Innov. Econ. Manag. 2012, 10, 145–165. [Google Scholar] [CrossRef]
- Nunes, M.; Abreu, A. Applying Social Network Analysis to Identify Project Critical Success Factors. Sustainability 2020, 12, 1503. [Google Scholar] [CrossRef] [Green Version]
- Narsalay, R.; Kavathekar, J.; Light, D. A Hands-Off Approach to Open Innovation Doesn’t Work. 2016. Available online: https://hbr.org/2016/05/a-hands-off-approach-to-open-innovation-doesnt-work (accessed on 20 January 2020).
- Gustavsson, T. Benefits of Agile Project Management in a Non-Software Development Context—A Literature Review. In Proceedings of the Project Management Development—Practice and Perspectives Fifth International Scientific Conference on Project Management in the Baltic Countries, Riga, Latvia, 14–15 April 2016; Available online: https://www.researchgate.net/publication/301517890_Benefits_of_Agile_Project_Management_in_a_Non-Software_Development_Context_-_A_Literature_Review (accessed on 15 January 2023).
- Chesbrough, H.; Crowther, A.K. Beyond high tech: Early adopters of open innovation in other industries. RD Manag. 2006, 36, 229–236. [Google Scholar] [CrossRef]
- Grönlund, J.; Sjödin, D.R.; Frishammar, J. Open Innovation and the Stage-Gate Process: A Revised Model for New Product Development. Calif. Manag. Rev. 2010, 52, 106–131. [Google Scholar] [CrossRef]
- Abreu, A.; Martins Moleiro JDuarte Calado, J.M.F. Fuzzy Logic Model to Support Risk Assessment in Innovation Ecosystems. In Proceedings of the 2018 13th APCA International Conference on Automatic Control and Soft Computing (CONTROLO), Ponta Delgada, Portugal, 4–6 June 2018; pp. 104–109. [Google Scholar]
- Ng, D.C.W.; Law, K. Impacts of informal networks on innovation performance: Evidence in Shanghai. Chin. Manag. Stud. 2015, 9, 56–72. [Google Scholar] [CrossRef]
- Gupta, M. The innovation process from an idea to a final product: A review of the literature. Int. J. Comp. Manag. 2018, 1, 400–421. [Google Scholar] [CrossRef]
- Schumpeter, J.A. Theory of Economic Development: An Inquiry into Profits, Capital, Credit, Interest and the Business Cycle; Transaction Publishers: New Brunswick, NJ, USA, 1911. [Google Scholar]
- Myers, S.; Marquis, D.G. Successful Industrial Innovations; National Science Foundation: Washington, DC, USA, 1969. [Google Scholar]
- Henry, J.; Walker, D. Managing Innovation; SAGE Publications Ltd.: London, UK, 1991. [Google Scholar]
- Campbell, R. Architecting and Innovating. Available online: https://core.ac.uk/download/pdf/4382303.pdf (accessed on 15 January 2018).
- Hirst, L. What is Innovation? 2010, Lisbon Council’s 2010 Innovation Summit. Available online: https://www.youtube.com/watch?v=2NK0WR2GtFs (accessed on 28 February 2021).
- OECD. The Measurement of Scientific and Technological Activities: Guidelines for Collecting and Interpreting Innovation Data: Oslo Manual, 3rd ed.; prepared by the Working Party of National Experts on Scientific and Technology Indicators; OECD: Paris, France, 2005; para. 146. [Google Scholar]
- Godin, B. Models of innovation: Why models of innovation are models, or what work is being done in calling them models? Soc. Stud. Sci. 2015, 45, 570–596. [Google Scholar] [CrossRef]
- Cooper, J.R. A multidimensional approach to the adoption of innovation. Manag. Decis. 1998, 36, 493–502. [Google Scholar] [CrossRef]
- Schilling, M. Strategic Management of Technological Innovation; McGraw-Hill/Irwin, New York University: New York, NY, USA, 2005; Available online: http://ndl.ethernet.edu.et/bitstream/123456789/87807/5/Strategic%20Management%20of%20Technological%20Innovation%2C%20Fourth%20Edition%20%28%20PDFDrive.com%20%29.pdf (accessed on 20 January 2023).
- Nunes, M.; Bagnjuk, J.; Abreu, A.; Saraiva, C.; Nunes, E.; Viana, H. Achieving Competitive Sustainable Advantages (CSAs) by Applying a Heuristic-Collaborative Risk Model. Sustainability 2022, 14, 3234. [Google Scholar] [CrossRef]
- Freeman, C.; Soete, L. Technical Change and Full Employment; Basil Blackwell: Oxford, UK, 1987; pp. vii + 279. [Google Scholar]
- Christensen, C.M. The Innovator’s Dilemma: When New Technologies Cause Great Firms to Fail; Harvard Business Review Press: Boston, MA, USA, 2013. [Google Scholar]
- Christensen, C.; Raynor, M.E.; McDonald, R. What Is Disruptive Innovation? Harv. Bus. Rev. 2015, 93, 44–53. [Google Scholar]
- Tidd, J.; Bessant, J.R. Managing Innovation: Integrating Technological, Market and Organizational Change, 5th ed.; John Wiley & Sons: Hoboken, NJ, USA, 2013; Available online: https://www.youtube.com/watch?v=UAN5Pl_F0fo (accessed on 15 February 2020).
- Tidd, J. Innovation Models Paper 1 a Review of Innovation Models a Review of Innovation Models a Review of Innovation Models. © Imperial College London 2006. DISCUSSION PAPER. Available online: https://www.researchgate.net/publication/325757038_A_Review_of_Innovation_Models (accessed on 10 February 2021).
- Dabic, M.; Basic, M.; Vlajčić, D. Introduction to the Open Innovation Paradigm. In Innovation Education Reloaded: Nurturing Skills for the Future; LUT Scientific and Expertise Publications: Lappeenranta, Finland, 2016; pp. 113–162. [Google Scholar]
- Godin, B. The Linear Model of Innovation: The Historical Construction of an Analytical Framework. Sci. Technol. Hum. Values 2006, 31, 639–667. [Google Scholar] [CrossRef]
- Moraes, M.; Campos, T.; Lima, E. Models of innovation development in small and median-sized enterprises of the aeronautical sector in Brazil and in Canada. Gestão Produção. 2019, 26. [Google Scholar] [CrossRef] [Green Version]
- Du Preez, N.D.; Louw, L.; Essmann, H. Essmann—An innovation process model for improving innovation capability. J. High Technol. Manag. Res. 2006, 17, 1–24. [Google Scholar]
- Cosmin-Mihai, N.; Silvia, A. A Model of Technological Innovation Process, Managing Intellectual Capital and Innovation for Sustainable and Inclusive Society: Managing Intellectual Capital and Innovation. In Proceedings of the MakeLearn and TIIM Joint International Conference 2, Timisoara, Romania, 25–27 May 2016; ToKnowPress: Valletta, Malta, 2015. [Google Scholar]
- Nunes, M.; Abreu, A.; Bagnjuk, J. A Model to Manage Organizational Collaborative Networks in a Pandemic (COVID-19) Context. In Smart and Sustainable Collaborative Networks 4.0. Proceedings of the PRO-VE 2021. IFIP Advances in Information and Communication Technology, Saint-Étienne, France, 22–24 November; Camarinha-Matos, L.M., Boucher, X., Afsarmanesh, H., Eds.; Springer: Cham, Switzerland, 2021; Volume 629. [Google Scholar]
- Howe, J. Crowdsourcing: Why the Power of the Crowd Is Driving the Future of Business Paperback; Three Rivers Press: New York, NY, USA, 2009. [Google Scholar]
- Ikediego, H.; Ilkan, M.; Abubakar, A.; Victor Bekun, F. Crowd-sourcing (who, why and what). Int. J. Crowd Sci. 2018, 2, 27–41. [Google Scholar] [CrossRef] [Green Version]
- MIT. Free Innovation. 2017. Available online: https://mitpress.mit.edu/books/free-innovation (accessed on 20 February 2020).
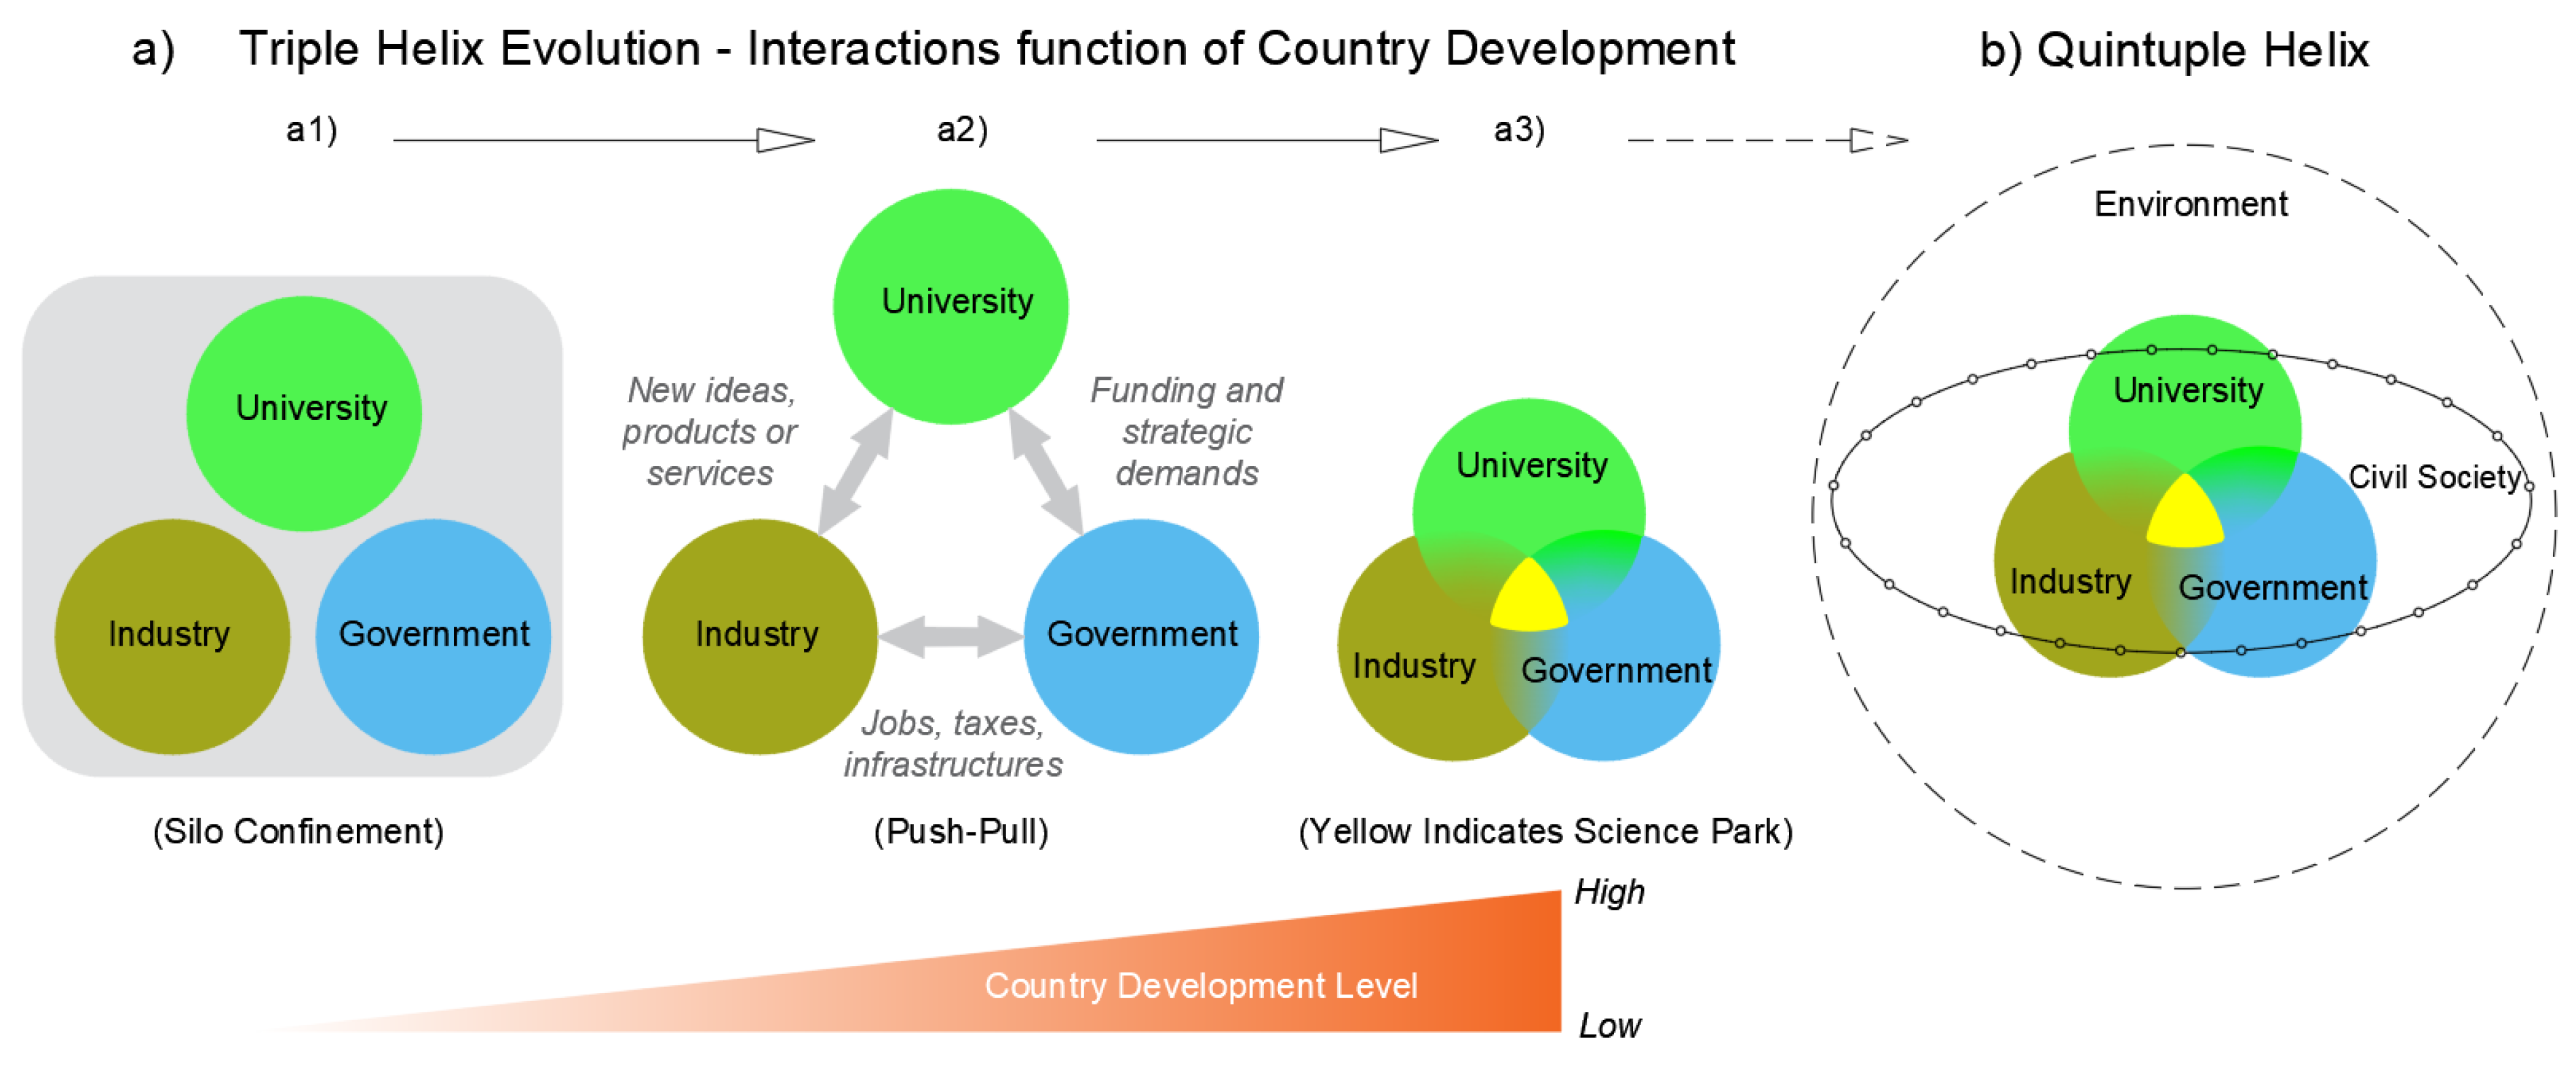
- Etzkowitz, H.; Leydesdorff, L. The Dynamics of Innovation: From National Systems and “Mode 2” to a Triple Helix of University–Industry–Government Relations. Res. Policy 2000, 29, 109–123. [Google Scholar] [CrossRef]
- Hasche, N.; Höglund, L.; Linton, G. Quadruple helix as a network of relationships: Creating value within a Swedish regional innovation system. J. Small Bus. Entrep. 2020, 32, 523–544. [Google Scholar] [CrossRef] [Green Version]
- Huizingh, E.K. Open innovation: State of the art and future perspectives. Technovation 2011, 31, 2–9. [Google Scholar] [CrossRef]
- Deichmann, D.; Rozentale, I.; Barnhoorn, R. Open Innovation Generates Great Ideas, So Why Aren’t Companies Adopting Them? Available online: https://hbr.org/2017/12/open-innovation-generates-great-ideas-so-why-arent-companies-adopting-them (accessed on 1 January 2019).
- Rauter, R.; Globocnik, D.; Perl-Vorbach, E.; Baumgartner, R.J. Open innovation and its effects on economic and sustainability innovation performance. J. Innov. Knowl. 2019, 4, 226–233. [Google Scholar] [CrossRef]
- Ullrich, A.; Vladova, G. Weighing the Pros and Cons of Engaging in Open Innovation. Technol. Innov. Manag. 2016, 6, 34–40. [Google Scholar] [CrossRef]
- Chesbrough, H. How to Capture All the Advantages of Open Innovation at HBR. 2020. Available online: https://hbr.org/podcast/2020/01/how-to-capture-all-the-advantages-of-open-innovation (accessed on 3 February 2022).
- Cooper, R.G.; Sommer, A.F. The Agile-Stage-Gate Hybrid Model: A Promising New Approach and a New Research Opportunity. J. Prod. Innov. Manag. 2016, 33, 513–526. [Google Scholar] [CrossRef]
- Cooper, R.G. Winning at New Products: Accelerating the Process from Idea to Launch, 2nd. ed.; Basic Books: Cambridge, MA, USA, 1993; ISBN 978-0-201-56381-8. [Google Scholar]
- Fortuin, F.T.; Batterink, M.H.; Omta, S.W.F. Key Success Factors of Innovation in Multinational Agrifood Pro-spector Companies. Int. Food Agribus. Manag. Rev. 2007, 10, 1–24. [Google Scholar]
- Cooper, R.G.; Edgett, S.J.; Kleinschmidt, E.J. (Eds.) New Product Development Best Practices Study: What Distinguishes the Top Performers; APQC (American Productivity & Quality Center): Houston, TA, USA, 2002. [Google Scholar]
- Cooper, R.G. The Stage-Gate® System: A Road Map from Idea to Launch—An Intro & Summary. Available online: http://gemba.dk/wp-content/uploads/2016/04/The-Stage-Gate-System-A-Roadmap-From-Idea-to-Launch-An-Intro-Summary-GEMBA.pdf (accessed on 15 March 2021).
- Hakkarainen, K.; Talonen, T. The Innovation Funnel Fallacy. Int. J. Innov. Sci. 2014, 6, 63–72. [Google Scholar] [CrossRef]
- Cross, R.; Borgatti, S.P.; Everett, A. Analysing Social Networks. Making Invisible Work Visible: Using social network anal-ysis to support strategic collaboration. Calif. Manag. Rev. 2002, 44, 25–42. [Google Scholar] [CrossRef]
- Martino, F.; Spoto, A. Social Network Analysis: A brief theoretical review and further perspectives in the study of Information Technology. Psychol. J. 2006, 4, 53–86. [Google Scholar]
- Faulkner, W.; Nkwake, A.M. The potential of Social Network Analysis as a tool for monitoring and evaluation of ca-pacity building interventions. J. Gend. Agric. Food Secur. 2017, 2, 125–148. [Google Scholar]
- Kacanski, S.; Lusher, D. The Application of Social Network Analysis to Accounting and Auditing. Int. J. Acad. Res. Account. Financ. Manag. Sci. 2017, 7, 182–197. [Google Scholar] [CrossRef] [Green Version]
- Ward, M.D.; Stovel, K.; Sacks, A. Network Analysis and Political Science. Annu. Rev. Political Sci. 2011, 14, 245–264. [Google Scholar] [CrossRef]
- Gassmann, O.; Enkel, E. Towards a Theory of Open Innovation: Three Core Process Archetypes; University of St. Gallen: St. Gallen, Switzerland, 2004; Volume 6, Available online: https://www.alexandria.unisg.ch/274/1/Gassmann_Enkel.pdf (accessed on 20 January 2023).
- Scott, J. Social Network Analysis: A Handbook, 4th ed.; SAGE: London, UK, 2017. [Google Scholar]
- Wasserman, S.; Faust, K. Social Network Analysis: Methods and Applications; Cambridge University Press: Cambridge, UK, 1994; ISBN 9780521387071. [Google Scholar]
- Durland, M.M.; Fredericks, K.A. An introduction to social network analysis. New Dir. Eval. 2005, 2005, 5–13. [Google Scholar] [CrossRef]
- Otte, E.; Rousseau, R. Social network analysis: A powerful strategy, also for the information sciences. J. Inf. Sci. 2002, 28, 441–453. [Google Scholar] [CrossRef]
- Bauer, T.; Erdogan, B.; Carpenter, M. Management Principles. Open Textbook Library 2010 Publications. 2012, pp. 80–126. Available online: https://2012books.lardbucket.org/pdfs/management-principles-v1.1.pdf (accessed on 20 January 2023).
- Cross, R.; Prusak, L. The People Who Make Organizations Go—Or Stop. June 2002 Issue of Harvard Business Review. Available online: https://hbr.org/2002/06/the-people-who-make-organizations-go-or-stop (accessed on 15 March 2020).
- Björkman, I.; Kock, S. Social relationships and business networks: The case of Western companies in China. Int. Bus. Rev. 1995, 4, 519–535. [Google Scholar] [CrossRef]
- Rong, X.; Mei, Q. Diffusion of innovations revisited: From social network to innovation network. In Proceedings of the CIKM’13: 22nd ACM international conference on Information & Knowledge Management, San Francisco, CA, USA, 27 October–1 November 2013; pp. 499–508. [Google Scholar]
- Kontinen, T.; Ojala, A. Network ties in the international opportunity recognition of family SMEs. Int. Bus. Rev. 2011, 20, 440–453. [Google Scholar] [CrossRef] [Green Version]
- Nunes, M.; Abreu, A.; Bagnjuk, J.; Tiedtke, J. Measuring project performance by applying social network analyses. Int. J. Innov. Stud. 2021, 5, 35–55. [Google Scholar] [CrossRef]
- Cross, R.; Rebele, R.; Grant, A. Collaborative Overload. Harv. Bus. Rev. 2016, 94, 74–79. [Google Scholar]
- Assenova, V.A. Modeling the diffusion of complex innovations as a process of opinion formation through social networks. PLoS ONE 2018, 13, e0196699. [Google Scholar] [CrossRef] [PubMed]
- PMI ® (Project Management Institute). Project Management Body of Knowledge (PMBOK® Guide), 6th ed.; Project Management Institute, Inc.: Newtown Square, PA, USA, 2017. [Google Scholar]
- Salim, S.; Jo, R.; Lee, T.; Lee, J. Technology Readiness Level Assignment to Industrial Plant System Life Cycle. J. Korea Soc. Syst. Eng. 2015, 11, 1–11. [Google Scholar] [CrossRef] [Green Version]
- Rogers, E.M. Diffusion of Innovations, 5th ed.; Simon and Schuster: New York, NY, USA; ISBN 978-0-7432-5823-4.
- Things You Don’t Know Are Affecting Our Choices Every Day: The Science of Decision Making. Belle Beth Cooper. 2013. Available online: https://open.buffer.com/decision-making/ (accessed on 15 February 2020).
- Rosas, J.; Macedo, P.; Tenera, A.; Abreu, A.; Urze, P. Risk Assessment in Open Innovation Networks. In Risks and Resilience of Collaborative Networks. PRO-VE 2015. IFIP Advances in Information and Communication Technology; Camarinha-Matos, L., Bénaben, F., Picard, W., Eds.; Springer: Cham, Switzerland, 2015; Volume 463. [Google Scholar]
- Müller, J.M.; Buliga, O.; Voigt, K.-I. The role of absorptive capacity and innovation strategy in the design of industry 4.0 business Models—A comparison between SMEs and large enterprises. Eur. Manag. J. 2020, 39, 333–343. [Google Scholar] [CrossRef]


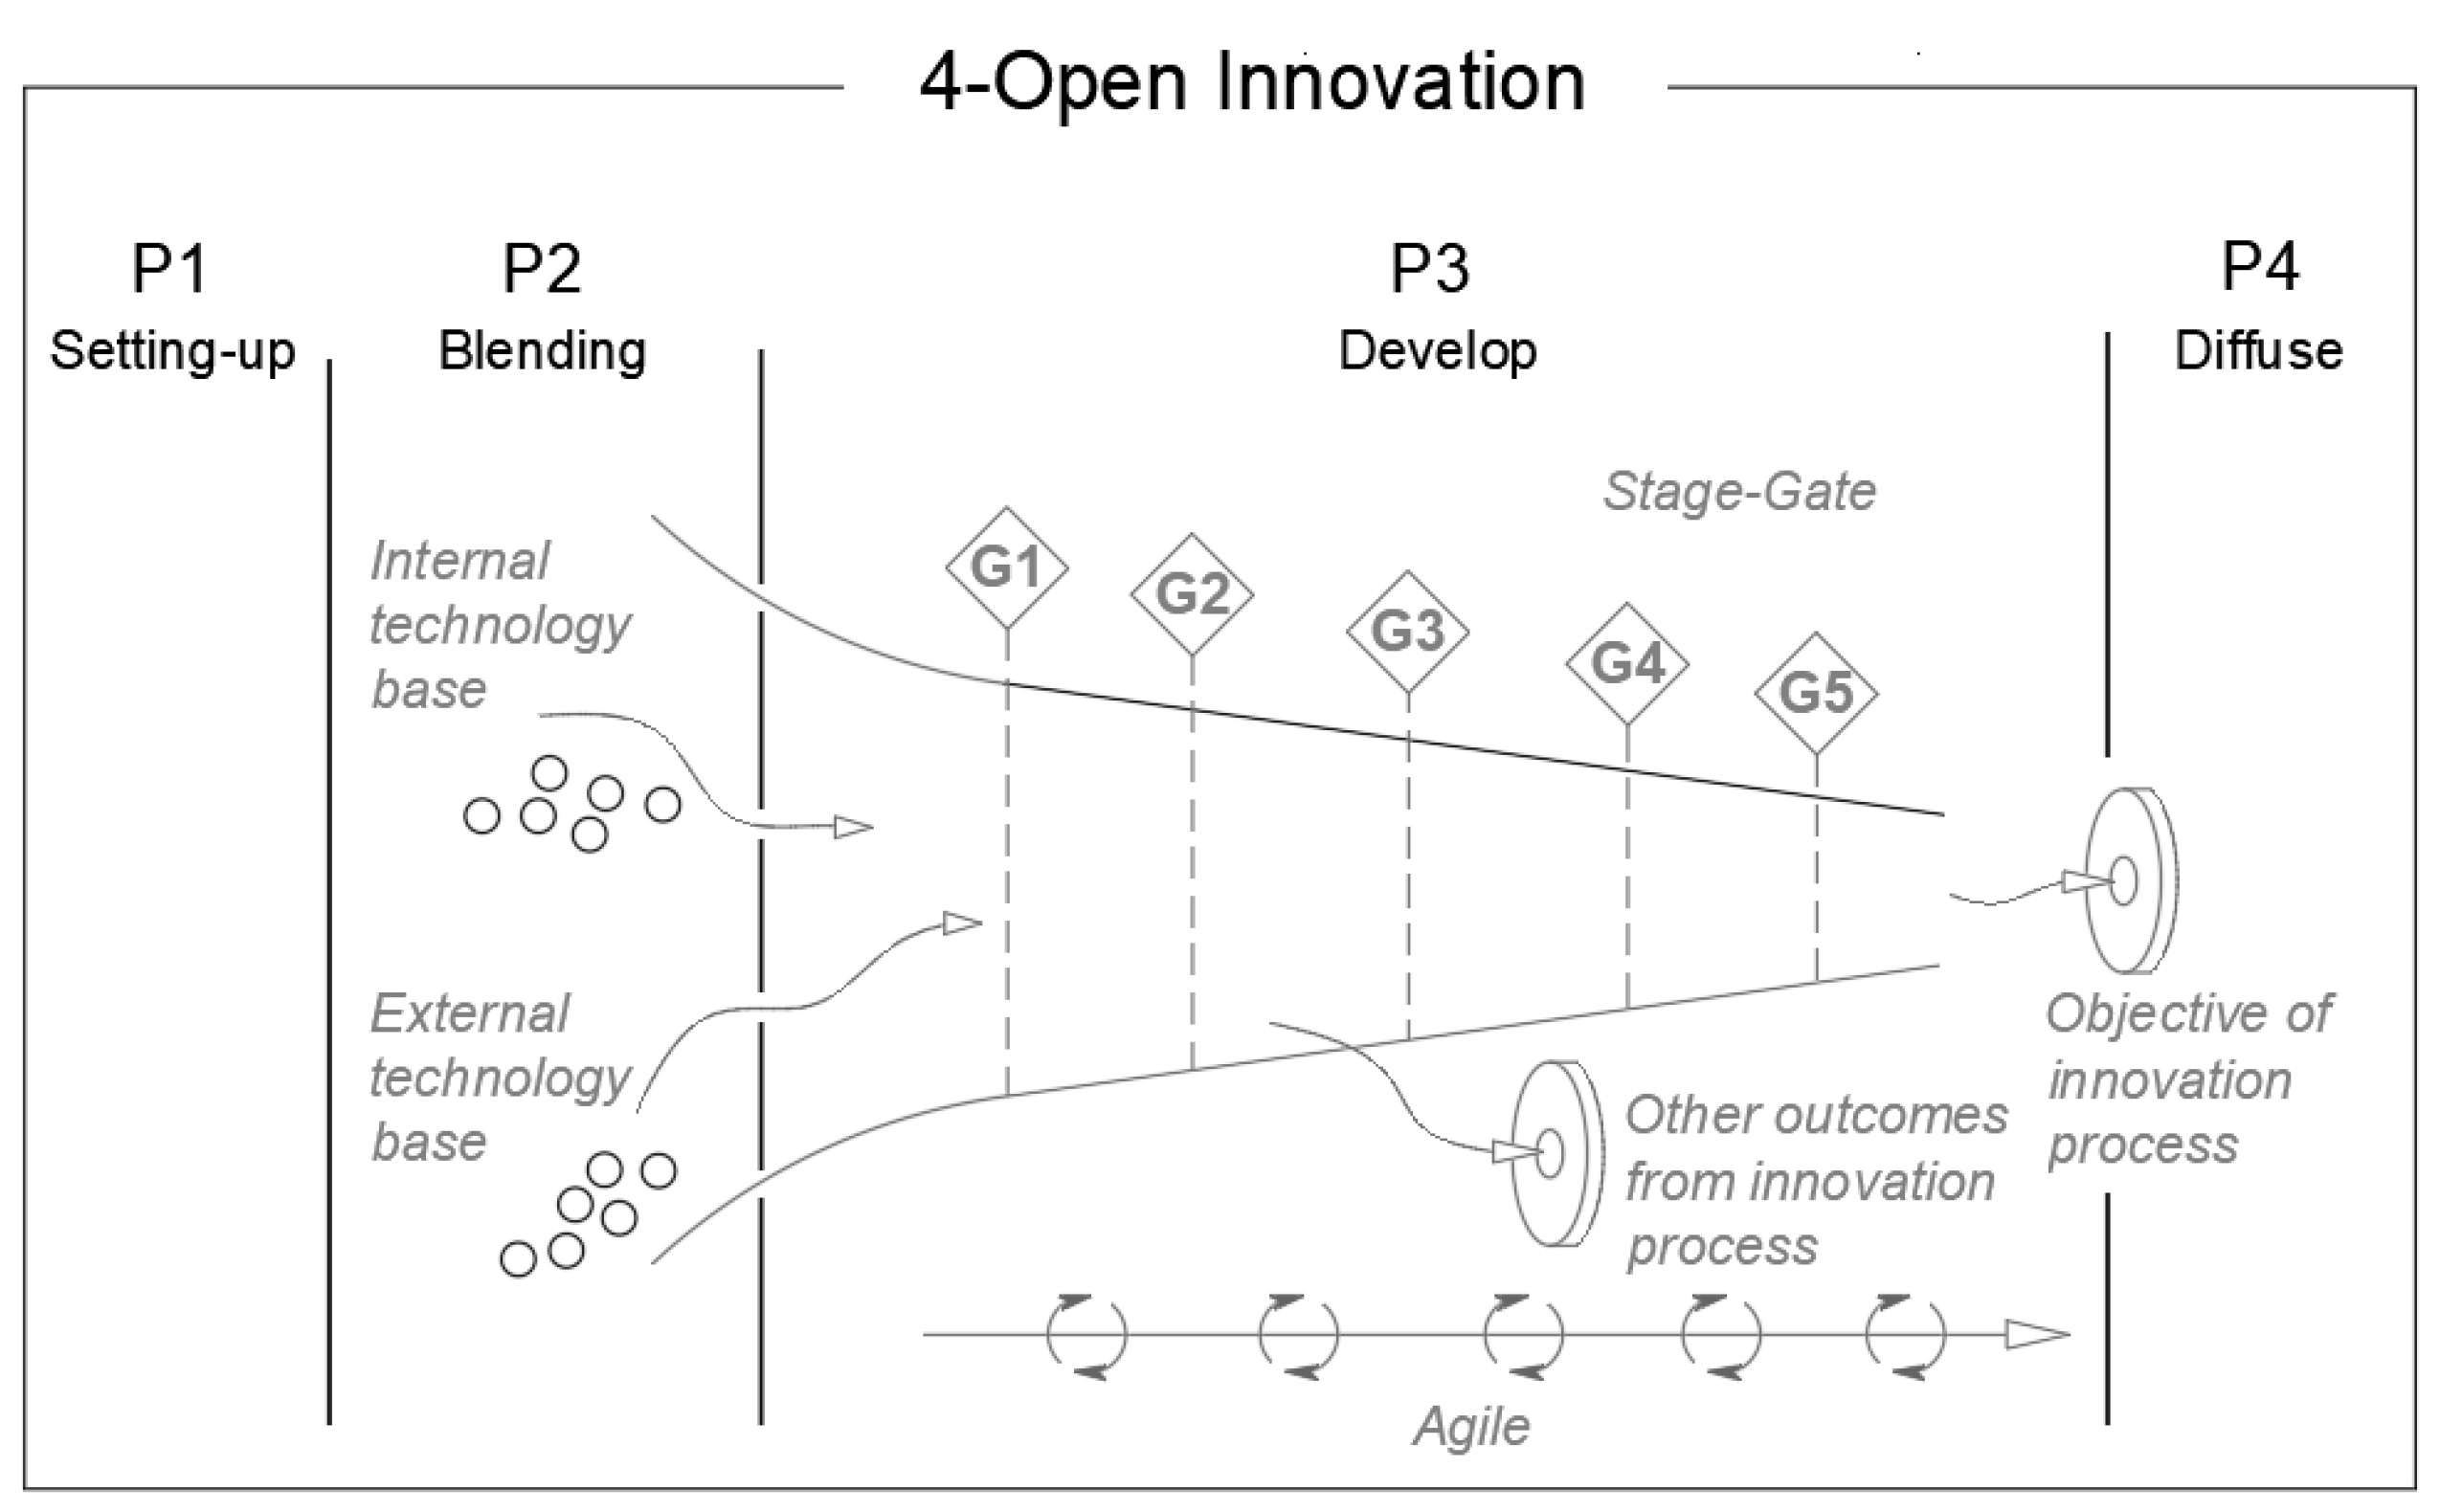
| Parts | Risks | Brief Description | Centrality Metrics | |
|---|---|---|---|---|
| 4-OI | Part 1: Setting-up | (1): Partner choice risks | Concerns the risk associated with choosing the right partners to engage in innovation initiatives regarding their credibility, competencies, or skills. | In-degree |
| Out-degree | ||||
| Part 2: Blending | (2): Task assignment risks | Concerns the risk associated with the assignment of innovation process tasks to chosen innovation partners. | In-degree | |
| Betweenness | ||||
| Part 3: Developing | (3): Behavioral risks | Concerns risks associated with the intra- and inter-cross-functional communication, information-sharing, and control across the innovation process. | In-degree | |
| Reciprocity | ||||
| Density | ||||
| Average degree | ||||
| Part 4: Diffusing | Concerns the forecasting of the adoption rate of the resulting product or process. | Out-degree |
| Model | Period | Type | Description | |
|---|---|---|---|---|
| Linear or Technology Push | 1950s–1960s | Linear | Simple linear sequential process. Emphasis on R&D and science exclusively. Innovation is essentially pushed by technology and science. No feedbacks (loops), no market attention, no networked interactions are included. | |
| Market Pull or Need | 1960s–1970s | Linear | Simple linear sequential process. Emphasis on marketing. The market is the source of new ideas for the R&D. Characterized by having no feedbacks (loops), no market attention, no networked interactions. | |
| Coupling | 1979 | Mixed | Combines push and pull models. Feedback and interaction of different elements are important to R&D and marketing. It has feedback between the different phases. | |
| Interactive | 1985 | Interactive | Combines push and pull models. Emphasis on external connections. Interactions take place with research institutions and markets (external connections). | |
| Integrated or Networked | End of 1980s | Simultaneous process with feedback loops also known as “Chain-linked Model”. Emphasis on knowledge accumulation and external connections (extensive networking). | ||
| Networking | 1990s | Interactive | System integration and networks (SIN). Emphasis on effective communication with the external environment. | |
| Open Innovation | 2000s | Interactive | Collaboration and multiple exploitation paths. Internal and external ideas can be combined to boost the development of new technologies and paths to market. | |
| Extended Innovation Network | Under development | Not well defined | Interactive | Combines network models and open innovation. Complex network models applying SNA. Includes crowdsourcing and free innovation. |
| Benefits | Limitations | |
|---|---|---|
| Closed Innovation Model |
|
|
| Open Innovation Model |
|
|
| Parts | Objectives | SNA Centrality Metrics | ||
|---|---|---|---|---|
| Part 1 | _a | Clearly define the problem or idea to be addressed by an open innovation approach. Define innovation dimensions and who will contribute with what competencies (R&D fields, HR, marketing, sales, and so on) as main organizational competency. | N/A | |
| _b | Which possible future partners have the highest nominations, links (directed or undirected (who speaks/writes good or bad from whom)), and exclusive competencies or skills (what they are really good, not so good, or bad at). | -In-degree [73] | ||
| (1) | ||||
| where: = total degree of an entity within a graph n = total number of entities within a graph for i = 1…, n xji = number of links from entity j to entity i, where i ≠ j, and vice-versa, function of directed or undirected graph | ||||
| Who nominates whom (who speaks/writes good or bad from whom) regarding exclusive competencies or skills (what they are really good, not so good, or bad at). | -Out-degree [73] | |||
| (2) | ||||
| where: = total out-degree of an entity within a graph n = total number of entities within a network (graph) for i = 1…, n xji = number of links from, only entity j to entity i, where i ≠ j, function of directed or undirected graph | ||||
| Part 2 | _a | Treat legal aspects such as RFIs (request for information), RfP (request for proposal), management of IP (intellectual property) (essentially regarding IP contamination such as IP background (any IP that is created by the owner before the date of the open innovation agreement)), IP foreground (is all the knowledge or intellectual property (assets) produced within the collaborative venture or open innovation project during the project’s tenure?), IP side-ground (is knowledge or intellectual property (assets) relevant to an open innovation project but produced outside the project by any of the partners during the project’s tenure?), and IP post-ground (knowledge or intellectual property (assets) that is relevant to a collaborative venture or open innovation project that is produced by any of the partners after the project ends). Signing NDAs (non-disclosure agreements), setting of OIAs (open innovation accelerators), writing of a JDA (joint development agreement), and planning innovation jams (structured brainstorming activities which include reward-based incentives, where elements from all divisions of an organization should participate, usually ending up with the writing of RfPs). | N/A | |
| _b | Who are the informal innovative-mindset key people that, by the advantage of their location within the open-innovation ecosystem network, better leverage the OI network social capital? | (1) | ||
| Who are the informal innovative-mindset key people that connect different pockets (silos) of the organization or between different organizations that aggregate different know-hows and perspectives (diversity and inclusion principle)? | -Betweenness [73] | |||
| (3) | ||||
| where: is the number of geodesics (shortest path between any two entities) linking two actors that contain actor i n = total number of entities within a network (graph) for i = 1…, n Alternative calculation is analyzing the location of a node regarding how betweenness is from two different entities (organizations, organizational departments, and so on) from a visual perspective. | ||||
| Part 3 | _a | Who has a disproportionate incoming request from the innovation ecosystem? Who is less or more dependent on vital information to accomplish open innovation activities or tasks? Are there signs of bottlenecking within the OI network? Peripherical people—feeling aside from the process? | (1) | |
| Who is dependent on whom regarding information to push further the open innovation tasks and activities? | (2) | |||
| Are requests, questions, or information regarding open innovation vital information being timely answered or provided among the participants within the innovation ecosystem? Is the communication done one-way or is there feedback? | Reciprocity [73] | |||
| (4) | ||||
| where: = number of links pointing in both directions L = total nr of links in a graph | ||||
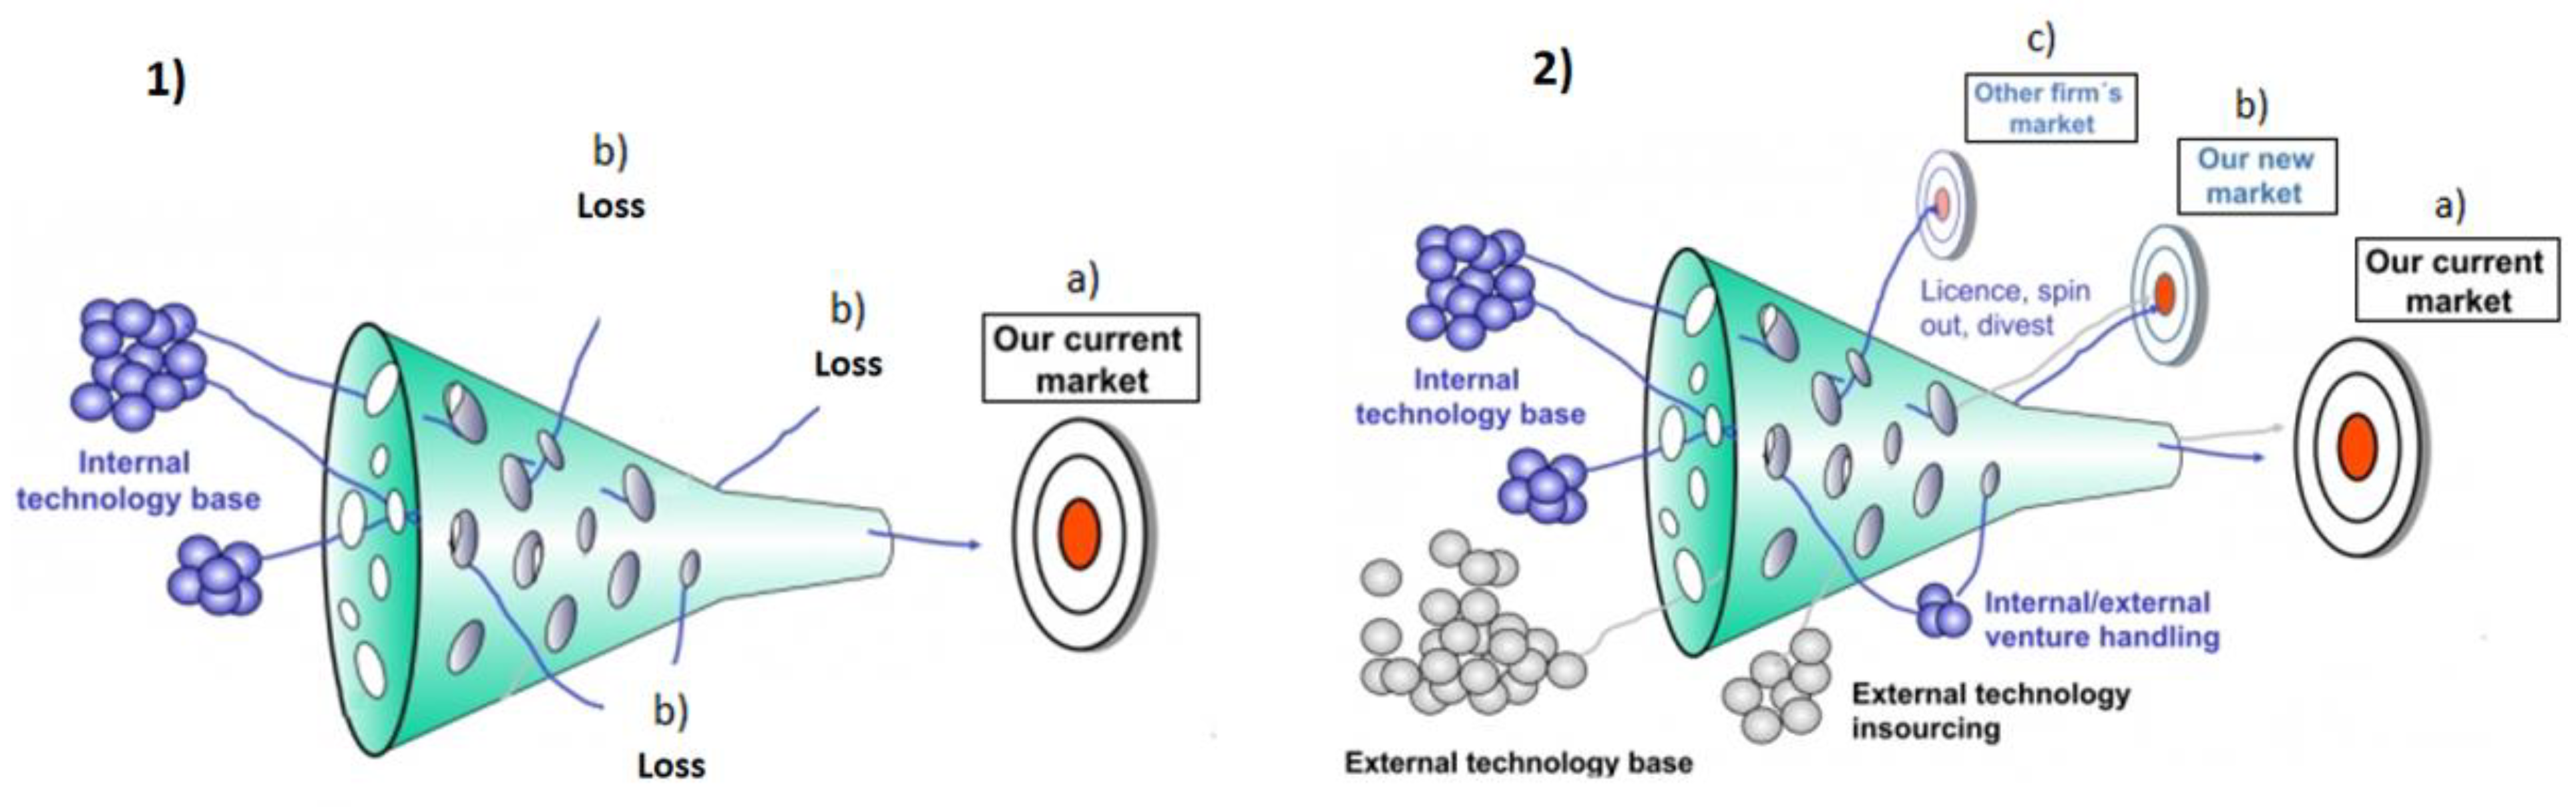
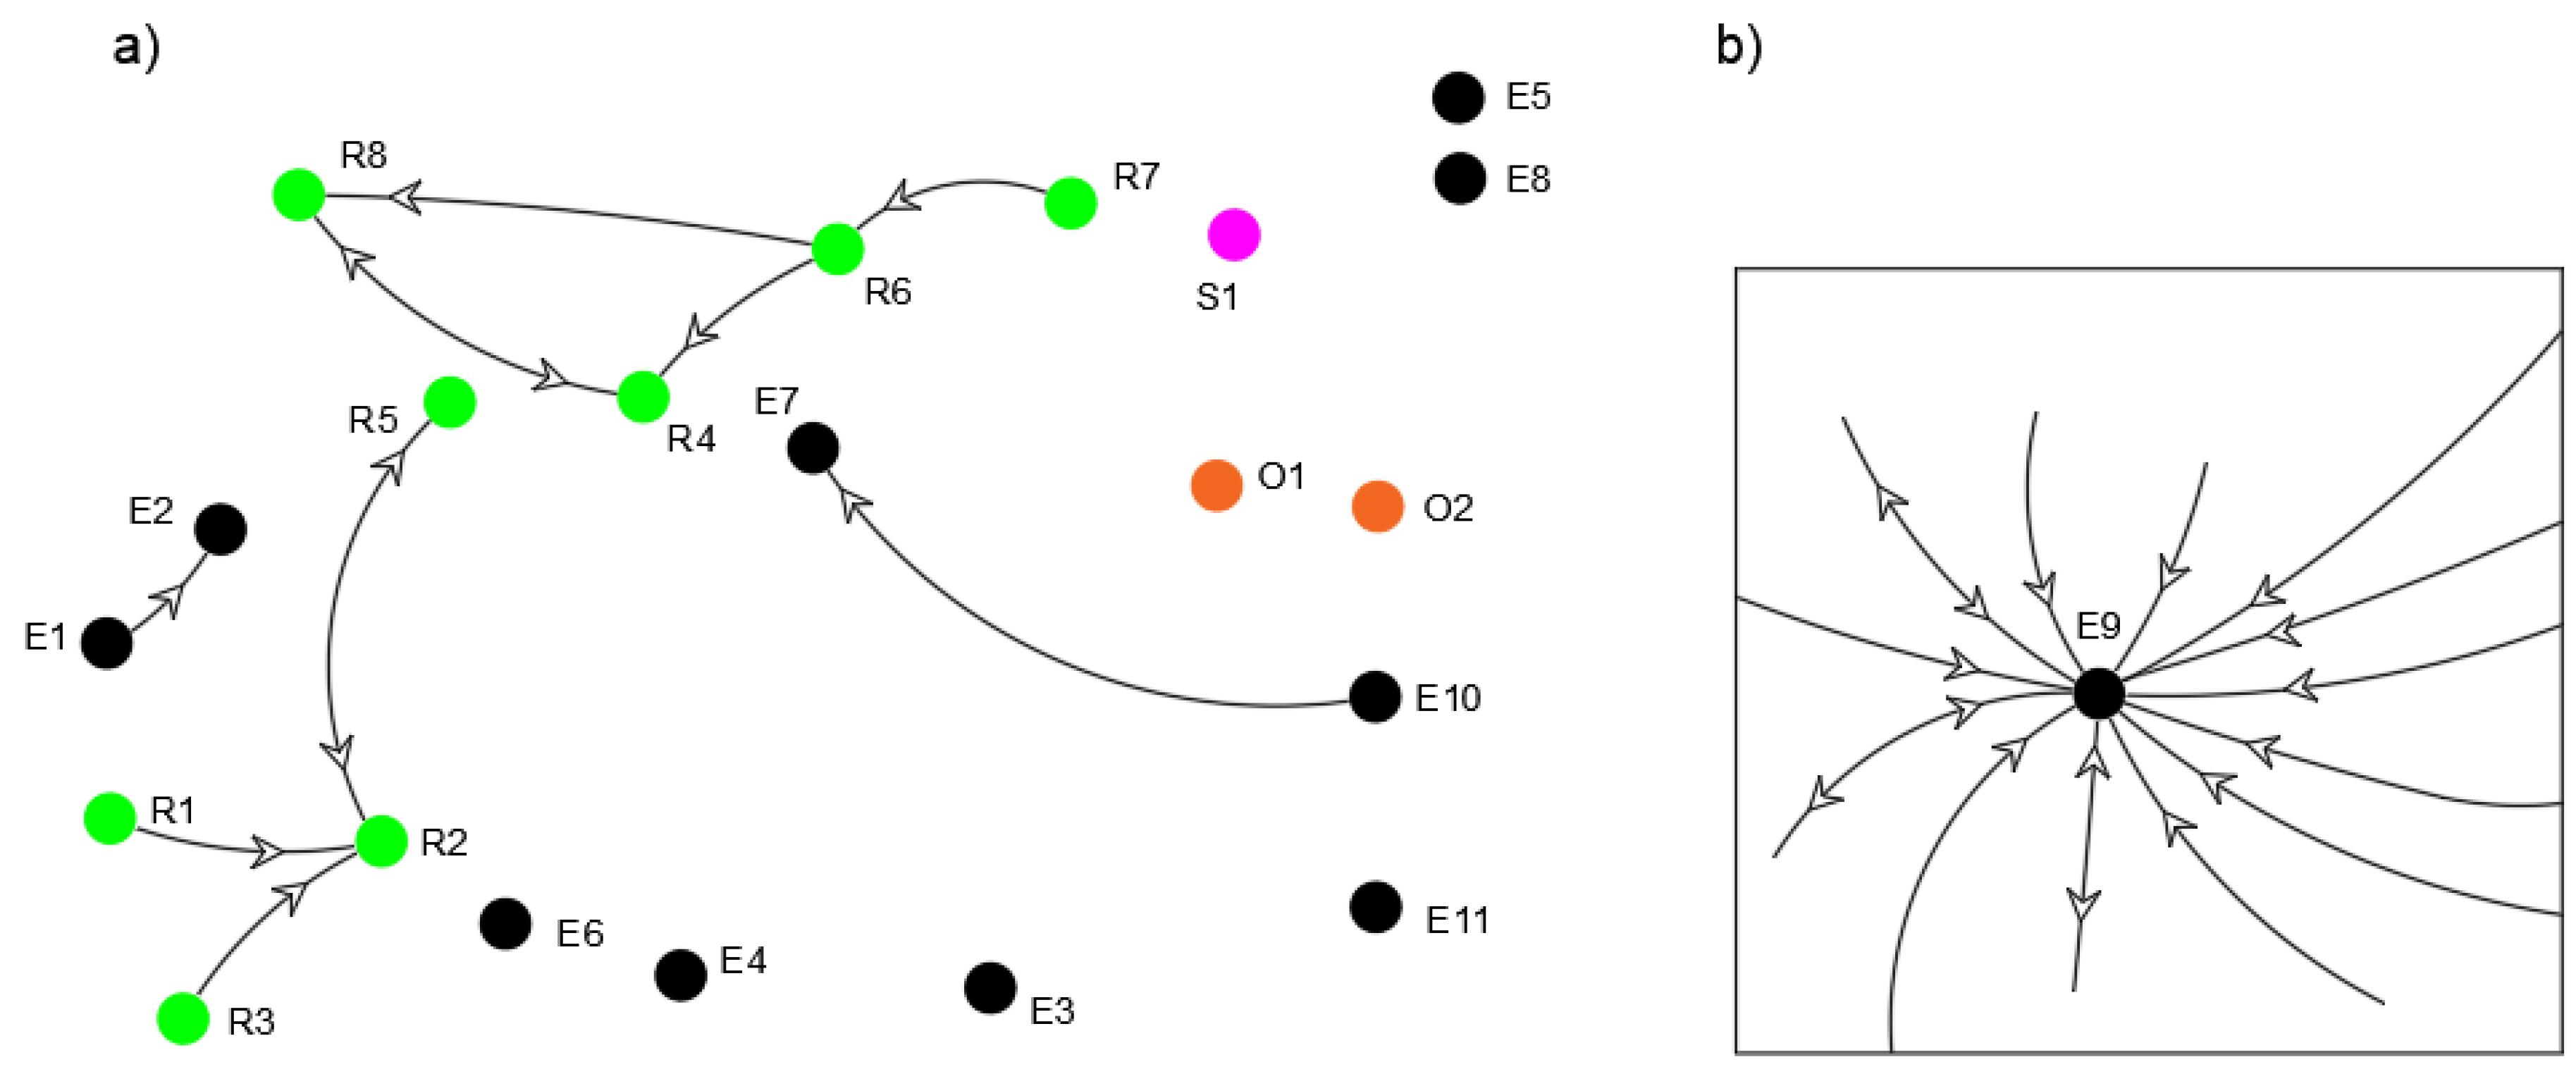
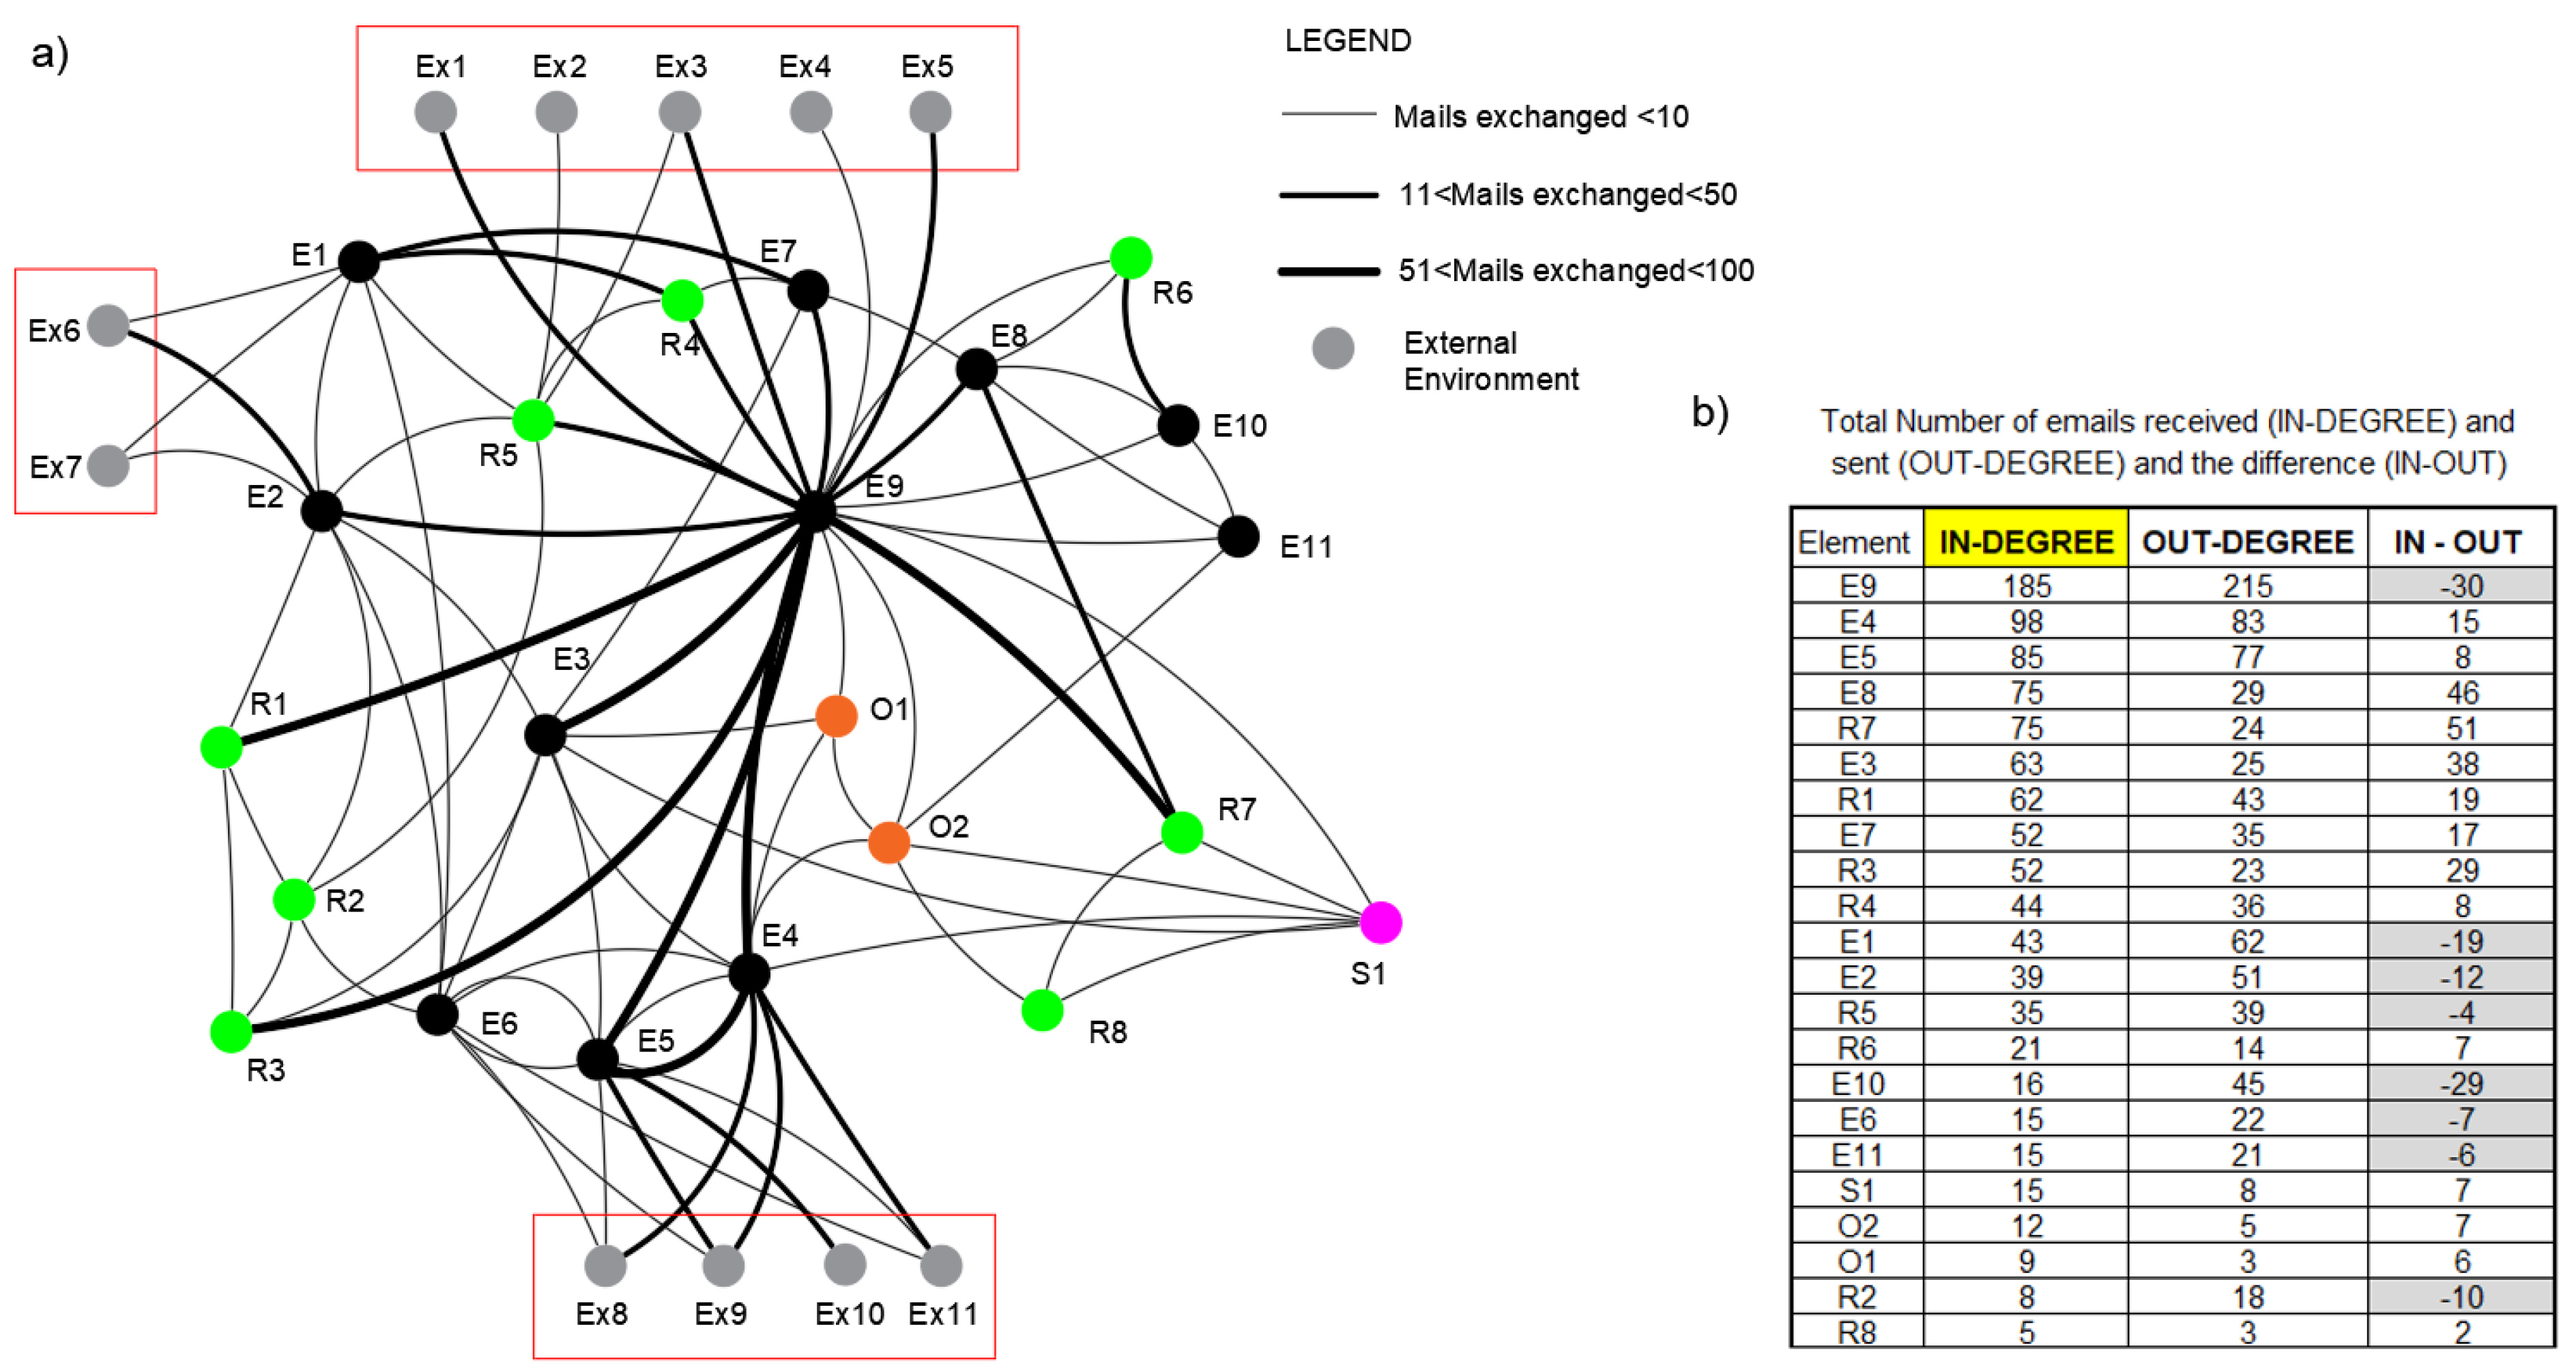
| Is the open-innovation email network exchange communication too centralized? Does the information flow through all the participants in the open innovation initiative? Is there enough reach regarding the “spreading of the news” concerning new developments or findings that can be used for other purposes, as illustrated in Figure 4(2), which characterizes the three possible targets in an open innovation scenario (other firm’s market, our new market)? | Density [73] | |||
| (5) | ||||
| where: | ||||
| (5a) | ||||
| n = number of entities within a graph | ||||
| Another measure to countercheck the density measure, regarding how centralized the email communication network is. | Average degree [73] | |||
| (6) | ||||
| where: = average degree n = total number of entities within a network (graph) = total degree = | ||||
| Part 4 | _a | Who and how many are nominated in a positive way regarding the adoption of the result of the innovation initiatives (product or service)? From those nominated at the in-degree, who would they likely further recommend the adoption to as the result of the innovation initiatives (product or service)? | (2) | |
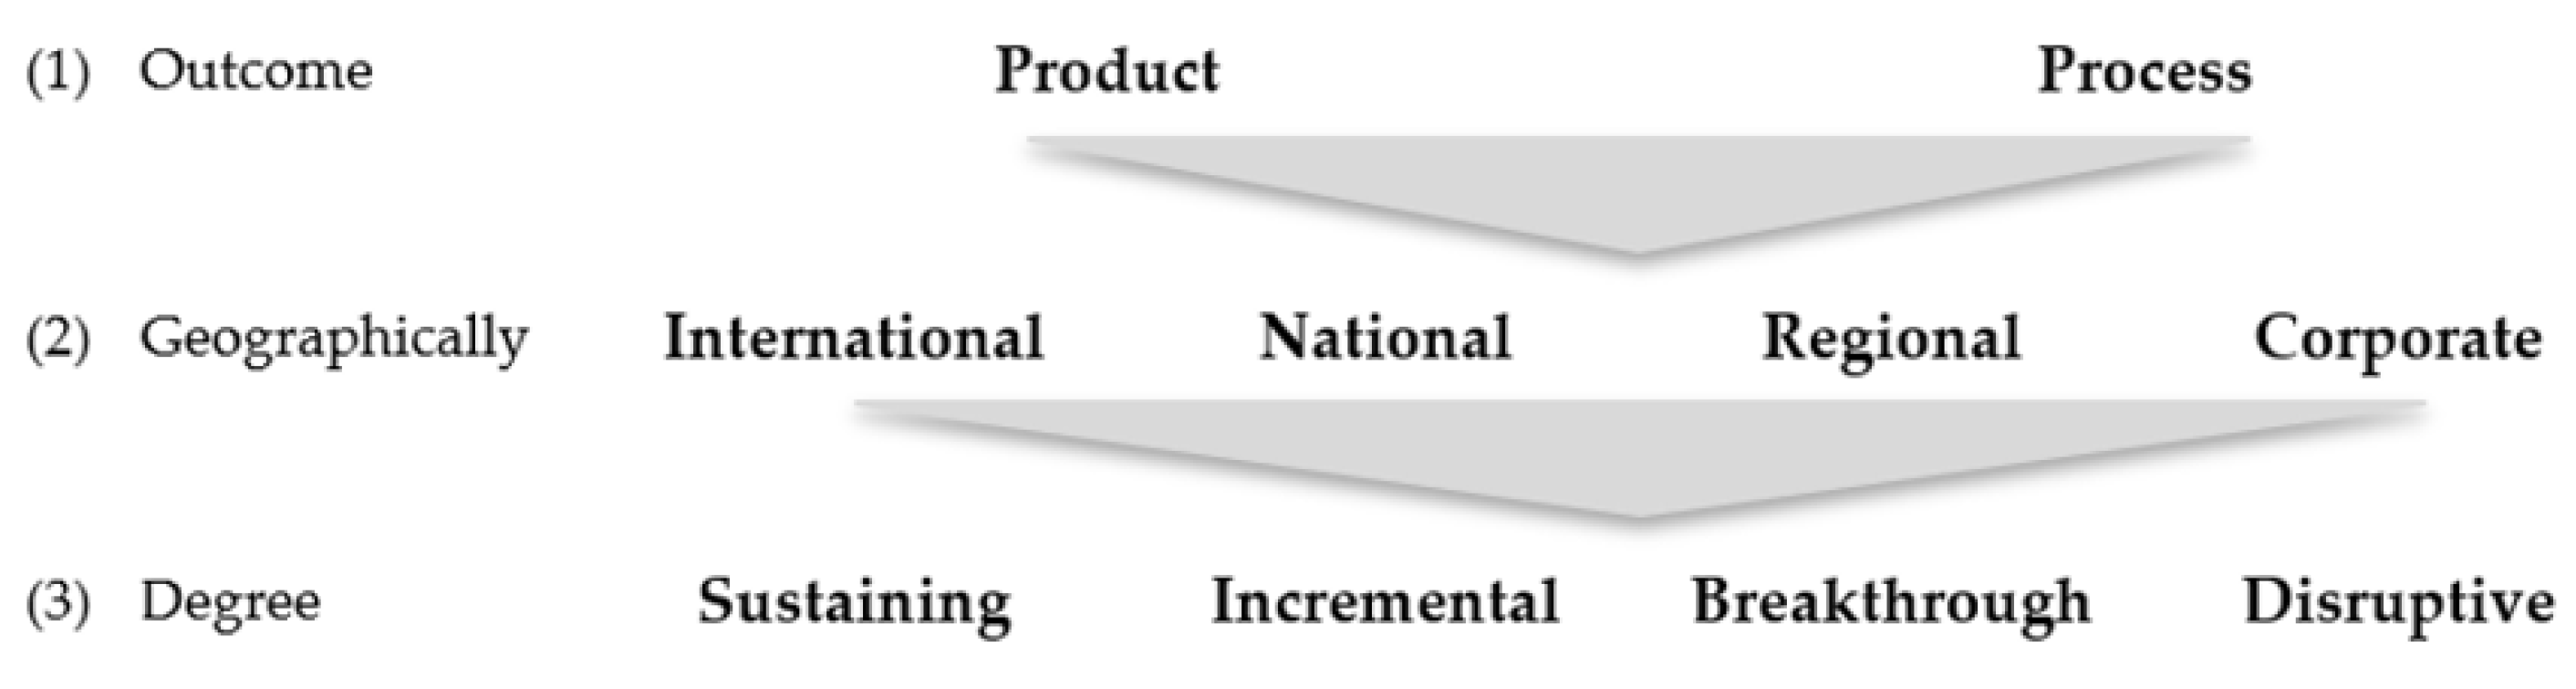
| Product | Process | |||||
 | ||||||
| International | National | Regional | Organizational | |||
| ||||||
| Sustaining | Incremental | Breakthrough | Disruptive | |||
| ||||||
| Virtual | Physical | Combined | ||||
| ||||||
| Intra-Org. | Inter-Org. | Experts | World-Wide | |||
| R&D | X | X | ||||
| Engineering | X | X | ||||
| Metric/Organization | MNE3 | SME1 | MNE4 | SME6 | SME2 | SME3 | SME4 | SME5 |
|---|---|---|---|---|---|---|---|---|
| In-degree (1) | 8 | 2 | 10 | 8 | 8 | 2 | 1 | 9 |
| Out-degree (2) | 6 | 0 | 5 | 0 | 6 | 0 | 0 | 0 |
| Actor | Dept. | In-Degree (1) | Competencies | Betweenness (Alternative: between Departments) (3) |
|---|---|---|---|---|
| R4(R3) | R&D | 5 | C2 | Low or zero |
| R6(R2) | R&D | 4 | C2 | Very high |
| R3(R1) | R&D | 3 | C1, C2 | Very high |
| E1(E3) | Eng. | 4 | C2 | Very high |
| E2(E4) | Eng. | 5 | C2 | Very high |
| E4(E5) | Eng. | 6 | C1, C2, C3 | Low or zero |
| E8(E6) | Eng. | 6 | C2 | Low or zero |
| E9-Eng. | R2-R&D | R4-R&D | R5-R&D | R8-R&D | R6-R&D | E7-Eng. | |
|---|---|---|---|---|---|---|---|
| In-degree | 13 | 4 | 2 | 2 | 2 | 1 | 0 |
| Out-degree | 3 | 2 | 2 | 1 | 1 | 2 | 2 |
| Actors | E9 | E4 | E5 | E8 | R7 | E3 | R1 | E7 | R3 | R4 | E1 |
|---|---|---|---|---|---|---|---|---|---|---|---|
| R(h.) | 32 | 15 | 3 | 6 | 21 | 17 | 9 | 16 | 24 | 8 | 7 |
| Actors | E2 | R5 | R6 | E10 | E6 | E11 | S1 | O2 | O1 | R2 | R8 |
| R(h.) | 11 | 8 | 7 | 6 | 9 | 15 | 13 | 10 | 16 | 0 | 0 |
| Department/Actor | E1 | E2 | E3 | E4 | E7 | E8 | E9 | E10 | R1 | R3 | R4 | R5 | R6 | S1 |
|---|---|---|---|---|---|---|---|---|---|---|---|---|---|---|
| Out-degree | 4 | 3 | 2 | 2 | 2 | 1 | 2 | 1 | 4 | 4 | 2 | 2 | 1 | 4 |
Disclaimer/Publisher’s Note: The statements, opinions and data contained in all publications are solely those of the individual author(s) and contributor(s) and not of MDPI and/or the editor(s). MDPI and/or the editor(s) disclaim responsibility for any injury to people or property resulting from any ideas, methods, instructions or products referred to in the content. |
© 2023 by the authors. Licensee MDPI, Basel, Switzerland. This article is an open access article distributed under the terms and conditions of the Creative Commons Attribution (CC BY) license (https://creativecommons.org/licenses/by/4.0/).
Share and Cite
Nunes, M.; Bagnjuk, J.; Abreu, A.; Cardoso, E.; Smith, J.; Saraiva, C. Managing Collaborative Risks of Integrated Open-Innovation and Hybrid Stage-Gate Model by Applying Social Network Analysis—A Case Study. Sustainability 2023, 15, 5474. https://doi.org/10.3390/su15065474
Nunes M, Bagnjuk J, Abreu A, Cardoso E, Smith J, Saraiva C. Managing Collaborative Risks of Integrated Open-Innovation and Hybrid Stage-Gate Model by Applying Social Network Analysis—A Case Study. Sustainability. 2023; 15(6):5474. https://doi.org/10.3390/su15065474
Chicago/Turabian StyleNunes, Marco, Jelena Bagnjuk, António Abreu, Edgar Cardoso, Joane Smith, and Célia Saraiva. 2023. "Managing Collaborative Risks of Integrated Open-Innovation and Hybrid Stage-Gate Model by Applying Social Network Analysis—A Case Study" Sustainability 15, no. 6: 5474. https://doi.org/10.3390/su15065474