Article

Passenger Satisfaction Evaluation and Achieving Sustainable Integrated Urban Transport: Structural Equation Analysis Based on Macau Data

Institute for Research on Portuguese-Speaking Countries, City University of Macau, Macau 999078, China
*
Author to whom correspondence should be addressed.
Sustainability 2023, 15(6), 5463; https://doi.org/10.3390/su15065463
Submission received: 9 February 2023 / Revised: 15 March 2023 / Accepted: 15 March 2023 / Published: 20 March 2023

Abstract

:
The sustainable development of urban transport is the key to sustainable urban development. This study analyses and identifies the evaluation indicators affecting Macau’s transport, and analyses the relationship between the relevant evaluation indicators and passenger satisfaction, thus contributing to the improvement and the sustainable development of Macau’s public transport services. This study uses a questionnaire to collect data. Based on the current situation of Macau’s social groups, the mainland students in Macau who were selected as the target group are significantly different from residents and tourists in Macau; their needs and perceptions of public transport are more intense. This group’s needs and perceptions of public transport are significantly different from those of residents and tourists. The set indicators of satisfaction with public transport in Macau reflect them. After analyzing and determining the evaluation indicators, structural equation modeling was applied to establish the structural models of Macau’s three public transport services. Finally, the shortcomings of the three public transport services were reflected through the standardized coefficient weights and passenger satisfaction. The study results show that the seating arrangement and smoothness of travel of Macau’s public transport services need to be improved, and the dial-a-ride service’s price setting and waiting time need to be improved. The price setting, convenience of hailing, and payment method of the taxi service need to be improved. In contrast, overall, the satisfaction level of the dial-a-ride service is significantly higher than that of the taxi service. Therefore, the findings of the study have important policy implications for relevant policymakers, who should not only focus on optimizing daily operations but, more importantly, on improving the shortcomings mentioned above, which are of great value in enhancing the passengers’ perception of public transport in Macau and are also crucial to achieving the sustainable development of public transport in Macau.

1. Introduction

With the rising pressure for further studies in the mainland and the increasing popularity of Macau institutions, the number of mainland students studying in Macau continues to expand. According to relevant data, the number of mainland students studying in Macau in 2020 rose by 15.61% compared to 2019 and 24.23% compared to 2018. The number of mainland students studying in Macau is gradually increasing, and mainland students are becoming an increasingly significant group in Macau [1]. Macau has many unique features for student life compared to other countries or regions. Due to the close connection between Guangdong and Macau, mainland students in Macau can choose to live in Zhuhai or Macau, but, in either case, taking public transport within Macau is bound to be the first choice for mainland students. Moreover, the long time spent studying in Macau also gives the international student community a deep understanding of public transport in Macau. Compared to tourists or Macau residents, mainland students are more concerned about the route setting, price, comfort, and safety of public transport in Macau, and their evaluation is somewhat representative. Public transport is a critical factor in achieving sustainable development in cities and metropolitan areas and is one of the most critical indicators for achieving sustainable urban development [2].
This paper takes Macau mainland students as the research object, and, based on a thorough study of domestic and international references, it establishes a satisfaction index model of public transport, including public transport, taxis, and Macau dial-a-ride, based on the satisfaction index model of Macau mainland students. It further determines the latent and explicit variables of the model by combining domestic and international studies on public transport satisfaction, and at the same time carries out a structural equation model based on the satisfaction evaluation model of international students, which was established through the hierarchical analysis of the structural equation model. Following this, the satisfaction of public transport passengers was evaluated, and the final satisfaction evaluation results were obtained. The satisfaction level of international students in Macau reflects the quality of public transport services in the city. The evaluation of these students’ satisfaction level helps to identify this group’s needs and satisfaction level in terms of public transport services and to identify the shortcomings of public transport in Macau. This will help improve the quality of public transport services and strengthen Macau’s reputation and core competitiveness as a world-renowned metropolis.

2. Theoretical Background and Research Hypothesis

2.1. Public Transport Satisfaction

The theoretical core of the design of the public transport satisfaction model can be traced back to the American theory of the customer satisfaction model. The level of customer expectations of the product, the effect of the customer’s perception after the experience, and the degree of effort put in by the customer to obtain the product are the three leading indicators that affect customer satisfaction [3]. Customer satisfaction is described by the relationship between customers’ idealized perceptions of services or goods in the early stages and their real feelings in the later stages [4,5]. Since then, scholars have constructed the Swedish Customer Satisfaction Model (SCSB) [6], the American Customer Satisfaction Model (ACSI) [7], the European Customer Satisfaction Model (ESCI) [8], the Norwegian Customer Satisfaction Model (NCSB) [9], the Brazilian Customer Satisfaction Model [10], the Chinese Customer Satisfaction Model [11], et al. However, the available content is similar. For example, the American Customer Satisfaction Model is based on the Swedish Customer Satisfaction Model and consists of six latent and fourteen explicit variables, other cause variables (customer expectations, perceived value, and perceived quality), and outcome variables (customer complaints, customer loyalty). The European Customer Satisfaction Model is based on the American Customer Satisfaction Model, adding the latent variable (corporate image) and removing the latent variable (customer complaints) from the American Customer Satisfaction Model. In contrast, the cause variables consist of corporate image, customer expectations, hardware quality, software quality, and perceived quality, and the outcome variables only retain customer loyalty. The Chinese Customer Satisfaction Model, initially spearheaded by Tsinghua University, consists of six latent variables (corporate image, expected quality, perceived quality, perceived value, customer satisfaction, and customer loyalty). The Chinese Customer Satisfaction Model is characterized by its abstraction and simplicity; however, there are still limitations in explaining Chinese customer satisfaction.

2.2. Types of Public Transport Available in Macau

The four existing modes of public transport in Macau are buses, radio taxis, taxis, and light rail. The first three are the most frequently used; the LRT has only one line in Macau, so its accessibility is low. The average daily number of passengers carried is only 4750 (February 2023), which is much lower than the average daily number of passengers carried by buses (450,000) and taxis (30,000) [12,13]; therefore, this article does not discuss the LRT.
Public transport in Macau is mainly operated by the Macau New Welfare Bus Company and the Macau Bus Company Limited, with 955 buses operating 85 bus routes and 434 bus stops. The distribution varies from region to region, with bus stops being relatively densely distributed on the Macau Peninsula, relatively evenly distributed in Taipa, and more sparsely distributed in Coloane, which is related to Macau’s urban construction planning and population distribution. The bus fare in Macau is MOP 6, and the concessionary fare is MOP 3. Students enjoy a concessionary price of MOP 1.5 to MOP 2, which is one of the reasons why more students choose to take public transport to and from their schools and residences. There are two types of taxis in Macau: regular taxis and radio taxis. The difference between the two is the method of calling a taxi, which, for radio taxis, can be done using mobile devices such as mobile phones, while regular taxis still use the traditional “stop and go” method. Secondly, the vehicles used to operate the two types of taxis are also different, with the radio taxis using more spacious commercial vehicles and the ordinary taxis being compact cars. The fares for both types of taxis are the same, divided into the regular fare and the surcharge, with MOP 19 for 1600 m, MOP 2 for each 240 m extension, and MOP 3 for each piece of luggage [14]. Therefore, the advantages and disadvantages of public transport, radio taxis, and taxis (as shown in Table 1) are different, and different travel purposes and travel distances will affect the choice of travel modes of the riders. Therefore, reasonably optimizing the operation of different public transport travel modes, so that the three can develop in a better and more coordinated manner, is crucial for the sustainable development of public transport in Macau.

2.3. Satisfaction Factors

2.3.1. Comfort of Public Transport

Comfort is the most intuitive feeling when traveling on public transport, and the comfort level can directly affect the passenger experience [15]. A direct relationship exists between comfort and overall travel satisfaction [16]. Studies on the comfort of public transport have found that men and women have polarized perceptions of comfort, with men tending to show more negative emotions than women [17]. Women are more comfortable with comfort [18,19]. Of course, not all available studies have shown gender differences in comfort [20,21]. Taken together, this paper argues that it is necessary to use gender as a differentiating factor for respondents to reduce the interference of gender differences in satisfaction with the ride.

2.3.2. Safety of Public Transport

Safety is one of the most critical issues affecting public transport satisfaction and is essential to passengers [20,22]. It has been found that only 10% of people choose to take public transport when they feel unsafe [23], and people’s perception of the safety of public transport directly influences their choice of public transport [24]. Public transport safety is a more significant concern than crime on public transport, and can reduce the likelihood of traffic accidents to a certain extent [25,26]. The smoothness of public transport operations is an essential factor in passenger satisfaction.

2.3.3. Price of Public Transport

Price is another critical factor influencing passengers’ choice of public transport [15,27]. In modern urban developments, parking has become a problem for most people [28]. However, the development of public transport has reduced the need for private cars and greatly facilitated people’s travel. Nevertheless, the price factor influences people’s choice of public transport, as the prices of different public transport modes are different. For example, there is a considerable difference between the price of a bus and a taxi. Therefore, people choose between different modes of public transport for different purposes and travel distances, and price is an important consideration.

2.3.4. Other Factors of Public Transport

In addition to the three factors of comfort, safety, and price mentioned above, studies have found that service frequency [29,30], congestion [31], accessibility [32], punctuality [33], and waiting time [34] all have a certain degree of influence on public transport satisfaction. Therefore, the factors affecting public transport satisfaction are connected, and any deficiency in any of them will harm passengers’ perceptions. Improving systemic service quality is the key to achieving sustainable development of public transport.

2.4. Research Hypotheses

This paper aims to explore ways to achieve sustainable public transport development and facilitate the realization of Macau’s long-term plan to become a world tourism center. Therefore, we need to explore what factors are critical to public transport satisfaction in Macau and how they should be improved in the future. According to existing studies, factors such as comfort, safety (smoothness of travel), and price are essential factors that influence the sustainable development of public transport in the city.
In Macau, the three main types of public transport are buses, taxis, and radio taxis. According to existing research, the choice of transport affects people’s satisfaction with the city [35], so we distinguish between different modes of transport and propose different hypotheses. It is hypothesized that the safety of Macau’s public transport (smoothness of travel) is a significant factor affecting passenger satisfaction. The smoothness of Macau’s public transport will increase passenger satisfaction with Macau’s public transport. On the contrary, the unevenness of Macau’s public transport will significantly affect passenger satisfaction. Similarly, the smoothness of Macau’s taxis and radio taxis will also affect passenger satisfaction. Therefore, it is hypothesized that (H1): the smoothness of public transport in Macau has a negative impact on passenger satisfaction. Macau’s taxis and radio taxis operate similarly to each other, but, as previously described, the payment method of Macau’s taxis is single and only allows payment in MOP, which to some extent affects the choice and feelings of passengers. This leads to hypothesis (H2): the payment method of Macau’s taxis negatively influences passenger satisfaction. In addition, there is a significant difference between the hailing method of Macau’s taxis and radio taxis, with radio taxis being more straightforward to take than regular taxis. Therefore, the hailing method is an essential factor influencing passenger satisfaction with radio taxis. Hence, hypothesis (H3): the hailing method of Macau’s radio taxis positively affects passenger satisfaction.

3. Model and Indicator Determination

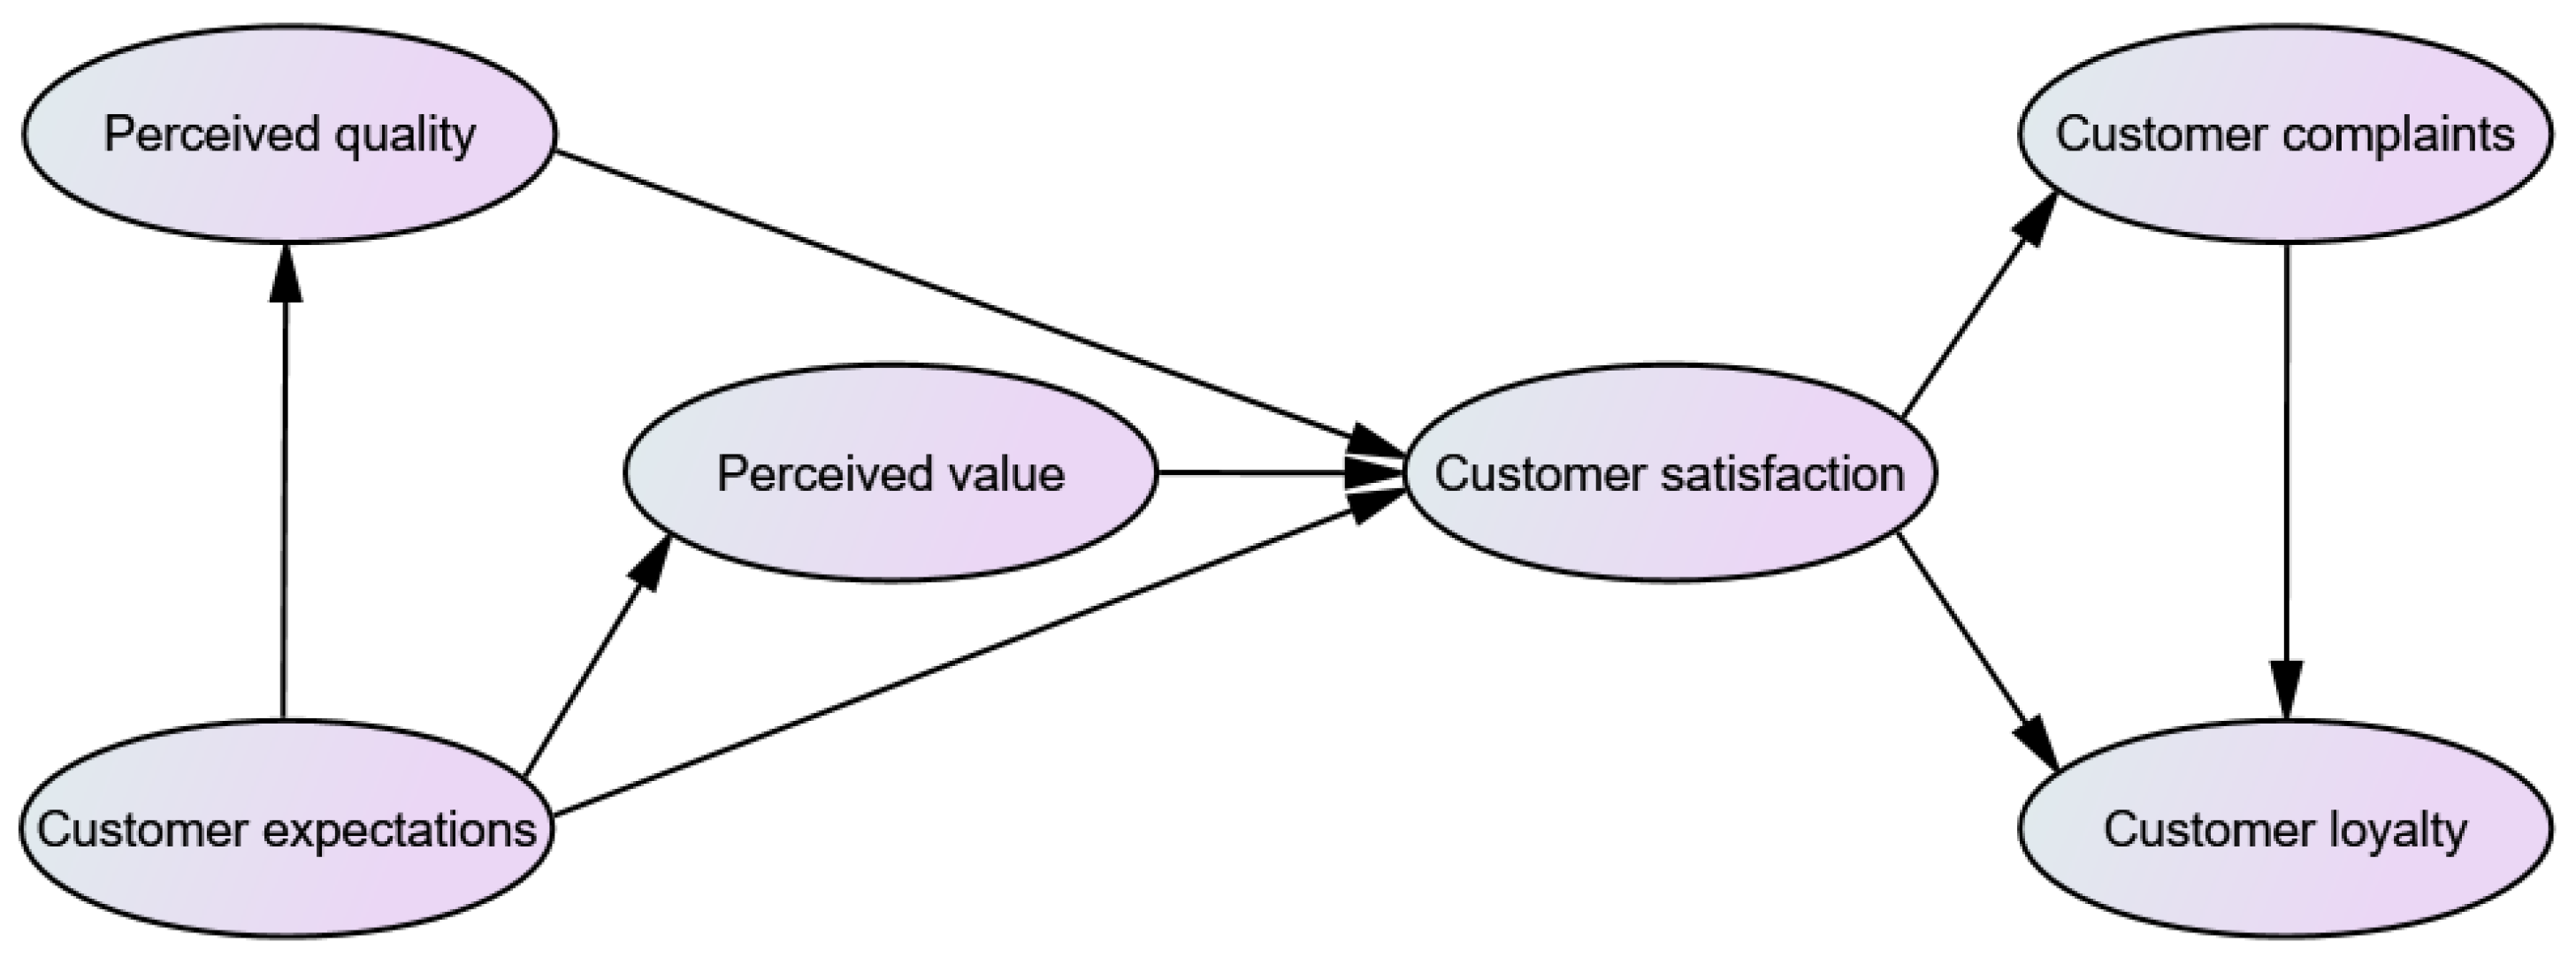
3.1. Determination of the Public Transport Satisfaction Model

The public transport satisfaction model evolved from the customer satisfaction model, which refers to the satisfaction or dissatisfaction effect formed after using a product or enjoying a product service, concerning the after-use feeling of a product [3,4]. The most complete and systematic customer satisfaction index model is the American Customer Satisfaction Index (ACSI) [7], which consists of six components: customer expectations; perceived quality; perceived value; customer complaints; customer loyalty; and customer satisfaction. The model’s structural relationship is shown in Figure 1.
The model consists of two parts: latent variables and explicit variables. The latent variables refer to variables that cannot be directly observed and need to be described with the help of some subtle measurement indicators. In contrast, specific evaluation indicators are called explicit variables. The correlation between different factors can be analyzed by analyzing the complex relationships between latent variables, and between latent and explicit variables.

3.2. Determination of Public Transport Satisfaction Indicators

By summarizing existing research on the key aspects of public transport services, it was found that passengers consider travel speed, punctuality, price, and safety to be critical factors influencing passenger satisfaction with public transport [36]. Furthermore, passengers’ satisfaction with public transport changed significantly over time [19]. Riders who use public transport more frequently are more satisfied overall. Among the factors that define public transport satisfaction, access to information about public transport operations is related to how quickly and easily passengers can find their way from their origin to their destination and find a satisfactory route that meets their preferences based on the travel time required [37]. Good public transport tips can improve passenger satisfaction [38]. In addition, passenger satisfaction is influenced by the level of hygiene and crowding on the bus [31,39]. In this study, we designed a system of 12 indicators for evaluating public transport satisfaction, including route setting.
In contrast to the 12 indicators used to evaluate public transport, crowding, transfer time, frequency, and route setting do not apply to taxis and radio taxis. The development of taxi apps has contributed to passenger satisfaction [40,41]. Comfort and smoothness of the journey are also significant factors affecting taxi passenger satisfaction [42]. In addition, communication with the driver was considered a separate indicator, given the significant difference between the Cantonese-speaking habits of Macau and the Mandarin-speaking habits of students from mainland China. As mentioned above, there is a difference in the hailing of taxis between radio taxis and regular taxis, so two separate indicators are set for the ease of hailing and the waiting time. Therefore, six indicators are included for each of the two types of taxis: communication and smoothness. All indicators are shown in Table 2.

4. Questionnaire Design and Analysis

4.1. Questionnaire Design

All the information used in this study comes from field research. Based on the reference to existing literature journals and excellent master’s theses related to satisfaction with urban public transport, we designed our own “Questionnaire on Satisfaction of Macau Mainland Students with Public Transport in Macau”.
As mentioned earlier, there are differences between male and female students in their satisfaction ratings of the same means of transport, with females demanding more comfort [18,19]. Significant differences in passengers’ satisfaction with public transport can also occur over time. It has also been shown that established travel habits impact an individual’s choice of public transport [17]. Therefore, the first part of the questionnaire contains essential personal characteristics, including gender, school, education, current residence, and length of time in Macau.
The second part of the questionnaire is the indicator evaluation system of public transport satisfaction in Macau, as described above. The satisfaction of public transport includes twelve satisfaction evaluation indicators, such as route setting, in-vehicle hygiene, smoothness of travel, and air-conditioning temperature. In comparison, taxi and radio taxi satisfaction both include six satisfaction evaluation indicators, including: driver-rider communication, waiting time, price setting, and in-vehicle comfort.
The questionnaire describes each specific evaluation indicator by using a 5-point Likert scale, with satisfaction described by a series of options from 1 to 5, where 1 corresponds to “extremely dissatisfied”, 2 to “less satisfied”, 3 to “average”, 4 to “more satisfied” and 5 to “very satisfied”, with five self-selection options [43].

4.2. Questionnaire Reliability Check

4.2.1. Reliability Testing

The reliability of a questionnaire is a tool to test the consistency and stability of the results obtained from a questionnaire composed of a variable number of questions [44], including both intrinsic and extrinsic reliability tests. The Cronbach’s alpha coefficient of the questionnaire was measured by SPSS.26 software to be 0.895. A Cronbach’s alpha coefficient above 0.8 puts the questionnaire in a high-reliability category. Therefore, the reliability test of this questionnaire is satisfactory.

4.2.2. Validity Test

The validity of the questionnaire refers to the degree of agreement between the data obtained from the questionnaire and the actual questions [45], which is usually tested by factor analysis, usually by the KMO test and Bartlett’s spherical test, to verify the correlation between the relevant factors, where KMO test values greater than 0.7 are generally considered to be more suitable for extracting information, and those greater than 0.8 are considered to be very suitable for extracting information. A Bartlett’s spherical test value less than or equal to 0.01 is considered suitable for extracting information [46]. The correlation test was conducted by SPSS.26 with a KMO value of 0.886 and Bartlett’s p value of 0.000. According to the test results, the validity of the questionnaire is excellent and suitable for factor analysis.

4.3. Questionnaire Sampling and Implementation

To ensure the reliability of the data, the target population of the survey on satisfaction with public transport in Macau should be one of the main groups of urban public transport patronage. According to the Macau Education and Youth Development Bureau data, there are 44,000 higher education students in Macau. Before the official distribution of the questionnaire, a pre-survey was conducted among a group of mainland students at the City University of Macau. According to the problems and shortcomings identified in the pre-survey, the questionnaire was modified to form the official questionnaire.
The survey was conducted by dividing the proportions first and then randomly sampling, Different proportions were first divided according to the number of students enrolled in each university: the University of Macau accounted for 30%; the Macau University of Science and Technology accounted for 36%; the City University of Macau accounted for 18%; the Polytechnic University of Macau accounted for 12%; and the Macau Institute of Tourism accounted for 5%. A random sample was then taken at the different schools according to the divided proportions, and this took the form of a questionnaire distributed randomly on campus. As the voluntary nature of the respondents will affect the authenticity of the survey results [47], we adopted the principle of voluntary participation of the respondents. A total of 330 questionnaires were distributed, and 328 were returned. After sorting and excluding uncomplete questionnaires, 324 valid questionnaires were obtained, with an effective rate of 98.8%.
After the questionnaires were returned and collated, the survey data were analyzed statistically and through structural equation modeling using SPSS 26.0 and AMOS 21.0. Structural equation modeling is an essential and comprehensive statistical research method in the social sciences, referred to as SEM. An SEM consists of two major parts: a measurement model, which represents the covariate effects of observed and latent variables, and a structural model, which is the causal relationship between each latent variable. A significant advantage of SEMs is that they can handle both directly observed variables and constructs that are not easily observed. The SEM has the notable advantage of dealing with both directly observed variables and constructing latent variables that are not easily observed, thus further analyzing the complex relationships between observed and latent variables, and between each latent variable.

4.4. Survey Respondent Analysis

The demographic characteristics of the survey respondents reflect the primary conditions and characteristics of the survey respondents [48]. A total of 324 international students from the mainland of Macau were selected for the survey on satisfaction with public transport in Macau. The specific demographic characteristics are shown in Table 3. Table 3 shows that, in terms of schools, the sample size of the University of Macau and the Macau University of Science and Technology is significantly larger than that of other higher education institutions in Macau. The distribution of the sample size of the five higher education institutions is roughly in line with the pre-determined proportion of the number of people randomly sampled from each higher education institution in Macau. Regarding current residence, the proportion of those living in Macau is significantly higher than that in Hengqin, Zhuhai, and Gongbei, Zhuhai, which is mainly related to the fact that mainland students choose to live in school dormitories and rent apartments in Macau.

5. Empirical Analysis of Public Transport Satisfaction Based on Structural Equations

5.1. Structural Equation Model

In this paper, the SEM is used to conduct factor analysis and to determine the weights of evaluation indicators. The structural equation usually consists of two parts: the measurement model, which explains the interrelationship between the latent variables, and the structural model, which explains the interrelationship between the latent variables and the specific explicit variables.
Structural equation model:
η = Bη + Eξ + δ
Measurement equation model:
y = λy + εy
x = λx + εx
In the equation: η is the model endogenous latent variable; ξ is the model exogenous latent variable; B is the path coefficient of the endogenous latent variable, describing the correlation between the endogenous latent variables; E is the path coefficient of the exogenous latent variable, describing the influence of the exogenous latent variable on the endogenous latent variable; and δ is the residual. y is the endogenous latent variable, also an observation of the η variable, x is the exogenous latent variable, also an observation of the ξ of the observations, and ε is the model residual.

5.2. Structural Modeling of Public Transport Satisfaction

This paper uses hierarchical analysis structural models to analyze bus satisfaction, telecall satisfaction, and taxi satisfaction, respectively, and uses maximum likelihood estimation to carry out parameter estimation, which is the most widely used in applications, for each structural model, and the estimation results are likewise more accurate [49]. The final standardized path coefficients were derived from the estimation.

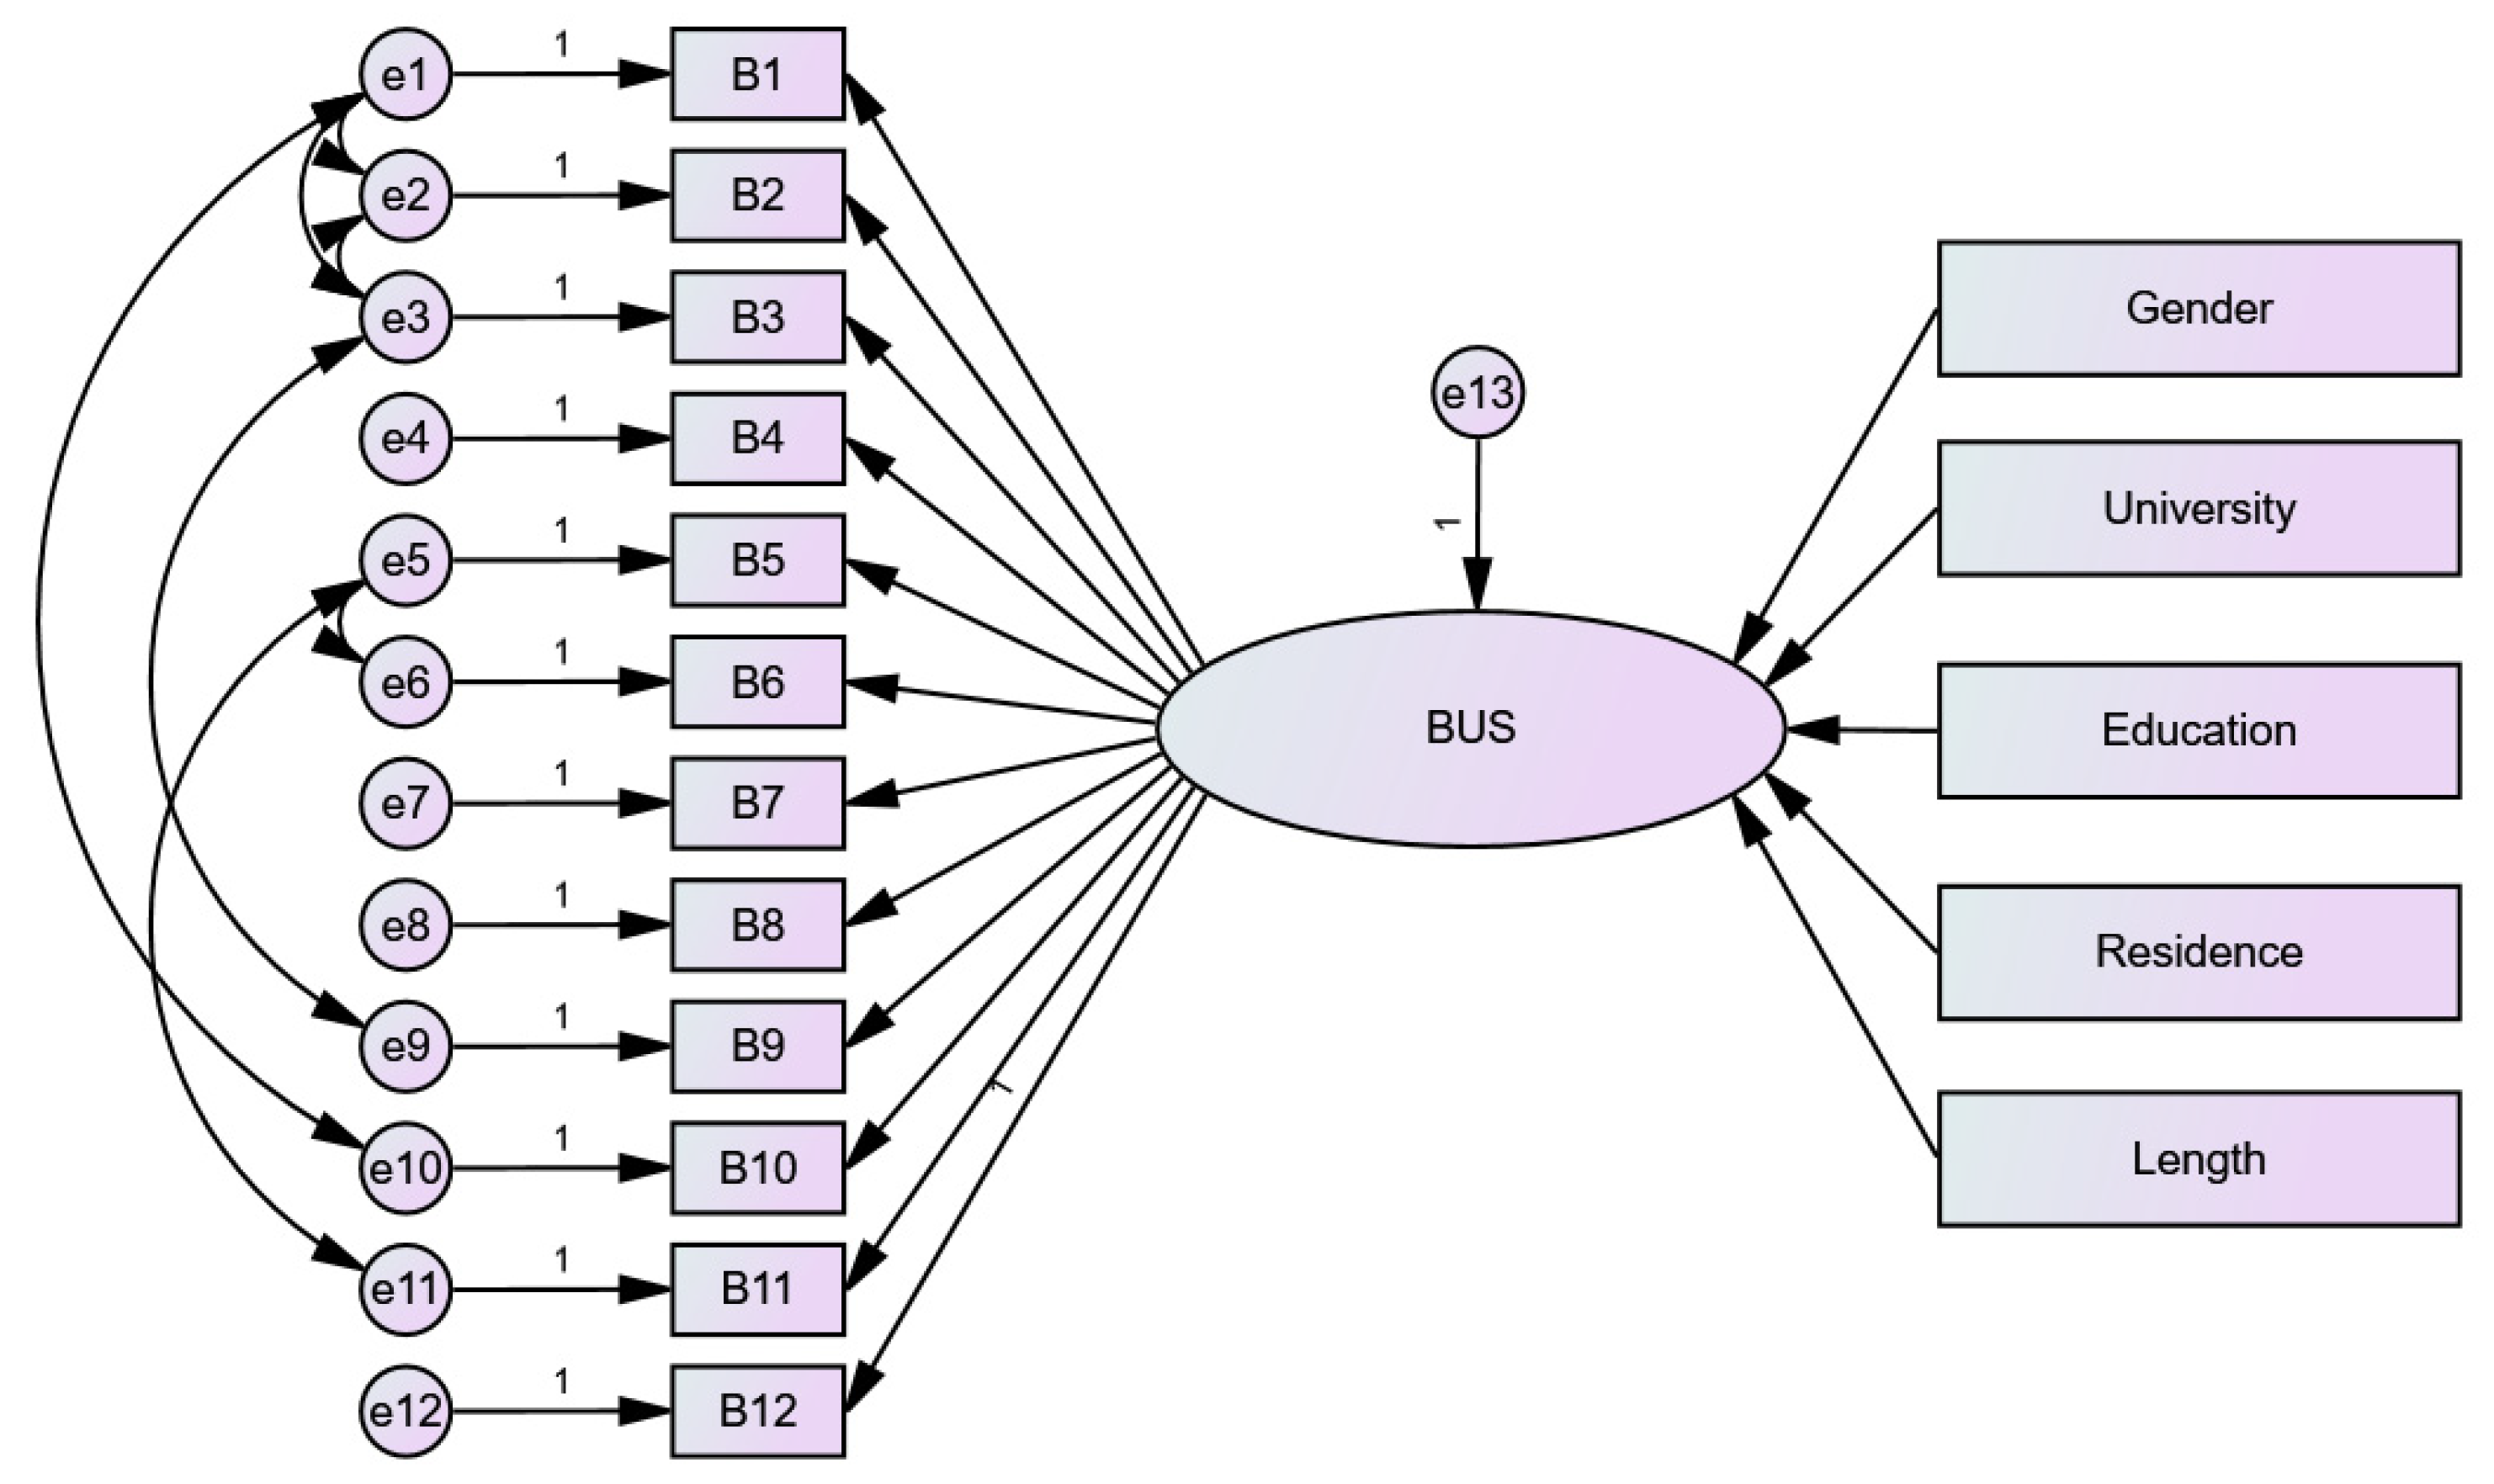
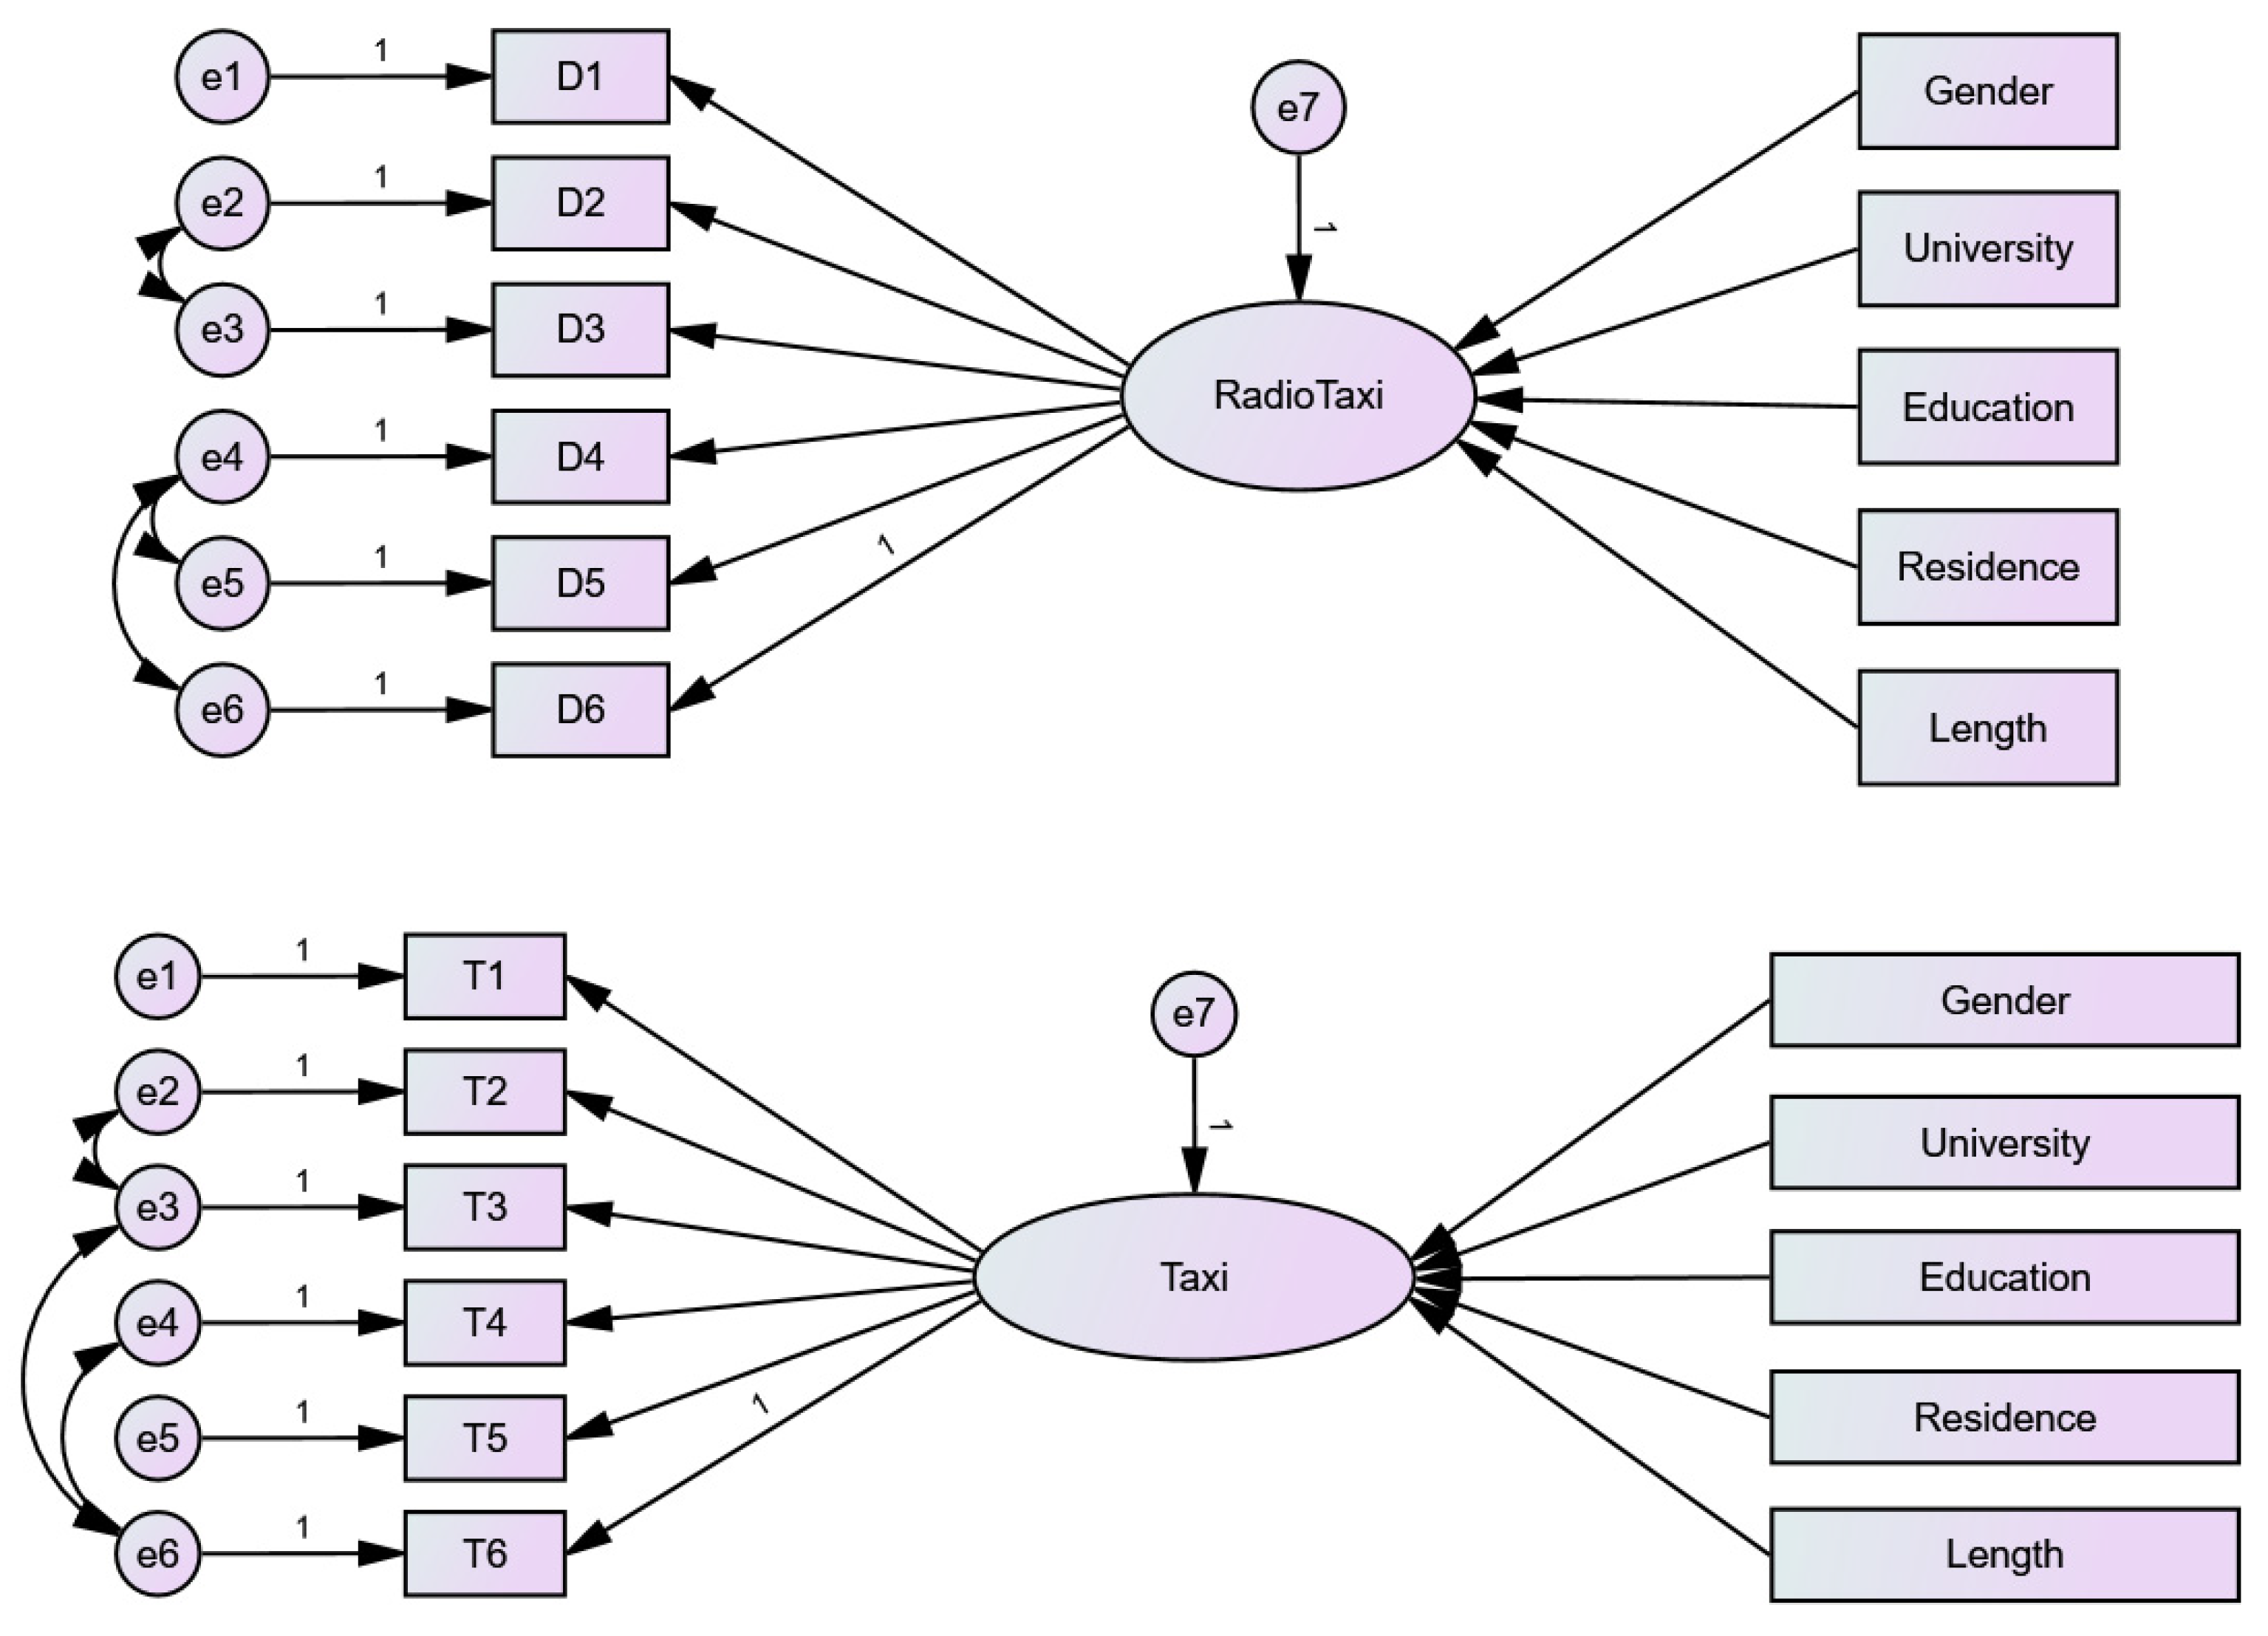
5.2.1. Development of the Satisfaction Structure Model

Based on the final determination of the dominant and latent variables of the public transport satisfaction index model, the public transport satisfaction model1, the dial-a-ride satisfaction model2, and the taxi satisfaction model3 were established, respectively, and the models are shown in Figure 2, where e is the residual term of the model.

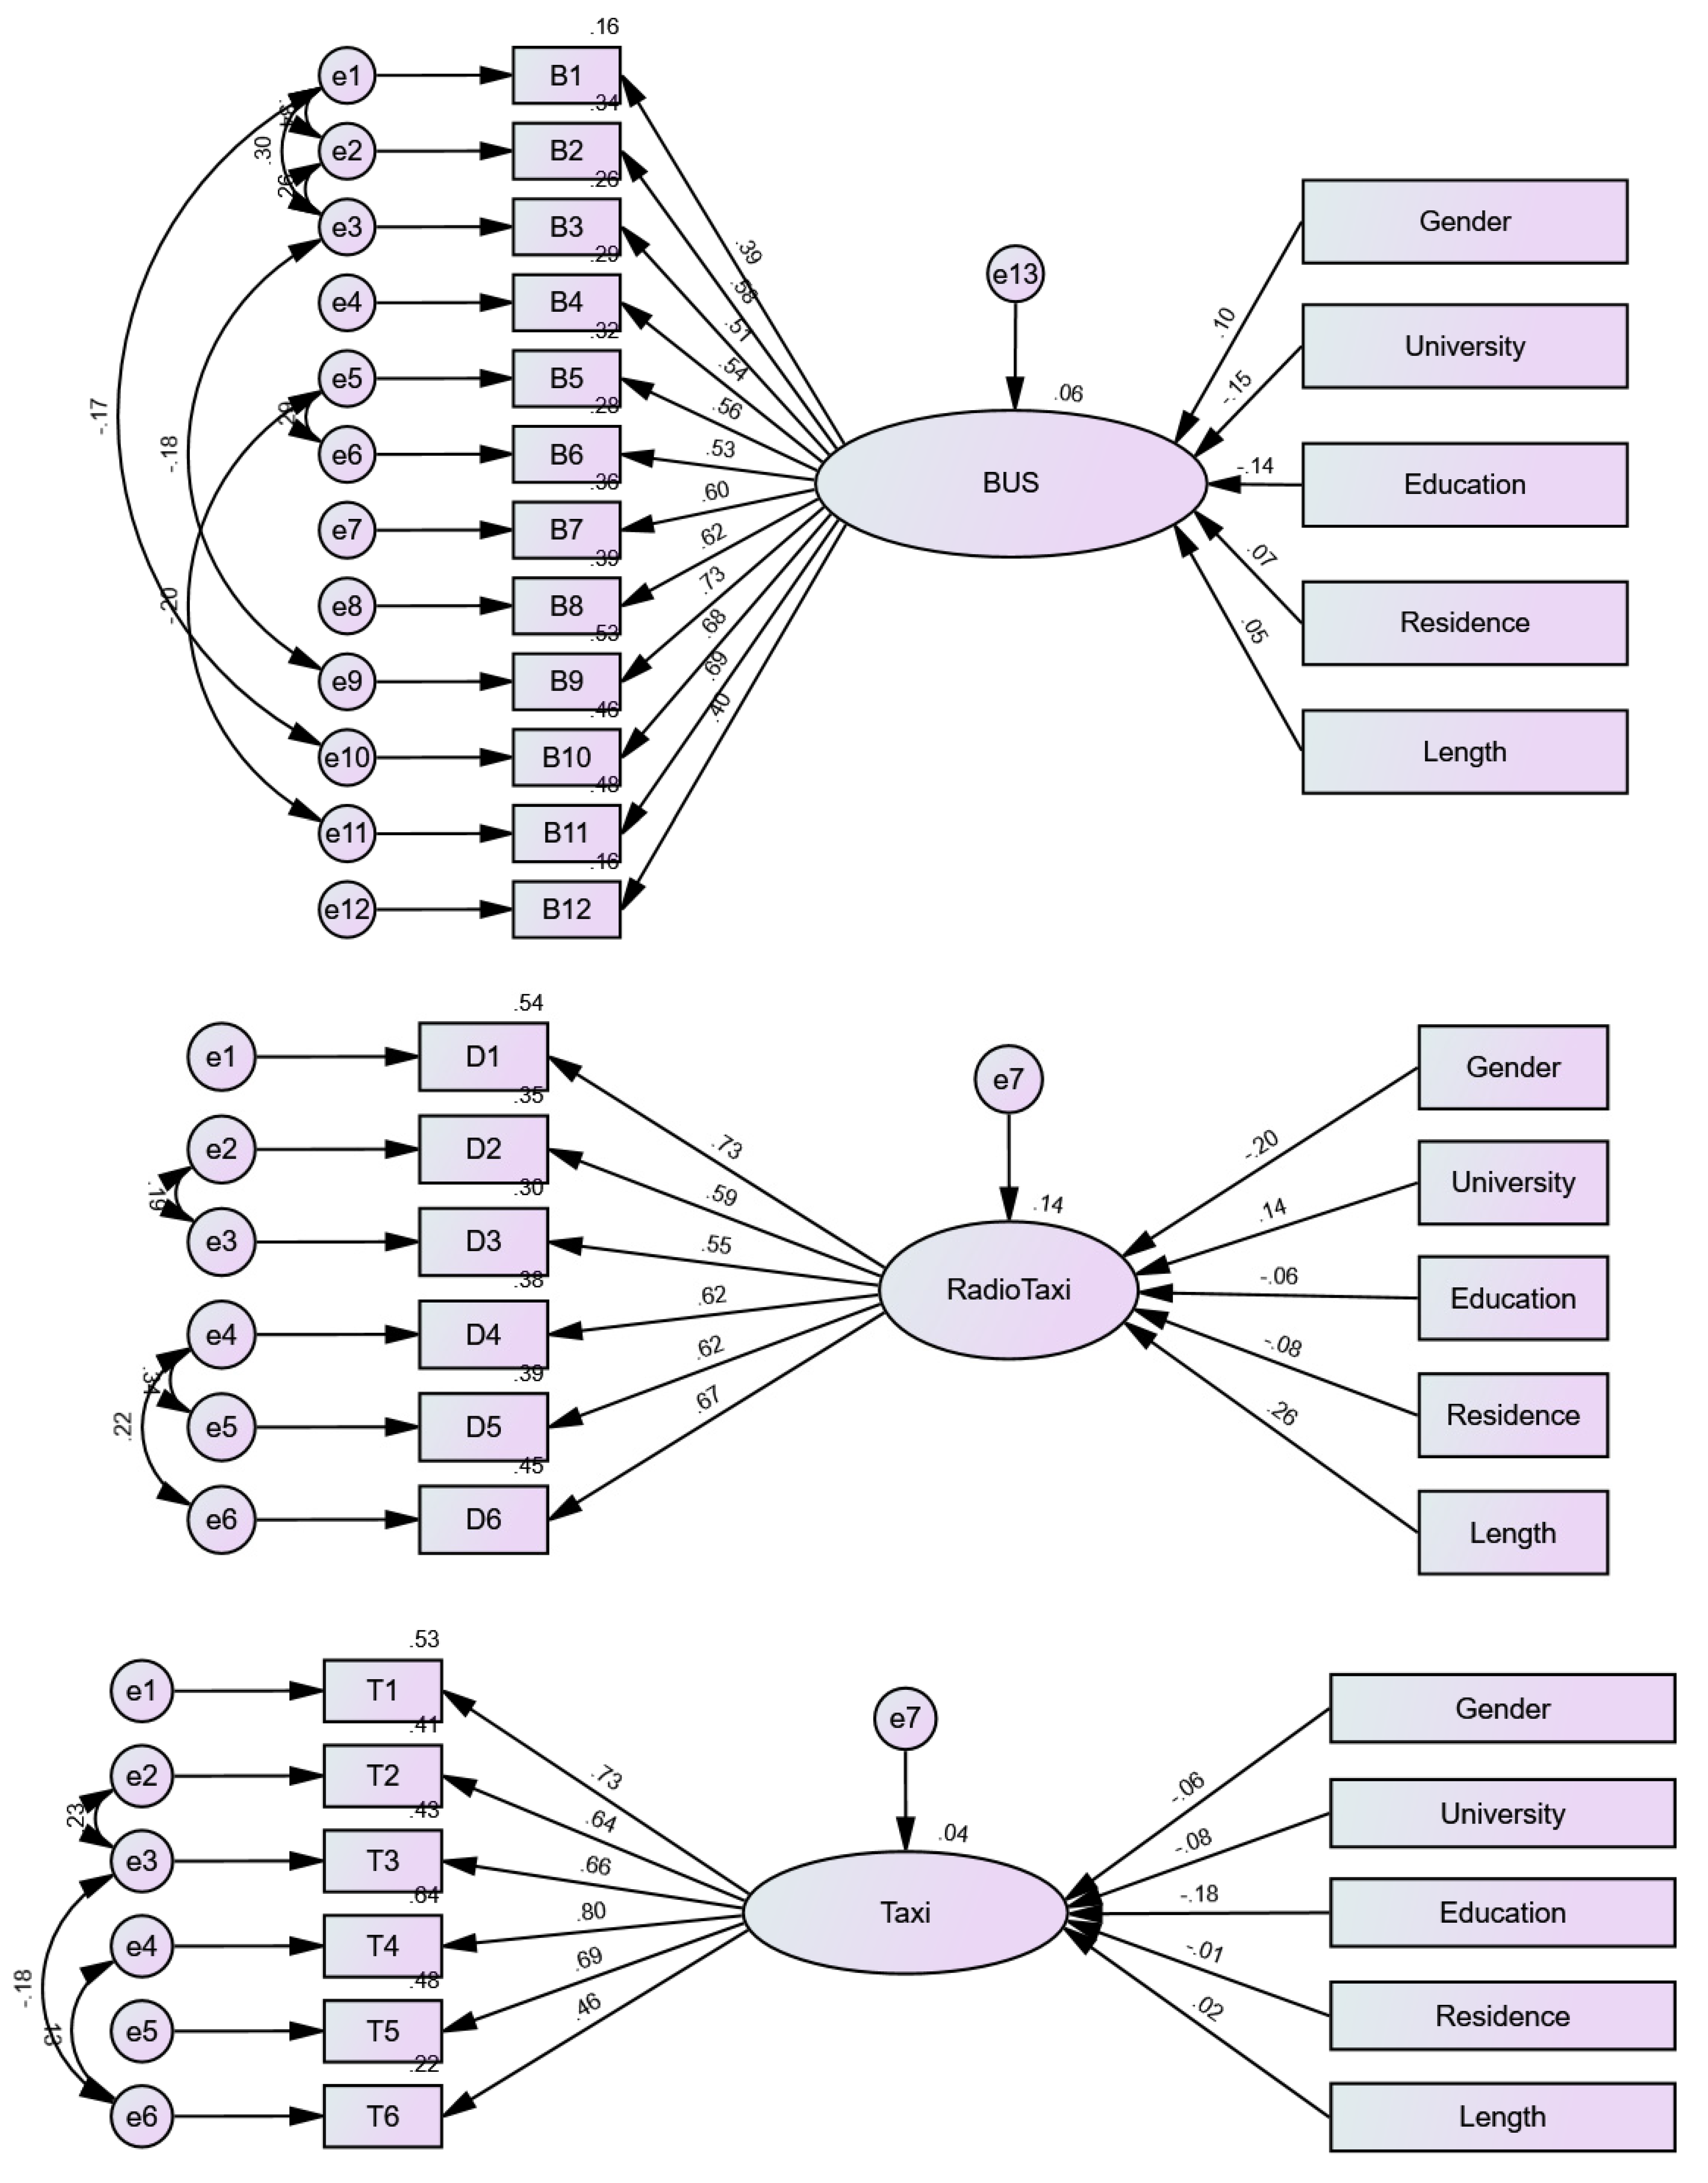
5.2.2. Model Goodness-of-Fit Test

The model chi-square value test is a standard indicator for structural equation model evaluation [50,51], but the test sample influences the chi-square value. As the sample size increases, the chi-square value increases accordingly, so it is easier to reject the original hypothesis. Three hundred twenty-four cases were obtained from this questionnaire research, which is not suitable for the chi-square test, so the chi-square degrees of freedom DF, absolute fit index P [52], CMIN\DF, comparative fit index CFI, root mean square error of approximation RMSEA, and goodness of fit index GFI were used to test the fitness of the model. The specific fitting effects of the three models are shown in Table 4.
According to the results of the goodness-of-fit tests, all three models met the model fit reference standard, and the model fit was good.

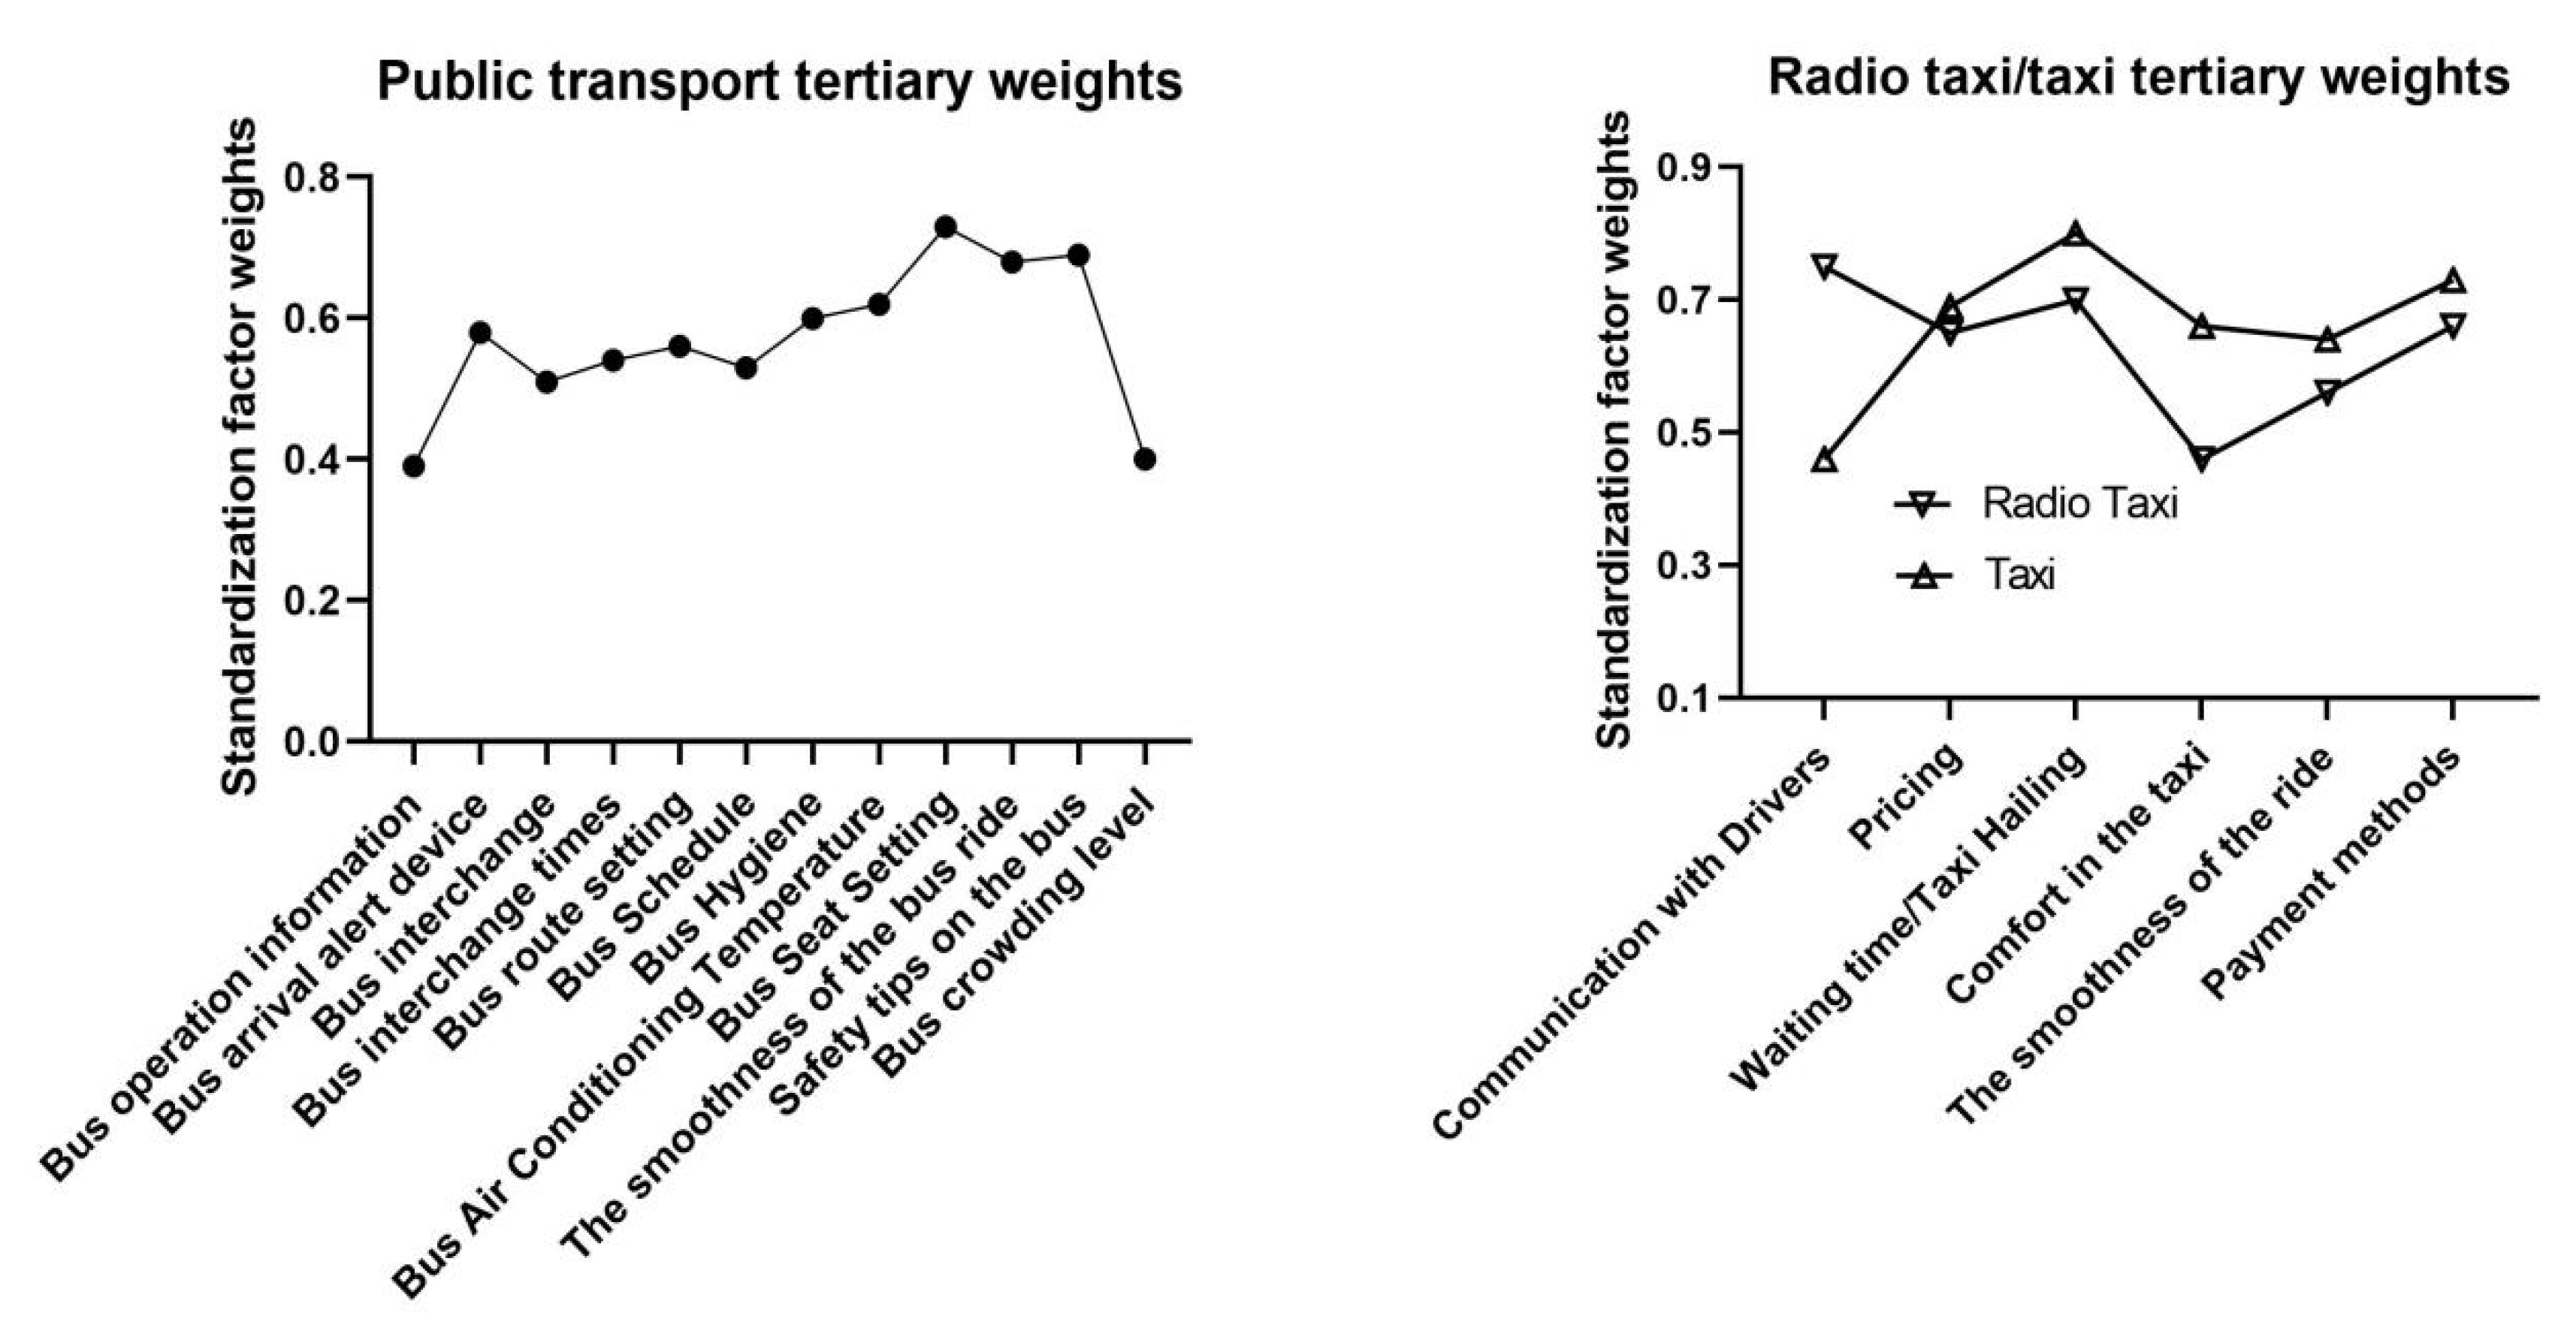
5.3. Analysis of Public Transport Satisfaction Indicators

Based on the above structural model, the maximum likelihood estimation method was used for parameter estimation and the standardized path coefficients are shown in Figure 3.
Based on the standardized path coefficients of the three models, the weights of each indicator were summarized using the normalization method in Figure 4. From the evaluation indicator weights, the three main dominant factors affecting bus satisfaction are bus seating arrangement, smoothness of travel and in-vehicle safety tips, with weights of 0.73, 0.69 and 0.68, respectively. The most significant of the three is seating arrangement, while the second, by mean satisfaction score, is smoothness of travel. The fact that smoothness of travel is the second factor influencing bus satisfaction is only partially consistent with our hypothesis 1. Still, it reflects the negative impact of smoothness of travel on passenger satisfaction. This result relates to the structural model, which is set up to incorporate potential factors that are not easily detected, thus developing imperceptible intrinsic relationships between the explicit and latent variables. In addition to the first two most influential elements in the relationship, the bus arrival alert device is the third most influential factor in bus satisfaction. In the reality of bus operation, the arrival alert devices are set in unreasonable locations and have poorly set lights and sounds. Among all the significant variables, bus operation information is the least weighted factor, with a weight of only 0.39, which is close to one half of the weight of the most weighted, seat setting. Therefore, it can be suggested that in terms of access to bus operation information, the service of the Macau Bus Company is relatively perfect.
An analysis of the standardized coefficient weights for electric calls and taxis shows that the highest coefficient for electric calls is for communication with the driver, and the lowest is for car comfort. The highest and lowest weighting coefficients for taxis correspond to the ease of hailing and communication with the driver. This indicates that, given the same set of questions, the service provided by radio taxis is better and more satisfactory than that provided by taxis. The highest standardized coefficient for taxis is the convenience of hailing a taxi, mainly because Macau’s taxis are primarily hailed by “hailing and stopping”. Hence, the standardized coefficient is the highest compared to the online hailing service by mobile phones and other communication tools, which aligns with our hypothesis 3. This is in line with our hypothesis 2. The weighting coefficients of payment methods for taxis are also higher than those for radio taxis, at 0.66 and 0.73, respectively, mainly because the formal payment methods for taxis in Macau are currently limited to cash and MOP, which is still a shortcoming of the service compared to the automatic exchange rate conversion of RMB for radio taxis. The most significant difference between the weighting coefficients of radio taxis and taxis is in the in-vehicle comfort, with a difference of 0.2, which is related to the different models of taxis and radio taxis operating in Macau.

5.4. Passenger Satisfaction Score Analysis

Based on the standardized coefficient weights and the satisfaction scores of each indicator, the final passenger satisfaction score is derived as follows.
Passenger satisfaction = Σ (mean value of measured indicator scores/weight of standardized coefficients)
The satisfaction scores of public transport, dial-a-ride, and taxis are calculated according to the formula, as shown in Table 5. The satisfaction score of the taxi service is significantly higher than that of other items, and the improvement points mainly lie in the price and waiting time of the taxi service.

6. Discussion and Limitations

6.1. Discussion

This study examines the satisfaction of three modes of public transport in Macau, namely public transport, taxis, and taxis, through a questionnaire survey conducted among international students in Macau and analyses the strengths and weaknesses of the respective modes.
Based on the dimensions of comfort, safety, price, punctuality, etc., the study identifies the evaluation dimensions of each of the three modes of public transport according to their characteristics, such as the high seating density of public transport in Macau. The study found that safety (including smoothness and in-vehicle safety tips) is an essential factor affecting passenger satisfaction, which is more evident in the case of public transport passengers, and no significant difference was found in the comparison between radio taxis and taxis, which is consistent with existing studies [26,53]. This may be because, unlike in other regions, Macau’s bus drivers drive vehicles in a small area with narrow and winding streets. Improving driving speed is the only way for Macau’s bus drivers to ensure that they arrive at their stops on time. In addition, we found that comfort (including interior hygiene and seat settings) was also a critical factor in passenger satisfaction, again in line with other studies [54], although some have suggested significant differences between males and females in satisfaction surveys [55], which were not evident in this study. In addition to this, the importance of online information, comfort, and price, which has been suggested to be more critical to students, was confirmed in this study [56].
The study found differences in satisfaction between Macau radio taxis and taxis, but the differences are insignificant. The main areas of difference were in the mode of hailing and payment, with the price factor being the least significant part of the difference. This finding aligns with existing studies that have identified online information dissemination as an essential factor influencing passenger satisfaction in modern transport development [57,58]. The hailing and single payment methods of Macau’s taxis mean they have generally lower passenger satisfaction than radio taxis. This is an area where Macau’s taxis need to improve in the future.

6.2. Limitations

Although this study provides insights into the sustainable development of public transport through the analysis of satisfaction with public transport in Macau, it has limitations, and future research should be further analyzed. Firstly, our study was a cross-sectional data study, and therefore needed to note changes in the temporal dimension and deficiencies in the analysis of individual differences. It could not reflect the relationship between the frequency of rides and satisfaction. Although a random sample and a voluntary survey were used to try to avoid errors in the results due to differences in the identity and psychology of the respondents, it cannot be ignored that there is a proportion of passengers who use public transport less frequently who were not included in this survey. Therefore, we encourage future research to expand the range of respondents and to change how the questionnaire is administered so that it covers every public transport passenger to a greater extent.
Secondly, although each institution of higher education was sampled according to a ratio divided by the number of students enrolled, the sample size of our questionnaire was small, which may have affected the accuracy of the findings. Students are indeed faithful users of public transport, as many cannot drive themselves. If they exist, they are only a small percentage subject to Macau’s traffic regulations. However, the student population generally has a low level of consumption. It is often limited in its choice of public transport, so future research could expand the range of respondents to include, for example, commuters and tourists. This would enable our research to be more convincing and to draw general conclusions about public transport in Macau.

7. Conclusions and Policy Implications

7.1. Conclusions

Passenger satisfaction, as an evaluation indicator of the level of urban public transport services, significantly impacts the scientific and accurate evaluation of the city to improve the relevant public transport services. In this paper, based on the ACSI customer satisfaction model, the evaluation index system of public transport satisfaction in Macau was established by summarizing the factors affecting customer satisfaction based on existing studies. Based on the evaluation indicators, a questionnaire on public transport satisfaction in Macau was designed, and the reliability and validity of the questionnaire were tested by SPSS.26. The test results indicated that the reliability and validity of the questionnaire were good. Secondly, using structural equation modelling, the corresponding structural equation models were constructed for public transport, radio taxi, and taxi, and the fit of the models was tested using AMOS 26 software. Based on the hierarchical structural equation models, the standardized path coefficients of each significant variable were obtained, and the factors that significantly influence each mode of transport were analyzed. Finally, the satisfaction scores of forms of public transport in Macau were obtained through a linear weighting method.
The results of the study are generally in line with the hypothesis that the shortcomings of Macau’s bus services are mainly in the areas of seating configuration and smoothness of travel, with passenger satisfaction scores for these two items being significantly lower than the others, mainly due to the characteristics of the city and the preferences of the bus companies. The shortcomings of Macau’s radio taxi service are price and waiting time, which are related to the operating characteristics of Macau’s dial-a-ride vehicles. Exceptionally few choose to take orders while in motion. The shortcomings of taxi services are mainly in price, hailing, and payment methods, with payment methods being the lowest satisfaction score, which is related to the limitations of the payment methods of Macau’s taxis. Overall satisfaction with Macau’s radio taxi service is significantly higher than satisfaction with Macau’s taxi service. The study’s findings ultimately provide targeted measures for improving public transport services in Macau and provide a theoretical basis for improving public transport satisfaction.

7.2. Policy Implications

To promote the sustainable development of public transport in Macau, the following measures can be taken. Firstly, set up bus seats in a reasonable manner, appropriately reduce the setting of seats in vehicles, increase the spacing between seats, improve the orientation of seats, and demonstrate through research the comfort of seats towards the rear of vehicles and the reasonableness of their setting. Secondly, improve bus drivers’ service level and effectively improve bus operation’s smoothness. By setting up bus vehicle speed monitoring devices to reduce the speed of bus operation, improve the overall smoothness of operation, and increase the bus frequency to make up for the empty windows caused by the slowdown of bus speed. Once again, adjust the price setting of telecalls and taxis, and lower the starting price of telecalls and taxis utilizing public feedback, further enhancing the competitive advantage of telecalls and taxis in terms of hours.
Improve the construction of the electric call information platform and broaden the scale of radio taxi operations. The problem of difficult hailing and long waiting times exists in the operation of the radio taxi. By further improving the construction of the relevant platform for order allocation, customer waiting will be reduced and satisfaction with the radio taxi service will be enhanced. Improve how taxis are paid by incorporating automatic exchange rate settlement methods. The limitations of taxi payment methods are a significant constraint on the competitiveness of taxis. The inability to use RMB settlement or RMB equivalent exchange rate settlement makes the satisfaction level of taxi services relatively low.

Author Contributions

Questionnaire design: S.Z., Y.N., S.S. and T.C. Questionnaire distribution and collection: Y.N. and T.C. Questionnaire collation: S.Z. and S.S. Structural equation design: S.Z. Data processing and calculation: S.Z. Materials collation: Y.N., S.S. and T.C. Editor: S.Z. All authors have read and agreed to the published version of the manuscript.

Funding

This research received no external funding.

Institutional Review Board Statement

Not applicable.

Informed Consent Statement

Informed consent was obtained from all subjects involved in the study.

Data Availability Statement

The data presented in this study are available on request from the corresponding author.

Conflicts of Interest

The authors declare no conflict of interest.

References

  1. Government of Macau. Linhas Gerais do Desenvolvimento a Médio e Longo Prazo do Ensino Superior de Macau (2021–2030); Direcção dos Serviços do Ensino Superior: Macau, China, 2021. [Google Scholar]
  2. Olimid, A.P.; Olimid, D.A. Societal Challenges, Population Trends and Human Security: Evidence from the Public Governance within the United Nations Publications (2015–2019). Rev. Stiinte Politice 2019, 64, 53–64. [Google Scholar]
  3. Cardozo, R.N. An experimental study of customer effort, expectation, and satisfaction. J. Mark. Res. 1965, 2, 244–249. [Google Scholar] [CrossRef]
  4. Morgeson, F.V., III; Hult, G.T.M.; Mithas, S.; Keiningham, T.; Fornell, C. Turning complaining customers into loyal customers: Moderators of the complaint handling–Customer loyalty relationship. J. Mark. 2020, 84, 79–99. [Google Scholar] [CrossRef]
  5. Tien, N.H.; Anh, N.; Dung, H.; On, P.; Anh, V.; Dat, N.; Tam, B. Factors impacting customer satisfaction at Vietcombank in Vietnam. Himal. J. Econ. Bus. Manag. 2021, 2, 44–51. [Google Scholar]
  6. Fornell, C. A national customer satisfaction barometer: The Swedish experience. J. Mark. 1992, 56, 6–21. [Google Scholar] [CrossRef]
  7. Fornell, C.; Johnson, M.D.; Anderson, E.W.; Cha, J.; Bryant, B.E. The American customer satisfaction index: Nature, purpose, and findings. J. Mark. 1996, 60, 7–18. [Google Scholar] [CrossRef] [Green Version]
  8. Askariazad, M.H.; Babakhani, N. An application of European Customer Satisfaction Index (ECSI) in business to business (B2B) context. J. Bus. Ind. Mark. 2015, 30, 17–31. [Google Scholar] [CrossRef]
  9. Johnson, M.D.; Gustafsson, A.; Andreassen, T.W.; Lervik, L.; Cha, J. The evolution and future of national customer satisfaction index models. J. Econ. Psychol. 2001, 22, 217–245. [Google Scholar] [CrossRef] [Green Version]
  10. Slongo, L.A.; Vieira, V.A. An analysis of the new norwegian customer satisfaction barometer (new NCSB) in a Brazilian supermarket context. RAM Rev. Adm. Mackenzie 2020, 8, 173–194. [Google Scholar] [CrossRef]
  11. Fu, H. Evaluation of Bus Passenger Satisfaction Based on Structural Equation; Dalian Jiaotong University: Dalian, China, 2017. [Google Scholar]
  12. Macau Government Transport Bureau. Macau Land Transport Master Plan (2021–2030); Macau Government Transport Bureau: Macau, China, 2021. [Google Scholar]
  13. Macau Government Transport Bureau. The Average Numbers of Passengers Transported Daily; Macau Government Transport Bureau: Macau, China, 2023. [Google Scholar]
  14. Government of Macau. Taxi Operation Management-Taxi Fares; Macau Government Transport Bureau: Macau, China, 2021. [Google Scholar]
  15. Redman, L.; Friman, M.; Gärling, T.; Hartig, T. Quality attributes of public transport that attract car users: A research review. Transp. Policy 2013, 25, 119–127. [Google Scholar] [CrossRef]
  16. Sukhov, A.; Lättman, K.; Olsson, L.E.; Friman, M.; Fujii, S. Assessing travel satisfaction in public transport: A configurational approach. Transp. Res. Part D Transp. Environ. 2021, 93, 102732. [Google Scholar] [CrossRef]
  17. Ingvardson, J.B.; Nielsen, O.A. The relationship between norms, satisfaction and public transport use: A comparison across six European cities using structural equation modelling. Transp. Res. Part A Policy Pract. 2019, 126, 37–57. [Google Scholar] [CrossRef]
  18. Soza-Parra, J.; Raveau, S.; Muñoz, J.C.; Cats, O. The underlying effect of public transport reliability on users’ satisfaction. Transp. Res. Part A Policy Pract. 2019, 126, 83–93. [Google Scholar] [CrossRef] [Green Version]
  19. Abenoza, R.F.; Cats, O.; Susilo, Y.O. Travel satisfaction with public transport: Determinants, user classes, regional disparities and their evolution. Transp. Res. Part A Policy Pract. 2017, 95, 64–84. [Google Scholar] [CrossRef] [Green Version]
  20. Delbosc, A.; Currie, G. Modelling the causes and impacts of personal safety perceptions on public transport ridership. Transp. Policy 2012, 24, 302–309. [Google Scholar] [CrossRef]
  21. Chou, J.S.; Kim, C.; Kuo, Y.C.; Ou, N.C. Deploying effective service strategy in the operations stage of high-speed rail. Transp. Res. Part E Logist. Transp. Rev. 2011, 47, 507–519. [Google Scholar] [CrossRef]
  22. Figler, S.A.; Sriraj, P.S.; Welch, E.W.; Yavuz, N. Customer loyalty and Chicago, Illinois, transit authority buses: Results from 2008 customer satisfaction survey. Transp. Res. Rec. 2011, 2216, 148–156. [Google Scholar] [CrossRef]
  23. Department for Transport. People ’s Perceptions of Personal Security and Their Concerns about Crime on Public Transport: Literature Review; Department for Transport: London, UK, 2002. [Google Scholar]
  24. Truong, L.T.; Currie, G. Macroscopic road safety impacts of public transport: A case study of Melbourne, Australia. Accid. Anal. Prev. 2019, 132, 105270. [Google Scholar] [CrossRef]
  25. Beck, L.F.; Dellinger, A.M.; O’Neil, M.E. Motor vehicle crash injury rates by mode of travel, United States: Using exposure-based methods to quantify differences. Am. J. Epidemiol. 2007, 166, 212–218. [Google Scholar] [CrossRef]
  26. Savage, I. Comparing the fatality risks in United States transportation across modes and over time. Res. Transp. Econ. 2013, 43, 9–22. [Google Scholar] [CrossRef] [Green Version]
  27. Zhang, J.; Yan, X.; An, M.; Sun, L. The impact of Beijing subway’s new fare policy on riders’ attitude, travel pattern and demand. Sustainability 2017, 9, 689. [Google Scholar] [CrossRef] [Green Version]
  28. Glavić, D.; Simićević, J.; Milenkovic, M. Parking versus Congestion Pricing: Comparative Analysis. J. Road Traffic Eng. 2020, 66, 11–16. [Google Scholar] [CrossRef]
  29. Román, C.; Martín, J.C.; Espino, R. Using stated preferences to analyze the service quality of public transport. Int. J. Sustain. Transp. 2014, 8, 28–46. [Google Scholar] [CrossRef]
  30. Morton, C.; Caulfield, B.; Anable, J. Customer perceptions of quality of service in public transport: Evidence for bus transit in Scotland. Case Stud. Transp. Policy 2016, 4, 199–207. [Google Scholar] [CrossRef]
  31. Börjesson, M.; Rubensson, I. Satisfaction with crowding and other attributes in public transport. Transp. Policy 2019, 79, 213–222. [Google Scholar] [CrossRef]
  32. Fellesson, M.; Friman, M. Perceived satisfaction with public transport service in nine European cities. J. Transp. Res. Forum 2012, 47. [Google Scholar] [CrossRef] [Green Version]
  33. Eboli, L.; Mazzulla, G. A methodology for evaluating transit service quality based on subjective and objective measures from the passenger’s point of view. Transp. Policy 2011, 18, 172–181. [Google Scholar] [CrossRef]
  34. Dell’olio, L.; Ibeas, A.; Cecin, P. The quality of service desired by public transport users. Transp. Policy 2011, 18, 217–227. [Google Scholar] [CrossRef]
  35. Morfoulaki, M.; Tyrinopoulos, Y.; Aifadopoulou, G. Estimation of satisfied customers in public transport systems: A new methodological approach. J. Transp. Res. Forum 2010, 46. [Google Scholar] [CrossRef]
  36. Mouwen, A. Drivers of customer satisfaction with public transport services. Transp. Res. Part A Policy Pract. 2015, 78, 1–20. [Google Scholar] [CrossRef]
  37. Ceder, A.A.; Jiang, Y. Route guidance ranking procedures with human perception consideration for personalized public transport service. Transp. Res. Part C Emerg. Technol. 2020, 118, 102667. [Google Scholar] [CrossRef]
  38. Tirachini, A.; Hensher, D.A.; Rose, J.M. Crowding in public transport systems: Effects on users, operation and implications for the estimation of demand. Transp. Res. Part A Policy Pract. 2013, 53, 36–52. [Google Scholar] [CrossRef]
  39. Grisé, E.; El-Geneidy, A. Evaluating the relationship between socially (dis) advantaged neighbourhoods and customer satisfaction of bus service in London, UK. J. Transp. Geogr. 2017, 58, 166–175. [Google Scholar] [CrossRef]
  40. Justitia, A.; Semiati, R.; Ayuvinda, N.R. Customer satisfaction analysis of online taxi mobile apps. J. Inf. Syst. Eng. Bus. Intell. 2019, 5, 85–92. [Google Scholar] [CrossRef] [Green Version]
  41. Siyal, A.W.; Hongzhuan, C.; Gang, C. From consumer satisfaction to recommendation of mobile app–based services: An overview of mobile taxi booking apps. Sage Open 2021, 11, 21582440211004179. [Google Scholar] [CrossRef]
  42. Behrens, R.; Dodgen, S.; Fusire, T.; Mukhuba, T. Passenger satisfaction with minibus-taxi feeder services at the Mitchells Plain public transport interchange in Cape Town. In Proceedings of the 37th Southern African Transport Conference, Pretoria, South Africa, 9–12 July 2018. [Google Scholar]
  43. Joshi, A.; Kale, S.; Chandel, S.; Pal, D.K. Likert scale: Explored and explained. Br. J. Appl. Sci. Technol. 2015, 7, 396. [Google Scholar] [CrossRef]
  44. Taherdoost, H. Validity and reliability of the research instrument; how to test the validation of a questionnaire/survey in a research. How to test the validation of a questionnaire/survey in a research. Int. J. Acad. Res. Manag. IJARM 2016, 5, 28–36. [Google Scholar]
  45. Eisinga, R.; Grotenhuis, M.T.; Pelzer, B. The reliability of a two-item scale: Pearson, Cronbach, or Spearman-Brown? Int. J. Public Health 2013, 58, 637–642. [Google Scholar] [CrossRef] [PubMed]
  46. Williams, B.; Onsman, A.; Brown, T. Exploratory factor analysis: A five-step guide for novices. Australas. J. Paramed. 2010, 8, 1–13. [Google Scholar] [CrossRef] [Green Version]
  47. Glaser, P. Respondents cooperation: Demographic profile of survey respondents and its implication. In Handbook of Survey Methodology for the Social Sciences; Springer: New York, NY, USA, 2012; pp. 195–207. [Google Scholar]
  48. Zhang, X.; Liu, H.; Xu, M.; Mao, C.; Shi, J.; Meng, G.; Wu, J. Evaluation of Passenger Satisfaction to Conventional Public Transit Based on a Structural Equation. J. Transp. Eng. Inf. 2021, 19, 43–51. [Google Scholar]
  49. Maydeu-Olivares, A. Maximum likelihood estimation of structural equation models for continuous data: Standard errors and goodness of fit. Struct. Equ. Model. A Multidiscip. J. 2017, 24, 383–394. [Google Scholar] [CrossRef]
  50. Lanza, S.T.; Dziak, J.J.; Huang, L.; Wagner, A.; Collins, L.M. Proc LCA & Proc LTA Users’ Guide (Version 1.3. 2); The Methodology Center: State College, PA, USA, 2015. [Google Scholar]
  51. Henseler, J.; Ringle, C.M.; Sarstedt, M. A new criterion for assessing discriminant validity in variance-based structural equation modeling. J. Acad. Mark. Sci. 2015, 43, 115–135. [Google Scholar] [CrossRef] [Green Version]
  52. Mcdonald, R.P.; Ho, M.-H.R. Principles and practice in reporting structural equation analyses. Psychol. Methods 2002, 7, 64. [Google Scholar] [CrossRef]
  53. Shiwakoti, N.; Stasinopoulos, P.; Vincec, P.; Qian, W.; Hafsar, R. Exploring how perceptive differences impact the current public transport usage and support for future public transport extension and usage: A case study of Melbourne ’s tramline extension. Transp. Policy 2019, 84, 12–23. [Google Scholar] [CrossRef]
  54. Friman, M.; Lättman, K.; Olsson, L.E. Public transport quality, safety, and perceived accessibility. Sustainability 2020, 12, 3563. [Google Scholar] [CrossRef]
  55. Collins, C.; Hasan, S.; Ukkusuri, S.V. A novel transit rider satisfaction metric: Rider sentiments measured from online social media data. J. Public Transp. 2013, 16, 21–45. [Google Scholar] [CrossRef] [Green Version]
  56. Stojic, D.; Ciric, Z.; Sedlak, O.; Marcikic Horvat, A. Students’ views on public transport: Satisfaction and emission. Sustainability 2020, 12, 8470. [Google Scholar] [CrossRef]
  57. Lyu, T.; Wang, P.S.; Gao, Y.; Wang, Y. Research on the big data of traditional taxi and online car-hailing: A systematic review. J. Traffic Transp. Eng. 2021, 8, 1–34. [Google Scholar] [CrossRef]
  58. Babar, Y.; Burtch, G. Examining the heterogeneous impact of ride-hailing services on public transit use. Inf. Syst. Res. 2020, 31, 820–834. [Google Scholar] [CrossRef]
Figure 1. ACSI Customer Satisfaction Model.
Sustainability 15 05463 g001
Figure 2. Structural equation model of public transport satisfaction.
Sustainability 15 05463 g002aSustainability 15 05463 g002b
Figure 3. Standardized coefficient of public transport satisfaction.
Sustainability 15 05463 g003
Figure 4. Public Transport Satisfaction Level 3 Indicator Weights.
Sustainability 15 05463 g004
Table 1. Comparison of the advantages and disadvantages of public transport in Macau.
Advantages and
Disadvantages Public Transport Options
BUSRadio TAXIRegular Taxis
Advantages
  • Discounted fares
  • Reliable operation
  • Easy access to operational information
  • Easy to call the vehicle
  • Comfortable ride
  • Smooth travel
  • High accessibility
  • Convenient payment methods
  • Smooth travel
  • High accessibility
  • Comfortable ride
Disadvantages
  • Unstable travel
  • Crowded
  • Weak accessibility
  • Long waiting time for trains
  • High cost
  • Not suitable for single travelers
  • Inconvenient to call the vehicle
  • Uncomfortable payment method
  • High cost
Table 2. Variables of the public transport satisfaction indicator system.
Display VariablesVariable IdentificationLatent Variable
Bus operation informationB1Public Transport Satisfaction
Bus arrival alert deviceB2
Bus interchangeB3
Bus interchange timesB4
Bus route settingB5
Bus ScheduleB6
Bus HygieneB7
Bus Air Conditioning TemperatureB8
Bus Seat SettingB9
The smoothness of the bus rideB10
Safety tips on the busB11
Bus crowding levelB12
Communication with Dial-a-Ride DriversD1Radio taxi Satisfaction
Dial-a-Ride PricingD2
Waiting timeD3
Comfort in the taxiD4
The smoothness of the rideD5
Payment methodsD6
Communication with taxi driversT1Taxi Satisfaction
Taxi PricesT2
Taxi HailingT3
Comfort in the taxiT4
The smoothness of the taxi rideT5
Payment methodsT6
Table 3. Demographic characteristics of survey respondents.
Demographic CharacteristicsSample Size (pcs)Percentage (%)
GenderMale13441.3
Female19058.6
UniversityUniversity of Macau9629.6
City University of Macau5516.9
Macau University of Science and Technology11736.1
Macau Institute of Tourism Studies206.1
Macau Polytechnic University3611.1
EducationUndergraduate9128
Masters19259.2
PhD4112.6
ResidenceGongbei, Zhuhai4513.8
Hengqin, Zhuhai6219.1
Macau19760.8
Other206.1
LengthX < 113541.6
1 ≤ X < 29128
2 ≤ X < 46118.8
X ≥ 43711.4
Table 4. Model fit test results.
Suitability
Indicators
Actual ValueEvaluation Criteria
Public TransportRadio TaxiTaxi
CMIN/DF2.1161.7792.637Less than 3
RMSEA0.0590.0490.071Less than 0.1 acceptable, less than 0.08 good fit
CFI0.9000.9500.907Greater than 0.8 acceptable, better than 0.9 fit
GFI0.9120.9620.945More than 0.8 acceptable, better than 0.9 fit
IFI0.9020.9510.909More than 0.8 acceptable, better than 0.9 fit
Table 5. Passenger satisfaction scores.
Tertiary IndicatorsPassenger
Satisfaction
Tertiary IndicatorsPassenger
Satisfaction
Bus operation information10.69Communication with Radio taxi Drivers6.25
Bus arrival alert device6.94Radio taxi Pricing5.21 ***
Bus interchange7.48Waiting time5.27 ***
Bus interchange times7.32Comfort in the taxi9.35
Bus route setting6.60The smoothness of the ride7.24
Bus schedule7.08Payment methods6.44
Bus Hygiene6.65Communication with taxi drivers7.80
Bus air conditioning temperature5.55Taxi Prices4.54 ***
Bus seat setting4.84 ***Taxi Hailing4.43 ***
The smoothness of the bus ride3.59 ***Comfort in the taxi5.46
Safety tips on the bus5.51The smoothness of the taxi ride5.81
Bus crowding level7.57Payment methods3.56 ***
Note: *** indicates low passenger satisfaction.
Disclaimer/Publisher’s Note: The statements, opinions and data contained in all publications are solely those of the individual author(s) and contributor(s) and not of MDPI and/or the editor(s). MDPI and/or the editor(s) disclaim responsibility for any injury to people or property resulting from any ideas, methods, instructions or products referred to in the content.

