
Mechanical Analysis of Palm-Fiber-Reinforced Sand through Triaxial Tests


Abstract
:1. Introduction
2. Materials and Test Setup
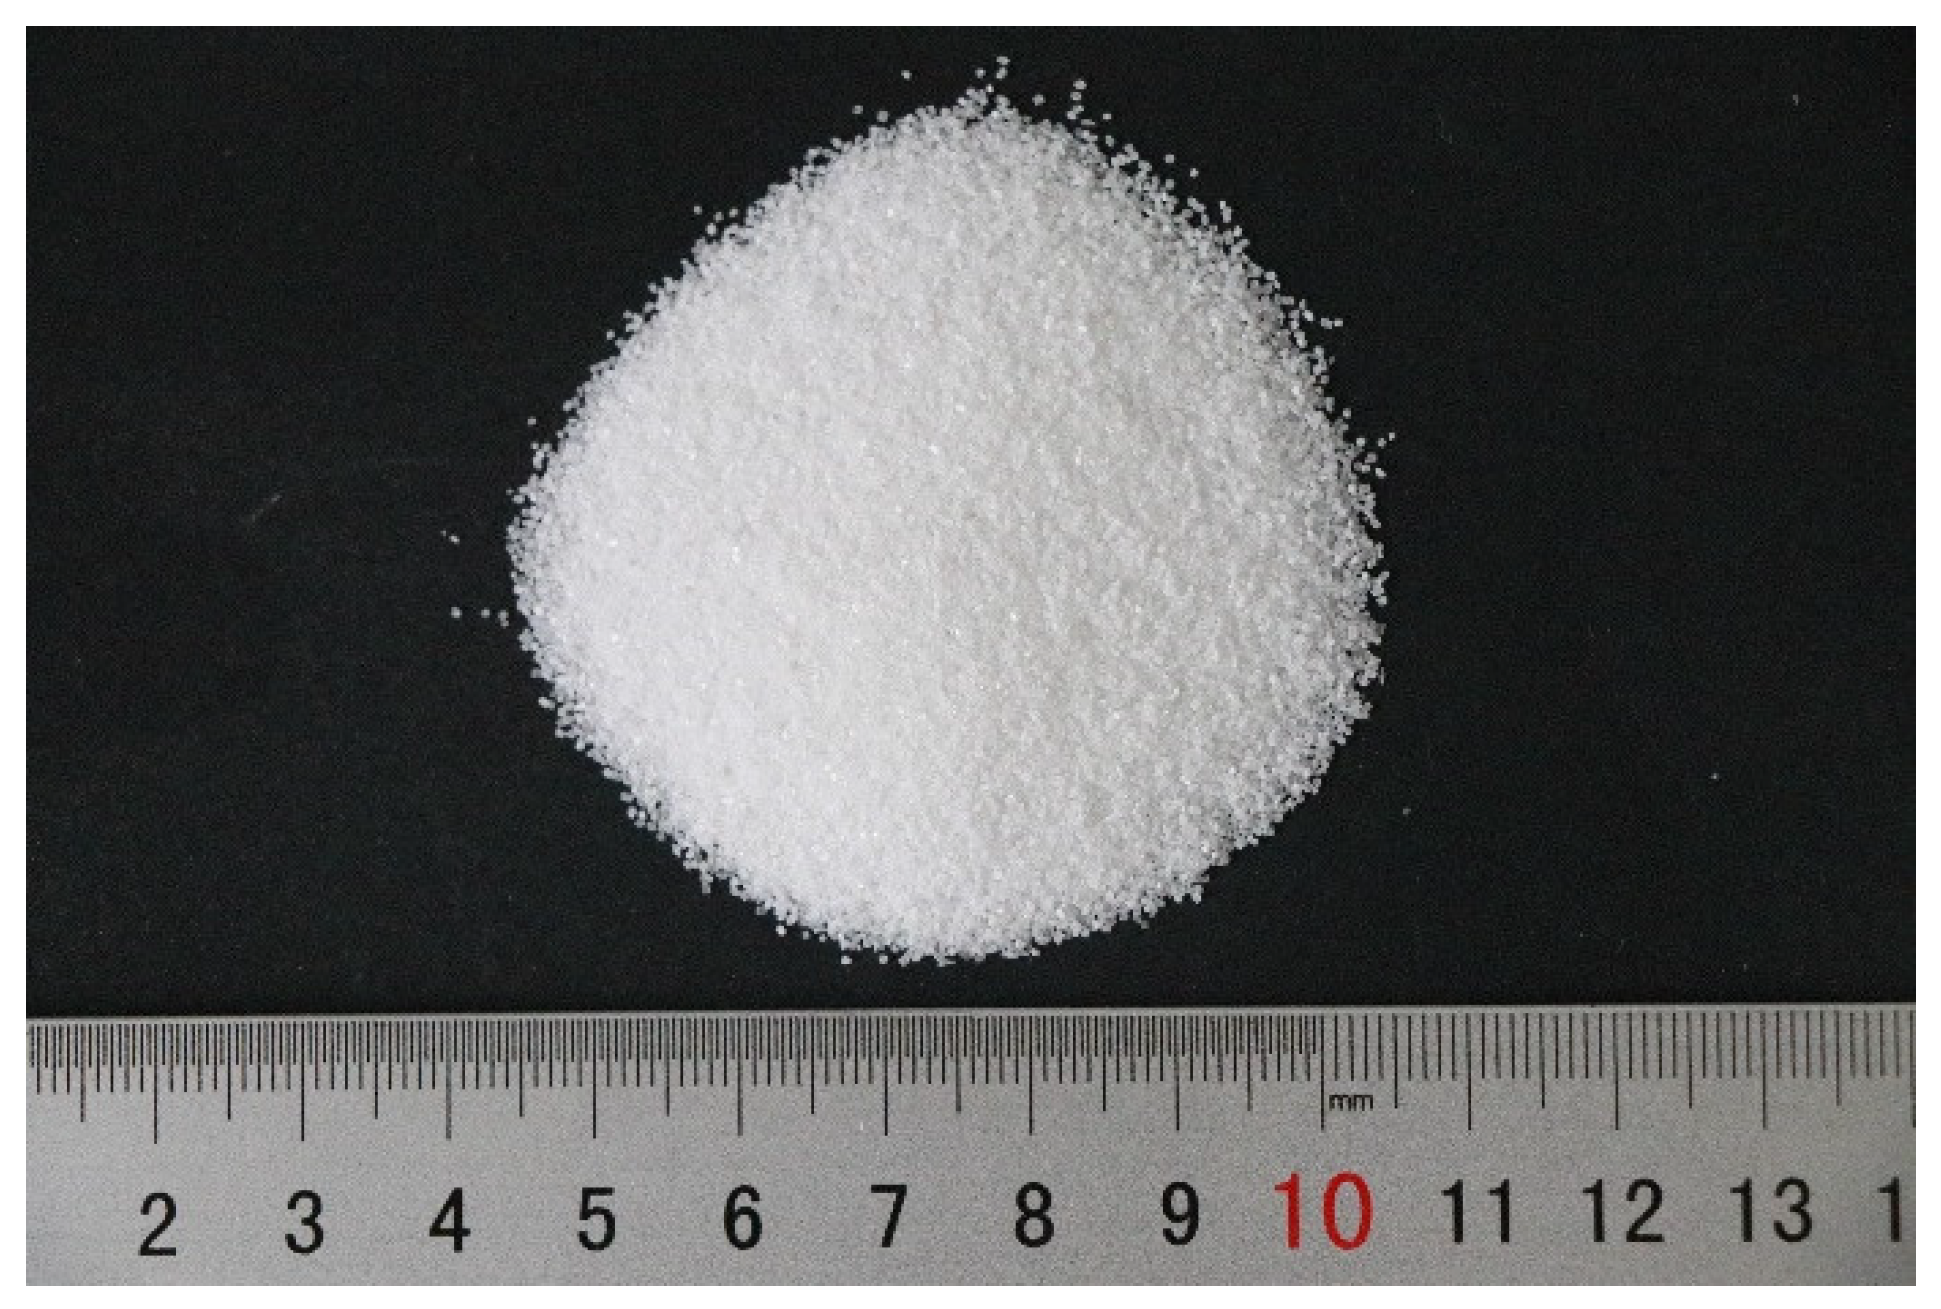
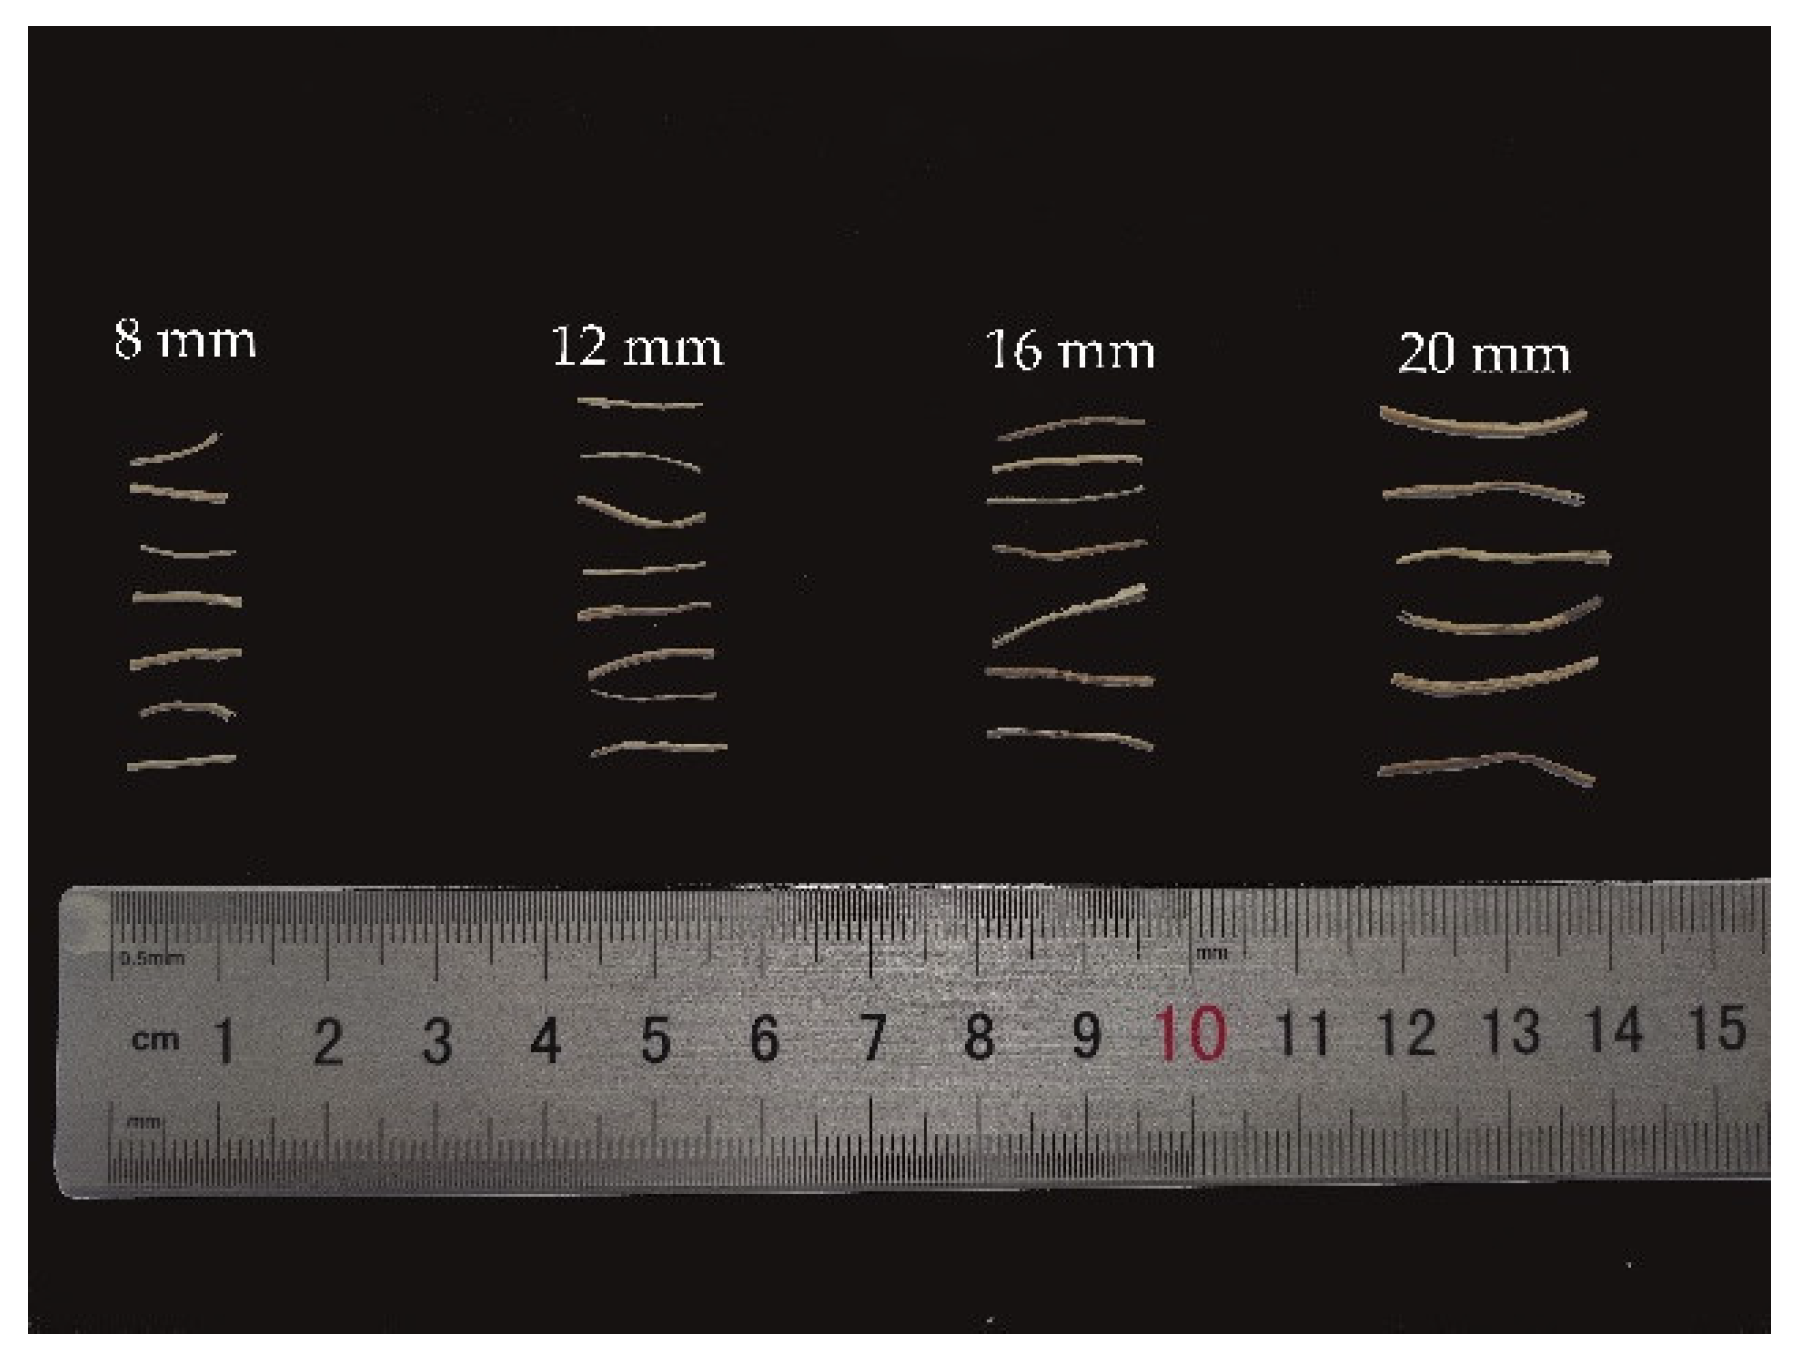
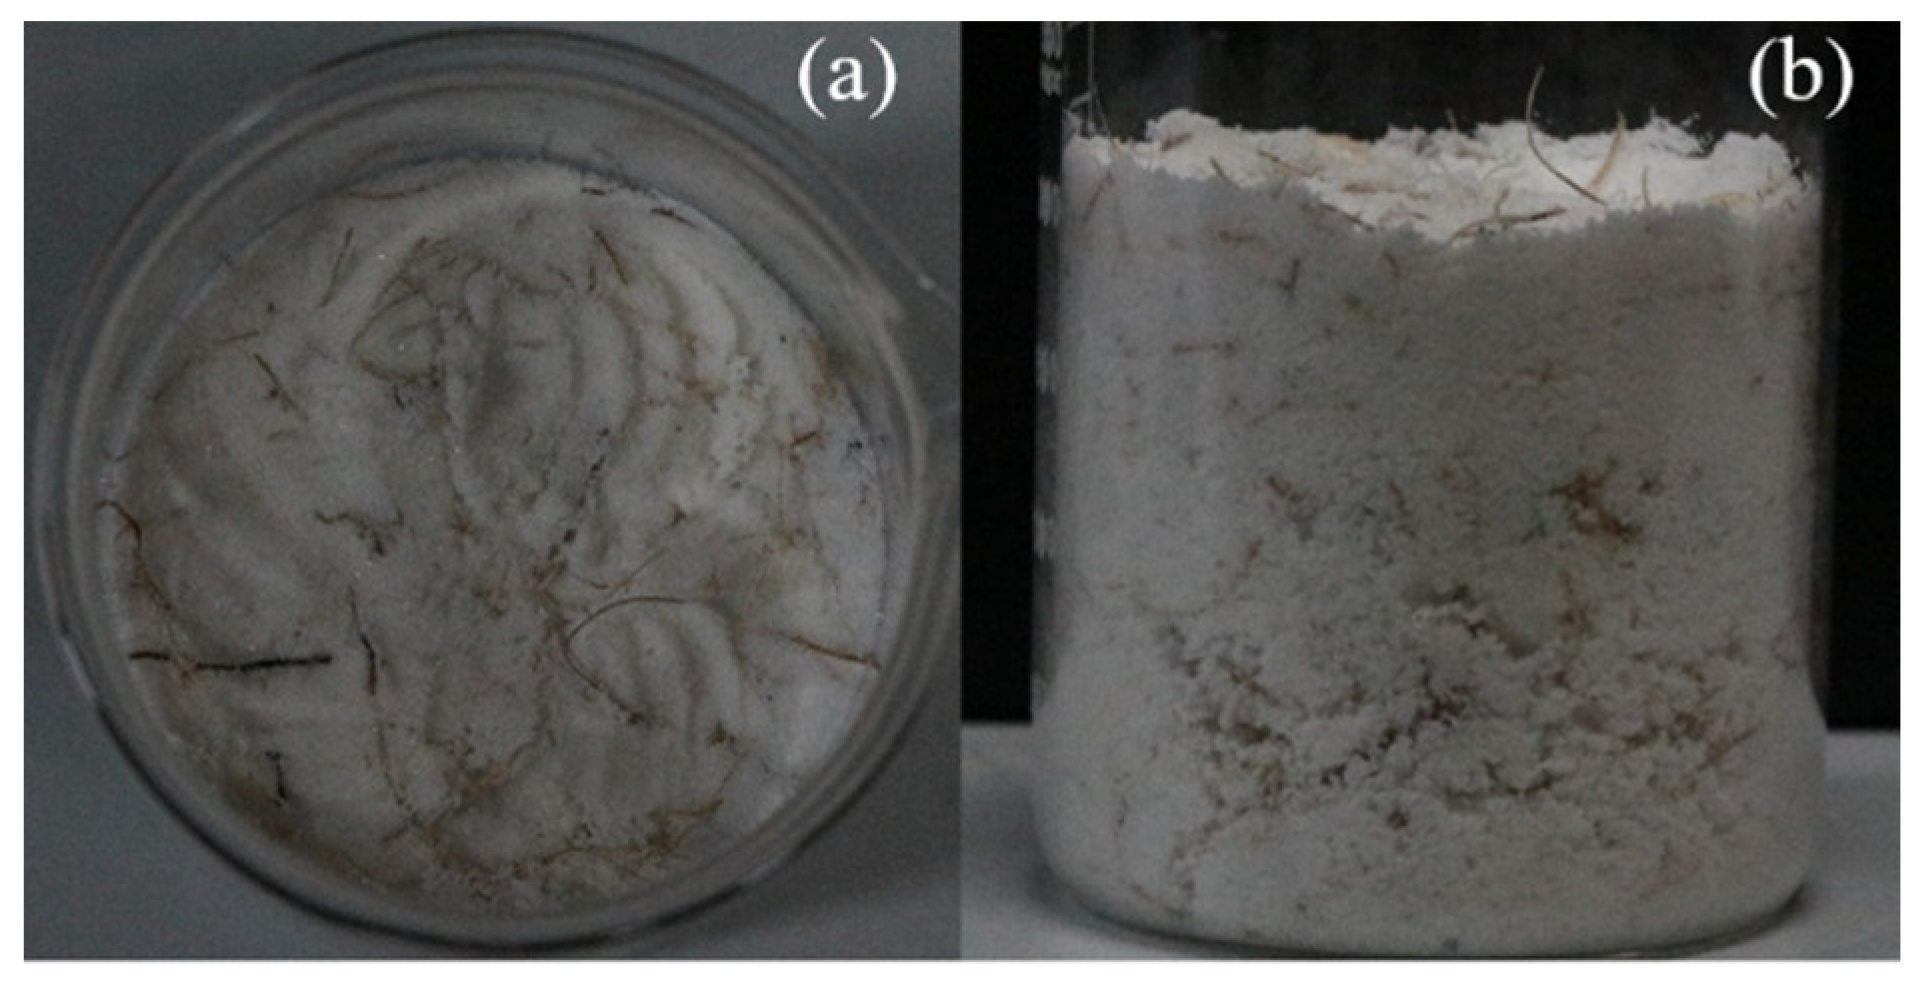
2.1. Materials
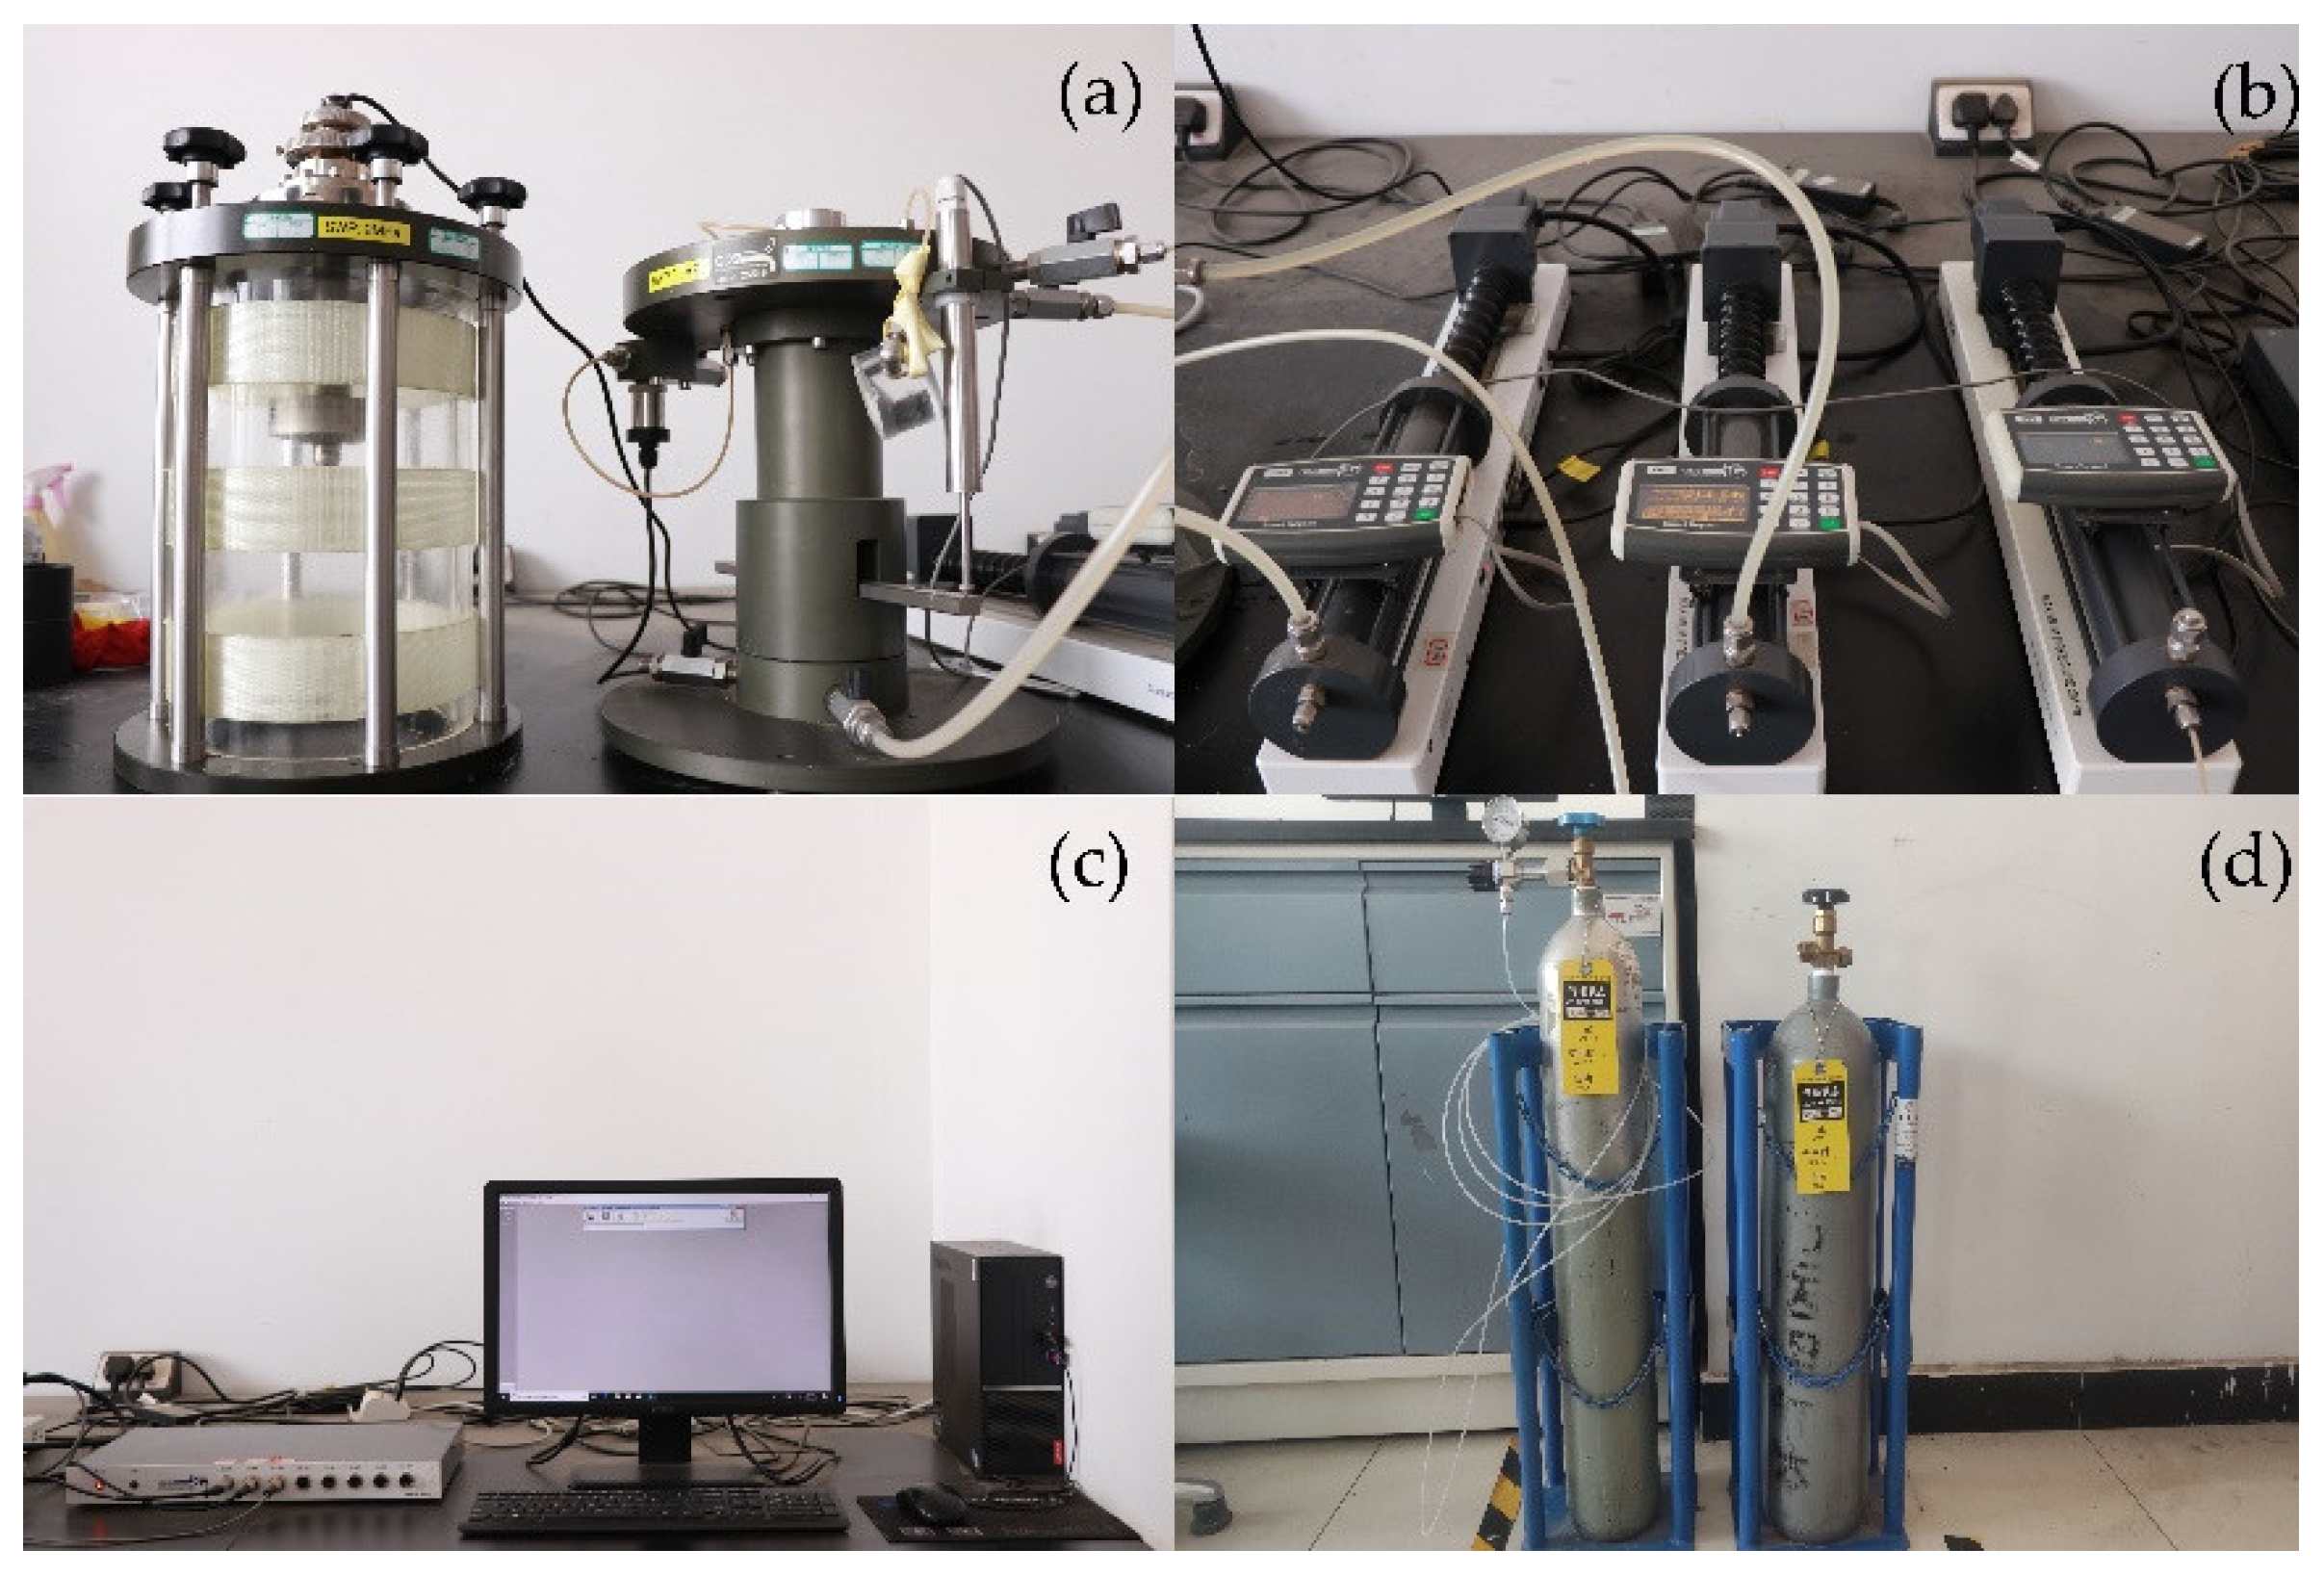
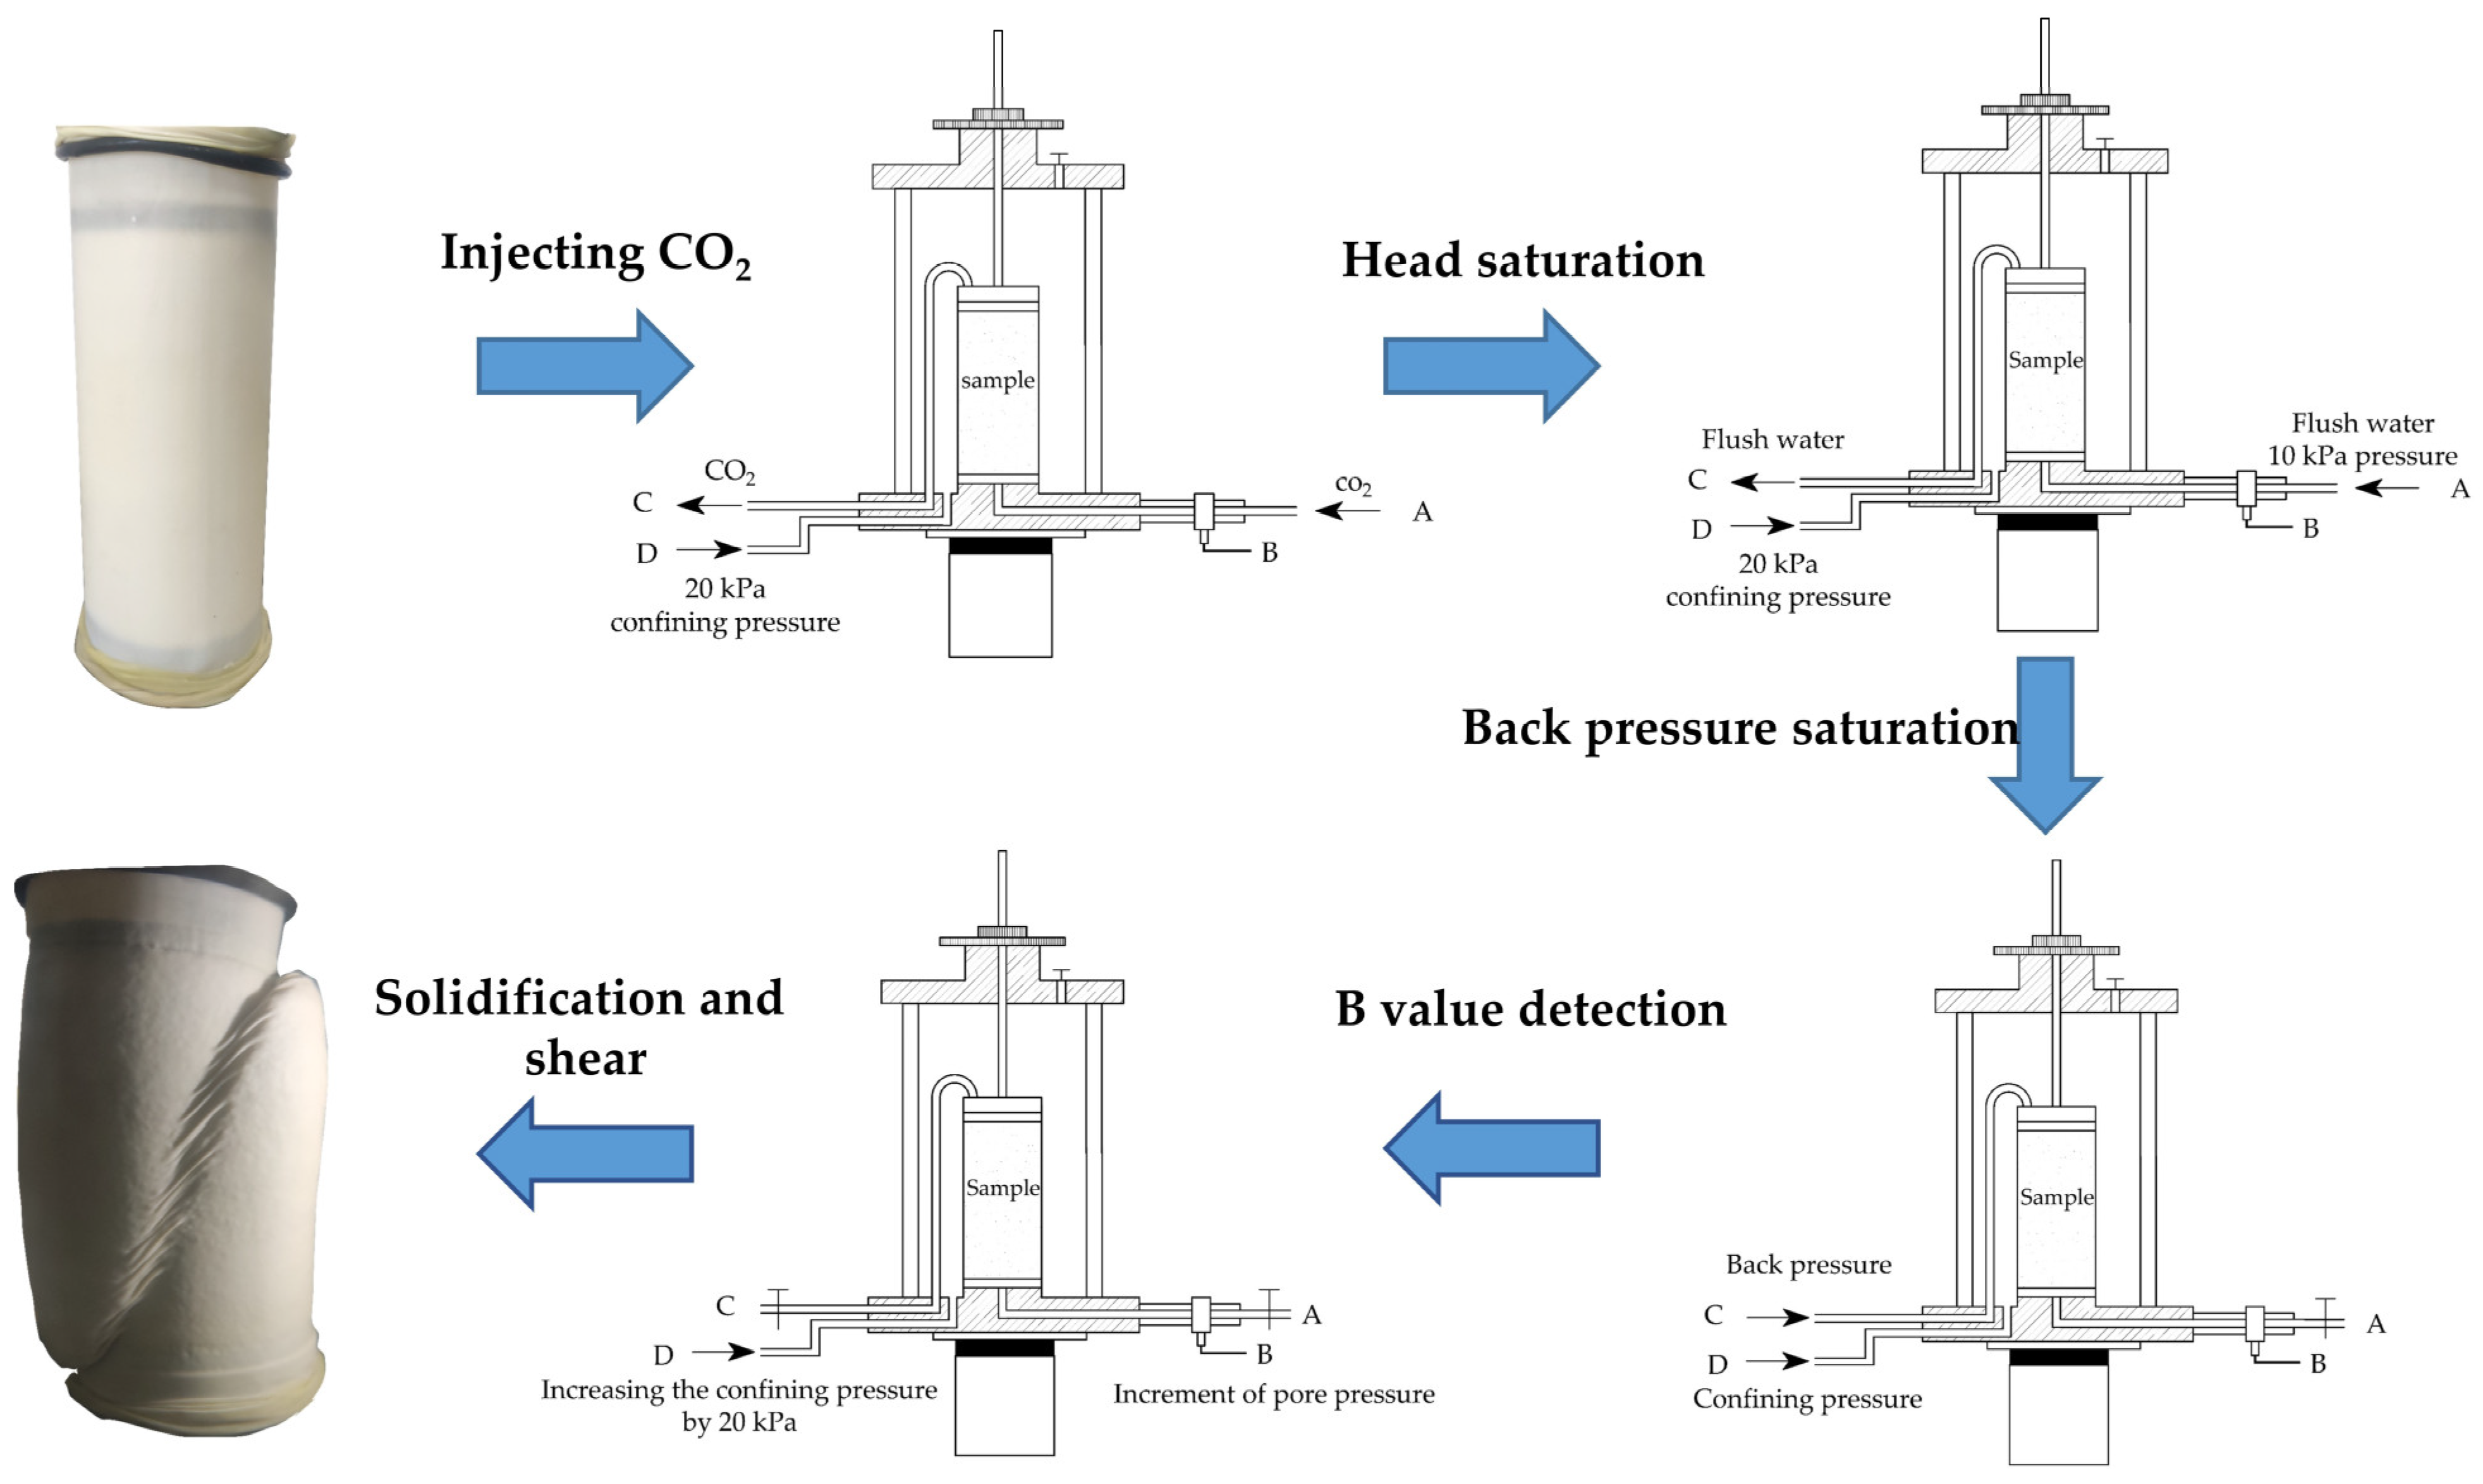
2.2. Test Setup
3. Test Results
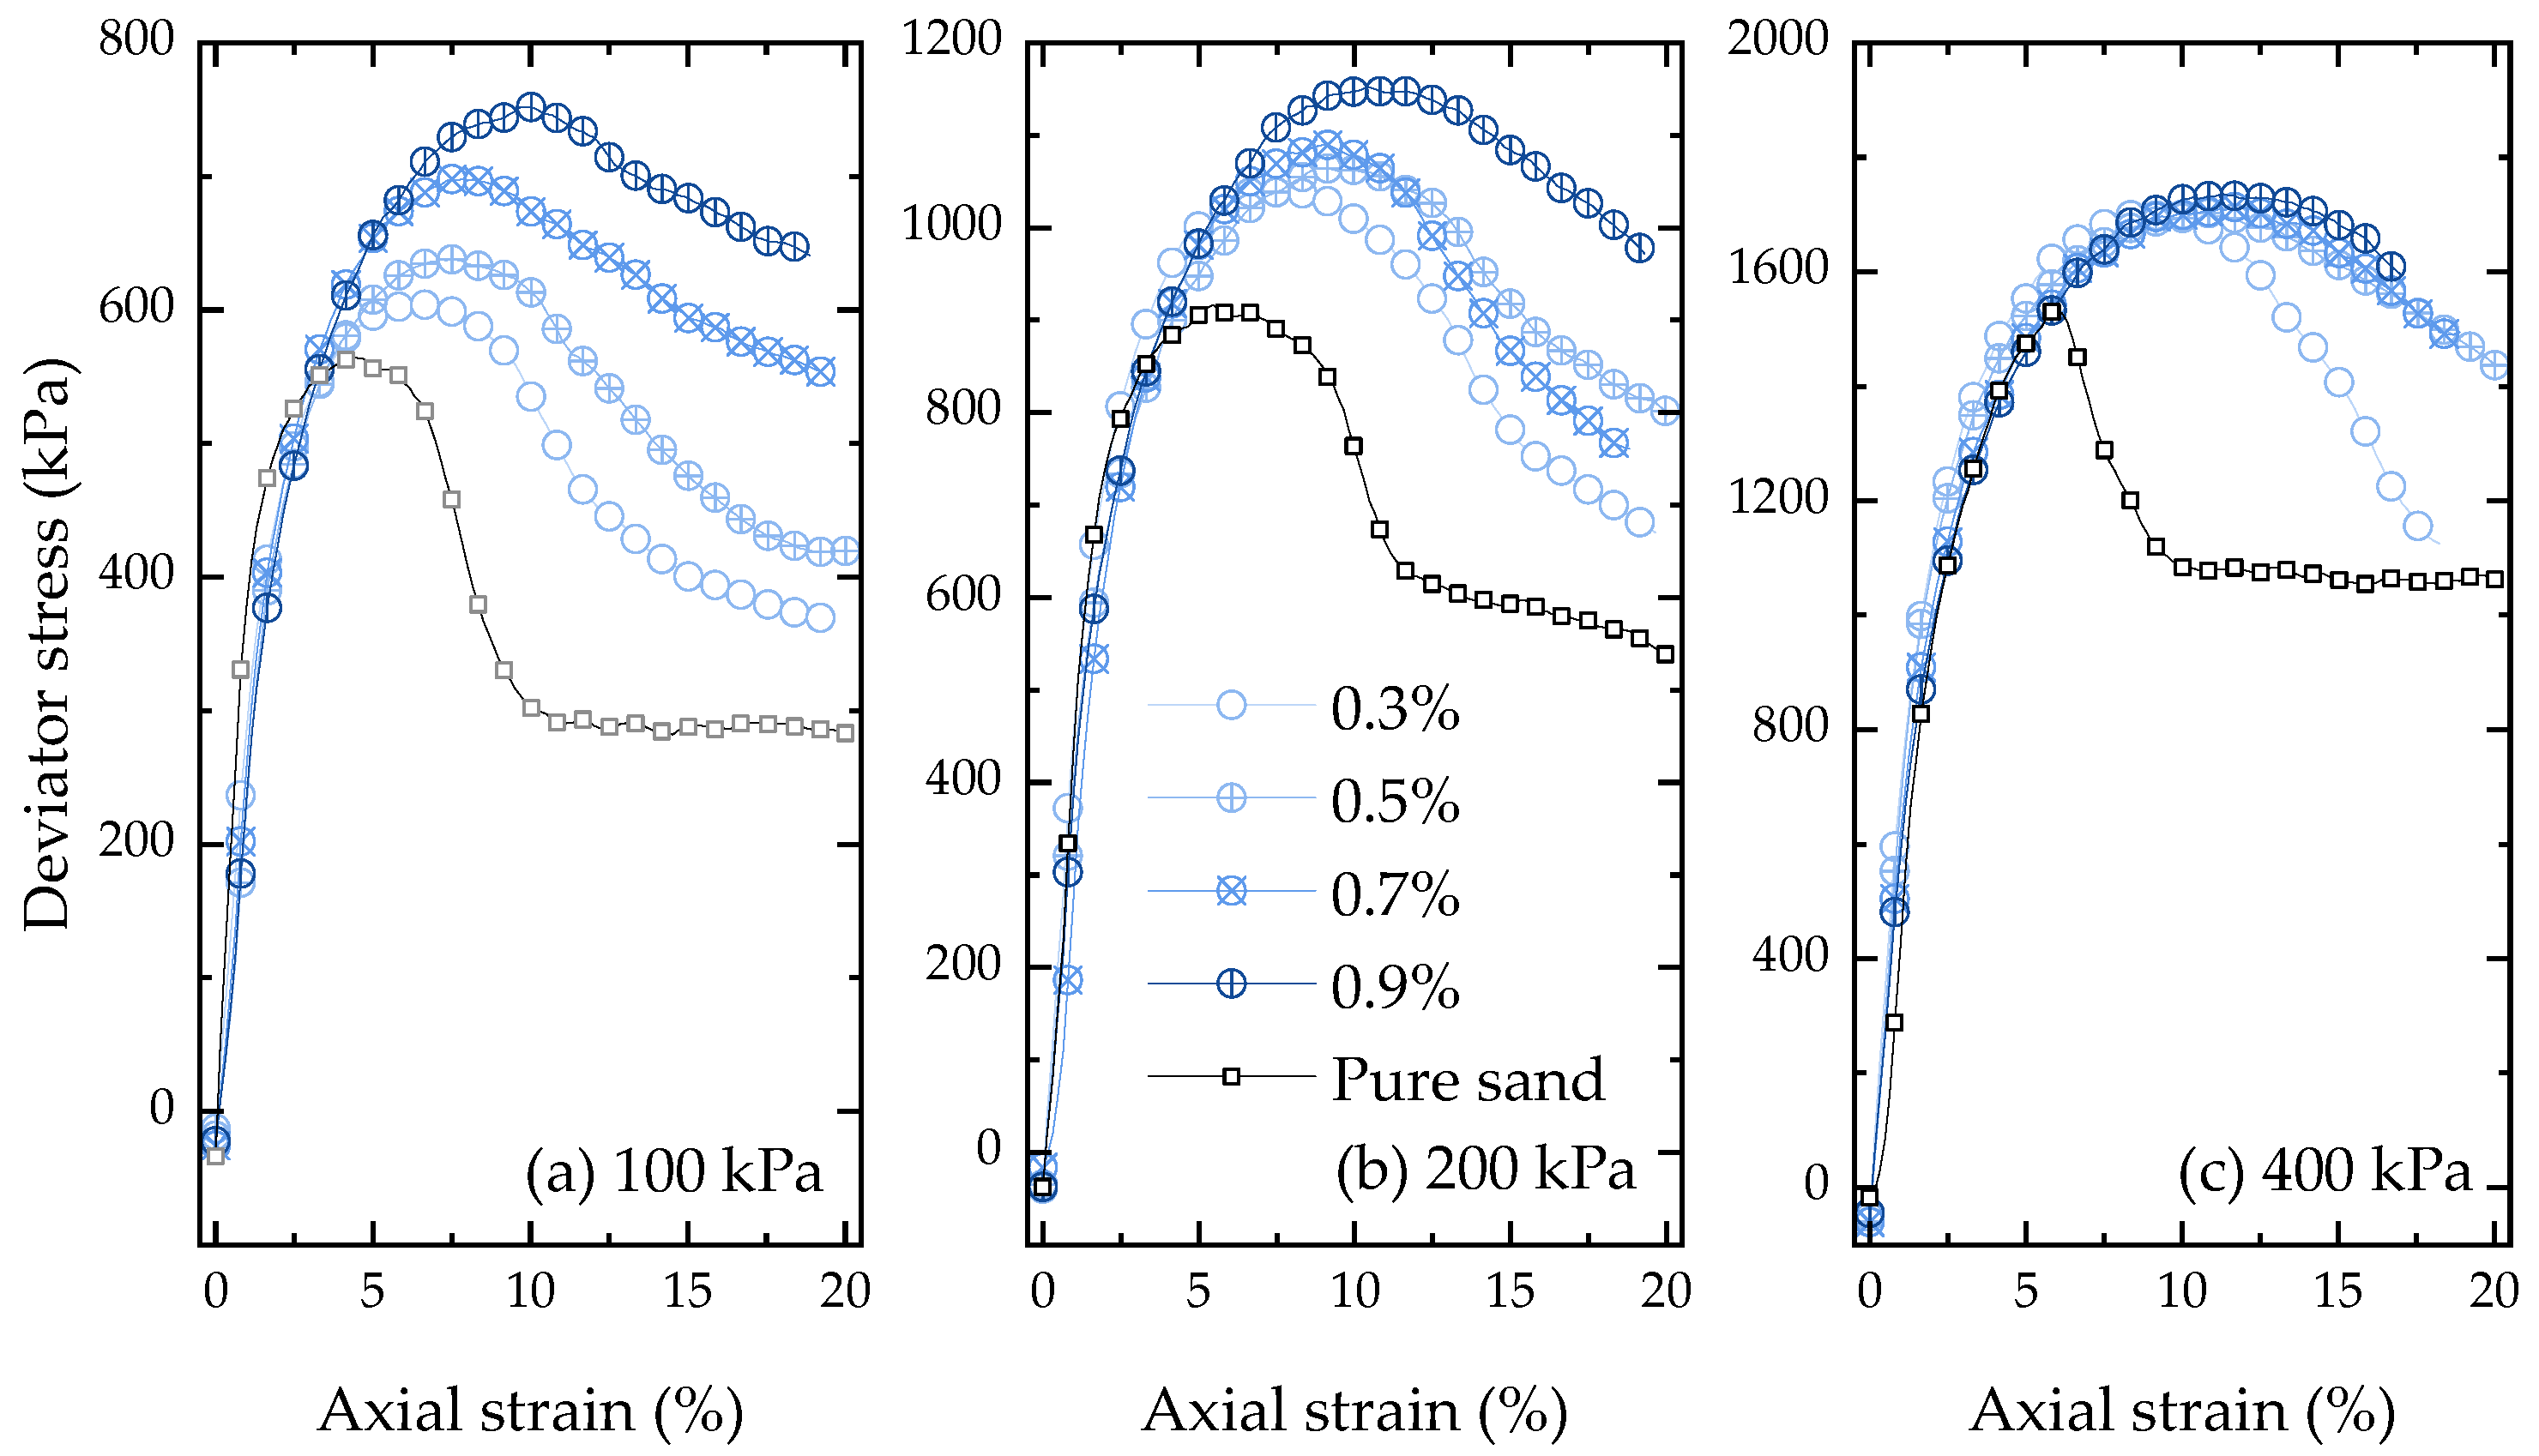
3.1. Deviator Stress and Strain
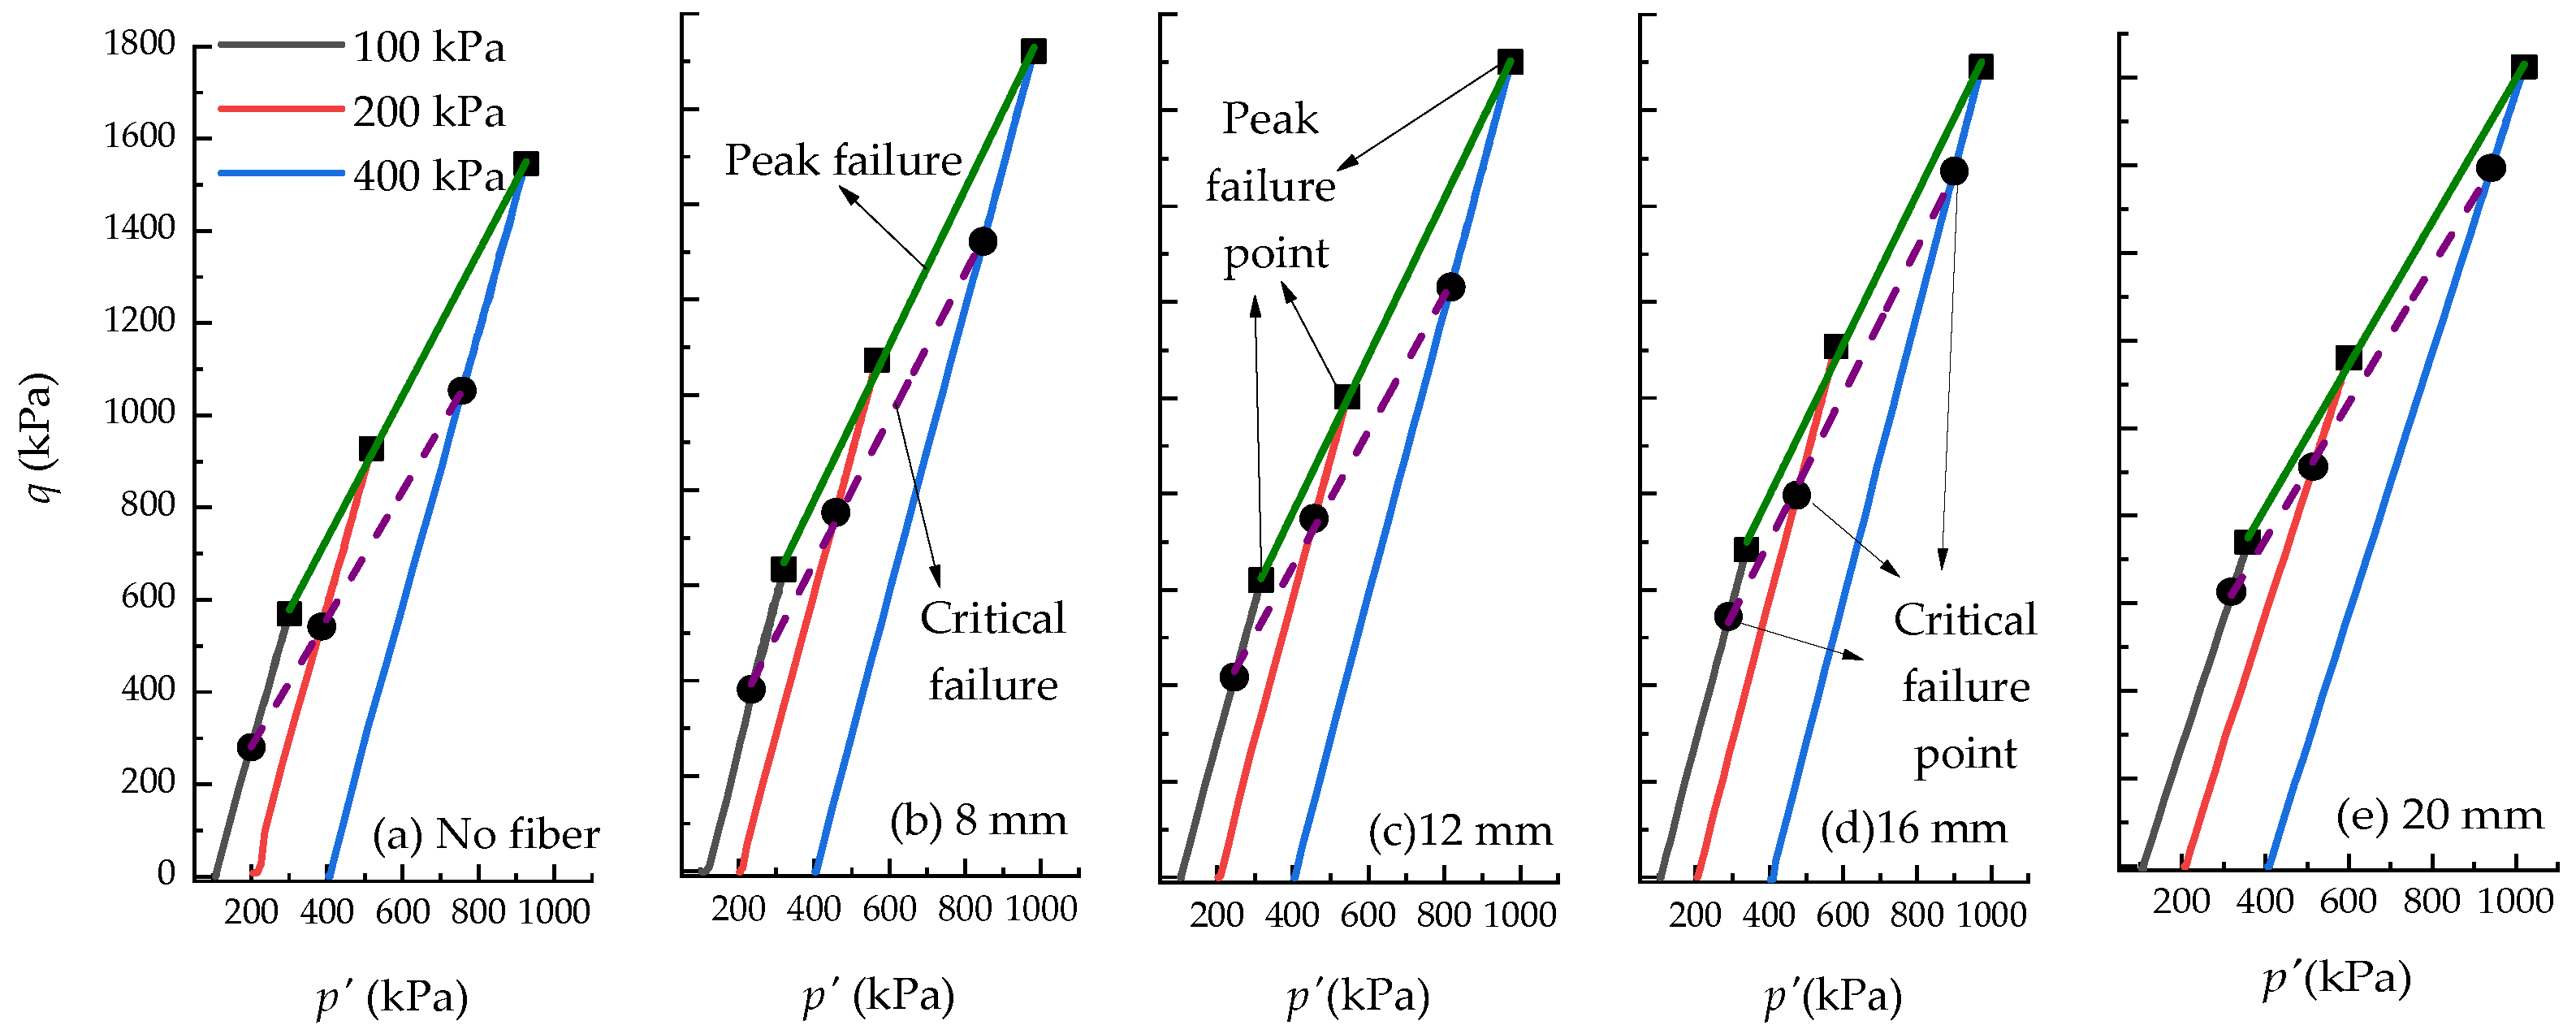
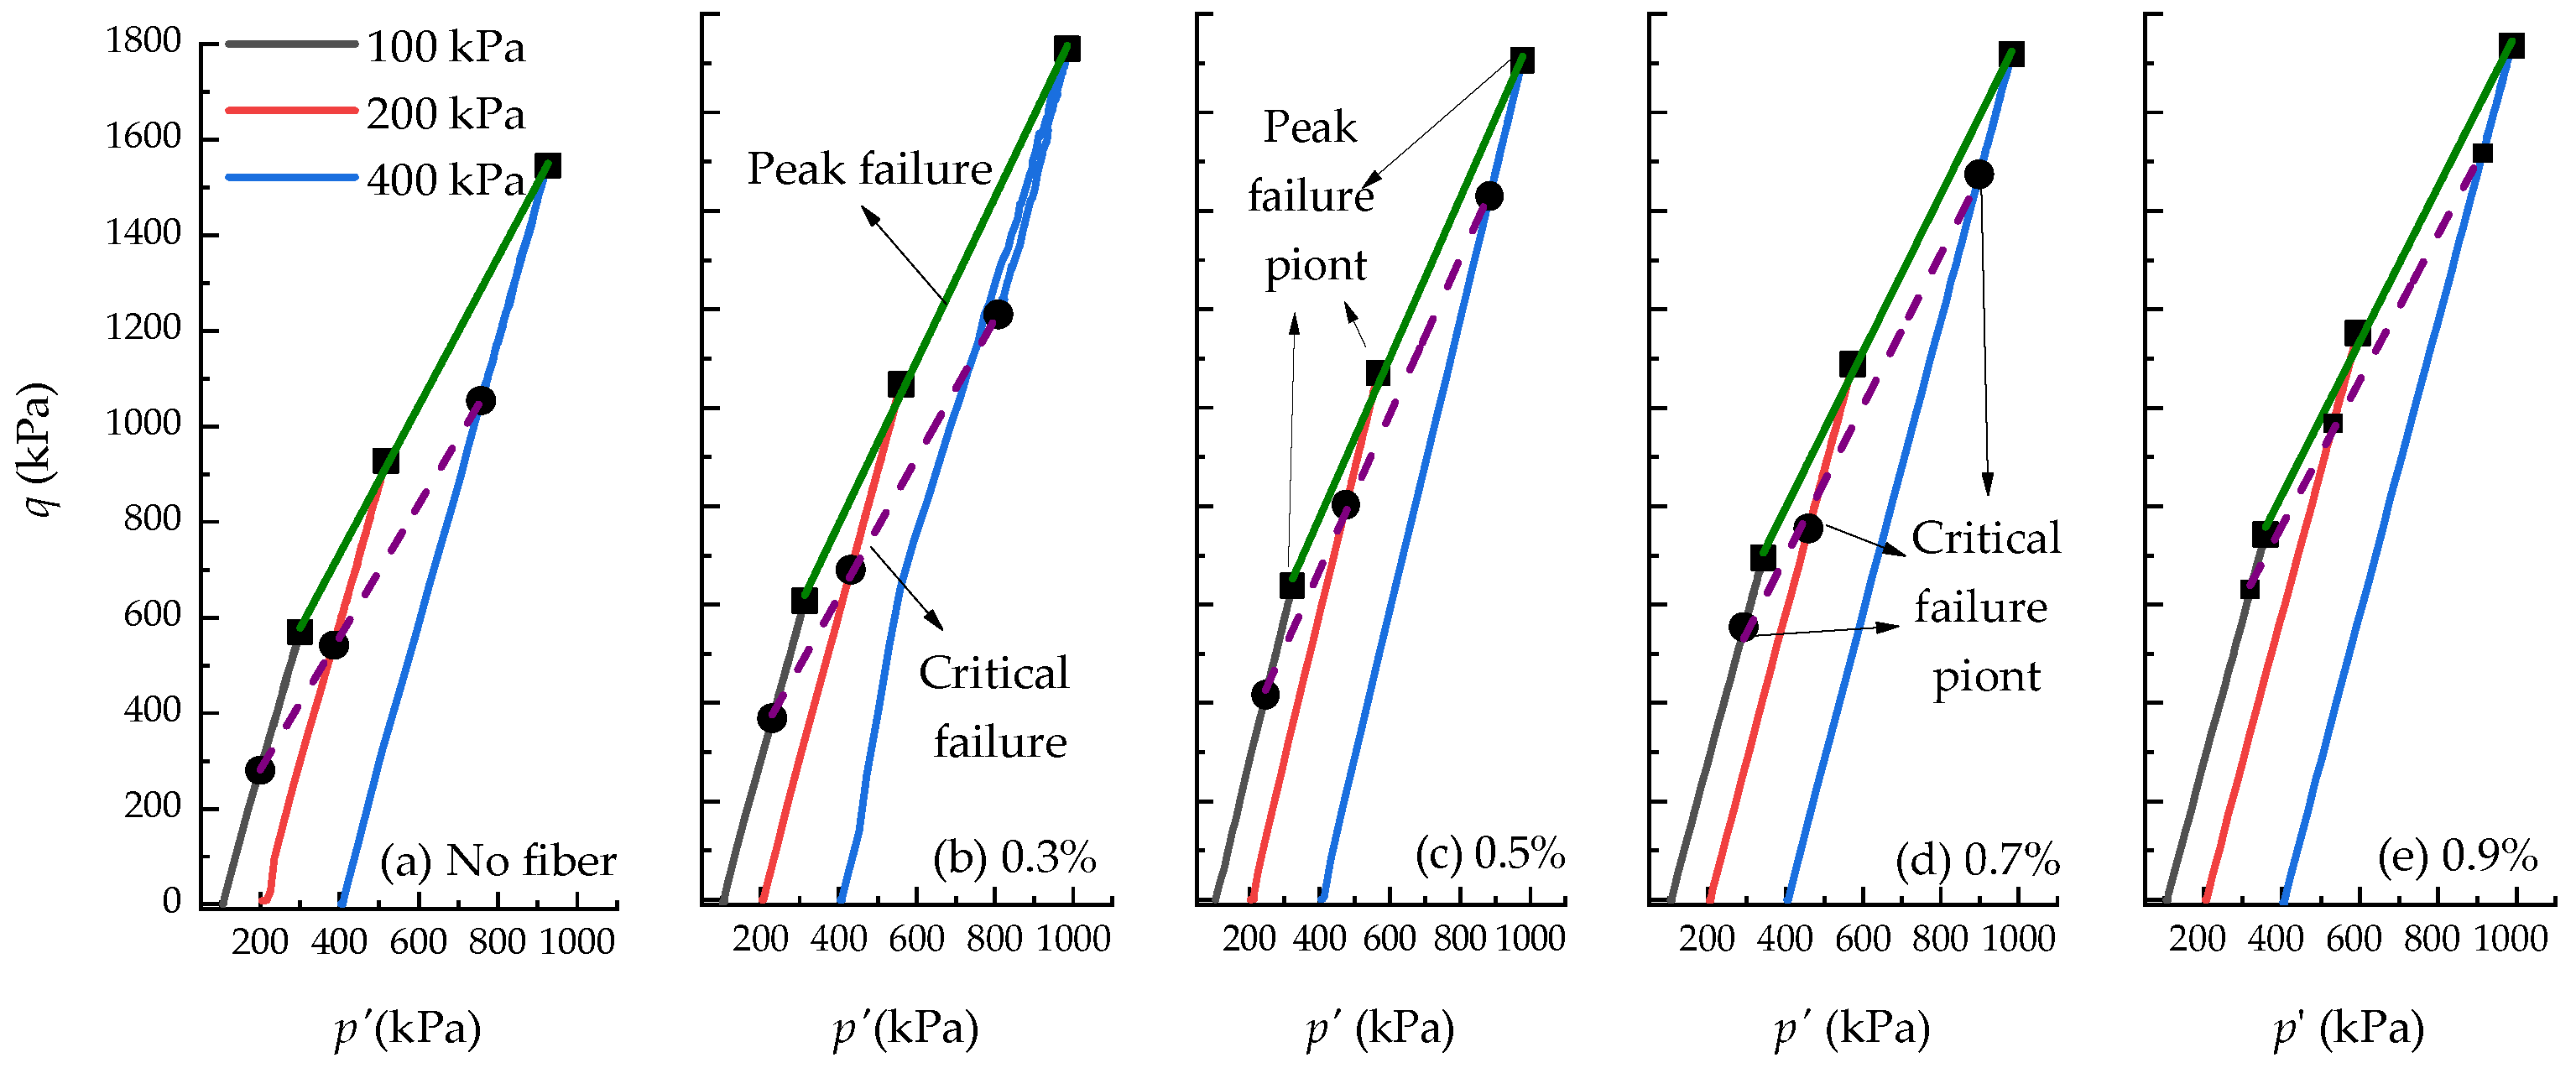
3.2. Stress Path
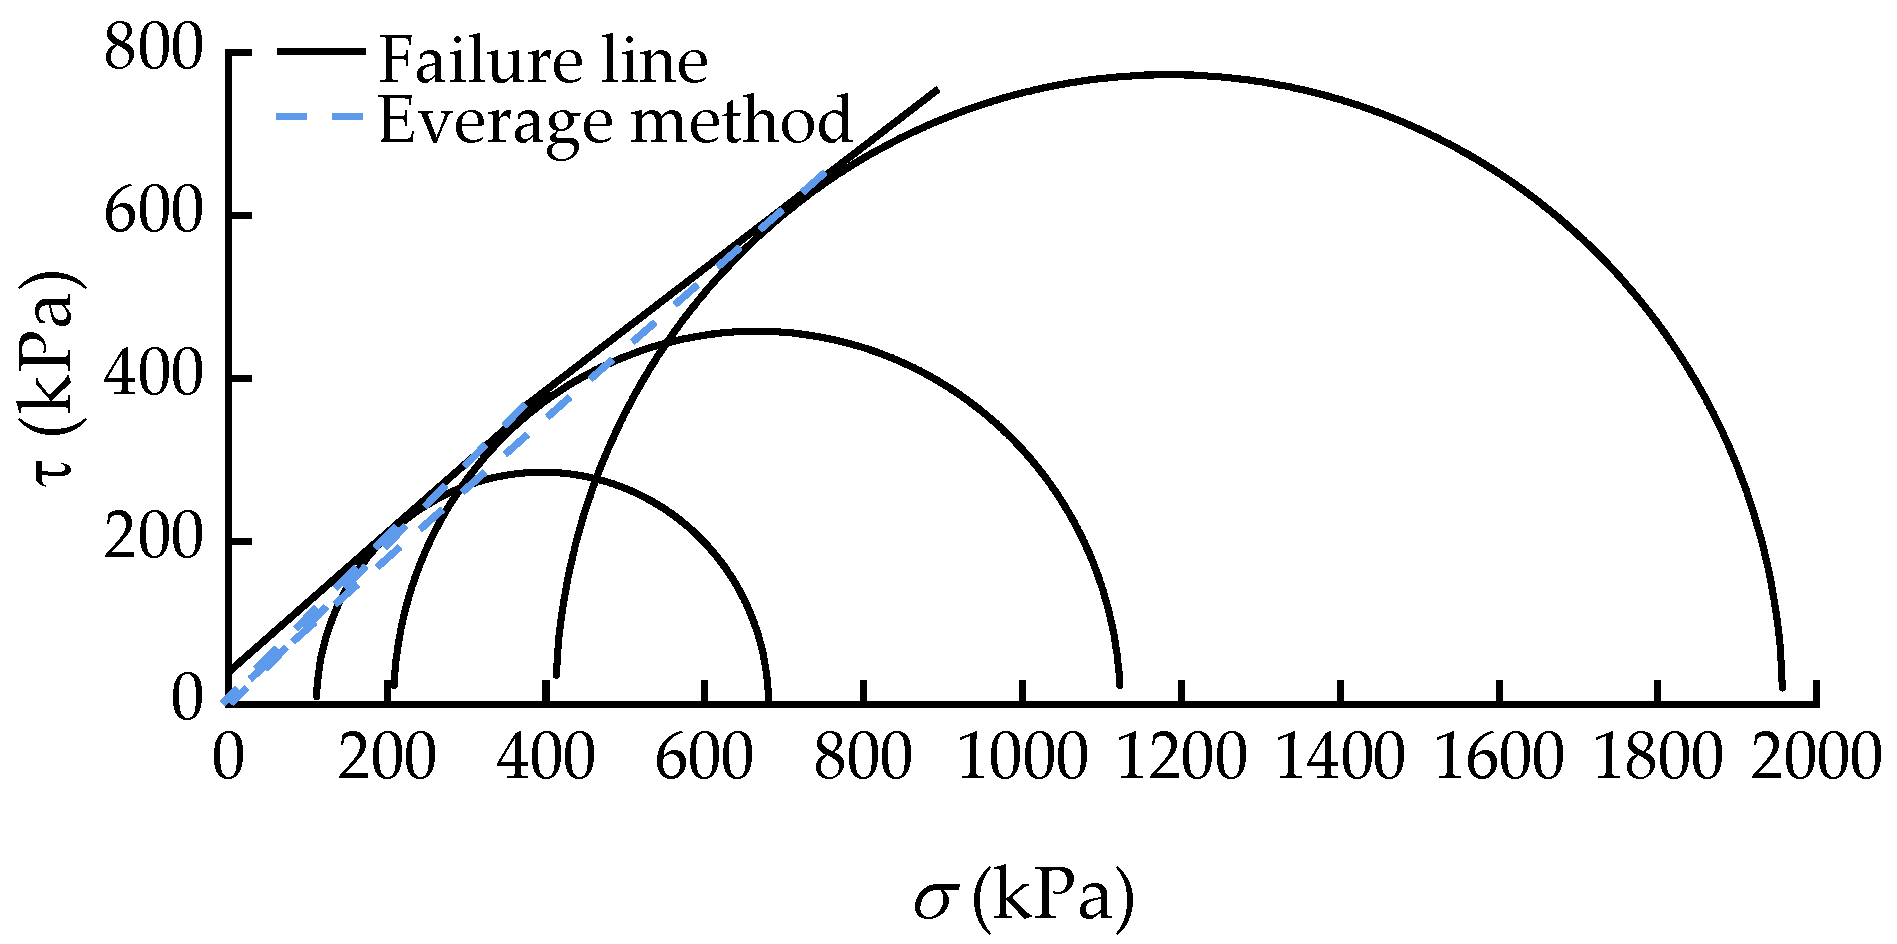
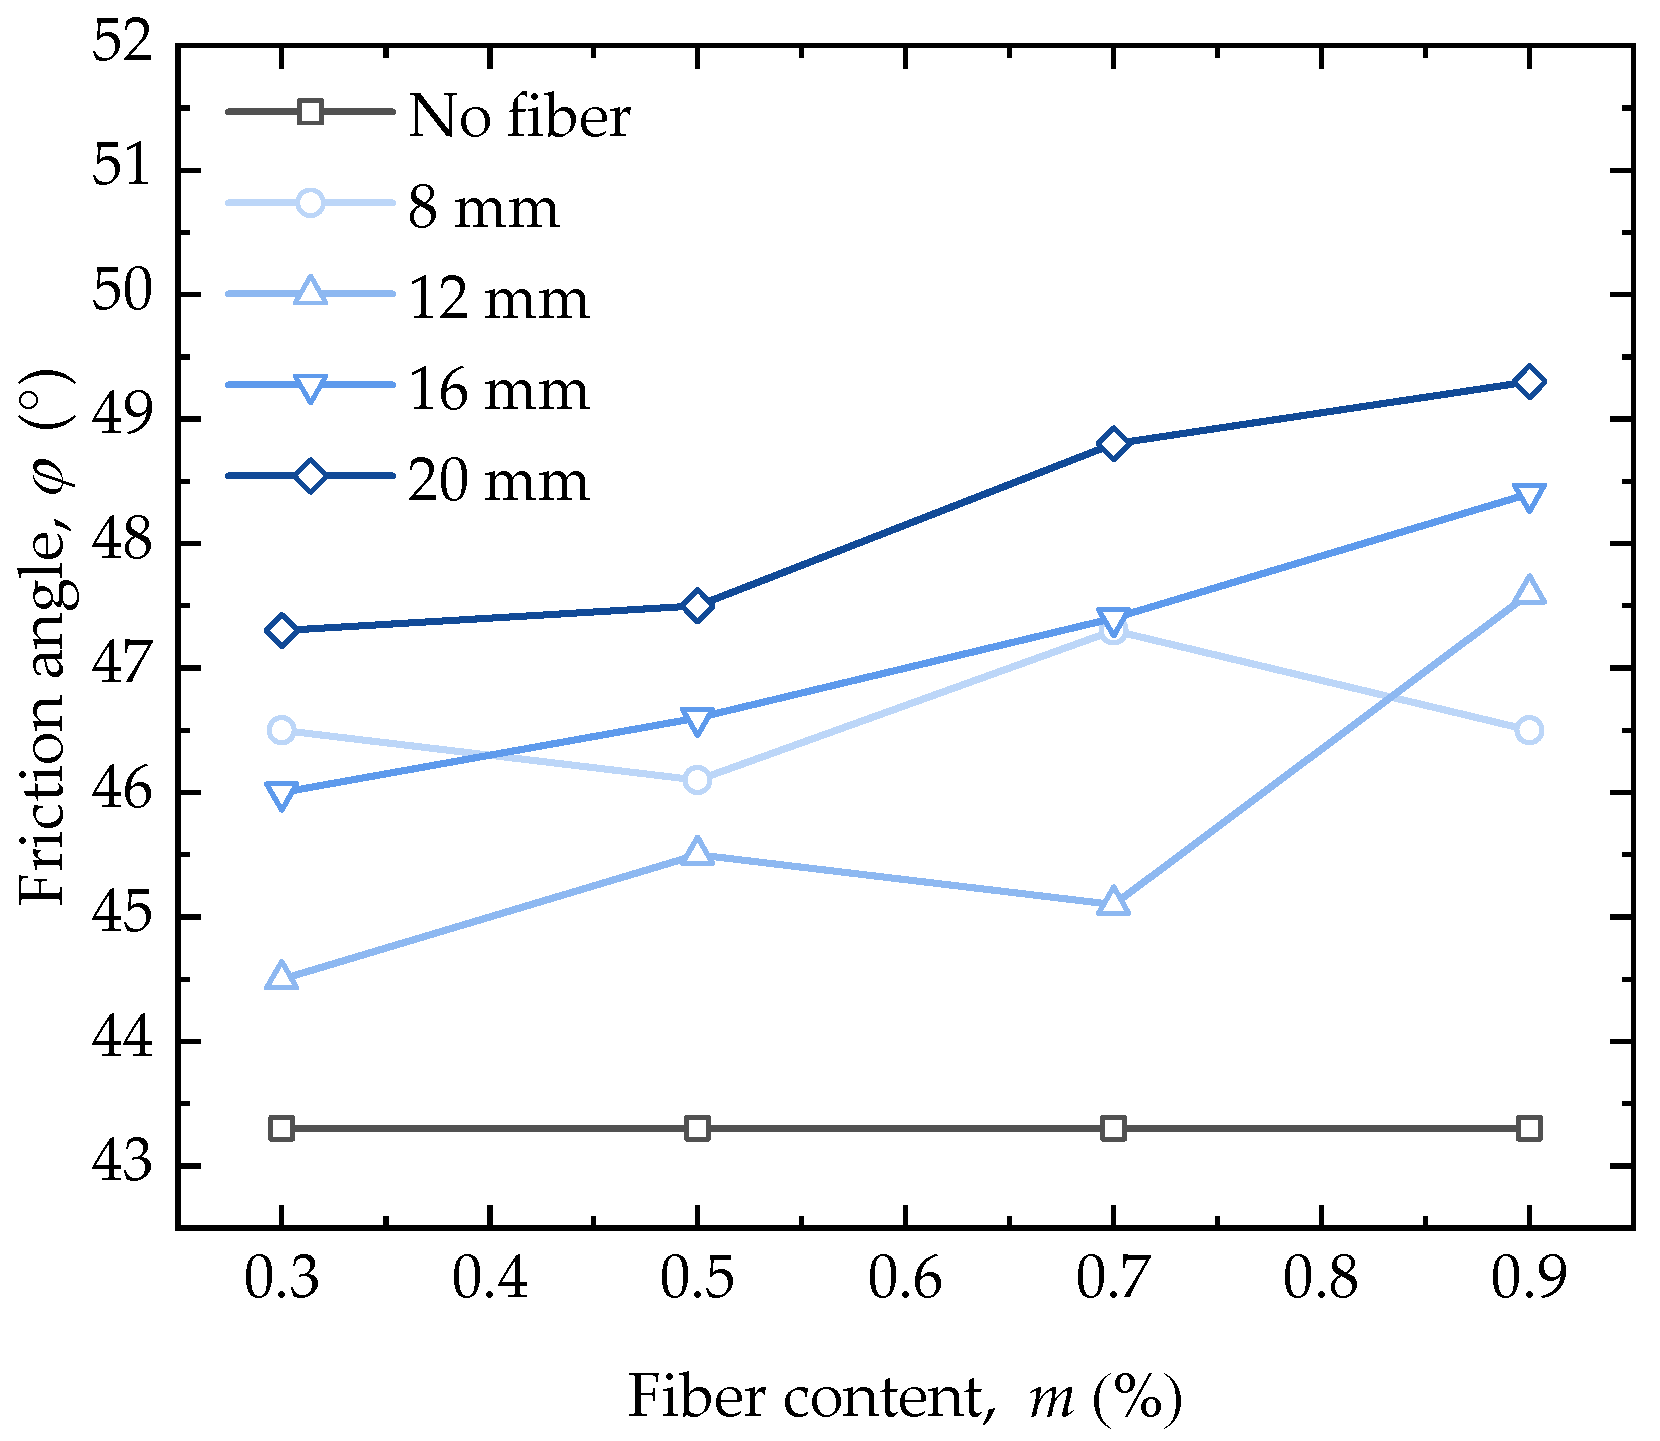
3.3. Shear Strength
4. Discussion
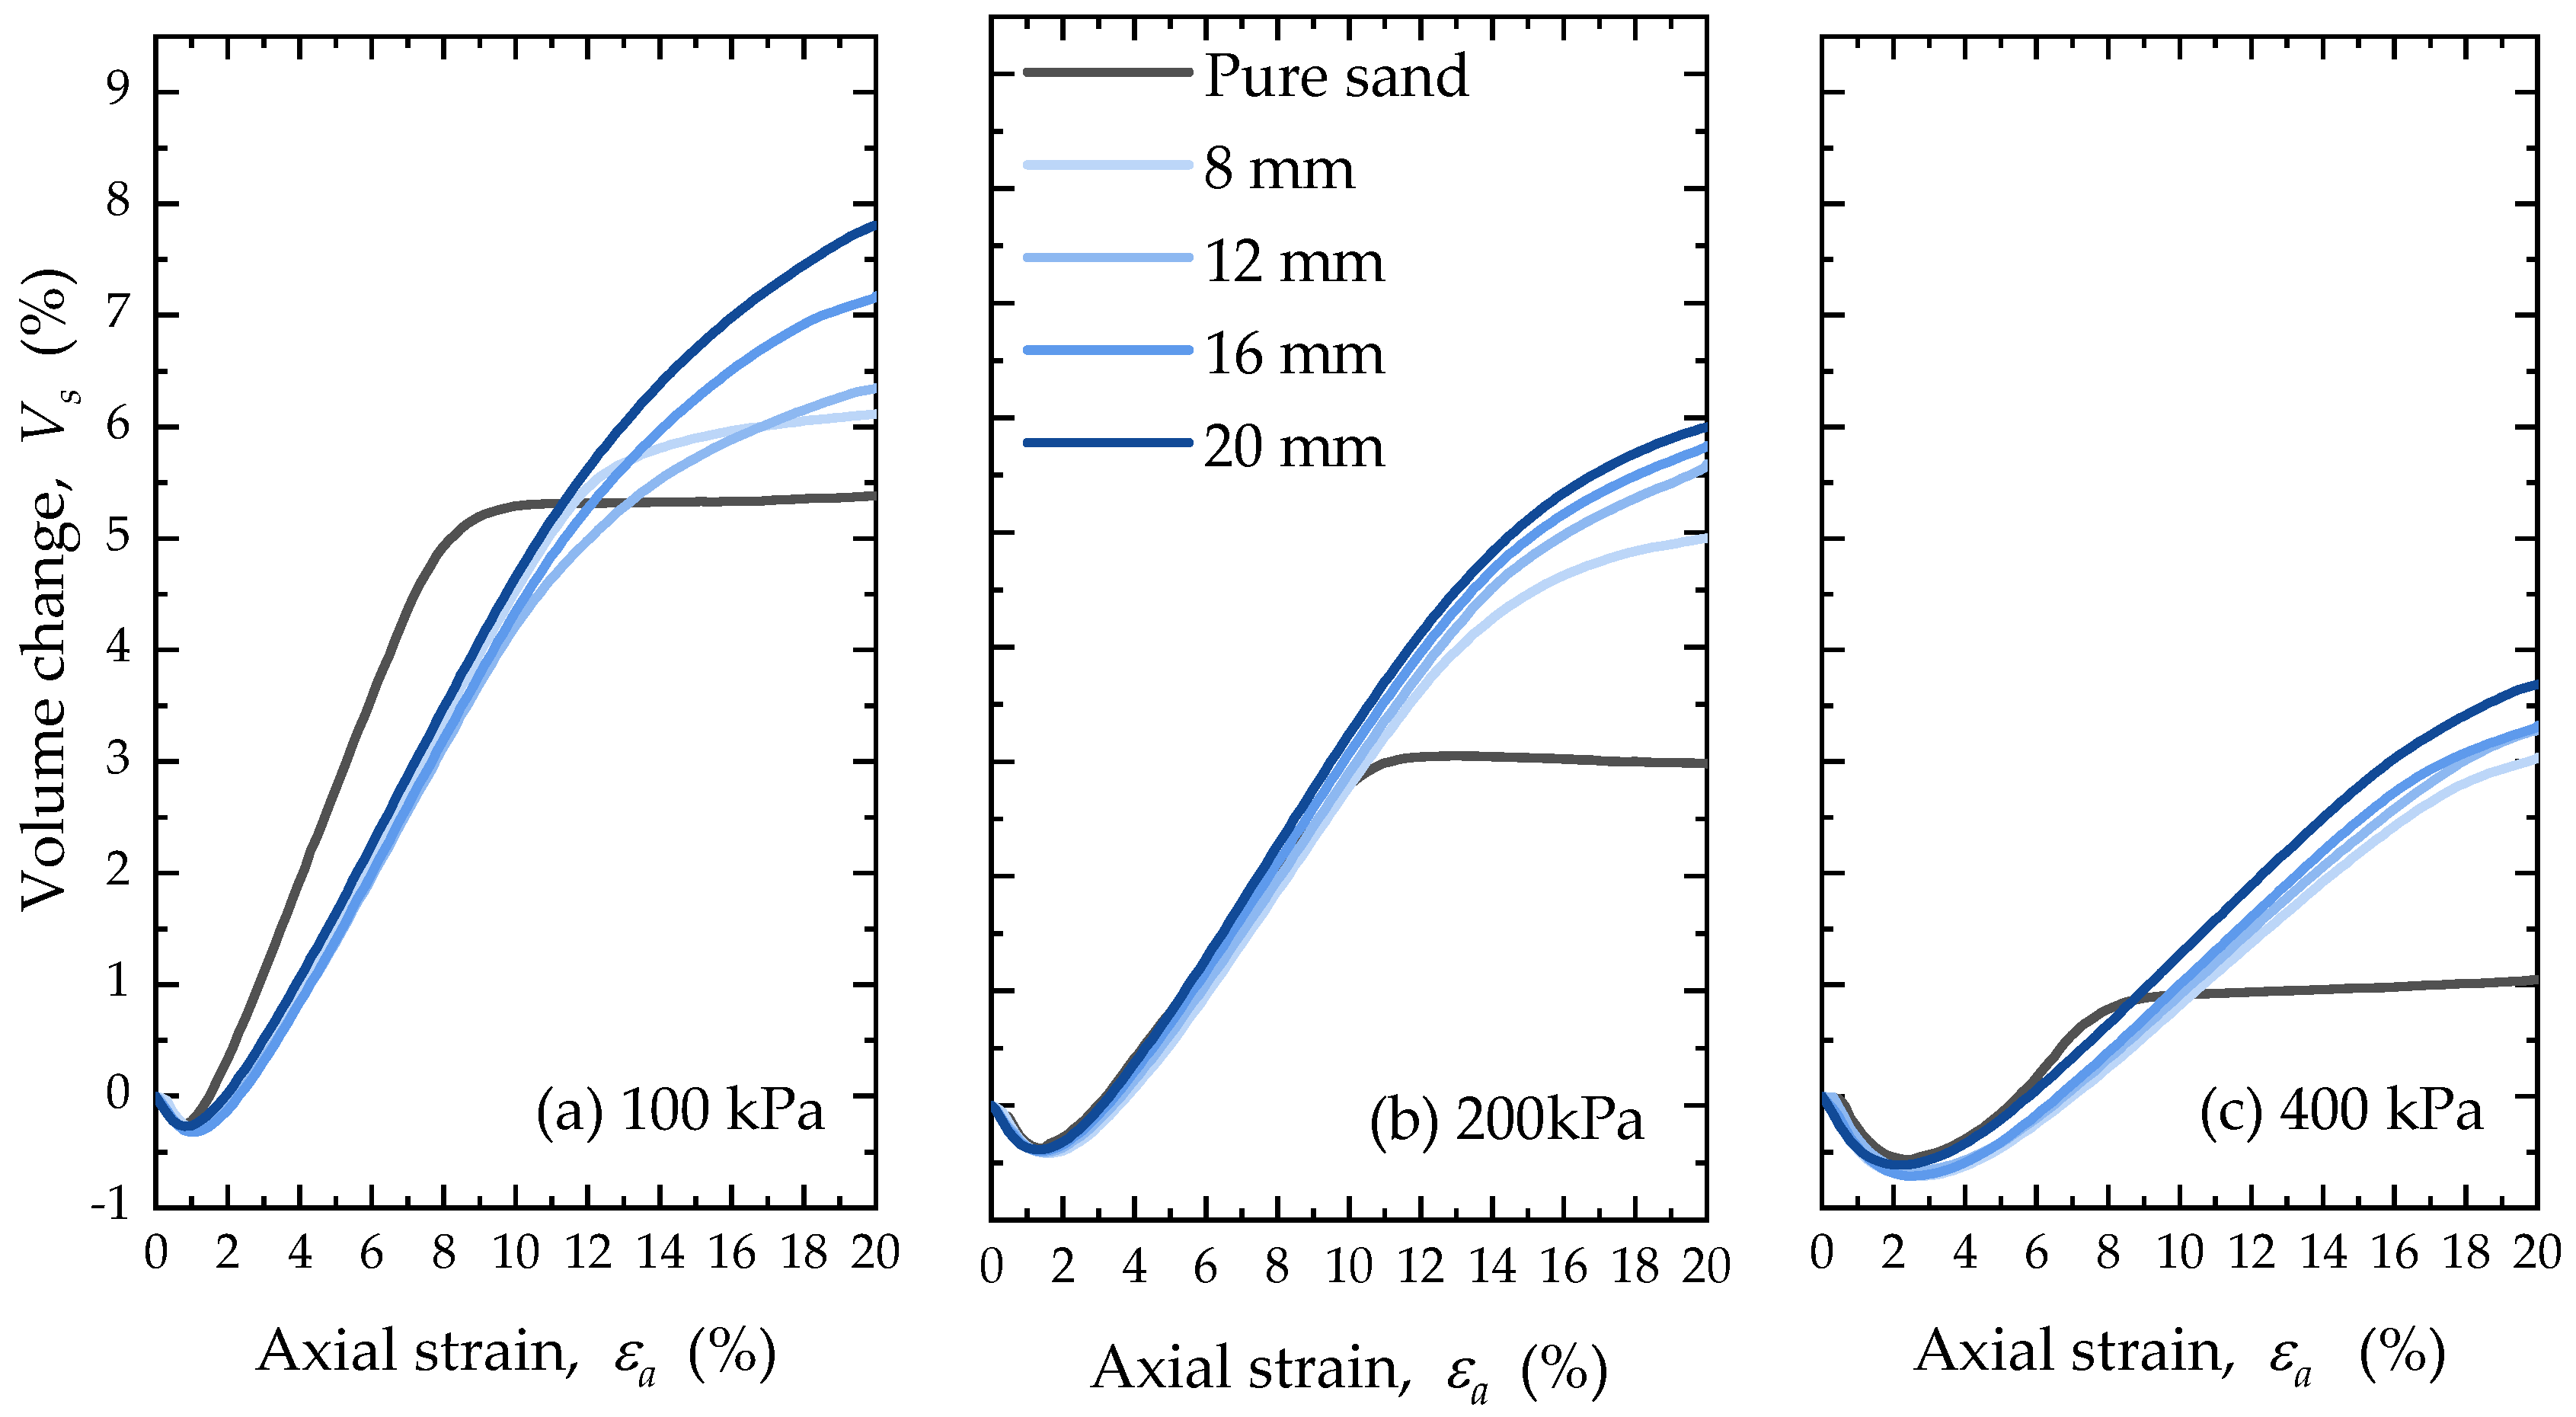
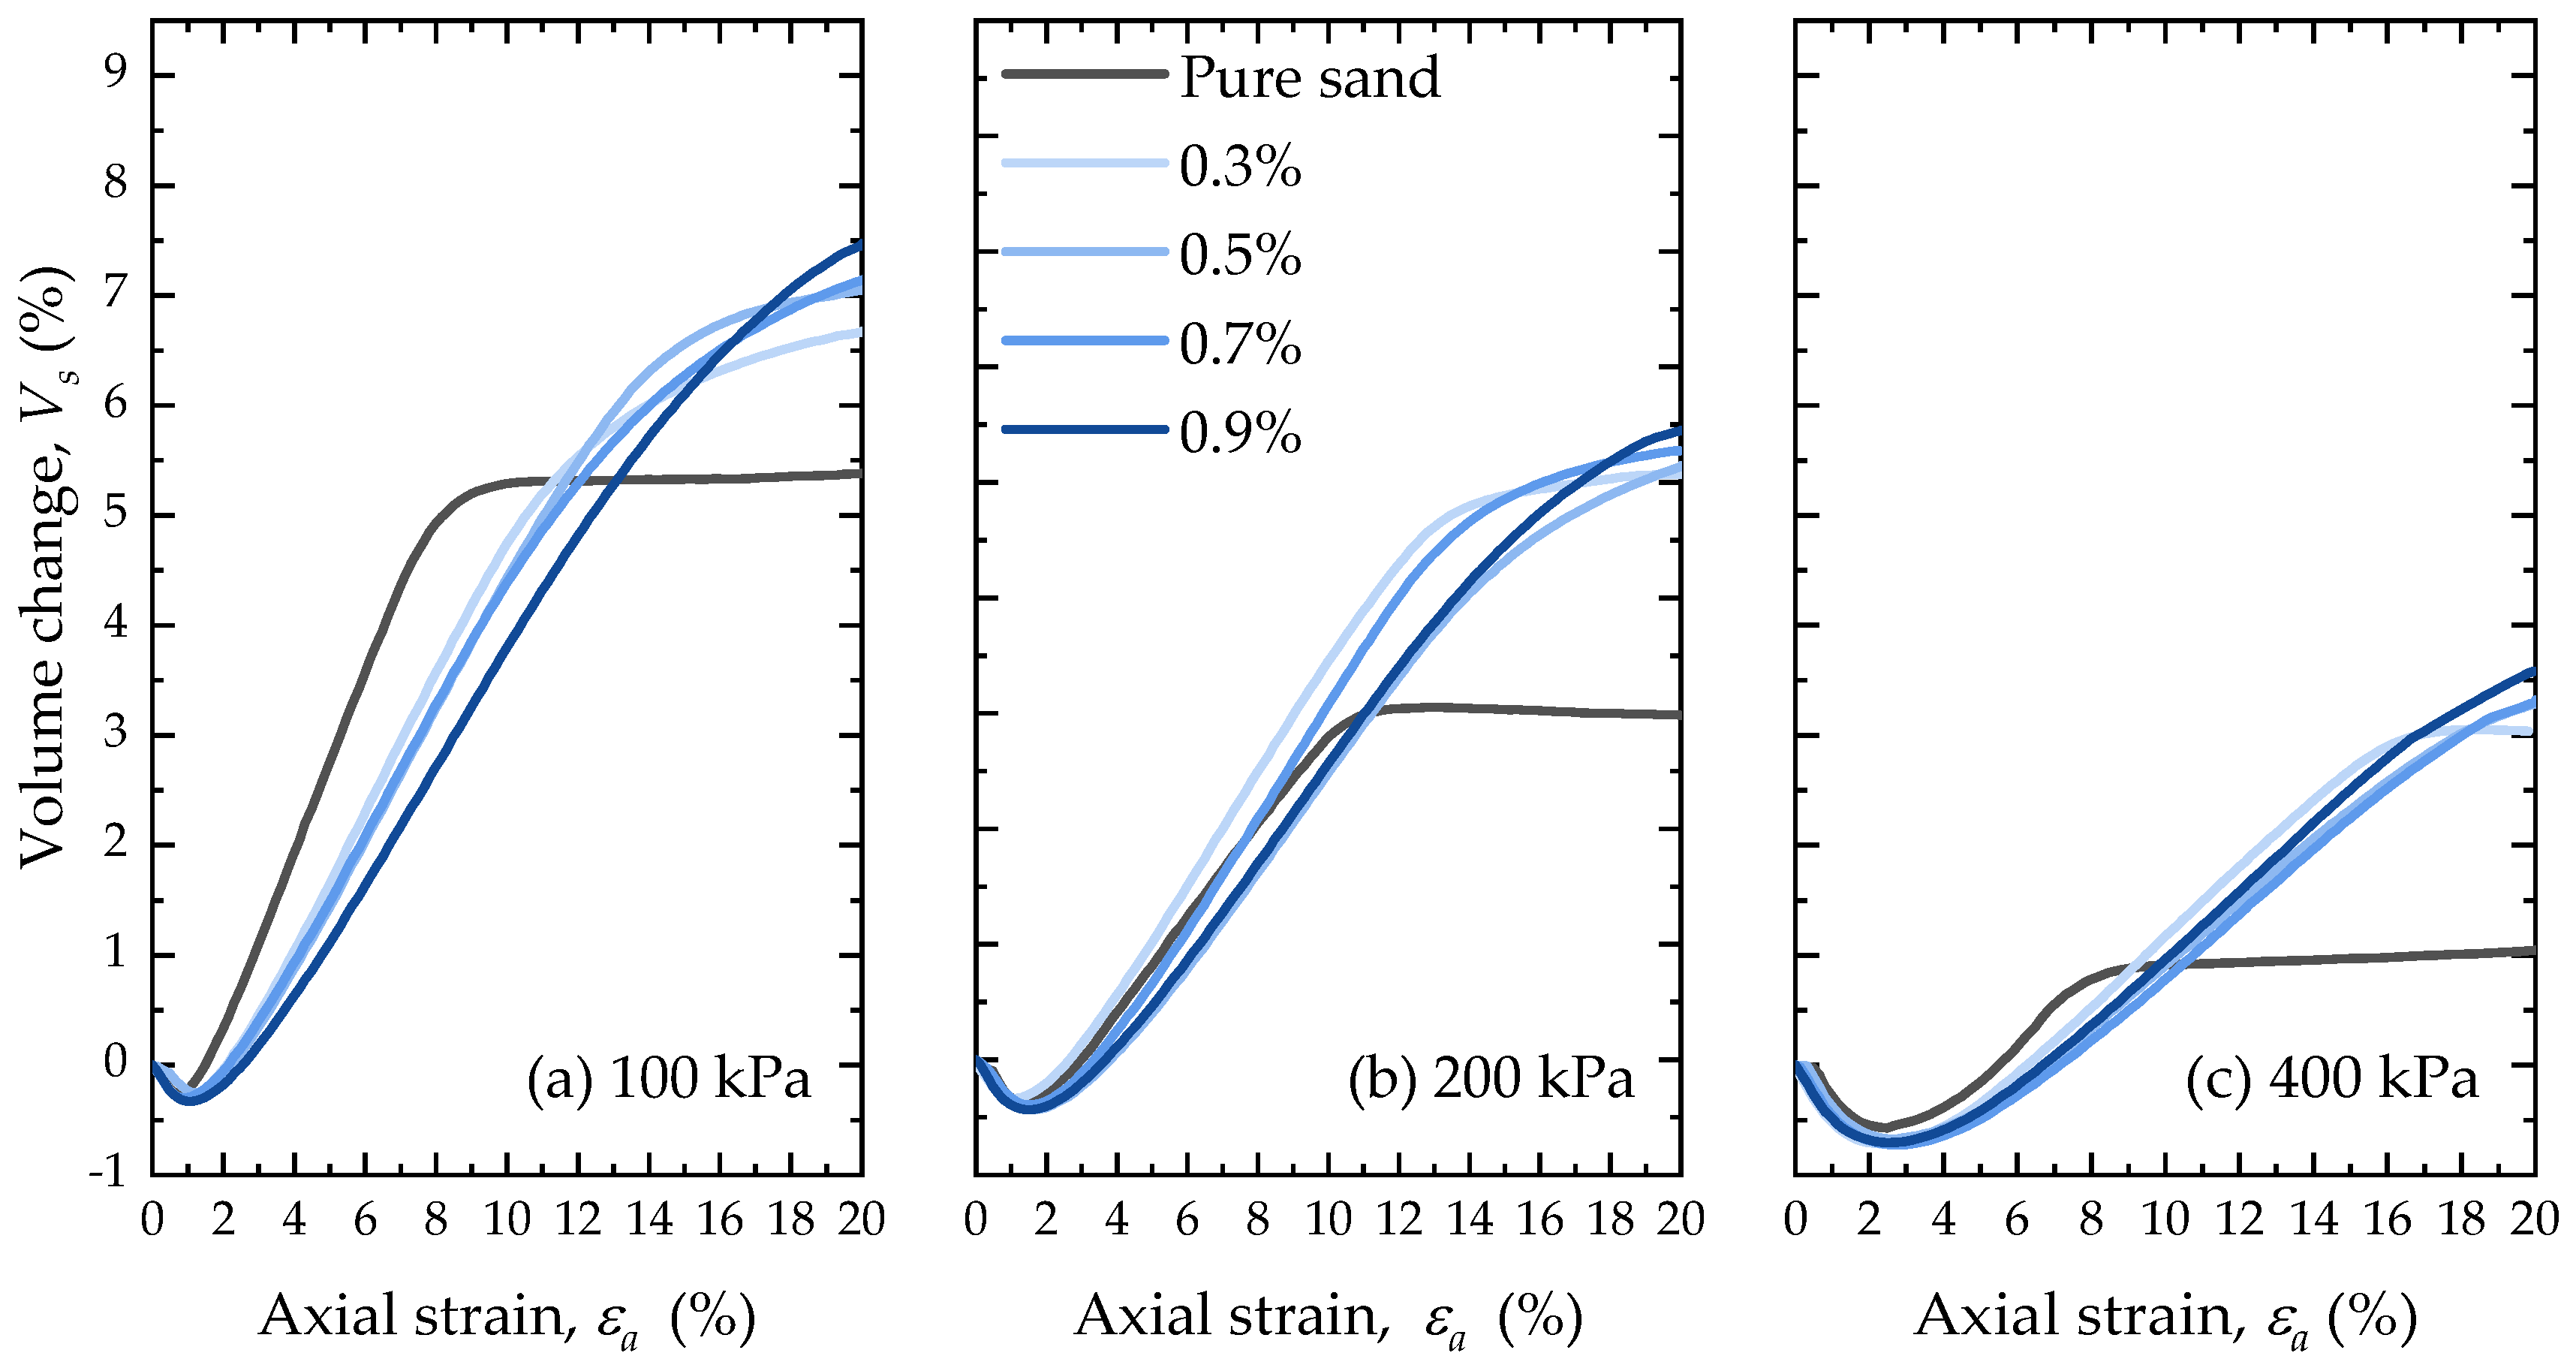
4.1. Volume Change
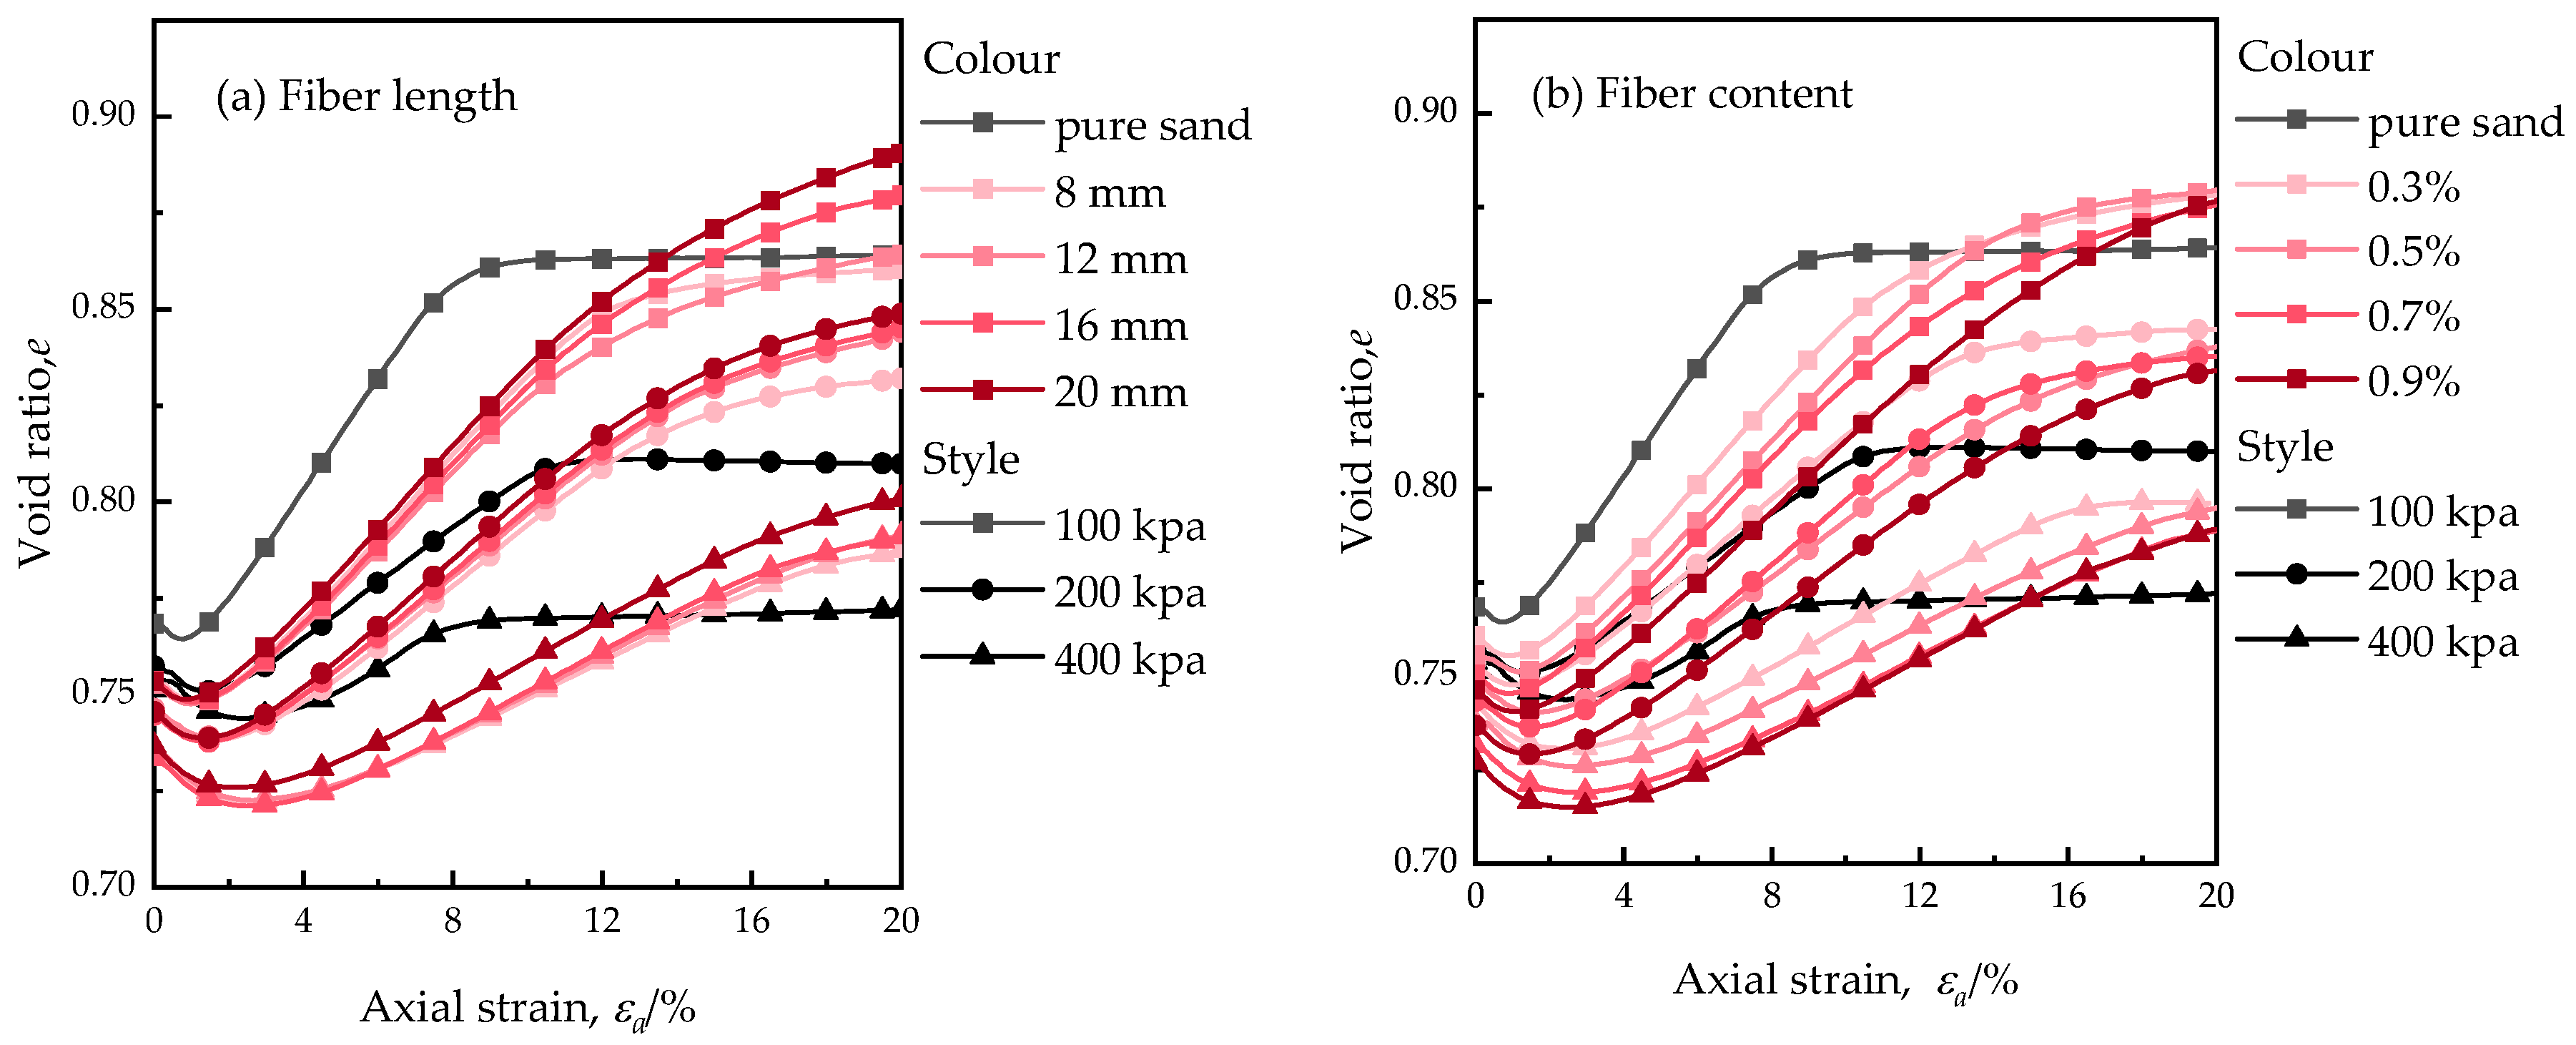
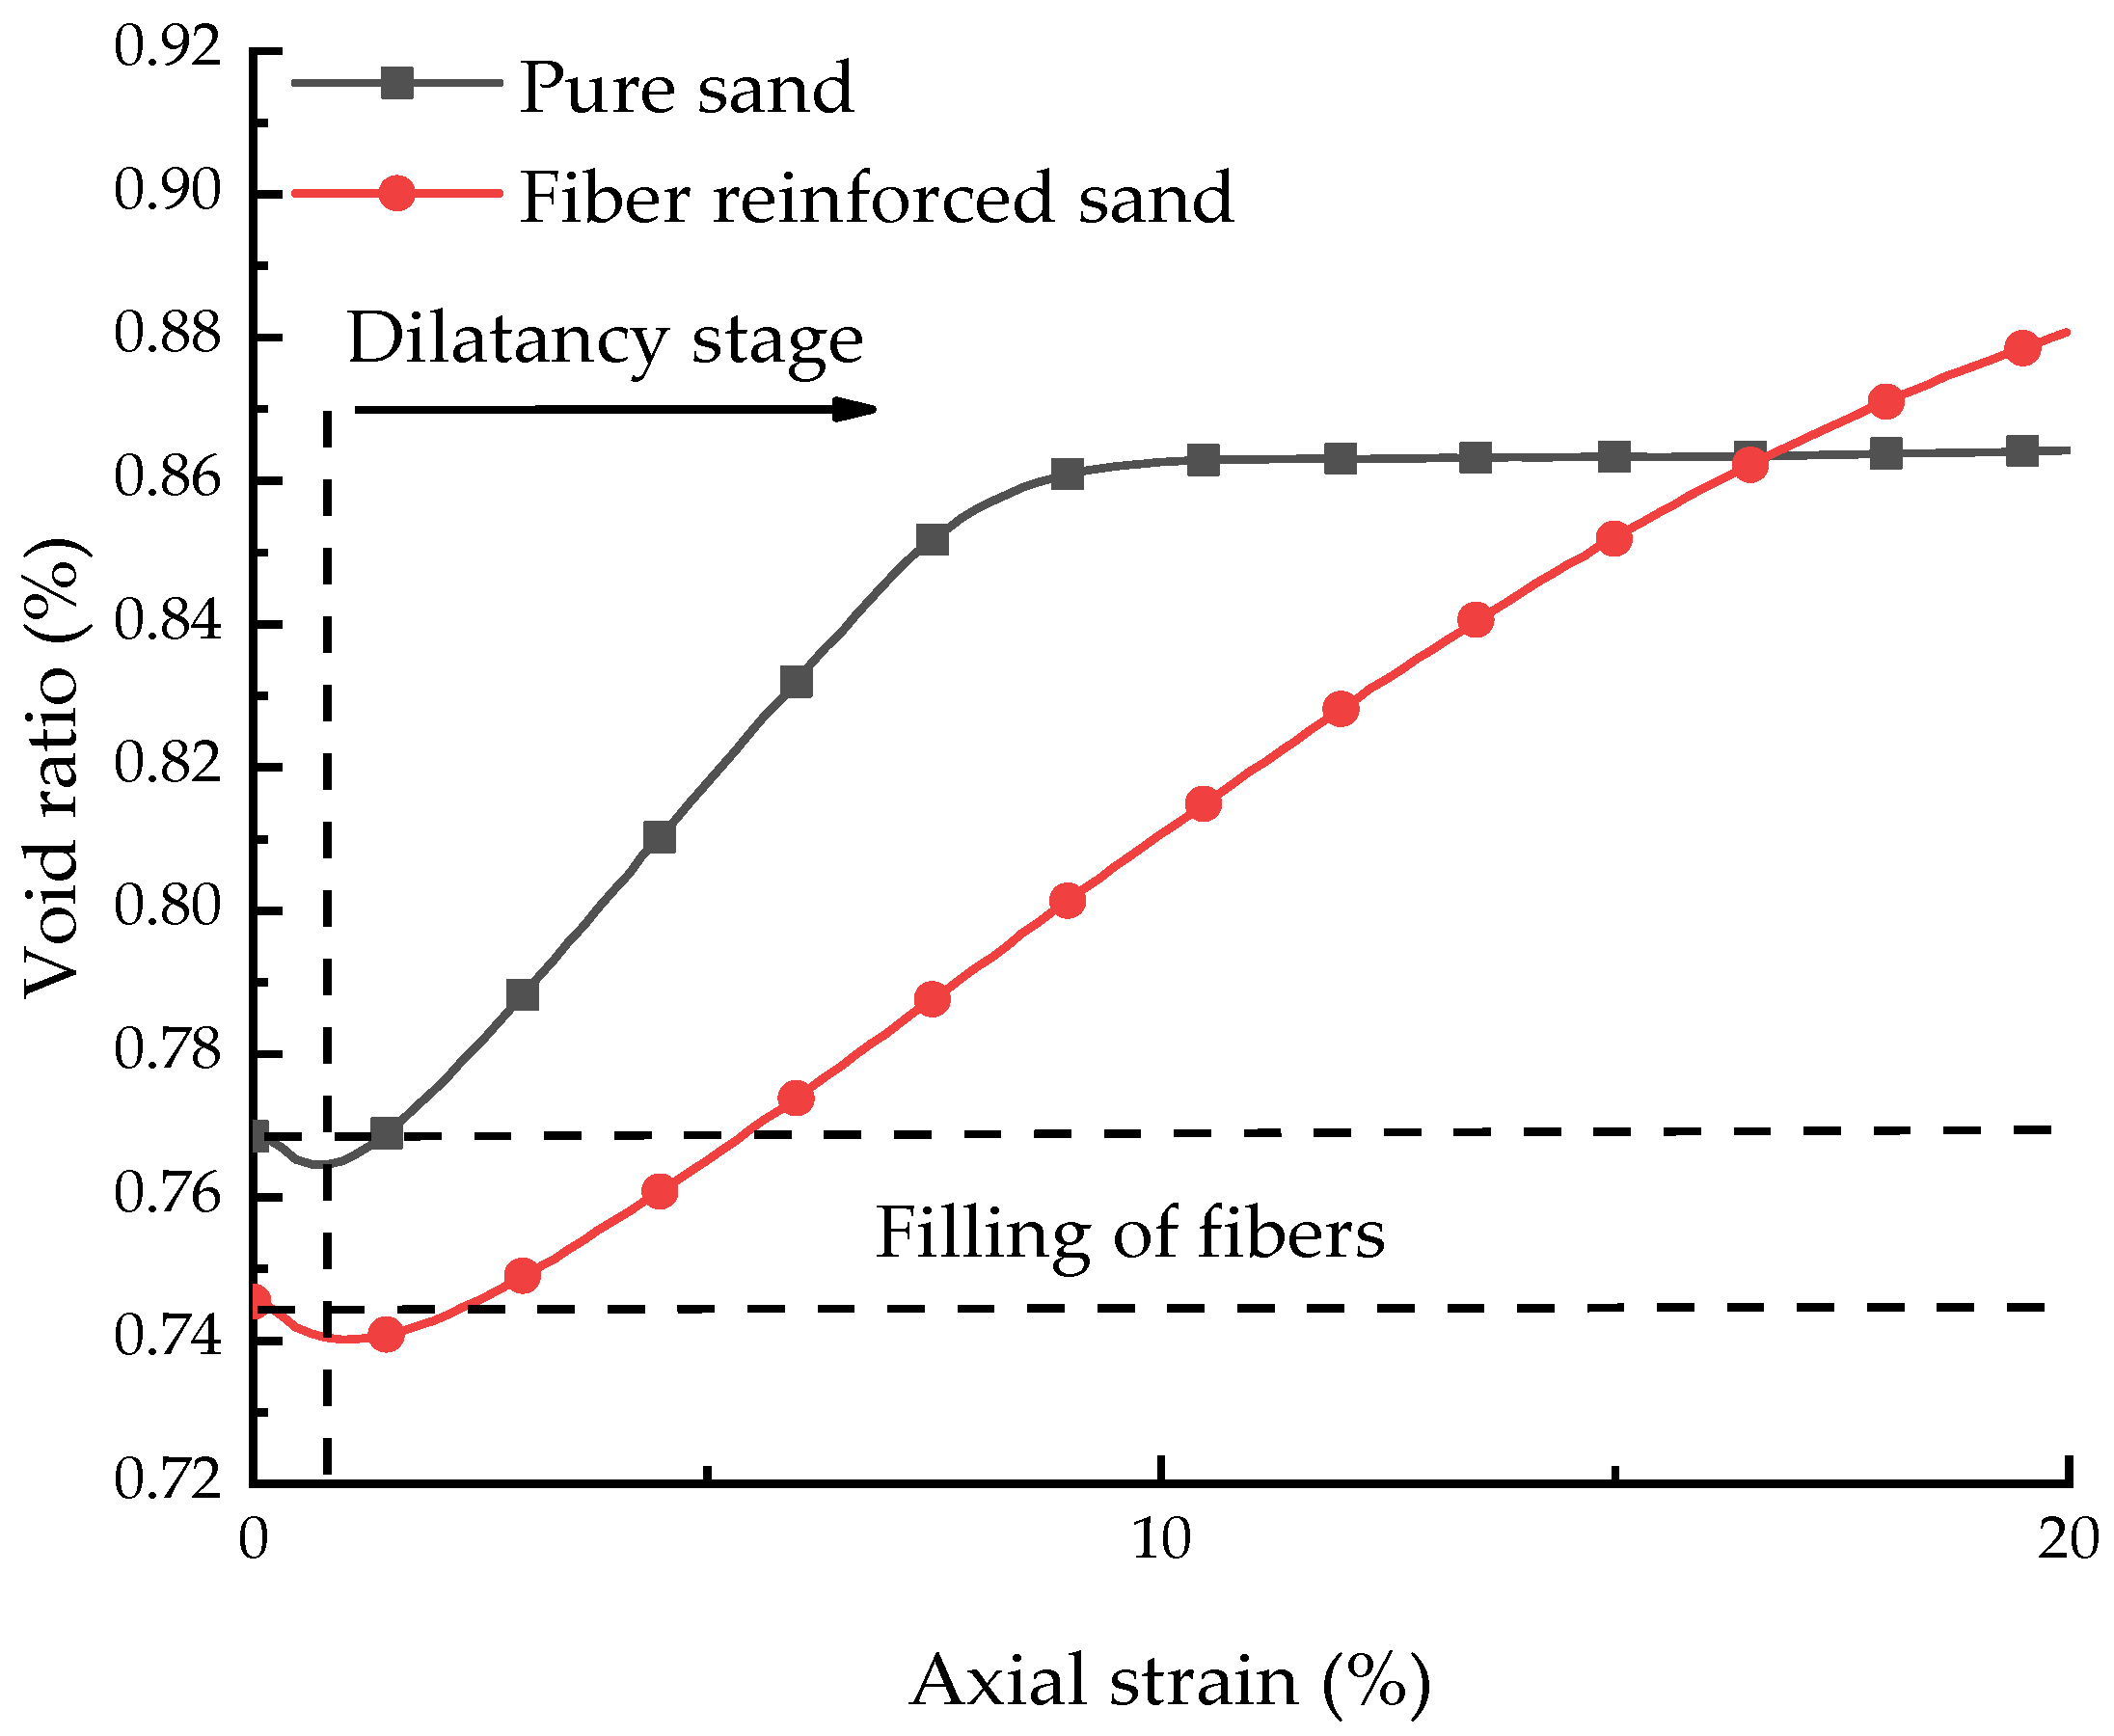
4.2. Void Ratio
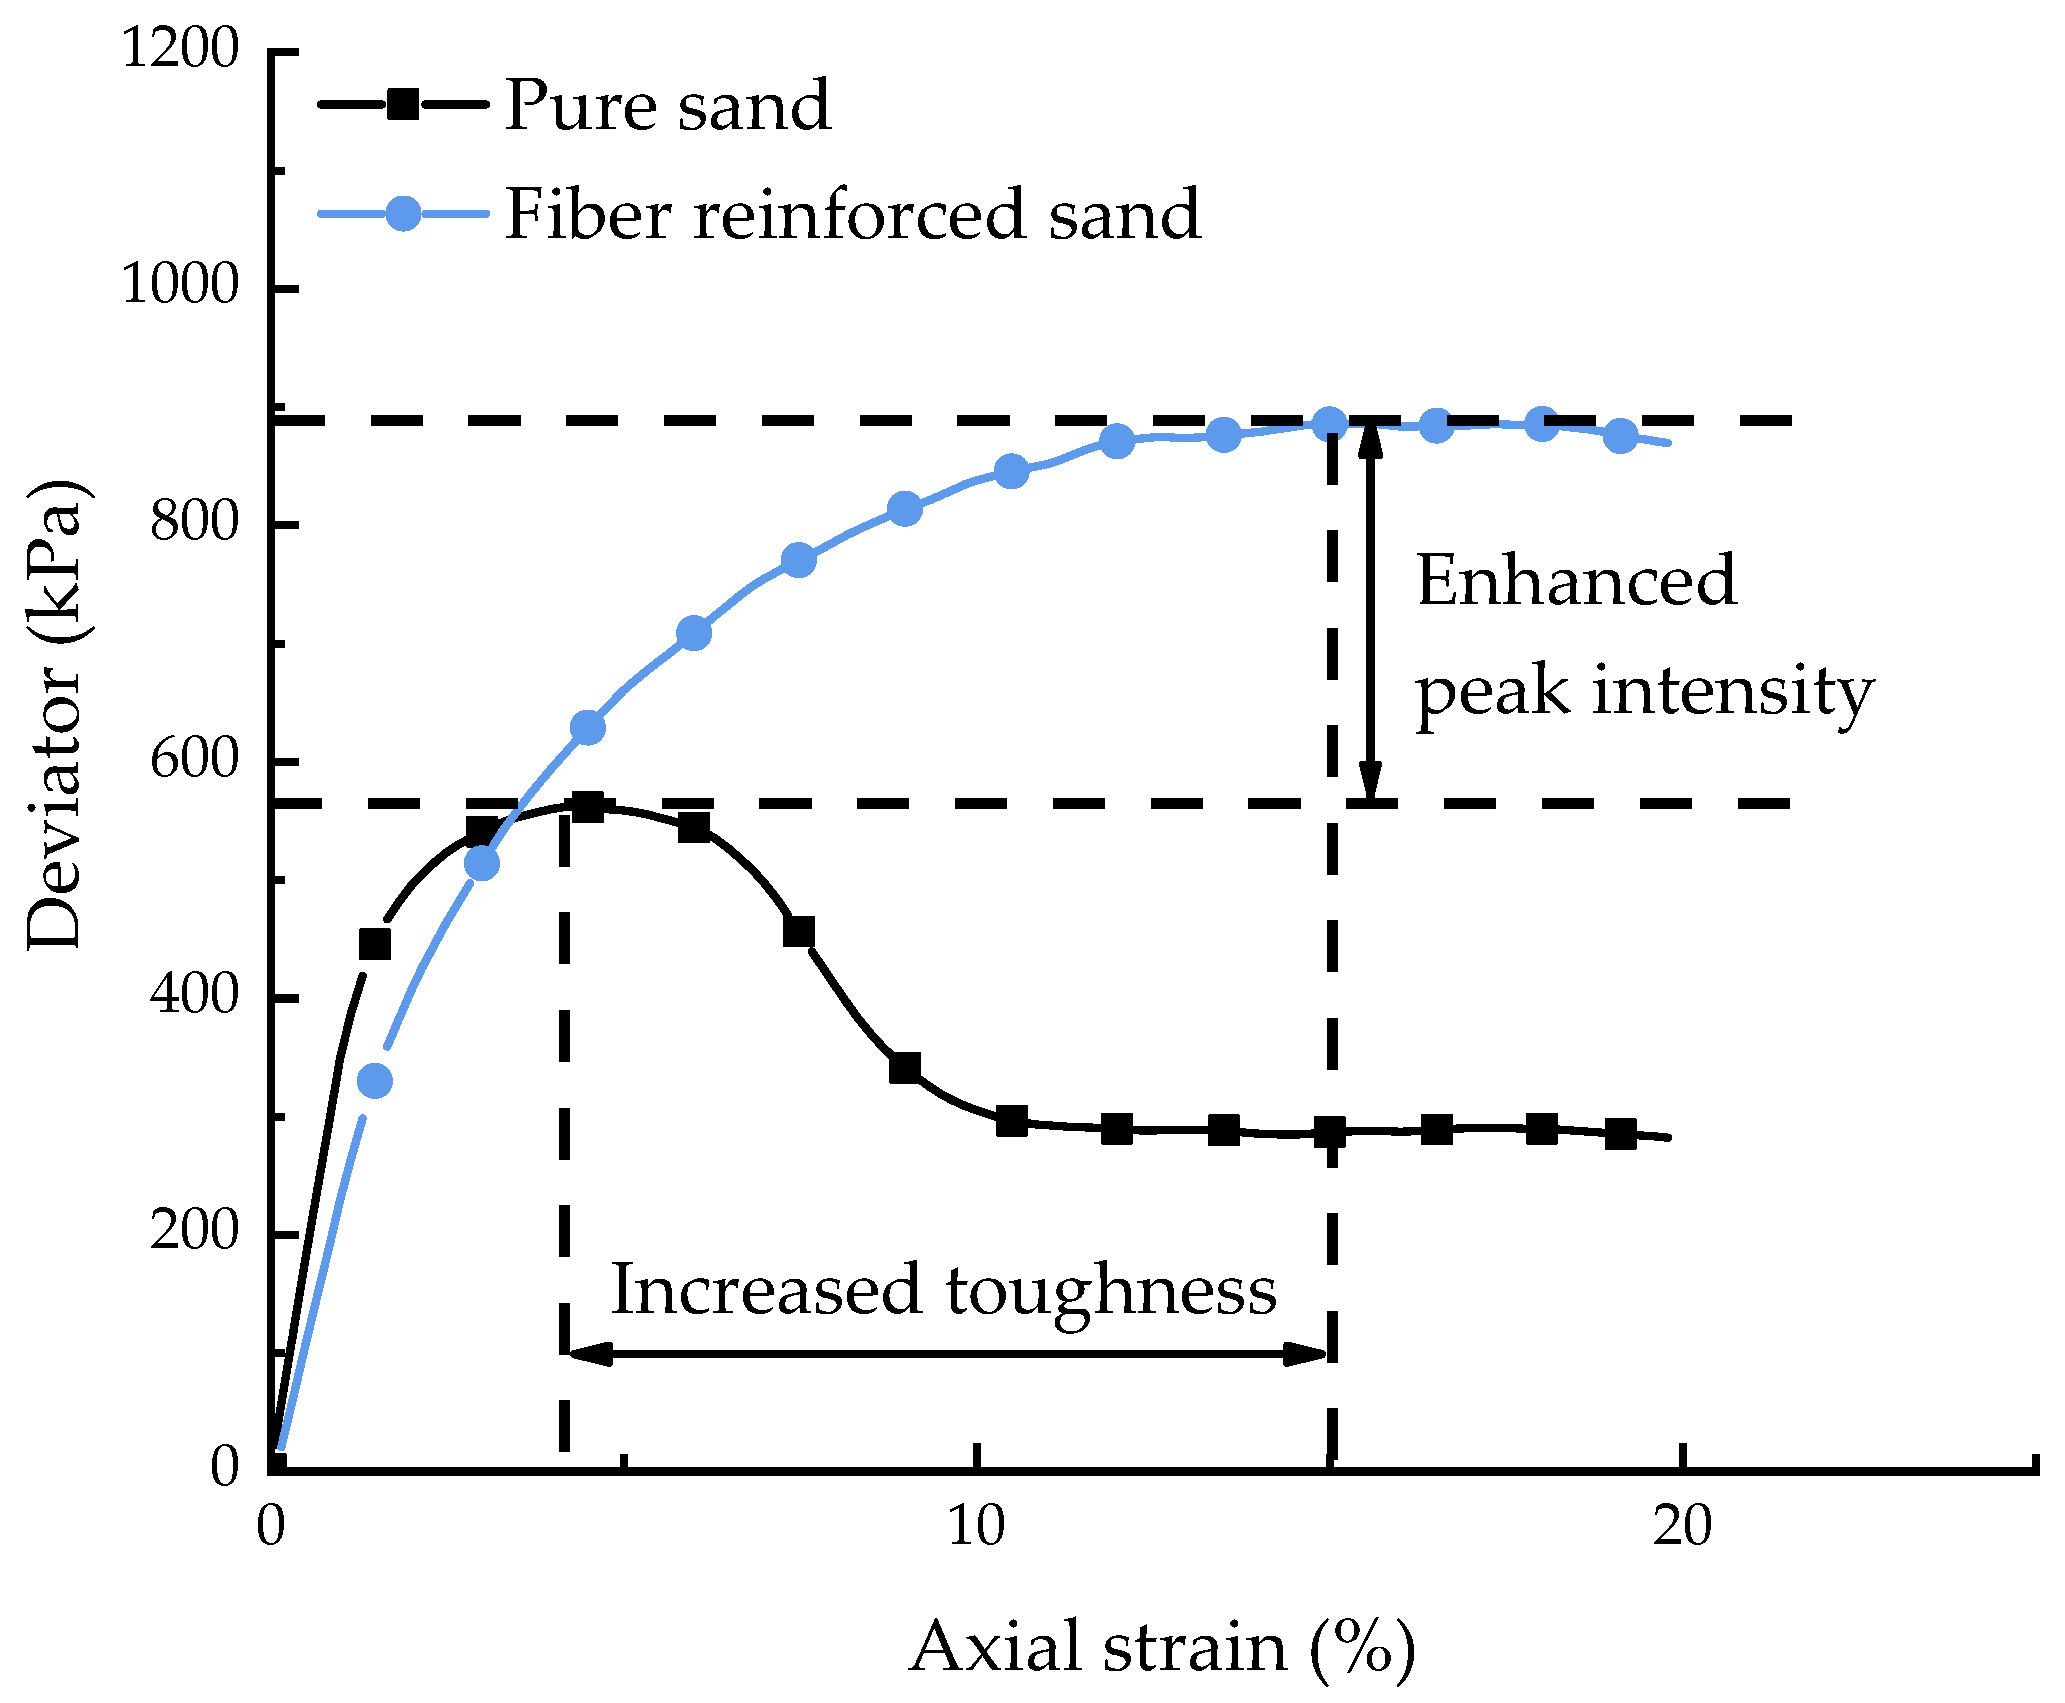
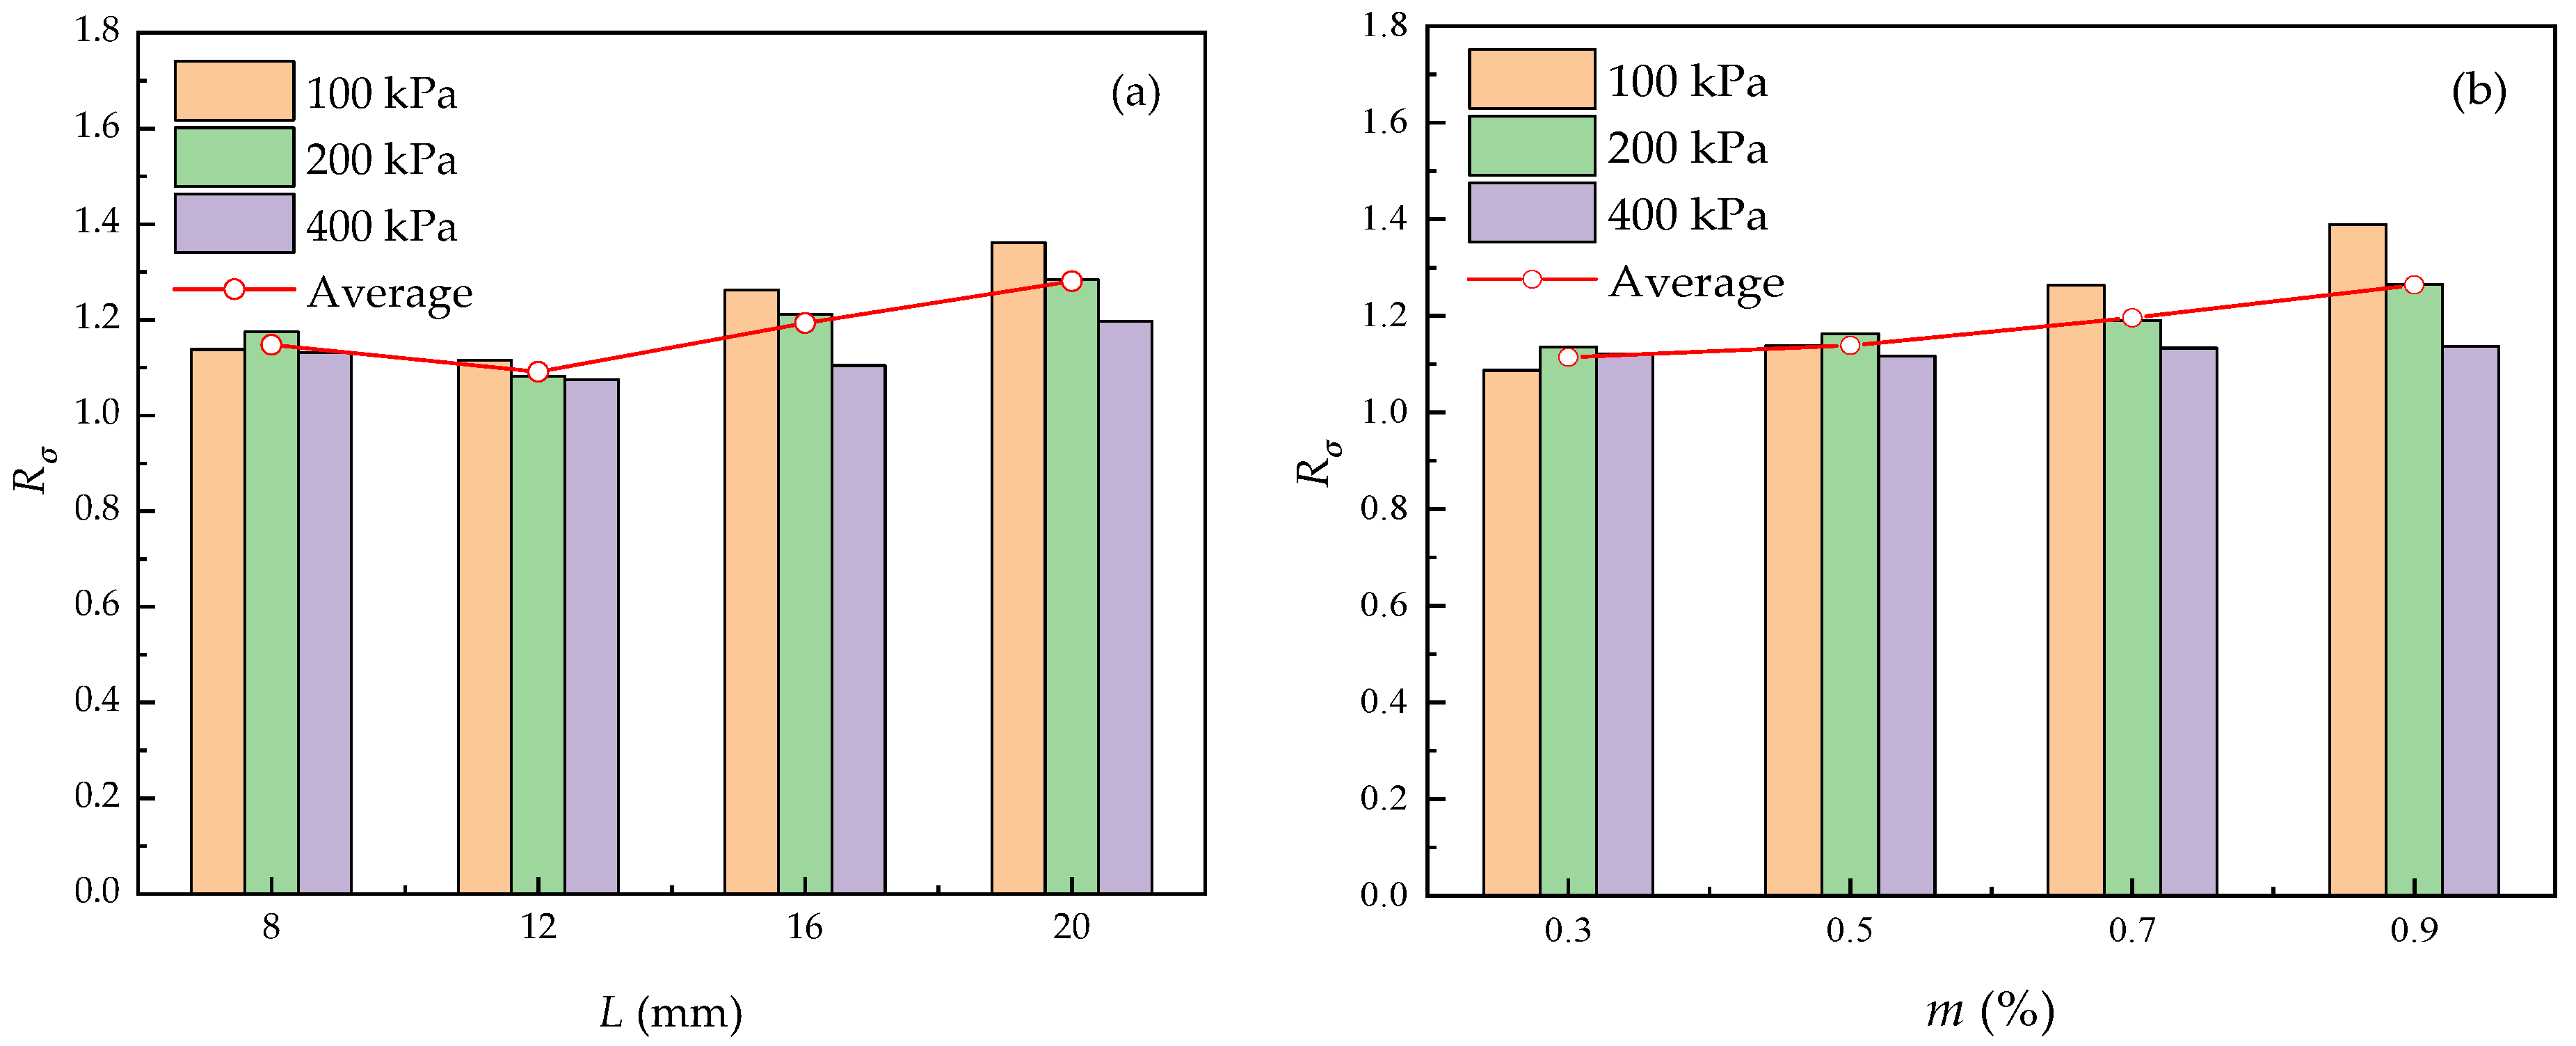
4.3. Enhanced Strength of Fiber-Reinforced Sand
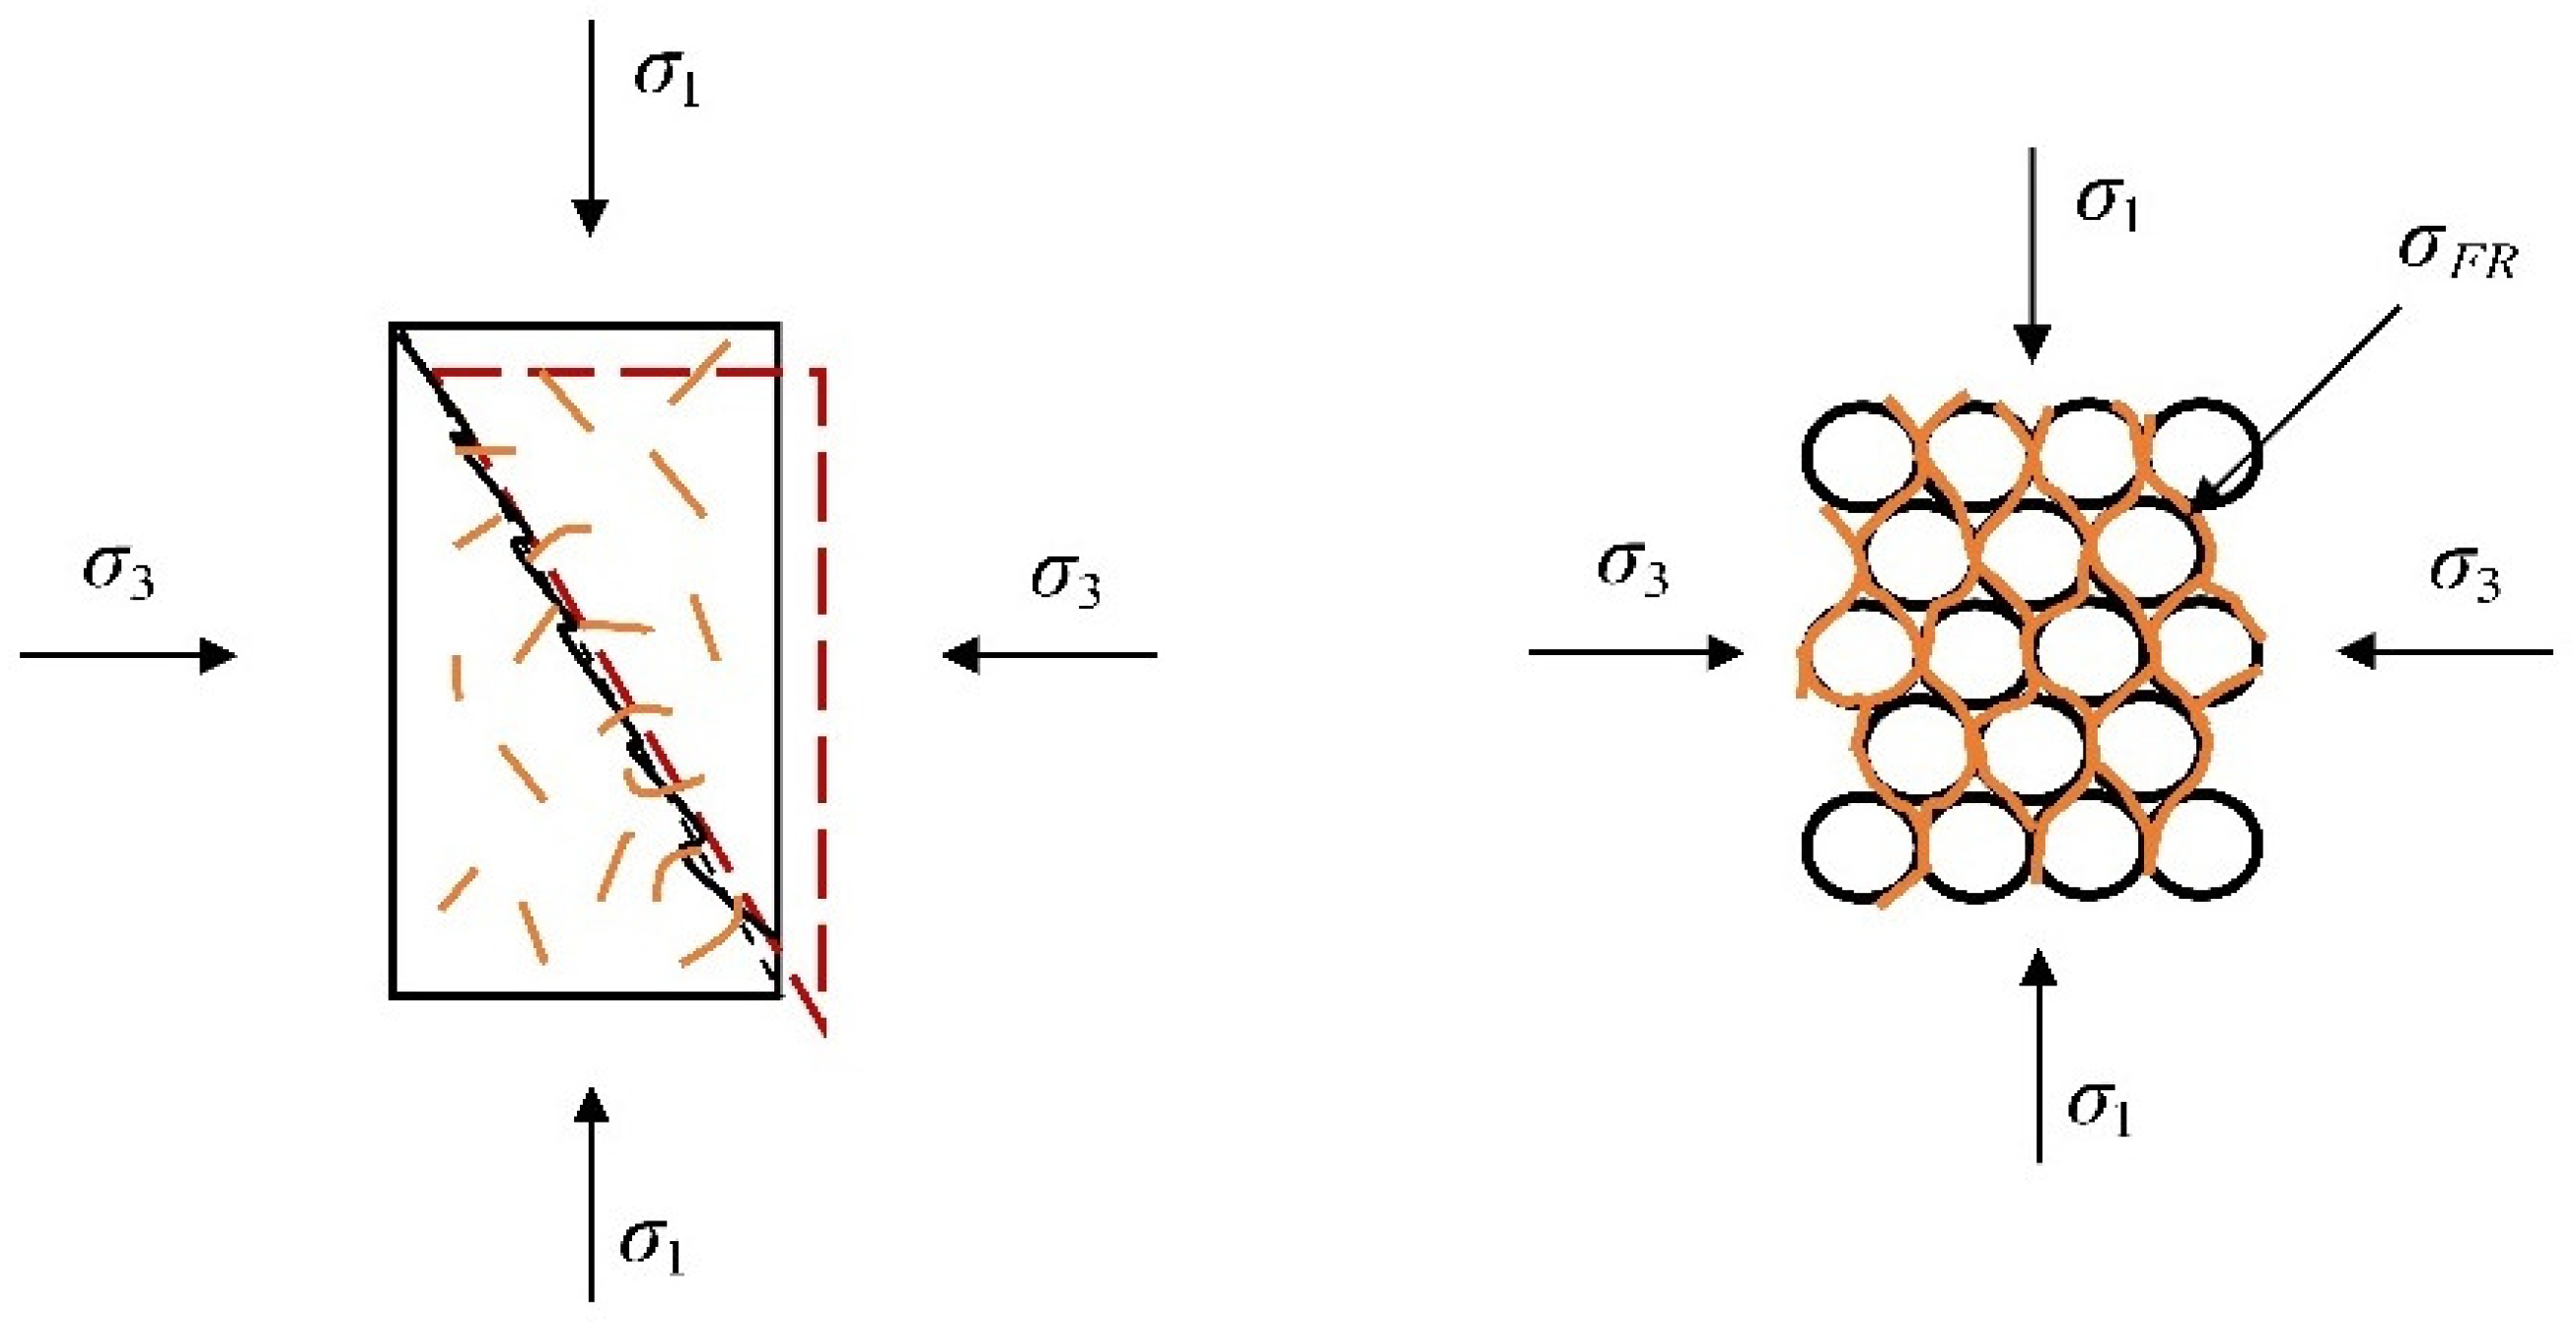
4.4. Fiber Reinforcement Mechanisms
5. Conclusions
Author Contributions
Funding
Institutional Review Board Statement
Informed Consent Statement
Data Availability Statement
Acknowledgments
Conflicts of Interest
References
- Bao, X.; Li, L.; Liao, Z.; Cui, H.; Tang, W.; Chen, X. Study of silty sand slope protection from seepage flows using short fiber-sand mixtures. Geosynth. Int. 2021, 28, 491–507. [Google Scholar] [CrossRef]
- Bao, H.; Liu, C.; Lan, H.; Yan, C.; Li, L.; Zheng, H.; Dong, Z. Time-dependency deterioration of polypropylene fiber reinforced soil and guar gum mixed soil in loess cut-slope protecting. Eng. Geol. 2022, 311, 106895. [Google Scholar] [CrossRef]
- Lai, T.; Lei, H.; Wu, Z.; Wu, H. Shaking table test study on basalt fiber reinforced plastics in high slope protection. Rock Soil Mech. 2021, 42, 390–400. [Google Scholar]
- Fujiyoshi, K.; Ueda, T.; Takagi, H.; Tsukagoshi, M. Construction Technologies and Architecture. In Mechanical Properties and Durability of Bamboo Fibers/Bamboo-Fiber-Mixed Spray Mortar for Slope Protection; Trans Tech Publications: Bäch, Switzerland, 2022; pp. 1–11. [Google Scholar]
- Yang, K.H.; Lee, S.; Tsai, M.H.; Nguyen Minh, D.; Wu, C. Behavior of nonwoven-geotextile-reinforced sand and mobilization of reinforcement strain under triaxial compression. Geosynth. Int. 2013, 20, 207–225. [Google Scholar]
- Choobbasti, A.; Soleimani Kutanaei, S.; Ghadakpour, M. Shear behavior of fiber-reinforced sand composite. Arab. J. Geosci. 2019, 12, 1–6. [Google Scholar] [CrossRef]
- Kong, Y.; Zhou, A.; Shen, F.; Yao, Y. Stress-dilatancy relationship for fiber-reinforced sand and its modeling. Acta. Geotech. 2019, 14, 1871–1881. [Google Scholar] [CrossRef]
- Yilmaz, Y. Experimental investigation of the strength properties of sand–clay mixtures reinforced with randomly distributed discrete polypropylene fibers. Geosynth. Int. 2009, 16, 354–363. [Google Scholar] [CrossRef]
- Anagnostopoulos, C.A.; Papaliangas, T.T.; Konstantinidis, D.; Patronis, C. Shear strength of sands reinforced with polypropylene fibers. Geotech. Geol. Eng. 2013, 31, 401–423. [Google Scholar] [CrossRef]
- Diambra, A.; Ibraim, E. Fibre-reinforced sand: Interaction at the fibre and grain scale. Géotechnique 2015, 65, 296–308. [Google Scholar] [CrossRef] [Green Version]
- Lovisa, J.; Shukla, S.; Sivakugan, N. Shear strength of randomly distributed moist fiber-reinforced sand. Geosynth. Int. 2010, 17, 100–106. [Google Scholar] [CrossRef]
- Nozoe, S.; Kasai, Y.; Kaneko, K.; Matsui, K.; Kumagai, K. Relationship between mechanical properties and fiber mixture ratio in fiber-reinforced sand. Geosynth. Eng. J. 2012, 27, 127–132. [Google Scholar] [CrossRef] [Green Version]
- Tatsuoka, F.; Ishihara, K. Yielding of sand in triaxial compression. Soils Found. 1974, 14, 63–76. [Google Scholar] [CrossRef] [Green Version]
- Michalowski, R.; Čermaák, J. Triaxial compression of sand reinforced with fibers. J. Geotech. Geoenviron. Eng. 2003, 129, 125–136. [Google Scholar] [CrossRef]
- Gray, D.; Alrefeai, T. Behavior of Fabric-Versus fiber-reinforced sand. J. Geotech. Eng. 1986, 112, 804–820. [Google Scholar] [CrossRef]
- Sadek, S.; Najjar, S.; Freiha, F. Shear strength of fiber-reinforced sands. J. Geotech. Geoenviron. Eng. 2010, 136, 490–499. [Google Scholar] [CrossRef]
- Javdanian, H.; Soltani, N.; Shams, R.; Ghorbani, S. Investigating the monotonic behavior of fiber-reinforced soil under triaxial compression using experimental modeling. Model. Earth Syst. Environ. 2021, 7, 943–952. [Google Scholar] [CrossRef]
- Michalowski, R.; Čermák, J. Strength anisotropy of fiber-reinforced sand. Comput. Geotech. 2002, 29, 279–299. [Google Scholar] [CrossRef]
- Neeraja, V.; Manjari, G.; Babu, G. Numerical analysis of effect of orientation of fibers on stress-strain response of fiber reinforced soil. Int. J. Geotech. Eng. 2014, 8, 328–334. [Google Scholar] [CrossRef]
- Michalowski, R.L. Limit analysis with anisotropic fibre-reinforced soil. Geotechnique 2008, 58, 489–501. [Google Scholar] [CrossRef]
- Soriano, I.; Ibraim, E.; Andò, E.; Diambra, A.; Laurencin, T.; Moro, P.; Viggiani, G. 3D fibre architecture of fibre-reinforced sand. Granul. Matter 2017, 19, 75. [Google Scholar] [CrossRef] [Green Version]
- Chen, C. Triaxial Compression and Extension Tests for Fiber-Reinforced Silty Sand; Ground Improvement and Geosynthetics: Shanghai, China, 2010; pp. 367–376. [Google Scholar]
- Mali, S. A study on shear strength of sand reinforced with glass fibres. Int. J. Sci. Eng. Res. 2013, 4, 285–288. [Google Scholar]
- Noorzad, R.; Zarinkolaei, S. Comparison of mechanical properties of fiber-reinforced sand under triaxial compression and direct shear. Open Geosci. 2015, 1, 547–558. [Google Scholar]
- Noorzad, R.; Fardad Amini, P. Liquefaction resistance of Babolsar sand reinforced with randomly distributed fibers under cyclic loading. Soil Dyn. Earthq. Eng. 2014, 66, 281–292. [Google Scholar] [CrossRef]
- Uddin, S.; Marri, A.; Wanatowski, D.; Hall, M. Stress-Dilatancy and Micromechnics of Fibre-Reinforced Sand; Geosynthetics ASIA: Bangkok, Thailand, 2012; pp. 683–690. [Google Scholar]
- Eldesouky, H.; Morsi, M.; Mansour, M. Fiber-reinforced sand strength and dilation characteristics. Ain Shams Eng. J. 2016, 7, 517–526. [Google Scholar] [CrossRef] [Green Version]
- Wanatowski, D.; Uddin, S.; Marri, A. Effects of Discrete Fibers on the Stress-Dilatancy and Micromechanics of Fiber-Reinforced Sand; Geosynthetics: Long Beach, CA, USA, 2013; pp. 546–554. [Google Scholar]
- Rajagopal, S.; Prathap Kumar, M.T. Cyclic response of single-layer coir-mat-reinforced sand. Innov. Infrastruct. Solut. 2018, 3, 13. [Google Scholar]
- Maliakal, T.; Thiyyakkandi, S. Influence of randomly distributed coir fibers on shear strength of clay. Geotech. Geol. Eng. 2013, 31, 425–433. [Google Scholar] [CrossRef]
- Prabakar, J.; Ramachandran, S.S. Effect of random inclusion of sisal fibre on strength behaviour of soil. Constr. Build. Mater. 2002, 16, 123–131. [Google Scholar] [CrossRef]
- Karimzadeh, A.; Leung, A.; Hosseinpour, S.; Wu, Z.; Fardad Amini, P. Monotonic and cyclic behaviour of root-reinforced sand. Can. Geotech. J. 2021, 99, 1915–1927. [Google Scholar] [CrossRef]
- Karimzadeh, A.; Leung, A.; Gao, Z. Shear strength anisotropy of rooted soils. Géotechnique 2022. ahead of print. [Google Scholar] [CrossRef]
- Krishna, B.V.; Rao, D.M.K. A comparative and experimental study on the mechanical properties of various steel and glass fiber reinforced high strength concrete. IRJET 2015, 2, 129–133. [Google Scholar]
- Kroviakov, S.O.; Iu, H.D.; Kryzhanovskyi, V.O.; Zavoloka, M.V.; Yelkin, A.V. Comparison of fiber concrete properties for industrial floors and road pavements with steel and polypropylene fiber. Build. Mater. Tech. 2022, 87, 76–84. [Google Scholar] [CrossRef]
- Leung, C.K.; Chi, J. Crack-bridging force in random ductile fiber brittle matrix composites. J. Eng. Mech. 1995, 121, 1315–1324. [Google Scholar] [CrossRef]
- Zhang, J.; Yu, Z.; Sun, X.; Zhang, G.; Pan, W. Experimental study and failure mechanism analysis of rubber fiber concrete under the compression-shear combined action. Adv. Mater. Sci. Eng. 2021, 2021, 5554257. [Google Scholar] [CrossRef]
- Hu, Q.; Fang, G. Study on Mechanical Properties of Plant Fiber reinforced concrete Hollow Block. IOP Conf. Ser. Earth Environ. Sci. 2020, 446, 022077. [Google Scholar] [CrossRef] [Green Version]
- Shah, I.; Li, J.; Yang, S.; Zhang, Y.; Anwar, A. Experimental investigation on the mechanical properties of natural fiber reinforced concrete. J. Renew. Mater. 2022, 10, 1307. [Google Scholar] [CrossRef]
- Gnanasundar, V.M.; Palanisamy, T.S.; Thirugnanam, G.S.; Preetha, V. Mechanical properties of fiber reinforced concrete by using sisal fiber with M-Sand as fine aggregate. Sustain. Mater. Smart Pract. 2022, 23, 76–82. [Google Scholar]
- Vijayalakshmi, R.; Vaishnavi, M.; Geetha, R. Study on the workability, mechanical properties of fish tail palm fibre reinforced concrete-emphasis on fibre content and fibre length. Eur. J. Environ. Civ. Eng. 2022, 1–19. [Google Scholar] [CrossRef]
- Ramalingam, V.; Ramesh, K.; Arumugam, M.; Muralidharan, V. Effect of natural fish tail palm fiber on the workability and mechanical properties of fiber reinforced concrete. Build. Mater. Struct. 2022, 65, 7–22. [Google Scholar] [CrossRef]
- Xu, W.; Zhang, J.; He, J. Research on large-scale triaxial tests on reinforced soft rock composed of coarse-grained soil as embankment fillings. Chin. J. Rock Mech. Eng. 2010, 29, 535–541. [Google Scholar]


| Specific Gravity of Soil Particle | Coefficient of Uniformity | Coefficient of Curvature | Maximum Unit Weight (kN/m3) | Minimum Unit Weight (kN/m3) | Maximum Void Ratio | Minimum Void Ratio |
|---|---|---|---|---|---|---|
| 2.65 | 2.36 | 1.08 | 16.10 | 12.50 | 1.12 | 0.64 |
| No. | Fiber Length (mm) | Fiber Content (%) | Confining Pressure (kPa) |
|---|---|---|---|
| 1 | 8 | 0.3 | 100, 200, 400 |
| 2 | 0.5 | 100, 200, 400 | |
| 3 | 0.7 | 100, 200, 400 | |
| 4 | 0.9 | 100, 200, 400 | |
| 5 | 12 | 0.3 | 100, 200, 400 |
| 6 | 0.5 | 100, 200, 400 | |
| 7 | 0.7 | 100, 200, 400 | |
| 8 | 0.9 | 100, 200, 400 | |
| 9 | 16 | 0.3 | 100, 200, 400 |
| 10 | 0.5 | 100, 200, 400 | |
| 11 | 0.7 | 100, 200, 400 | |
| 12 | 0.9 | 100, 200, 400 | |
| 13 | 20 | 0.3 | 100, 200, 400 |
| 14 | 0.5 | 100, 200, 400 | |
| 15 | 0.7 | 100, 200, 400 | |
| 16 | 0.9 | 100, 200, 400 | |
| 17 | — | — | 100, 200, 400 |
| Fiber Length (mm) | Fiber Content (%) | (σ1 − σ3)f (kPa) | c (kPa) | φ (°) | ||
|---|---|---|---|---|---|---|
| 100 kPa | 200 kPa | 400 kPa | ||||
| 0 | 0 | 465 | 927 | 1545 | 0 | 43.3 |
| 8 | 0.3 | 614 | 1071 | 1816 | 0 | 46.5 |
| 0.5 | 587 | 1093 | 1722 | 0 | 46.1 | |
| 0.7 | 699 | 1120 | 1772 | 0 | 47.3 | |
| 0.9 | 672 | 1072 | 1680 | 0 | 46.5 | |
| 12 | 0.3 | 551 | 905 | 1669 | 0 | 44.5 |
| 0.5 | 602 | 997 | 1668 | 0 | 45.5 | |
| 0.7 | 612 | 957 | 1595 | 0 | 45.1 | |
| 0.9 | 757 | 1156 | 1711 | 0 | 47.6 | |
| 16 | 0.3 | 640 | 1042 | 1650 | 0 | 46.0 |
| 0.5 | 658 | 1092 | 1721 | 0 | 46.6 | |
| 0.7 | 733 | 1133 | 1722 | 0 | 47.4 | |
| 0.9 | 822 | 1227 | 1735 | 0 | 48.4 | |
| 20 | 0.3 | 652 | 1191 | 1795 | 0 | 47.3 |
| 0.5 | 724 | 1130 | 1788 | 0 | 47.5 | |
| 0.7 | 811 | 1204 | 1914 | 0 | 48.8 | |
| 0.9 | 889 | 1236 | 1901 | 0 | 49.3 | |
Disclaimer/Publisher’s Note: The statements, opinions and data contained in all publications are solely those of the individual author(s) and contributor(s) and not of MDPI and/or the editor(s). MDPI and/or the editor(s) disclaim responsibility for any injury to people or property resulting from any ideas, methods, instructions or products referred to in the content. |
© 2023 by the authors. Licensee MDPI, Basel, Switzerland. This article is an open access article distributed under the terms and conditions of the Creative Commons Attribution (CC BY) license (https://creativecommons.org/licenses/by/4.0/).
Share and Cite
Tang, Y.; Wei, S.; Liu, X.; Liu, W.; Liu, T. Mechanical Analysis of Palm-Fiber-Reinforced Sand through Triaxial Tests. Sustainability 2023, 15, 5461. https://doi.org/10.3390/su15065461
Tang Y, Wei S, Liu X, Liu W, Liu T. Mechanical Analysis of Palm-Fiber-Reinforced Sand through Triaxial Tests. Sustainability. 2023; 15(6):5461. https://doi.org/10.3390/su15065461
Chicago/Turabian StyleTang, Yuxiao, Shaowei Wei, Xueyan Liu, Wen Liu, and Teng Liu. 2023. "Mechanical Analysis of Palm-Fiber-Reinforced Sand through Triaxial Tests" Sustainability 15, no. 6: 5461. https://doi.org/10.3390/su15065461