1. Introduction
Augmented reality (AR) is considered an emerging technology with promising potential in various fields, such as education, marketing, engineering, and others [
1]. In addition, its use is regarded as a new form of technology in modern human–computer interaction, with increased acceptance influencing the use of technological interaction [
2]. The leading business-consulting firms and statistical organizations express optimism about the future of AR and predict it to become an industry in its own right, independent of games and movies [
3].
In the field of marketing, AR has only recently gained attention, with companies like BMW being the first to experiment with AR advertising in December 2008 [
4]. AR is defined as an interaction with a two-dimensional screen that controls three-dimensional objects [
5] and is recognized as one of the most disruptive new technologies in marketing [
6]. It offers endless opportunities to advance marketing by improving company reputation, boosting consumer interactions, and increasing sales [
7]. It is considered an emerging innovation in marketing and sales [
8]. A study concluded that there was a significant difference in gender and generational responses to modern and attractive marketing practices. The study indicated that it also confirmed the existence of impulsive and thoughtful buying [
9] of virtual try-ons, a new form of AR application that has emerged, and these apps use motion captioning techniques to display virtual components [
10]. AR provides contextually relevant advertising experiences to customers by overlaying digital content onto their physical environment [
11]. For example, customers can visualize how their living room will look with new decor or “try on” clothes before visiting a store [
12]. Customizing products or services is becoming a crucial differentiation strategy, with a 26% increase in profitability and a 12% increase in market capitalization [
13].
Previous research on advertising has shown that generating excitement by advertising a product is a highly effective way to encourage people to buy it [
14]. A study by [
9] found that way men and women of different ages and genders respond to modern and appealing marketing practices differs greatly, indicating that people buy things both quickly and carefully.
In Saudi Arabia, online shopping is experiencing rapid growth, creating significant opportunities. The number of e-commerce users in Saudi Arabia rose from 18.22 million in 2017 to 33.6 million in 2024 [
15]. Additionally, as per Saudi Vision 2030, the number of businesses offering online shopping experiences to consumers is also growing [
16]. Therefore, businesses in Saudi Arabia are exploring novel and exciting marketing and advertising experiences to keep up with this growing trend.
2. Statement of the Problem
Augmented reality (AR) technology creates digital opportunities by utilizing mobile or wearable technologies, such as smartphones or smart glasses, to integrate interactive and shareable digital content into the user’s view of the current environment [
17]. This digital content can include photos, information, or instructions and highlights the numerous benefits of AR technology [
18]. From a user’s standpoint, AR can be entertaining, while from a marketer’s viewpoint, its novelty can enhance brand awareness and provide access to previously unavailable data.
Modern technologies such as AR attract and persuade consumers [
17]. AR marketing (ARM) refers to the use of AR in marketing to enhance customer experiences. Digital facilitators, such as digital cues in physical environments, support customer behavior. Mobile AR is a promising marketing tool for advertising and e-marketing professionals to reach consumers and increase sales rates [
19]. The virtual product experience is a current persuasion method that has replaced the real product experience, leading to the buyer making a purchase without previous evaluation. AR, as a technical intermediary, minimizes the risk associated with the transaction.
As an emerging technology, there is a dearth of research examining the extent of the relationship between consumers and AR as a technological mediator and how this relationship can affect their behavior. This study aims to clarify this relationship using Ihde’s theory of intermediate technology and analyzes how the relationship between humans and technology, as well as the ease and acceptance of it based on the Technology Acceptance Model (TAM), influence the consumer’s relationship with AR. Additionally, this study aims to examine the characteristics of Saudi consumers with positive attitudes toward AR technology during online purchasing.
The main question of the study is: what is the role of AR technology in persuading or influencing Saudi consumers to make purchases? This study’s findings will demonstrate the impact of AR on consumer purchasing behavior and highlight its activation in the strategic marketing plans of brands to attract new customers and maintain existing customers’ purchasing behaviors.
4. Literature Review and Hypothesis
This study was based on the Technology Acceptance Model (TAM) and the theory of intermediate technology (Ihde’s theory). According to Ihde’s post-phenomenological studies [
20], cited by [
21], technology plays a vital role in mediating human interactions [
22]. Ihde defined four distinct relationships between humans and technology: embodiment, hermeneutical, alterity, and background relationships [
12,
13,
14,
15,
16,
17,
18,
19,
20,
21,
22,
23].
In the embodiment relationship, users incorporate technology into their lives, creating a connection between the person and their environment through the technological artifact [
24]. Alterity relationship occurs when people interact with technology in a way similar to their interactions with other people [
25]. Background relationships switch the focus from the technology in the foreground to the technology present in the background [
26]. The hermeneutical relationship provides a representation of reality that requires interpretation instead of direct access to reality [
24].
The dependent variable is the Technology Acceptance Model (TAM). The model was designed to evaluate the impact of design decisions on user acceptance and to show information flow systems, providing insight into an individual’s adoption of an information system. TAM considers three key structures in determining an individual’s use of an information system: perceived benefit, ease of use, and attitude toward use. The model is based on the idea that a person’s attitude toward using the system is a significant factor in their use of it [
27].
The Technology Acceptance Model says that a person’s willingness to use technology is based on how they feel about it, both positively and negatively. Positive emotions such as enjoyment and creativity play an important role in technology acceptance [
28]. For instance, playfulness (fun) is described as the ability of an individual to interact with a computer spontaneously, creatively, and imaginatively [
29]. Other factors, such as enjoyment and education, also impact an individual’s use of the internet. Similarly, when new technologies such as apps and websites are released, fun and creativity will be important indicators of how well they are received [
30].
The theory acknowledges the existence of negative feelings, such as anxiety, associated with technology use. Anxiety refers to having bad feelings such as anger and frustration while using technology [
31].
The concept of “perceived ease of use” refers to an individual’s perception of the effortlessness of using a particular application. This concept is often expressed as “help and facility” [
32]. It is also noted that ease of use encompasses the user’s awareness of the technology’s ability to assist and benefit them [
33]. Additionally, ease of use includes satisfaction and comfort with the technology [
34].
The concept of “perceived benefit” refers to a person’s belief in the positive impact of a system on their performance. This idea is central to the Technology Acceptance Model and its dimensions, which help predict consumers’ reactions to new technologies, such as augmented reality (AR), based on Ihde’s factors.
Although AR is a relatively new technology in advertising and marketing, the studies exploring this area are limited in number [
35]. Nevertheless, the few studies that have been conducted in this area have enriched the current research. Some of these studies have addressed AR directly, while others have considered it indirectly. In this paper, we will discuss these studies in detail.
4.1. Online Purchases (with AR) and Purchasing Decisions
In terms of the dimensions of augmented reality, the researcher sought to review studies that dealt with online buying through augmented reality or a technological medium based on theories of technology acceptance. As for factors, the researcher reviewed studies that dealt with online purchasing through AR. The studies were about how people accept new technologies. The researcher used this theory to determine the size of augmented reality.
The study based on the Unified Technology Acceptance Theory (UTAUT) [
36] identified reasons that aid in the use of augmented reality applications in mobile devices. This study was conducted on a number of Greek students and found that expected performance, innovation, enjoyment, and facilitation affected the adoption of purchasing intent among the sample.
The study of Chee et al. (2018) [
37] sought to analyze consumer intent to shop through mobile devices. This study was conducted in Malaysia and was based on the Technology Acceptance Model (TAM). It found that perceived benefit, ease of use, and innovation have a positive correlation with shopping over the phone.
The study of Miell (2018) [
30] aimed to measure consumers’ responses to online measurement simulation methods such as 3D technology and virtual fitting rooms and to evaluate the uses of these technologies based on the TAM Model. The study used both quantitative and qualitative methodologies. A questionnaire was distributed to 408 women aged 18–24 who were users of a retail website which provides a virtual experience for its products. In addition, in-depth interviews were conducted with 20 women aged 18–34 who bought clothes through the recommendations of the site dressing. It concluded that consumers’ preferences for hypothetical measurement experiences vary according to the stimuli used by Dressipi, with consumers describing their experience as complex. The study found that there is a strong relationship between the perceived benefit and the positive attitude toward the modern technology used.
The study of Do et al. (2020) [
38] investigated the impact of mobile AR on purchasing decision-making in tourism. The study included 479 participants who used related mobile applications. The study relied on the Technology Acceptance Model (TAM), Stimulus–Organism–Response (SOR) framework, and flow theory. The study concluded that applications based on AR played a significant role in unplanned purchases by the consumer as a result of engagement, ease of use, and fun, which contributed to consumer satisfaction.
The study of Saleem et al. (2021) [
39] aimed to find out the impact of AR on consumer behavior using the Technology Acceptance Model (TAM). A descriptive study was conducted on 363 university students in Pakistan. The study discovered the impact of augmented reality on consumer behavior and of a majority of the variables in the Technology Acceptance Model. The study by [
40] Chimborazo et al. (2021) tested a model based on TAM and UTAUT2 to explain the intention to use mobile commerce in Ecuador. The results indicated that social influence, facilitation of conditions, and having fun were important. Motivation plays an important role in the intention to use e-commerce in developing countries. Ref. [
41] Nachar’s (2019) study aimed to determine the relationship between the perceived ease of using technology for e-commerce platforms, their perceived usefulness, and consumers’ intention to shop online. The study used the Technology Acceptance Model (TAM) and was conducted on 95 Saudi consumers who use electronic purchasing platforms. The study found that the technology’s perceived ease of use and usefulness on electronic trading platforms positively impacted consumers’ purchase intentions. From the above, the following hypothesis can be put forward:
Hypothesis 1 (H1): There is a significant positive effect of AR dimensions on the purchase experience.
According to various studies, the use of augmented reality (AR) has a significant impact on the purchase experience of consumers. One study by [
35] Heller (2019) utilized an experimental approach and found that AR in online stores helped consumers choose products and provided more detailed information compared to traditional examination. Ref. [
19] Zaveri and Amin (2019) analyzed two studies on IKEA and L’Oréal applications and concluded that AR positively impacted consumers and contributed to positive perceptions of the brands.
This positive brand experience led to increased immersion and exploratory behavior, as well as increased time spent with the brand, as noted by [
18] Feng and Mueller (2019), who studied the content of 117 AR advertising campaigns and discovered a distinction between AR design in individual and collectivist cultures. Individual community cultures tend to use augmented reality advertising campaigns that include product information and allow the user to control the content of the augmented reality. In communities with a shared culture, on the other hand, AR ad campaigns tend to let the user become part of the AR content without letting them change it.
On the other hand, ref. [
42] Baytar et al. (2020) found, in their experimental study on female students, that AR accurately conveys the color and size of clothing, leading to positive attitudes and intentions to purchase.
A global joint study by Snap Inc. and Deloitte Digital [
43], Mrvosevic (2021) revealed that 100 million consumers shop using AR and that brands benefit from increased mind share, positive evaluation, confidence in products, increased brand association, loyalty, and increased participation of friends and family. This is supported by comparative empirical research by [
44] Sun et al. (2019), who found that AR can improve consumers’ attitudes toward products. They increase their association with the brand, their loyalty to it, and the participation of friends and family. The visual representation feature provided by augmented reality has doubled consumers’ recall of products.
Finally, ref. [
45] Eskengren and Hultin (2022) conducted a qualitative exploratory study and found that AR marketing increases with high involvement products where design is an important aspect due to its ability to visualize the product in a realistic environment.
Drawing on the studies mentioned previously, we can propose the following second and third hypotheses:
Hypothesis 2 (H2): There is a significant positive effect of AR factors on the purchase experience.
Hypothesis 3 (H3): There is a significant positive relationship between the AR factor and AR dimensions.
4.2. Consumers’ Attitudes in the Arab World toward Online Purchases
Due to the scarcity of studies on Saudi consumers’ attitudes toward online purchasing, the current study relies on research related to the field in the Arab world, which is characterized by common denominators, especially among Arab Gulf countries. Ref. [
46] (Jeddah Chamber, 2019) presented a study to identify how the business sector can increase its contribution to economic growth through e-commerce. The sample size was 311 people, and the results indicated that those between 30 and 39 years old were the most frequent online shoppers, with 38.6% buying online. University degree holders had the highest percentage, reaching 60.7%. More than 50% of participants buy online monthly, 1–3 times or more. The online purchasing experience was rated as “excellent” for 52.2% of the sample and as “good” for 40% [
47].
Ref. [
47] Fakih, T.M.; Mosa, M. (2013) investigated the relationship between families that shop online, its impact on consumer attitudes in the information age, and the impact of demographic variables on online shopping practices. The researcher used a descriptive analytic approach, and a sample of 400 families was analyzed. The study concluded that there are positive consumer trends toward e-shopping, and the results indicated that certain characteristics and demographic variables affect tendencies toward e-shopping.
Ref. [
48] Baabdullah, A.; Habib, H. (2018) explored Saudi women’s attitudes toward online shopping through social media and the impact of multiple factors (cost, trust, fun, safety, and degree of complexity). The study was conducted on a sample of 400 female students at King Abdulaziz University and found that 88% had positive attitudes toward online shopping. The most common online shopping strategy for Saudi women is finding pictures and videos illustrating the use of products. Likewise, ref. [
49] Kamal, K., Ozge E. (2019) set out to understand and assess the impact of social media on brand awareness. The study focused on the Gulf region, including Bahrain, Kuwait, Oman, Qatar, Saudi Arabia, and the UAE. It focused on understanding and intent to buy, specifically via Facebook and Instagram pages for two well-known companies in the retail coffee and snack store industries. One of the most important findings was that engaging with a Facebook or Instagram page has positive impacts on brand awareness, word-of-mouth, and purchase intent. Therefore, we propose the following hypothesis.
Hypothesis 4 (H4): Among average participants, there are statistically significant differences in the positive impacts of AR on making purchase decisions for Saudi consumers.
It is noticeable that in the earlier studies, AR did not discuss the theory of intermediate technology (Ihde’s theory), while the current study relies on this theory as it interprets AR as an intermediate technology between the machine and the man, and most studies concern only the Technology Acceptance Model (TAM), whether with AR directly or with virtual purchase experiences. However, it did not combine the two theories, which is one of the objectives of this study. As noted, there is no study at the level of the Arab world, or KSA, in the field of AR in general, and there is only one study that depends on the Technology Acceptance Model (TAM) during electronic shopping. In general, these studies contributed to the interpretation of the results of the current study.
5. Methodology
5.1. Study Methodology
The current study adopted a descriptive and analytical approach with a quantitative research philosophy to examine the augmented reality (AR) factors and dimensions that impact online purchasing behavior in Saudi Arabia. From an epistemological and an ontological point of view, the quantitative research approach sees human behavior as an object that can be controlled [
50]. Data were collected through a survey questionnaire that was based on previous studies and a theoretical framework that was derived from Ihde’s theory and the Technology Acceptance Model. The sample consisted of AR users who participated in the online purchase process. The study used a snowball sampling method to gather data, which takes advantage of existing connections and can focus on specific actions or activities in particular contexts [
51]. This method is cost-effective, efficient, and can be completed quickly.
5.2. Research Tool
This study utilized a questionnaire to gather data on the augmented reality (AR) factors and dimensions affecting online purchasing behaviors in Saudi Arabia. The questionnaire was constructed based on previous studies and a theoretical framework derived from Ihde’s theory of intermediate technology and the Technology Acceptance Model (TAM) [
18]. The products in the questionnaire were categorized into 18 categories using the coding scheme proposed by Muller, Okazaki, and Diehl [
18]. To ensure engagement, the questionnaire utilized both positive and negative language. The validity of the questionnaire was assessed through internal validity calculations, a review by a panel of experts, and statistical reliability. The overall reliability coefficient was calculated to be 0.961.
5.3. Study Population and Sample
This study aimed to explore the experiences of online customers in Saudi Arabia with a previous history of purchasing products using augmented reality (AR). The sample group consisted of 812 AR users who participated in online purchases. A sample size was deemed valid based on a KMO value of 0.878 [
51]. Attitudes, opinions, beliefs, tendencies, and changes in behavior and values were measured using the Likert scale [
52].
5.4. Static Methods
In this study, descriptive statistics, Pearson’s correlation coefficients, Cronbach’s alpha, KMO statistic, Kolmogorov–Smirnova, multiple regression, the Durban Watson test, an independent sample t-test, and a one-way ANOVA were employed to analyze the data. The analysis was conducted using the Statistical Package for Social Sciences (SPSS) version 25. To assess the significance of differences in the mean responses of the sample based on various factors, an independent sample t-test was used to examine the differences based on gender and social status, while a one-way ANOVA was utilized to examine differences based on age, education level, monthly income, and family members.
5.5. Research Strategy
A research strategy is a plan outlining the methods, techniques, and approaches used in a study. The choice of research strategy depends on various factors, such as the type of research question, available resources, and time constraints. A quantitative research design served as a guide for this study’s research strategy.
5.6. Validity Research Design and Reliability Tests
This study was conducted to examine Saudi online customers’ attitudes, opinions, and behaviors toward augmented reality (AR) during the online purchasing process. The validity of the questionnaire was tested by calculating Pearson’s correlation coefficient and finding a statistically significant relationship between each AR factor and the total degree of the domain. The tool was also evaluated by a group of arbitrators, who found it suitable and clear. Reliability was determined to be high, with an overall reliability coefficient of 0.961. This study’s population consisted of Saudi online customers who had purchased through AR, and a snowball sampling method was used to select a sample size of 812 respondents. The validity of the sample size was confirmed by a KMO value of 0.878. This study was conducted in the first quarter of 2022 within the spatial boundaries of Saudi Arabia and used the Likert scale to measure attitudes, opinions, and behaviors. The statistical methods used in this study were not specified.
5.7. Boundaries in the Study
This study has four main limitations: temporal, spatial, topical, and human limitations. In terms of time limitations, this study was conducted in the first quarter of 2022. In terms of spatial limitations, this study was conducted on residents of the Kingdom of Saudi Arabia of both genders. In terms of objective limitations, this study focused on the use of augmented reality in the context of its intermediate relationship with the consumer and technology, considering the Technology Acceptance Model. As for human limitations, this study included residents of the Kingdom of Saudi Arabia who have experience purchasing through augmented reality technology.
5.8. Research Framework
Given the previous information on AR in marketing and predictive buying behaviors, it can be deduced that AR will positively impact Saudi consumers making purchasing decisions. So, the goal of this study is to find out what aspects and factors of AR help Saudi consumers decide what to buy. Accordingly, a 50-item questionnaire was developed. The independent variable is based on the following relationship model proposed by Ihde, and the dependent variable is based on the Technology Acceptance Model and has been relied upon in most of the previous studies [
12,
15,
18,
19,
35,
41,
42,
46,
47,
48,
49] that address multiple variables, such as technical factors related to AR and variables related to dimensions of consumer technology use while shopping. In addition to Saudi consumer characteristic variables, variables that help generalize research results were selected.
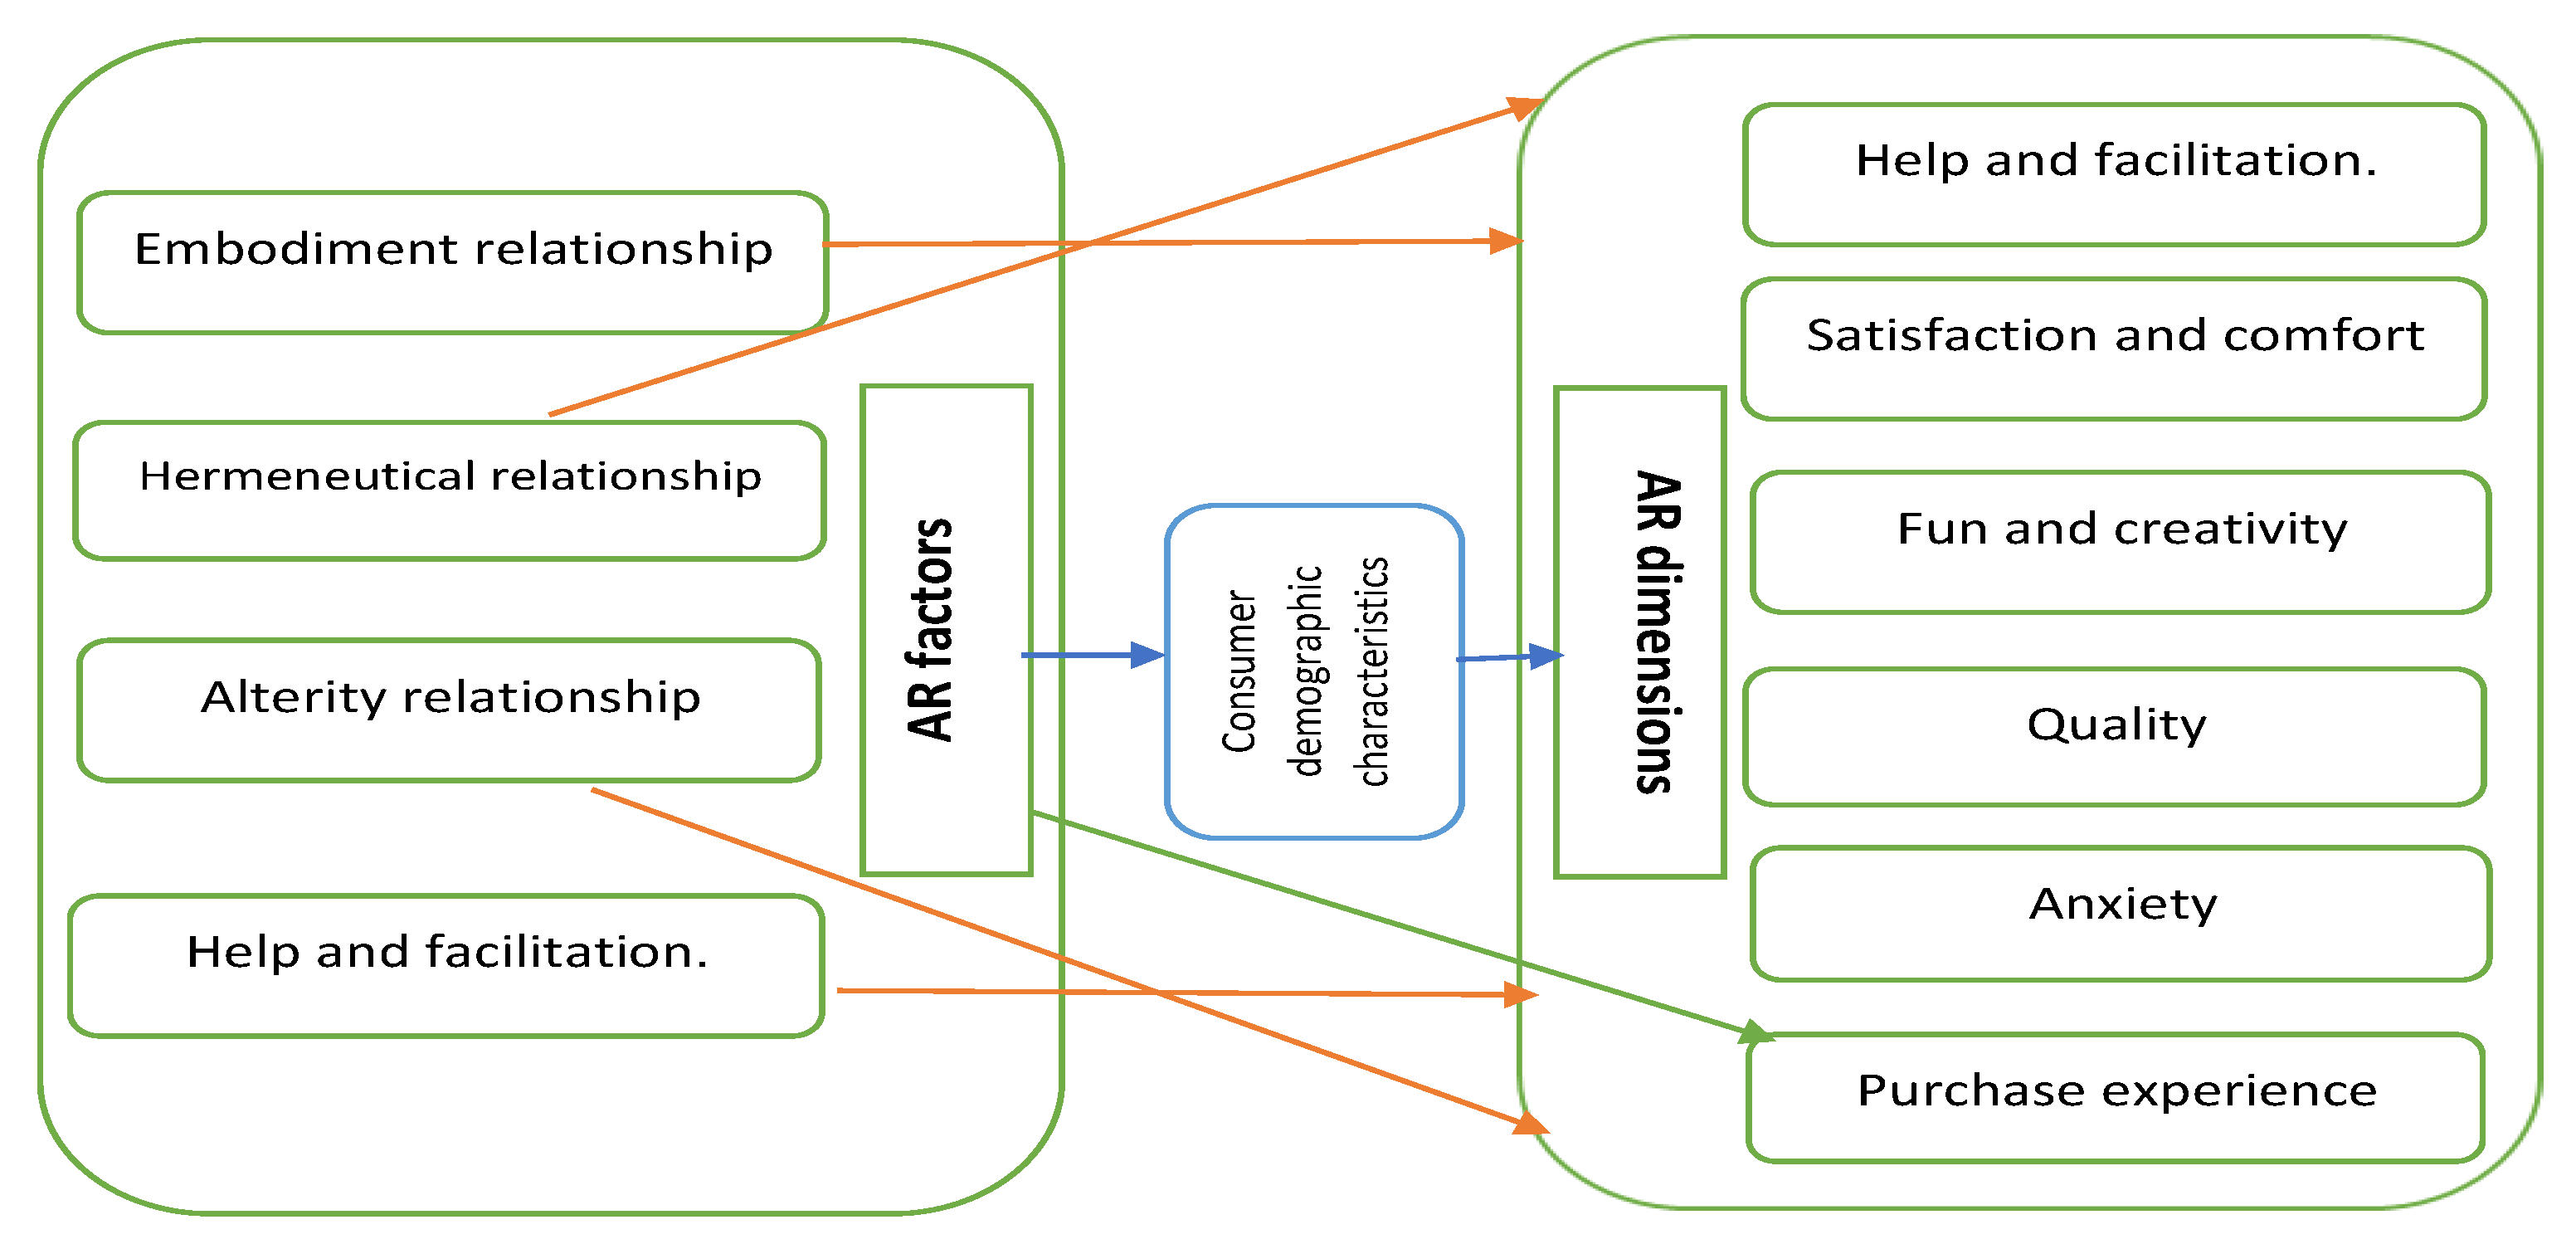
The relation between AR factors and its dimensions can be seen in
Figure 1 below.
5.9. Research Hypotheses
Based on the hypotheses and questions discussed in the previous literature, the current study’s hypotheses are as follows:
Hypothesis 1 (H1): There is a significant positive effect of AR dimensions on the purchase experience.
Hypothesis 2 (H2): There is a significant positive effect of AR factors on the purchase experience.
Hypothesis 3 (H3): There is a significant positive relationship between the AR factor and AR dimensions.
Hypothesis 4 (H4): Among average participants, there are statistically significant differences in the positive impacts of AR on making purchasing decisions for Saudi consumers.
5.10. Research Design
The data was collected through a field survey using an electronic questionnaire distributed to Saudi consumers who made online purchases through augmented reality technology. The researcher emphasized the requirement for respondents involved in the study objectives to fill out the questionnaire and requested them to pass it on to relatives and friends who had experienced the same technology only in the purchasing process. The nature of augmented reality was also explained smoothly in the introduction of the questionnaire, through the use of the Pokémon game and Snapchat filters. Positive and negative questions were included in the questionnaire to ensure the seriousness of the respondents in responding to the questionnaire indicators. All responses were required to be included to prevent any loss of response from the respondents. A total of 812 responses were collected.
5.11. Data Analysis
Table 1 shows that there are statistically significant differences between how participants responded to AR factors and AR dimensions, with a significance level of 0.05 or less. Gender and social status differences exist, favoring women and married people.
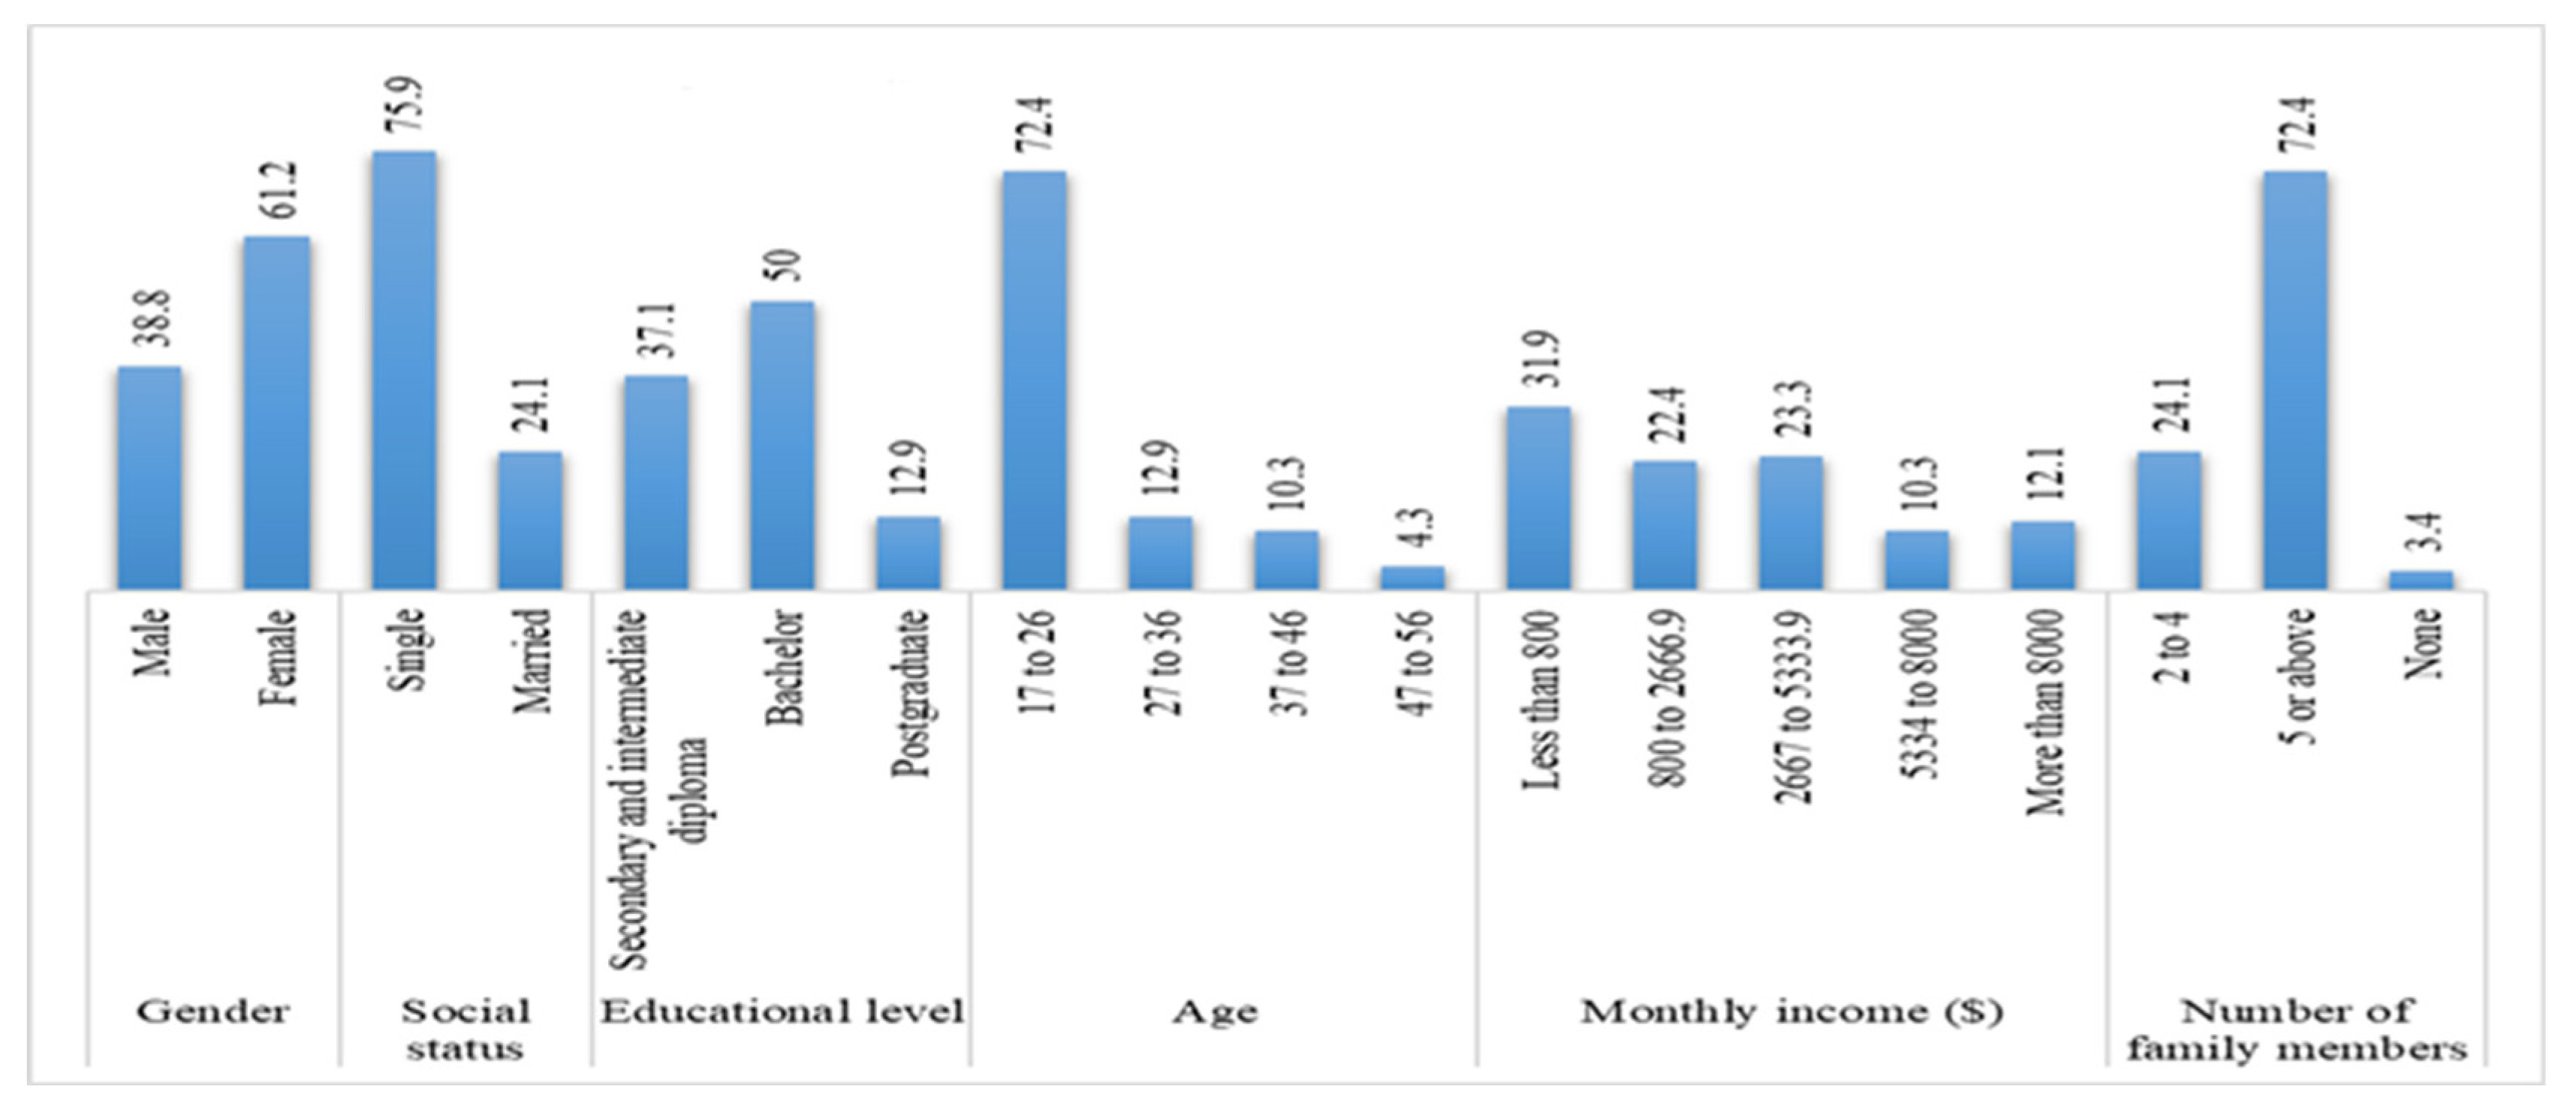
Figure 2 indicates the characteristics of the sample in terms of gender, social status, education level, age, monthly income, and number of family members.
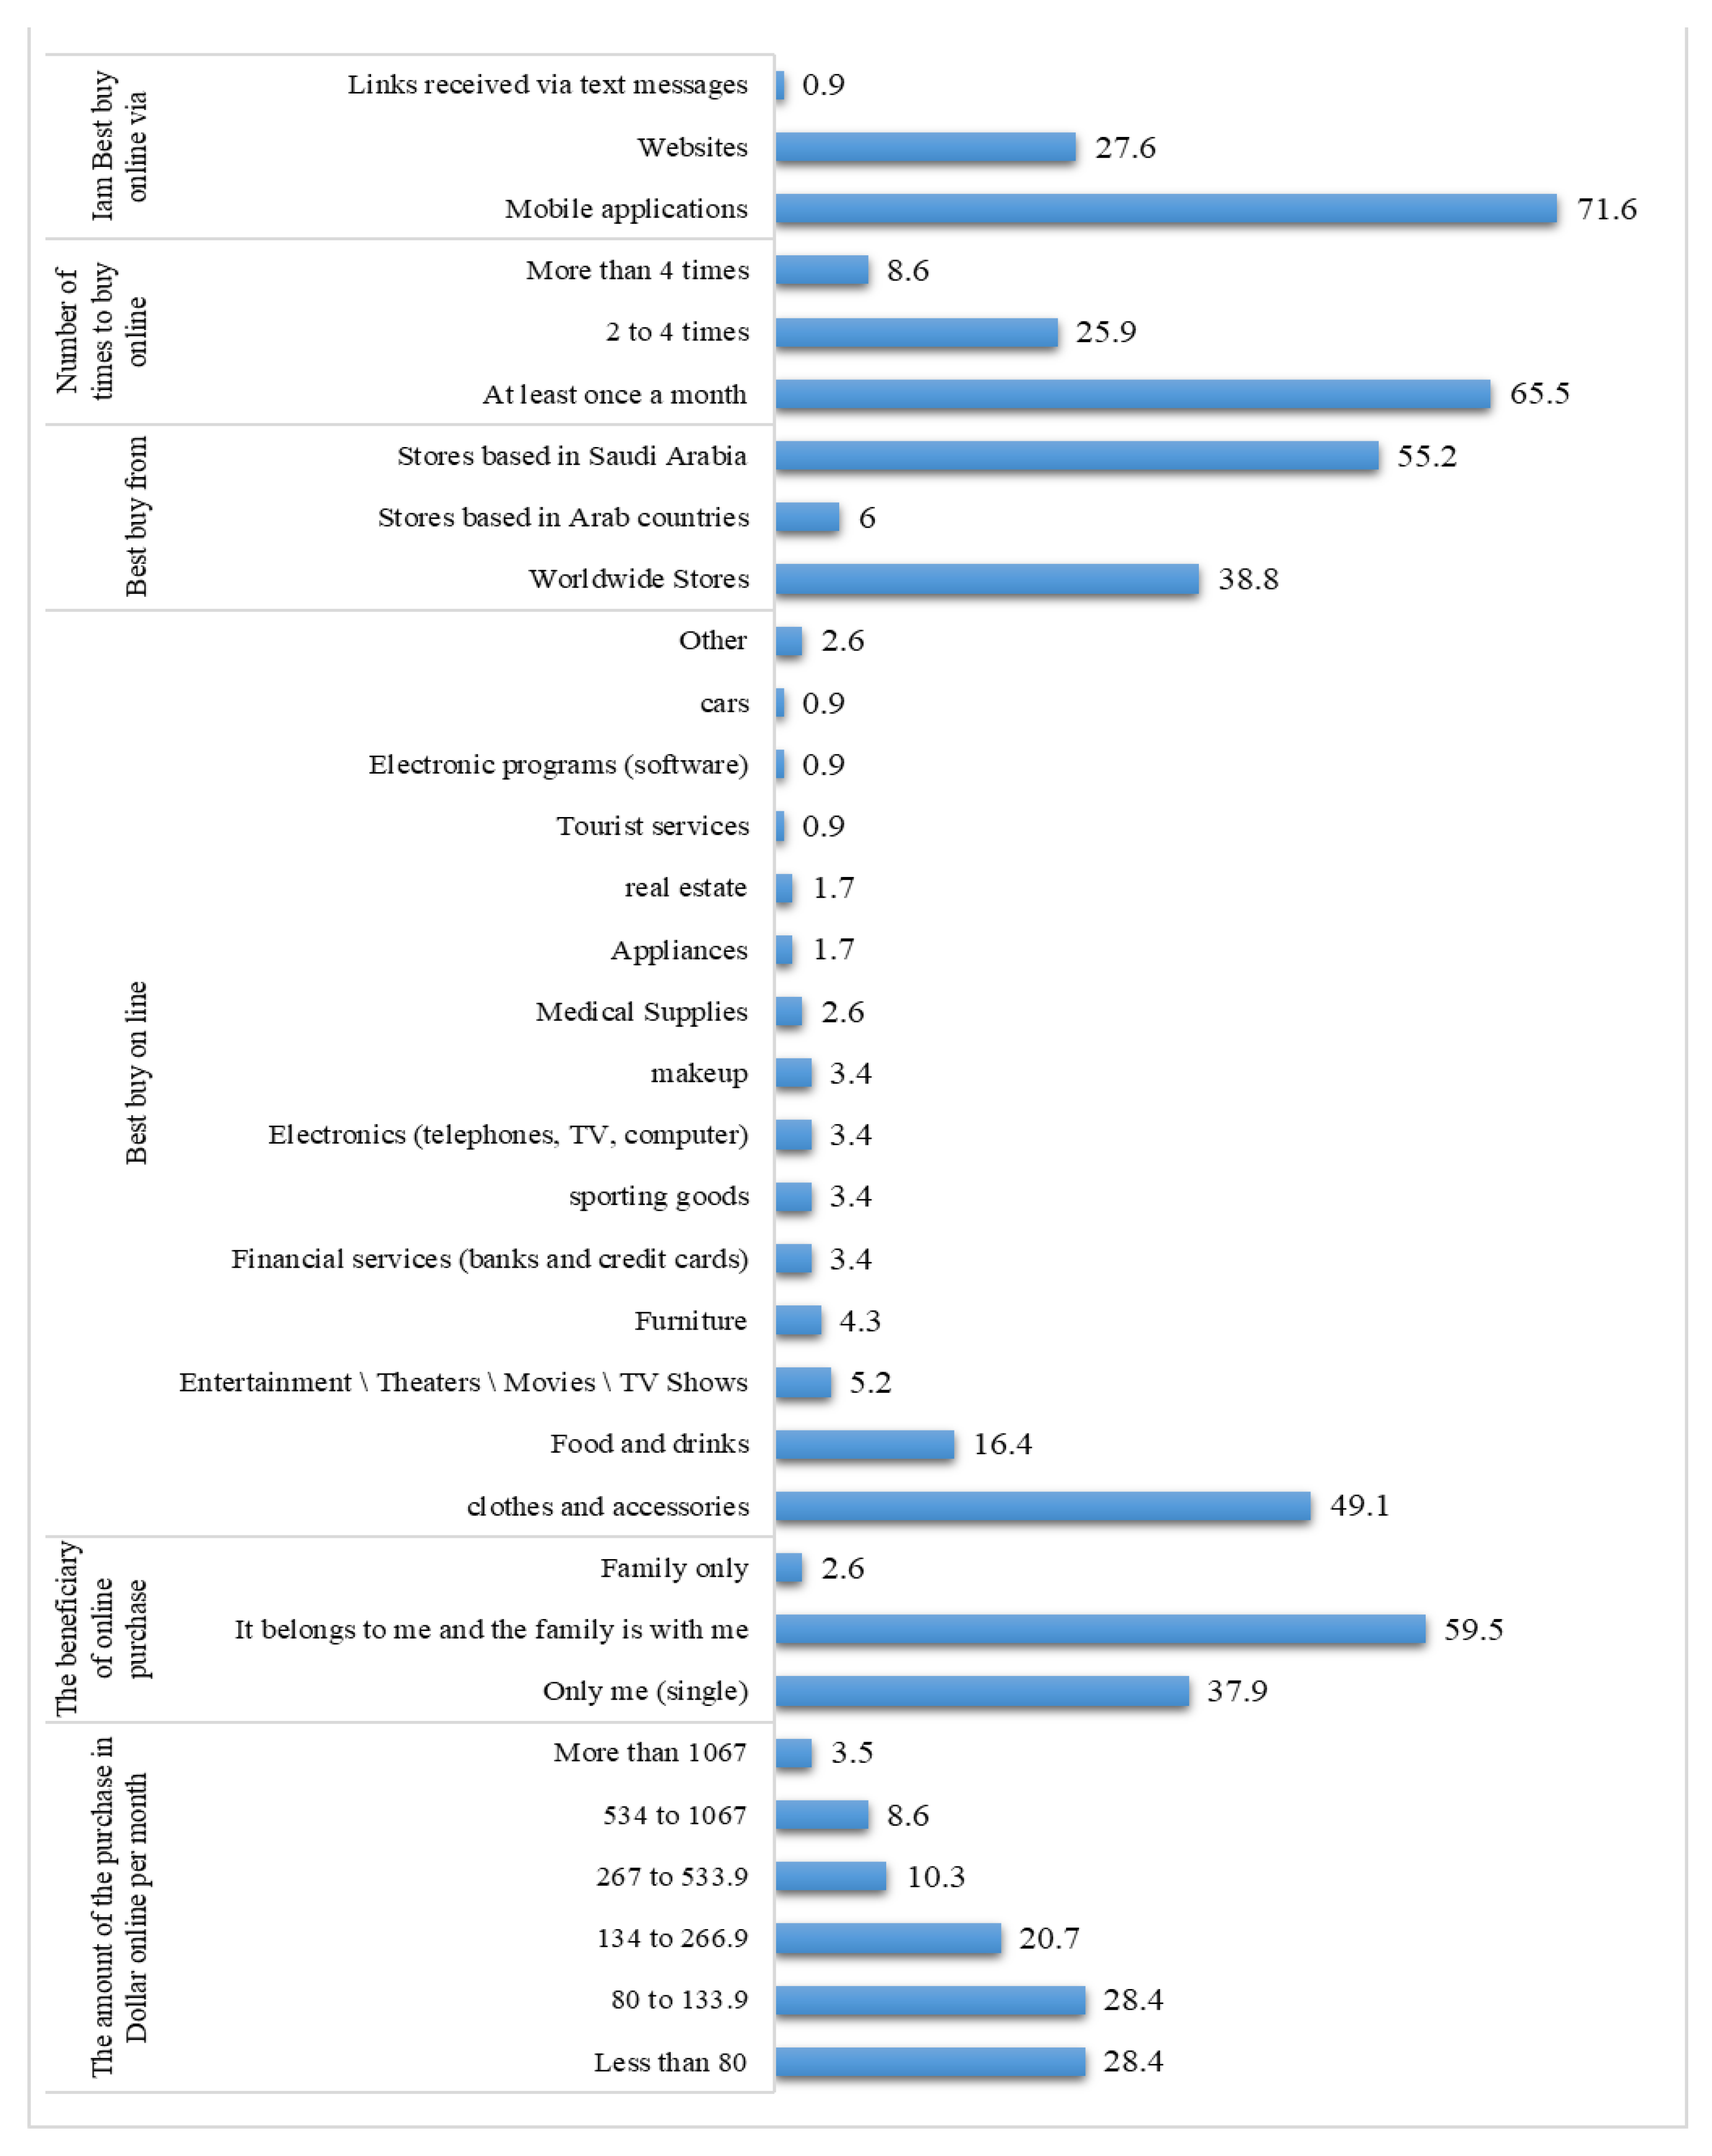
Figure 3 outlines optimal online shopping methods including preferred purchase times, recommended stores and products, the benefits of online shopping, and monthly spending.
Table 2 shows the results of a one-way ANOVA test to determine significant differences between the means of responses according to age, education level, monthly income (SR), and number of family members.
There are no statistically significant differences, at a significance level of 0.05 or less, between participants’ responses to AR factors and AR dimensions by age or the age of multiple family members. At a significance level of 0.05 or less, there are statistically significant differences between how participants answered questions about AR factors and dimensions based on their education level or monthly income (SR).
In
Table 3, the overall mean score for the AR factors across all domains was 3.58, with a standard deviation of 0.59; participants responded “agree” for the AR factors. The “Embodiment of Relationships” domain ranked first, with a mean of 3.72 and a standard deviation of 0.79; the “Change in Relationships” domain ranked last, with a mean of 3.45 and a standard deviation of 0.69. The overall mean score for all domains for the dimensions of AR was 3.77, and the standard deviation was 0.62; participants responded “agree” for the dimensions of AR. The domain “quality” ranked first with a mean of 3.97 and a standard deviation of 0.76. The domain “fear” ranked last, with a mean of 3.36 and a standard deviation of 0.97. There is a significant positive relationship between embodiment, hermeneutics, altering, and background factors, as well as AR dimensions, for the decision to buy.
In
Table 4, the correlation matrix is shown using the personal correlation between domains. There is a positive relationship at a level of significance of 0.05 or less between AR factors and AR domains.
The model summary has been presented in
Table 5, which highlights the significant influence of hermeneutical relationships, embodiment relationships, and background relationships on the purchase experience. The rate of influence varies from 36% to 47%, as depicted in the adjusted R-squared. The AR-domains’ influence is significant in the purchase decision.
From
Table 6, the following can be determined: there is a positive influence at a significance level of 0.05 or less from hermeneutical relationships, embodiment relationships, and background relationships on the dependent variable (purchase experience).
From
Table 7, the following can be determined: there is a positive influence at a significance level of 0.05 or less of quality, fun, and creativity on the dependent variable (purchase experience).
From
Table 8, at a significance level of 0.05 or less, quality, fun, and creativity positively affect the dependent variable (purchase experience).
6. Results and Discussion
This study’s findings support the first hypothesis, which states that there is a significant positive correlation (r = 0.788 **) between augmented reality (AR) dimensions and purchase experience. This finding aligns with the previous research by Saleem et al. (2021) [
39], using the Technology Acceptance Model (TAM), who also found a correlation between AR and purchase experience. The regression coefficient test further indicates that two AR dimensions, quality, and fun and creativity, have the most impact on the purchase experience of Saudi consumers. This is consistent with the findings of Saprikis et al. (2020) and Nachar (2020) [
36,
41], which suggest that perceived performance (quality) has an effect on purchase intention. Additionally, the study supports the findings of Chee et al. (2018) [
37], who found that perceived performance (quality) affects purchase intention, and Miell (2018) [
30], who found that perceived benefits contribute to intention and purchase decisions.
The unique, individual, and practical experience of online shopping through AR contributes to the commemoration of the brand and immersion in shopping. As a result, AR improves efficiency and quality, and this undoubtedly contributes to consumer perceptions of the brand. A study by Zaveri and Amin (2019) [
19] confirmed that consumers expressed a desire to purchase in the future using AR, which is regarded as the most powerful shopping technology available now. The data indicated that AR aids customers in evaluating products, consistent with Baytar et al. (2020) [
42]. The study also supports the findings of Mrvosevic (2021) [
43] that AR improves efficiency and quality.
According to Feng & Mueller (2019) [
18], achieving individuality is one of the indicators of the quality of shopping through augmented reality.
This study’s findings also show a positive relationship between fun and creativity and the purchasing experience (r = 0.721 **). Participants reported that AR made the shopping experience more enjoyable and creative, contributing to spontaneous purchases, as found by Do et al. (2020) [
38]. This is consistent with the results of Chimborazo et al. (2021) [
40] and the positive trend in Miell (2018) [
30]. It is also consistent with the findings of Saprikis et al. (2020) [
36], who found that AR fosters fun and innovation.
With regard to the results of the statistical analysis of the second hypothesis, these results have shown that the validity of this hypothesis is stable as it has been shown that there is a significant positive effect of AR factors on purchase experience. The results of the statistical analysis indicate that there is a correlation of 0.677 ** between AR factors and purchase experience. Based on the stepwise regression method, which is the most important type of multiple regression and aims to identify the most important affecting factors, this study shows that the hermeneutical relationship, embodiment relationship, and background relationship are the most affected by the purchasing experience of the Saudi consumer. This helps brands adopt the level of consumer immersion with products through this technology.
We discovered a correlation of 0.602 ** between the hermeneutic relationship and the purchase experience, in which the consumer imagines the product realistically. However, AR provides them with a wealth of sensory information that makes them feel as if they have experienced the product in the store. These results confirm Heller’s 2019 study [
35] whereby AR provides more information about a product than traditional ways of looking at it. This is consistent with Eskengren & Hultin’s study (2022) [
45], which confirmed the ability of augmented reality to make consumers imagine the product as it really is.
The factor embodiment relationship correlates with the purchase experience at 0.561 **; this relationship exists at a factor level between the AR customer and the product content. This is called “partial symbiosis” [
23]. This is also consistent with a study [
18] by Feng & Mueller (2019), which stressed that the characteristics of individuality, which are provided by augmented reality, make consumers indulge and control their content. This is followed by a background relationship with a correlation of 0.486 **, which means that consumers can use AR to learn about product data, qualities, and prices. This was also confirmed by the study [
43] by Mrvosevic (2021), which confirmed that augmented reality technology increases visual attention, which helps consumers remember. This means that it emphasizes the importance of these three factors for augmented reality, compared to each of Ihde’s relations from the highest level of the relationship of technology, to the human being, to the lowest level related to the consumer’s purchase decision. This technology also increases consumer immersion in shopping and increases shopping time, as my research has confirmed [
19].
The results of the statistical analysis of the third hypothesis are as follows: The results of this analysis show that there is a significant positive relationship between the AR factor and the AR dimensions, where augmented reality factors were associated with its dimensions. With AR dimensions of 0.810 **, all AR factors have a positive correlation coefficient. Additionally, the findings indicated that consumers’ concerns and anxiety regarding AR did not affect their purchase experience. Perhaps this is consistent with Saudi consumers’ general preference for electronic trade, as reported by the [
15] Jeddah Chamber (2020). This study agrees with [
41] Nachar’s (2019) study on Saudi consumers based on the Technology Acceptance Model. [
41] Nachar concluded that the perceived benefit of technology positively impacts online purchases. The participants’ attitudes toward the purchase experience were positive, and they preferred to use applications that offer AR features in online shopping. This is consistent with the findings of the [
44] Sun et al. (2019) study, which found that augmented reality improves consumer attitudes toward products. Participants spoke positively about their experiences with others. This research confirms that the AR experience generates important verbal marketing communication, in which the spoken word between customers has a significant impact. This is confirmed by a study by [
49] Kamal, K., Ozge E. (2019). This study also agreed with the results of a study [
43] by Mrvosevic (2021), which stressed that augmented reality contributes to the participation of friends and family because of the pleasure they find in doing so. The study concludes that AR increases the public’s confidence in purchasing decisions, influences the consumer to repeat purchases from the brand that made AR available through its websites or applications, and increases the rate of online purchases. The participants’ tendency toward help and facilitation was positive, as AR was considered valid, easy, and straightforward. This does not correspond to [
30] Miell’s (2018) study, which described the hypothetical measurement experiment as complex.
The results of this study for the fourth hypothesis, which states that there are statistically significant differences in how augmented reality (AR) helps average Saudi consumers decide what to buy when they are average participants, showed that there are indeed significant differences. The study found that the responses to AR factors and dimensions differed according to gender and social status, with females and married participants having a more favorable response. However, there were no significant differences in the responses based on age or the number of family members. On the other hand, the responses to AR factors and dimensions did differ significantly based on education level and monthly income. The results revealed differences in the online purchasing behavior of the participants using AR technology. This is in line with the findings of a previous study by [
47] Fakih, T.M.; Mosa, M (2013), which indicated that demographic factors affect online purchases. This study also supports the observation that Saudi families are becoming more likely to engage in online purchasing, which was previously reported by [
48] Baabdullah, A.; Habib, H. (2018), with a focus on women. The most commonly purchased products using AR technology were clothing and accessory items, as noted by [
45] Eskengren and Hultin (2022), who confirmed the suitability of AR for design-based products, contributing to its perception.


