
Climate Change and Inequality: Evidence from the United States


Abstract
:1. Introduction
Related Literature
2. Data and Methods
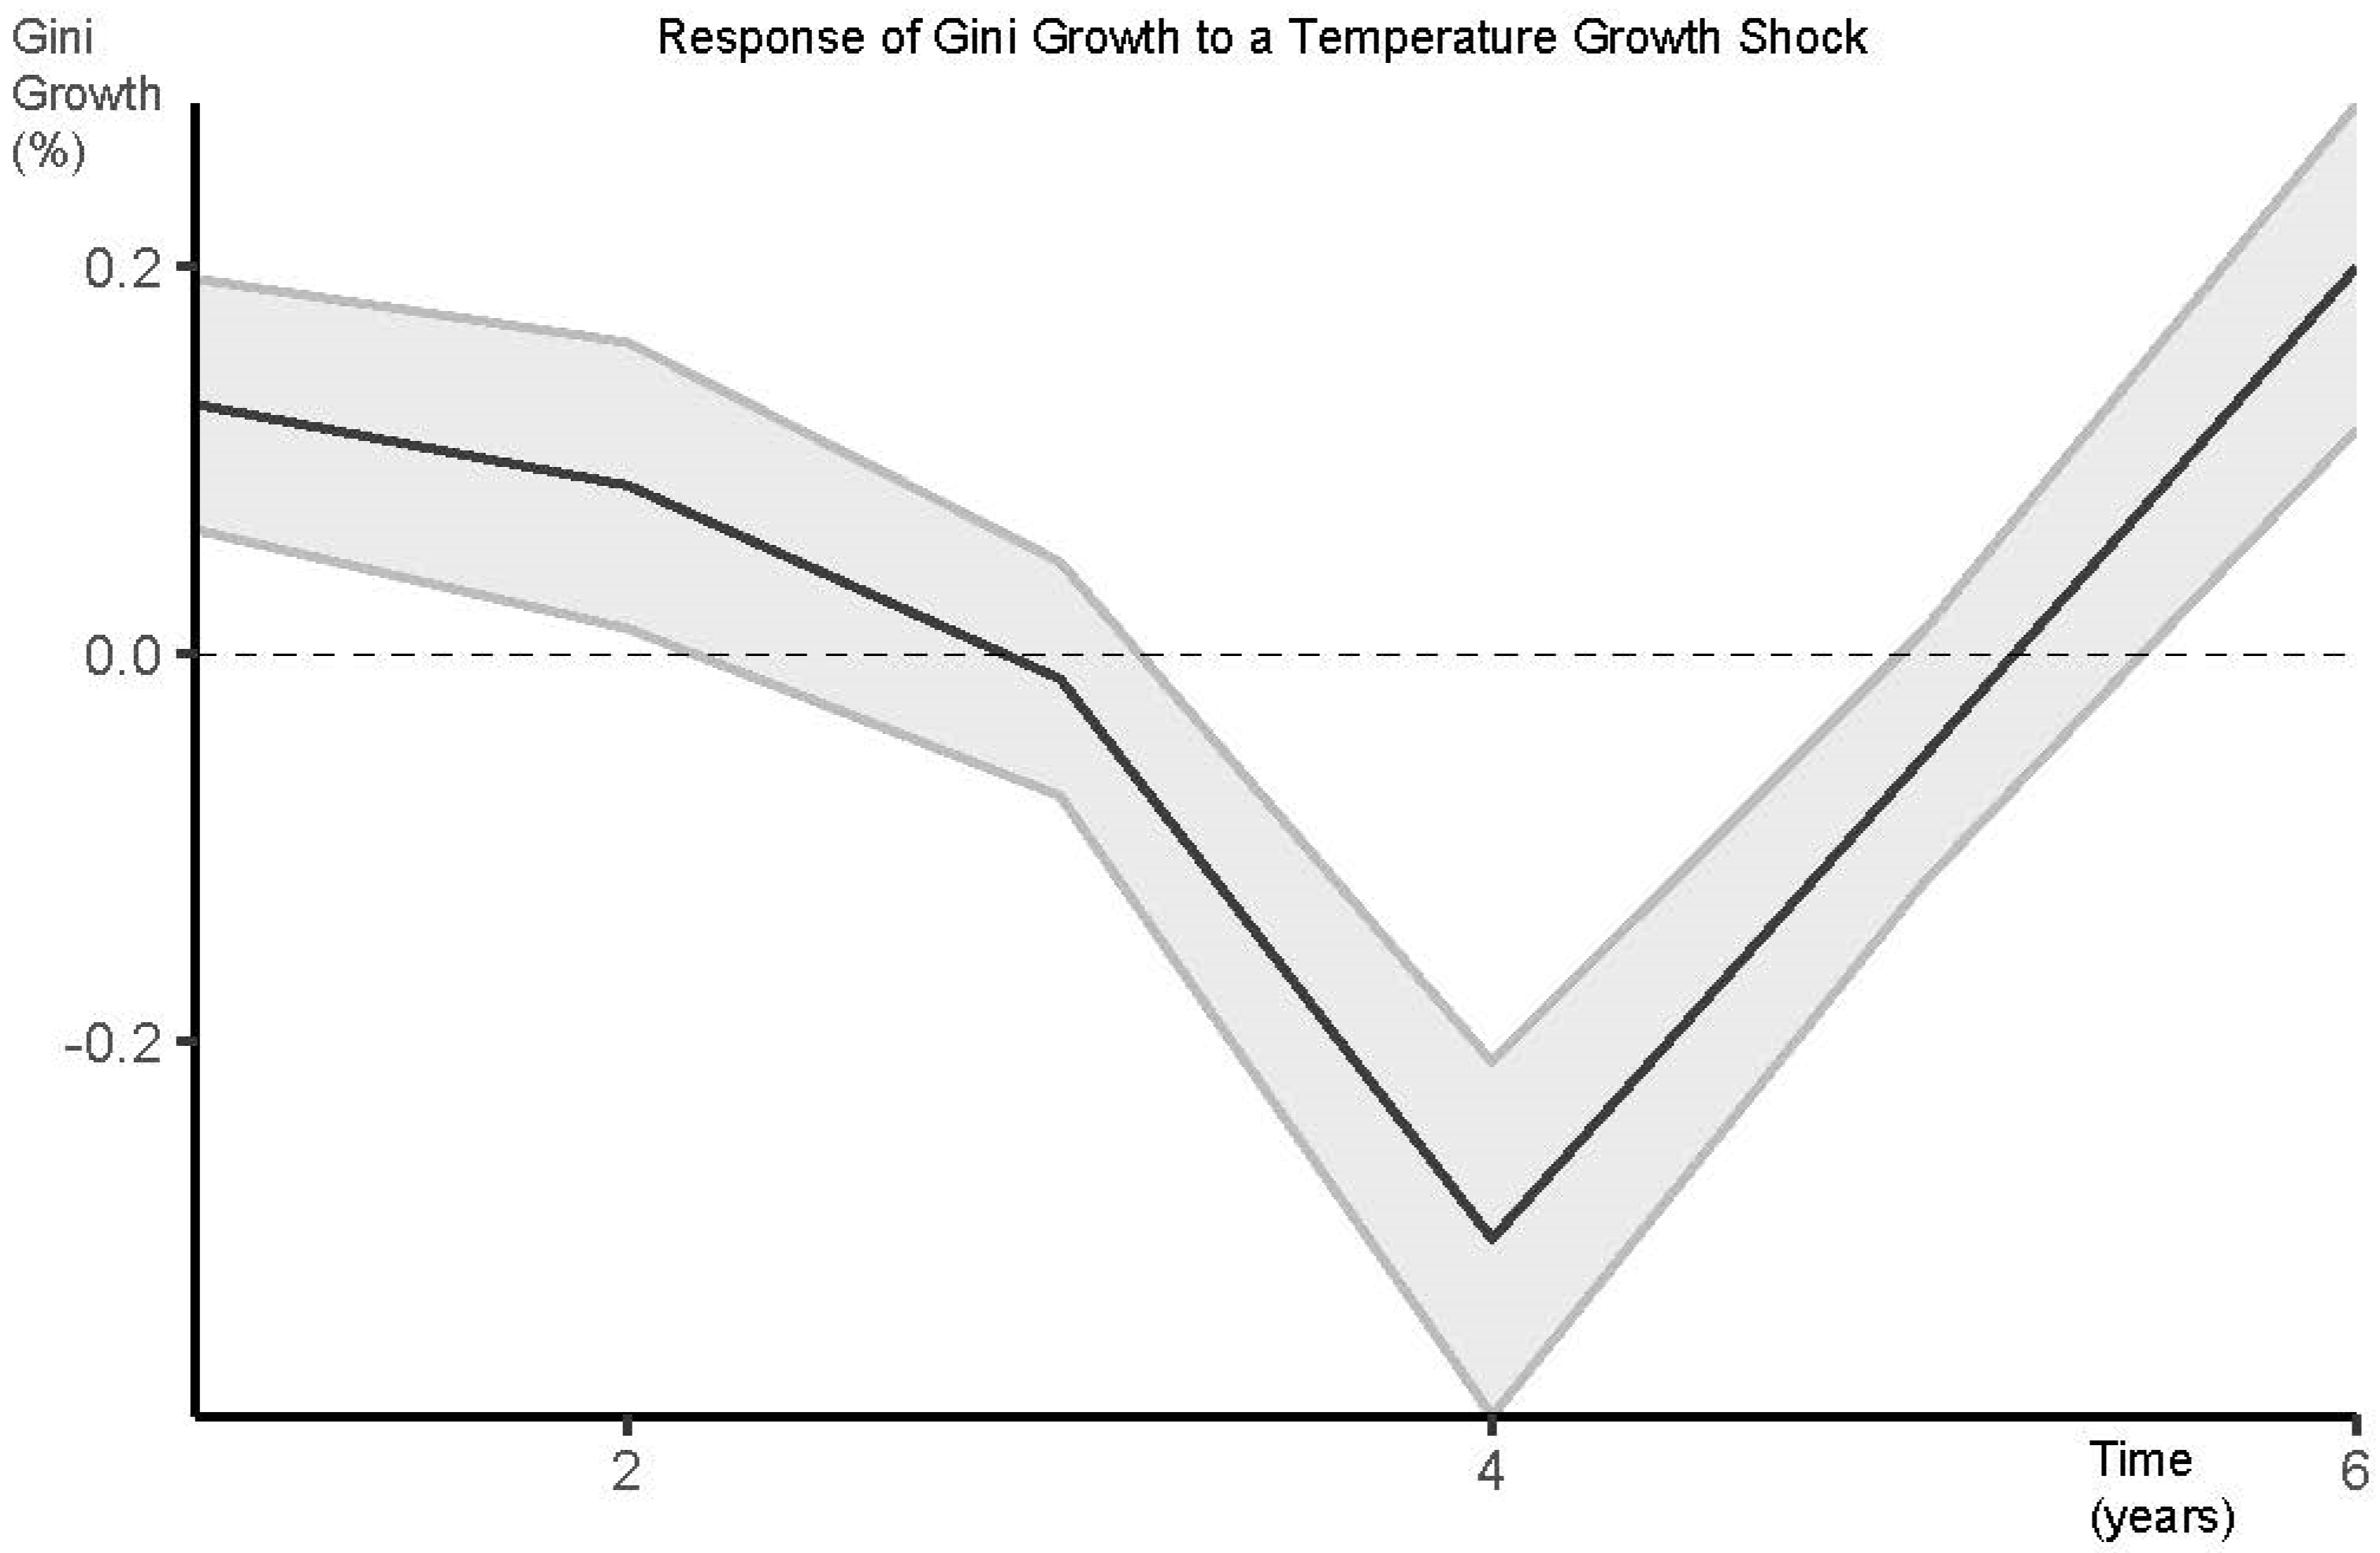
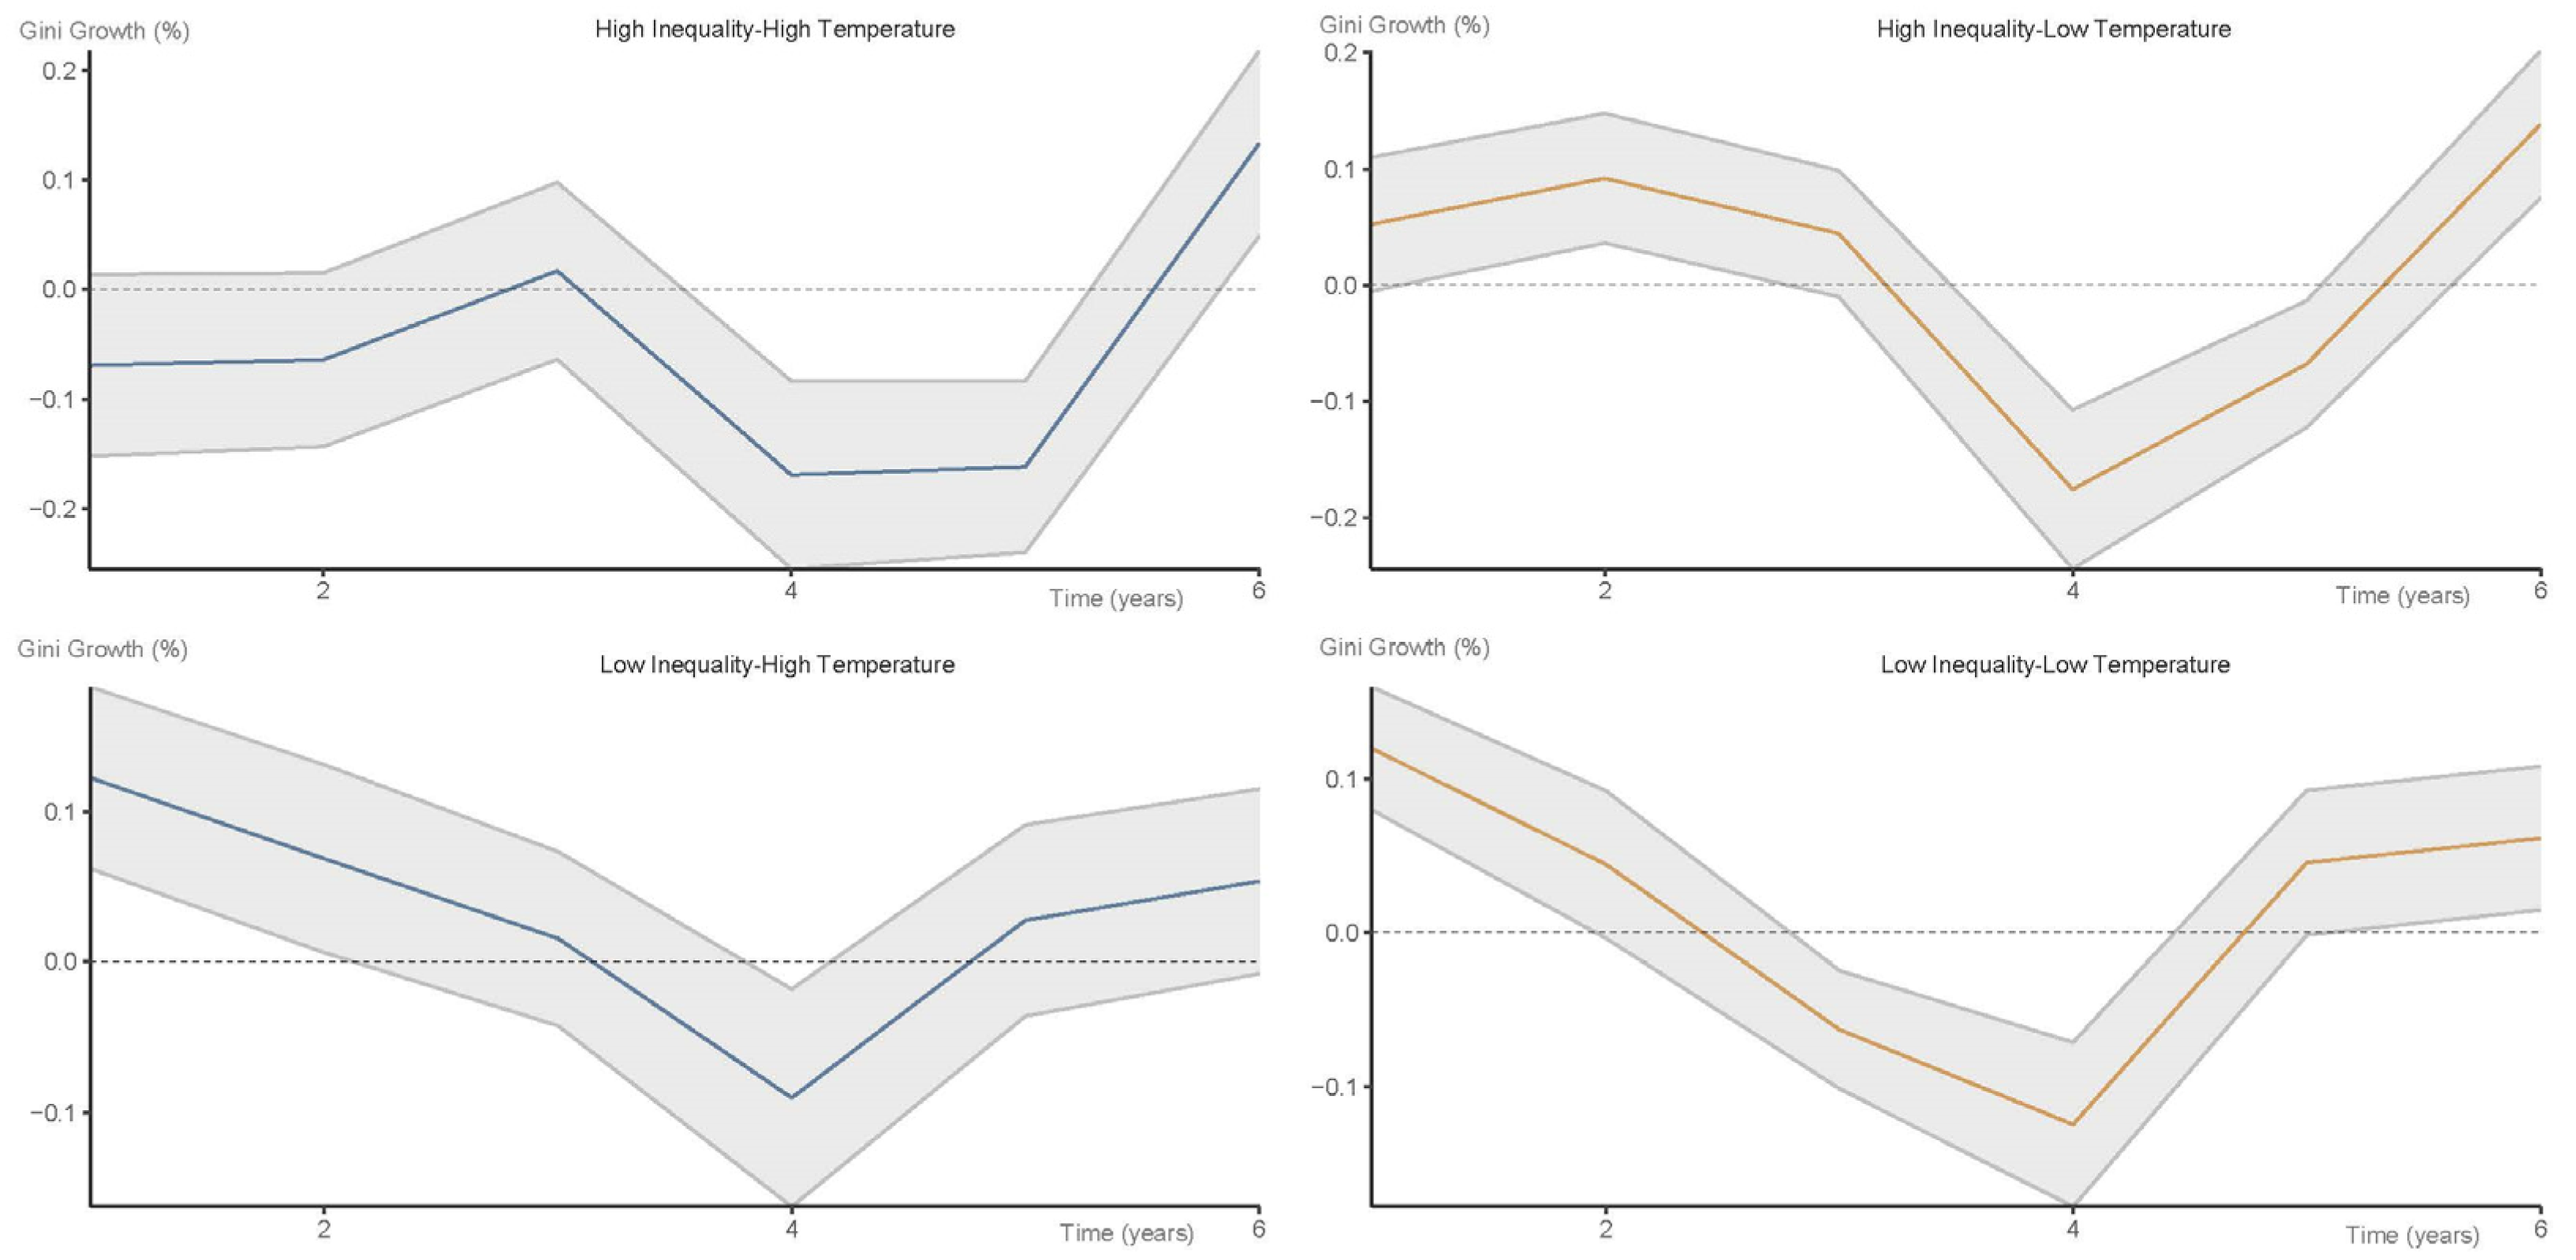
3. Results
4. Discussion
5. Conclusions
Author Contributions
Funding
Institutional Review Board Statement
Informed Consent Statement
Data Availability Statement
Acknowledgments
Conflicts of Interest
Appendix A

| Variable | Description | Source |
|---|---|---|
| Gini | Gini coefficient converted to growth rates | U.S. State-Level Income Inequality Data [18]) |
| tempgrowth | Mean temperature in degrees Fahrenheit converted to growth rates | National Oceanic and Atmospheric Administration (NOAA) National Centers for Environmental Information |
| pperincome | Per capita personal income | Bureau of Economic Analysis, U.S. Annual State-Level Human Capital |
| college | Total number of college graduates divided by the total state population | Measures [18]) |
| population | Total population per state | Bureau of Economic Analysis |
References
- Cai, Y.; Lontzek, T.S. The social cost of carbon with economic and climate risks. J. Political Econ. 2019, 127, 2684–2734. [Google Scholar] [CrossRef] [Green Version]
- Donadelli, M.; Jüppner, M.; Riedel, M.; Schlag, C. Temperature shocks and welfare costs. J. Econ. Dyn. Control 2017, 82, 331–355. [Google Scholar] [CrossRef]
- Balakrishnan, U.; Tsaneva, M. Air pollution and academic performance: Evidence from India. World Dev. 2021, 146, 105553. [Google Scholar] [CrossRef]
- Kim, S.J. Environmental shocks, civil conflict and aid effectiveness. Confl. Manag. Peace Sci. 2021, 38, 674–695. [Google Scholar] [CrossRef]
- Colacito, R.; Hoffmann, B.; Phan, T. Temperature and growth: A panel analysis of the United States. J. Money Credit Bank 2019, 51, 313–368. [Google Scholar] [CrossRef]
- Du, D.; Zhao, X.; Huang, R. The impact of climate change on developed economies. Econ. Lett. 2017, 153, 43–46. [Google Scholar] [CrossRef] [Green Version]
- Dell, M.; Jones, B.F.; Olken, B.A. Temperature Shocks and Economic Growth: Evidence from the Last Half Century. Am. Econ. J. Macroecon. 2012, 4, 66–95. [Google Scholar] [CrossRef] [Green Version]
- Dell, M.; Jones, B.F.; Olken, B.A. What Do We Learn from the Weather? The New Climate-Economy Literature. J. Econ. Lit. 2014, 52, 740–798. [Google Scholar] [CrossRef] [Green Version]
- Diffenbaugh, N.; Burke, M. Global warming has increased global economic inequality. Proc. Natl. Acad. Sci. USA 2019, 116, 9808–9813. [Google Scholar] [CrossRef] [Green Version]
- Islam, N.; Winkel, J. Climate Change and Social Inequality; DESA Working Paper No. 152; United Nations, Department of Economic and Social Affairs: New York, NY, USA, 2017. [Google Scholar]
- Taconet, N.; Méjean, A.; Guivarch, C. Influence of climate change impacts and mitigation costs on inequality between countries. Clim. Chang. 2020, 160, 15–34. [Google Scholar] [CrossRef]
- Knight, K.W.; Schor, J.B.; Jorgenson, A.K. Wealth Inequality and Carbon Emissions in High-income Countries. Soc. Curr. 2017, 4, 403–412. [Google Scholar] [CrossRef]
- Nordhaus, W.D. Geography and Macroeconomics: New Data and New Findings. Proc. Natl. Acad. Sci. USA 2006, 103, 3510–3517. [Google Scholar] [CrossRef] [Green Version]
- Paglialunga, E.; Coveri, A.; Zanfei, A. Climate change and within-country inequality: New evidence from a global perspective. World Dev. 2022, 159, 106030. [Google Scholar] [CrossRef]
- Colmer, J. Temperature, labor reallocation, and industrial production: Evidence from India. Am. Econ. J. Appl. Econ. 2021, 13, 101–124. [Google Scholar] [CrossRef]
- Denchak, M. Are the Effects of Global Warming really that Bad? Natural Resources Defense Council, 2022. Available online: https://www.nrdc.org/stories/are-effects-global-warming-really-bad (accessed on 28 February 2023).
- Horowitz, J.M.; Igielnik, R.; Kochhar, R. Most Americans Say There Is Too Much Economic Inequality in the U.S., but Fewer Than Half Call It a Top Priority. Pew Research Center, 2020. Available online: https://www.pewresearch.org/social-trends/2020/01/09/trends-in-income-and-wealth-inequality/ (accessed on 28 February 2023).
- Frank, M. Inequality and growth in the United States: Evidence from a new state-level panel of income inequality measure. Econ. Inq. 2009, 47, 55–68. [Google Scholar] [CrossRef]
- Panayotou, T. Empirical Tests and Policy Analysis of Environmental Degradation at Different Stages of Economic Development; ILO Working Papers 992927783402676; International Labour Organization: Geneva, Switzerland, 1993. [Google Scholar]
- Shafik, N.; Bandyopadhyay, S. Economic Growth and Environmental Quality: Time-Series and Cross-Country Evidence; Policy Research Working Paper Series 90; The World Bank: Washington, DC, USA, 1992. [Google Scholar]
- Hartmann, D. Observations: Atmosphere and Surface. In Climate Change 2013: The Physical Science Basis; Cambridge University Press: Cambridge, UK, 2013; pp. 159–254. [Google Scholar]
- Dinda, S. Environmental Kuznets Curve Hypothesis: A Survey. Ecol. Econ. 2004, 49, 431–455. [Google Scholar] [CrossRef] [Green Version]
- Golosov, M.; Hassler, J.; Krusell, P.; Tsyvinski, A. Optimal taxes on fossil fuel in general equilibrium. Econometrica 2014, 82, 41–88. [Google Scholar]
- Mutter, J.C. Disaster Profiteers: How Natural Disasters Make the Rich Richer and the Poor Even Poorer; St. Martin’s Press: New York, NY, USA, 2015. [Google Scholar]
- Hill, R.; Mejia-Mantilla, C. Welfare and Shocks in Uganda; Background Pape r prep Ared for World Bank Uganda Poverty Assessment; Technical Report; The World Bank: Washington, DC, USA, 2015. [Google Scholar]
- Abdullah, A.; Doucouliagos, H.; Manning, E. Does Education Reduce Income Inequality? A Meta-Regression Analysis. J. Econ. Surv. 2015, 29, 301–316. [Google Scholar] [CrossRef]
- Yang, J.; Qiu, M. The impact of education on income inequality and intergenerational mobility. China Econ. Rev. 2016, 37, 110–125. [Google Scholar] [CrossRef]
- Ahmed, M.I.; Cassou, S.P. Does consumer confidence affect durable goods spending during bad and good economic times equally? J. Macroecon. 2016, 50, 86–97. [Google Scholar] [CrossRef]
- Jordà, O. Estimation and inference of impulse responses by local projections. Am. Econ. Rev. 2005, 95, 161–182. [Google Scholar] [CrossRef]
- Gupta, R.; Sheng, X. The Effects of Oil Shocks on Macroeconomic Uncertainty: Evidence from a Large Panel Dataset of US States. In Computational Management; Nanda, P., Patnaik, D., Patnaik, S., Eds.; Springer International Publishing: Berlin/Heidelberg, Germany, 2021; pp. 159–175. [Google Scholar]
- Sheng, X.; Marfatia, H.A.; Gupta, R.; Ji, Q. House price synchronization across the U.S. States: The role of structural oil shocks. N. Am. J. Econ. Financ. 2021, 56, 101372. [Google Scholar] [CrossRef]
- Avtar, R.; Blickle, K.; Chakrabarti, R.; Janakiraman, J.; Pinkovskiy, M. Understanding the Linkages between Climate Change and Inequality in the United States; Staff Report, No. 991; Federal Reserve Bank of New York: New York, NY, USA, 2021. [Google Scholar]
- Carter, L.; Terando, A.; Dow, K.; Hiers, K.; Kunkel, K.E.; Lascurain, A.; Marcy, D.; Osland, M.; Schramm, P. Southeast. In Impacts, Risks, and Adaptation in the United States; Fourth National Climate Assessment, Volume II; Reidmiller, D.R., Avery, C.W., Easterling, D.R., Kunkel, K.E., Lewis, K.L.M., Maycock, T.K., Stewart, B.C., Eds.; U.S. Global Change Research Program: Washington, DC, USA, 2018; pp. 743–808. [Google Scholar] [CrossRef]
- Crane-Droesch, A.; Marshall, E.; Rosch, S.; Riddle, A.; Cooper, J.; Wallander, S. Climate Change and Agricultural Risk Management Into the 21st Century; No. 291962; United States Department of Agriculture, Economic Research Service: Washington, DC, USA, 2019. [Google Scholar]
- Donadelli, M.; Jüppner, M.; Vergalli, S. Temperature variability and the macroeconomy: A world tour. Environ. Resour. Econ. 2022, 83, 221–259. [Google Scholar] [CrossRef]
- Somanathan, E.; Somanathan, R.; Sudarshan, A.; Tewari, M. The impact of temperature on productivity and labor supply: Evidence from Indian manufacturing. J. Polit. Econ. 2021, 129, 1797–1827. [Google Scholar] [CrossRef]
- Alvarez, J.; Rossi-Hansberg, E. The Economic Geography of Global Warming; No. w28466; National Bureau of Economic Research: Cambridge, MA, USA, 2021. [Google Scholar]
- Alessandri, P.; Mumtaz, H. The macroeconomic cost of climate volatility. arXiv 2021, arXiv:2108.01617. [Google Scholar]


| Gini 1940–1979 | Gini 1980–2015 | Temperature Growth % 1940–1979 | Temperature Growth % 1980–2015 | |
|---|---|---|---|---|
| Alabama | 0.442 | 0.561 | 0.008 | 0.144 |
| Alaska | 0.459 | 0.588 | 0.569 | 0.236 |
| Arizona | 0.443 | 0.568 | −0.087 | 0.135 |
| Arkansas | 0.462 | 0.573 | −0.027 | 0.159 |
| California | 0.438 | 0.604 | −0.051 | 0.145 |
| Colorado | 0.455 | 0.571 | −0.113 | 0.241 |
| Connecticut | 0.443 | 0.600 | 0.167 | 0.057 |
| Delaware | 0.507 | 0.536 | 0.102 | 0.133 |
| Florida | 0.479 | 0.616 | 0.060 | 0.136 |
| Georgia | 0.455 | 0.576 | 0.031 | 0.132 |
| Idaho | 0.435 | 0.581 | −0.150 | 0.251 |
| Illinois | 0.437 | 0.575 | −0.058 | 0.190 |
| Indiana | 0.417 | 0.543 | −0.040 | 0.168 |
| Iowa | 0.440 | 0.543 | −0.083 | 0.243 |
| Kansas | 0.450 | 0.562 | −0.057 | 0.205 |
| Kentucky | 0.442 | 0.557 | −0.026 | 0.159 |
| Louisiana | 0.449 | 0.589 | 0.006 | 0.149 |
| Maine | 0.438 | 0.536 | 0.180 | −0.041 |
| Maryland | 0.439 | 0.541 | 0.071 | 0.121 |
| Massachusetts | 0.439 | 0.571 | 0.174 | 0.034 |
| Michigan | 0.419 | 0.554 | −0.002 | 0.172 |
| Minnesota | 0.446 | 0.551 | −0.127 | 0.390 |
| Mississippi | 0.464 | 0.580 | 0.001 | 0.161 |
| Missouri | 0.451 | 0.562 | −0.042 | 0.195 |
| Montana | 0.448 | 0.598 | −0.135 | 0.307 |
| Nebraska | 0.460 | 0.570 | −0.111 | 0.245 |
| Nevada | 0.445 | 0.599 | −0.091 | 0.177 |
| New Hampshire | 0.429 | 0.543 | 0.179 | 0.009 |
| New Jersey | 0.429 | 0.571 | 0.140 | 0.118 |
| New York | 0.458 | 0.612 | 0.143 | 0.067 |
| North Carolina | 0.448 | 0.552 | 0.021 | 0.136 |
| North Dakota | 0.456 | 0.569 | −0.210 | 0.425 |
| Ohio | 0.417 | 0.534 | 0.009 | 0.151 |
| Oklahoma | 0.455 | 0.580 | −0.049 | 0.162 |
| Oregon | 0.435 | 0.556 | −0.082 | 0.196 |
| Pennsylvania | 0.424 | 0.556 | 0.080 | 0.114 |
| Rhode Island | 0.435 | 0.547 | 0.186 | 0.040 |
| South Carolina | 0.435 | 0.552 | 0.028 | 0.134 |
| South Dakota | 0.465 | 0.599 | −0.131 | 0.306 |
| Tennessee | 0.453 | 0.570 | 0.006 | 0.154 |
| Texas | 0.466 | 0.605 | −0.026 | 0.126 |
| Utah | 0.422 | 0.558 | −0.157 | 0.234 |
| Vermont | 0.441 | 0.548 | 0.197 | 0.014 |
| Virginia | 0.444 | 0.545 | 0.037 | 0.136 |
| Washington | 0.415 | 0.552 | −0.094 | 0.208 |
| West Virginia | 0.417 | 0.533 | 0.005 | 0.159 |
| Wisconsin | 0.429 | 0.540 | −0.063 | 0.288 |
| Wyoming | 0.444 | 0.600 | −0.157 | 0.275 |
| Variable | Number of Observations | Mean | Standard Deviation | Minimum | Maximum |
|---|---|---|---|---|---|
| Gini | 3629 | 0.503 | 0.074 | 0.322 | 0.711 |
| tempgrowth | 3629 | 51.354 | 8.464 | 22.275 | 73.358 |
| pperincome | 3629 | 14,423 | 14,743 | 212 | 67761 |
| population | 3629 | 4,605,257 | 5,105,866 | 113,000 | 38,900,000 |
| college | 3629 | 0.101 | 0.065 | 0.013 | 0.306 |
Disclaimer/Publisher’s Note: The statements, opinions and data contained in all publications are solely those of the individual author(s) and contributor(s) and not of MDPI and/or the editor(s). MDPI and/or the editor(s) disclaim responsibility for any injury to people or property resulting from any ideas, methods, instructions or products referred to in the content. |
© 2023 by the authors. Licensee MDPI, Basel, Switzerland. This article is an open access article distributed under the terms and conditions of the Creative Commons Attribution (CC BY) license (https://creativecommons.org/licenses/by/4.0/).
Share and Cite
Chisadza, C.; Clance, M.; Sheng, X.; Gupta, R. Climate Change and Inequality: Evidence from the United States. Sustainability 2023, 15, 5322. https://doi.org/10.3390/su15065322
Chisadza C, Clance M, Sheng X, Gupta R. Climate Change and Inequality: Evidence from the United States. Sustainability. 2023; 15(6):5322. https://doi.org/10.3390/su15065322
Chicago/Turabian StyleChisadza, Carolyn, Matthew Clance, Xin Sheng, and Rangan Gupta. 2023. "Climate Change and Inequality: Evidence from the United States" Sustainability 15, no. 6: 5322. https://doi.org/10.3390/su15065322