Article

Effects of the Salt-Tolerant Gramineous Forage Echinochloa frumentacea on Biological Improvement and Crop Productivity in Saline–Alkali Land on the Hetao Ningxia Plain in China

1
School of Agriculture, Ningxia University, Yinchuan 750021, China
2
Ningxia Institute of Science and Technology Development Strategy and Information, Yinchuan 750021, China
3
School of Ecology and Environment, Ningxia University, Yinchuan 750021, China
4
Breeding Base for State Key Laboratory of Land Degradation and Ecological Restoration in Northwestern China, Yinchuan 750021, China
5
MOE Key Laboratory of Cell Activities and Stress Adaptations, School of Life Sciences, Lanzhou University, Lanzhou 730000, China
6
State Key Laboratory of Herbage Improvement and Grassland Agro-Ecosystems, Lanzhou University, Lanzhou 730000, China
*
Authors to whom correspondence should be addressed.
Sustainability 2023, 15(6), 5319; https://doi.org/10.3390/su15065319
Submission received: 25 January 2023 / Revised: 14 March 2023 / Accepted: 14 March 2023 / Published: 17 March 2023

Abstract

:
Biological improvement is a sustainable approach for saline–alkali land amelioration and utilization. Echinochloa frumentacea (Roxb.) link is a salt-tolerant gramineous forage, which plays an important role in improving saline–alkali land. The Hetao Ningxia Plain is located in the upper–middle reaches of the Yellow River with a large area of saline–alkali soil, where E. frumentacea has potential applications for improving saline–alkali land. Three experiments were conducted on saline–alkali land in Pingluo County, Ningxia, including soil-leaching experiments in pots as well as monoculture or intercropping experiments involving E. frumentacea in fields. The results showed that: (1) E. frumentacea had a strong leaching ability of Na+ and SO42− in saline–alkali soil. (2) The planting of E. frumentacea decreased soil pH and total salt; enhanced the available N, P and K; and increased plant height, stem thickness and yields compared with the control. (3) The diversity of soil bacteria and land use efficiency could be improved by the intercropping of E. frumentacea with legume forages. Overall, E. frumentacea is an important pioneer species of biological improvement for the sustainable utilization of secondary saline–alkali land produced by irrigation around the world.

1. Introduction

Saline soil is widely distributed on the earth, accounting for about 25% of the total land area and distributed in more than 100 countries [1]. In China, the total area of saline–alkali land is about 33.51 million hectares, accounting for 4.88% of the total land area, mainly distributed in the inland areas of north, northeast and northwest China, 30% of which has value for agricultural use [2,3]. The typical characteristics of saline–alkali soil include the excessive accumulation of Na+, CO32− and HCO3, as well as a high pH, high sodium absorption rate (SAR) and high exchange sodium percentage (ESP) on the soil surface. These factors lead to an unstable soil structure, the deterioration of soil hydraulic characteristics, and the imbalance in plant-available nutrients, resulting in low vegetation coverage [4]. Excessive salts in the soil not only adversely affect the physical and chemical properties of soil but also affect the activities of soil microorganisms and enzymes. Both soil salinity and alkalinity have adverse effects on microbial communities (structure, function and diversity) [5].
Saline–alkali land is an important reserve land resource for food production. Under the background of a global food crisis, it is necessary to restore the soil affected by salt to ensure food security and to alleviate the shortage of arable land and improve the ability to meet the food demand of a growing population [6,7]. At present, the current engineering and chemical measures used for improving salinity-affected soil have various shortcomings, such as high cost, unsustainable improvement effects and a number of limitations. Biological improvements can increase the surface coverage area and the number of soil roots by planting salt-tolerant plants, improving soil physical and chemical properties, inhibiting soil salt return, increasing the number and activity of soil microbial communities, enhancing land productivity and obtaining economic benefits by harvesting aboveground elements, which is one of the most effective measures for the sustainable development and utilization of saline–alkali land [8,9].
Intercropping is an important planting method, which has been widely used all over the world. Intercropping is one of the most important systems of increasing land productivity and profitability [10]. Compared with continuous cropping and monoculture systems, the intercropping system can improve crop productivity, land use efficiency, resource utilization efficiency (solar energy, water and nutrients), biodiversity and soil quality, etc. It is an optimal system that is able to achieve the high efficiency and sustainability of modern agricultural land use [11,12]. Intercropping can increase aboveground plant diversity in agricultural systems, which can improve the composition of the soil microbial community and increase the diversity of the underground microbial community. Thus, higher soil microbial diversity can inhibit pathogenic microorganisms, accelerate decomposing organic matter, boost the nutrient cycle and slow greenhouse gas emission, thus promoting the sustainable development of agriculture [13,14].
Echinochloa frumentacea is an annual C4 gramineous plant [15]. It grows quickly with high hay yields but regenerates poorly after grazing or cutting. It is a short-day plant that is affected by photoperiods [16]. E. frumentacea can grow well in harsh environments [17], and has usually been used as forage or a green manure crop [18]. Indoor and field experiments show that E. frumentacea has good salt tolerance and adapts well to the conditions of saline–alkali land [19]. E. frumentacea is mainly grown in India, China and Japan and is used as food or livestock feed in the semi-arid tropical areas of India and several African countries or as bird feed in the United States [20]. Since the 1980s, E. frumentacea has been widely planted on saline–alkali land on the Hetao Ningxia Plain of Northwest China, as it is saline–alkali-tolerant with high yields. However, there are few reports on the desalination effect and application of E. frumentacea to improve saline–alkali land. The biological improvement mechanism and planting mode of E. frumentacea on saline–alkali land on the Hetao Ningxia Plain remains to be studied.
In this study, three experiments were conducted on saline–alkali land on the Hetao Ningxia Plain, encompassing soil-leaching experiments in pots as well as monoculture or intercropping experiments of E. frumentacea in fields. The effects of E. frumentacea on biological improvement and crop productivity on saline–alkali land were studied. The purpose of this study was to explore the feasibility of the sustainable utilization of saline–alkali land using salt-tolerant forages on the Hetao Ningxia Plain.

2. Materials and Methods

2.1. Plant Species

The plant species utilized were Echinochloa frumentacea cv. ‘Haizi No.1′, barnyard grass (E. crusgalli var. austrojaponensis cv. ‘Zhaomu No.1′), oat (Avena sativa L. cv. ‘Tianyan No.1′), Salicornia europaea L., alfalfa (Medicago sativa L. cv. ‘Zhongmu No.3′), semi-wild soybean (Glycinemax.gracilis Skvortsov cv. ‘Dongsidou No.1′) and fodder soybeans (Glycine max (L.) Merr. Cv. ‘Mudanjiang MD’). E. frumentacea was provided by the School of Ecology and Environment, Ningxia University. Oat was provided by Ningxia Qianye Qing Agricultural Technology Development Co., Ltd., Pingluo, China. S. europaea was provided by the Karamay Halophyte Botanical Garden, Xinjiang Institute of Ecology and Geography, Chinese Academy of Sciences, and barnyard grass and alfalfa were provided by Ningxia Xibei Agriculture, Forestry and Animal Husbandry Ecological Technology Co., Ltd., Yinchuan, China. Semi-wild soybeans were provided by the Dongying Academy of Agricultural Sciences, and fodder soybeans were provided by Northeast Agriculture University.

2.2. Background of Experimental Sites

For experiment 1, the experimental soil was taken from Qianjin Farm in Pingluo County (38°49′ N, 106°23′ E) and Dongfeng Village in Gaozhuang Township of Pingluo County (38°95′ N, 106°59′ E); the soil type of Qianjin Farm was alkaline soil, and the soil type of Dongfeng Village in Gaozhuang Township was salinized soil. The basic chemical properties of alkaline soil were pH 9.10, alkalinity was 21.75%, total water soluble salt content was 3.2 g·kg−1, organic matter was 6.20 g·kg−1, total nitrogen was 0.14 g·kg−1, available phosphorus was 3.29 mg·kg−1 and available potassium was 240 mg·kg−1. The basic chemical properties of salinized soil were as follows: pH, 8.33; alkalinity, 14.6%; total water soluble salt content, 6.6 g·kg−1; organic matter, 4.76 g·kg−1; total nitrogen, 0.23 g·kg−1; available phosphorus, 12.1 mg·kg−1; and available potassium, 159 mg·kg−1.
For experiment 2, the experimental site was located in Baofeng Village, Pingluo County (38°08′ N, 106°74′ E). The experimental site was located at the end of the Yellow River irrigation system, with low terrain, high groundwater level and difficult irrigation and drainage, forming saline–alkali land. The land had been abandoned by farmers and had not been planted for three years. Before sowing, the soil was ploughed and weeds were removed. The chemical properties of 0–20 cm layer soil were pH 9.4, total water soluble salt content 7.7 g·kg−1 and unit weight 1.6.
For experiment 3, the experimental site was located at Huiwei Village, Gaozhuang Township, Pingluo County (38°95’ N, 106°54’ E), at an altitude of about 1057.8 m, which has a temperate arid continental climate with sufficient annual sunshine (2800–3200 h). The soil type is saline–alkali soil. The previous crop in this field was alfalfa, and the 0–30 cm soil layer was ploughed before the experiment. The chemical properties of 0–20 cm layer soil were as follows: pH, 8.36; total water soluble salt content, 4.87 g·kg−1; organic matter, 13.4 g·kg−1; total nitrogen, 0.705 g·kg−1; available nitrogen, 43 mg·kg−1; available phosphorus, 9.8 mg·kg−1.

2.3. Experimental Design

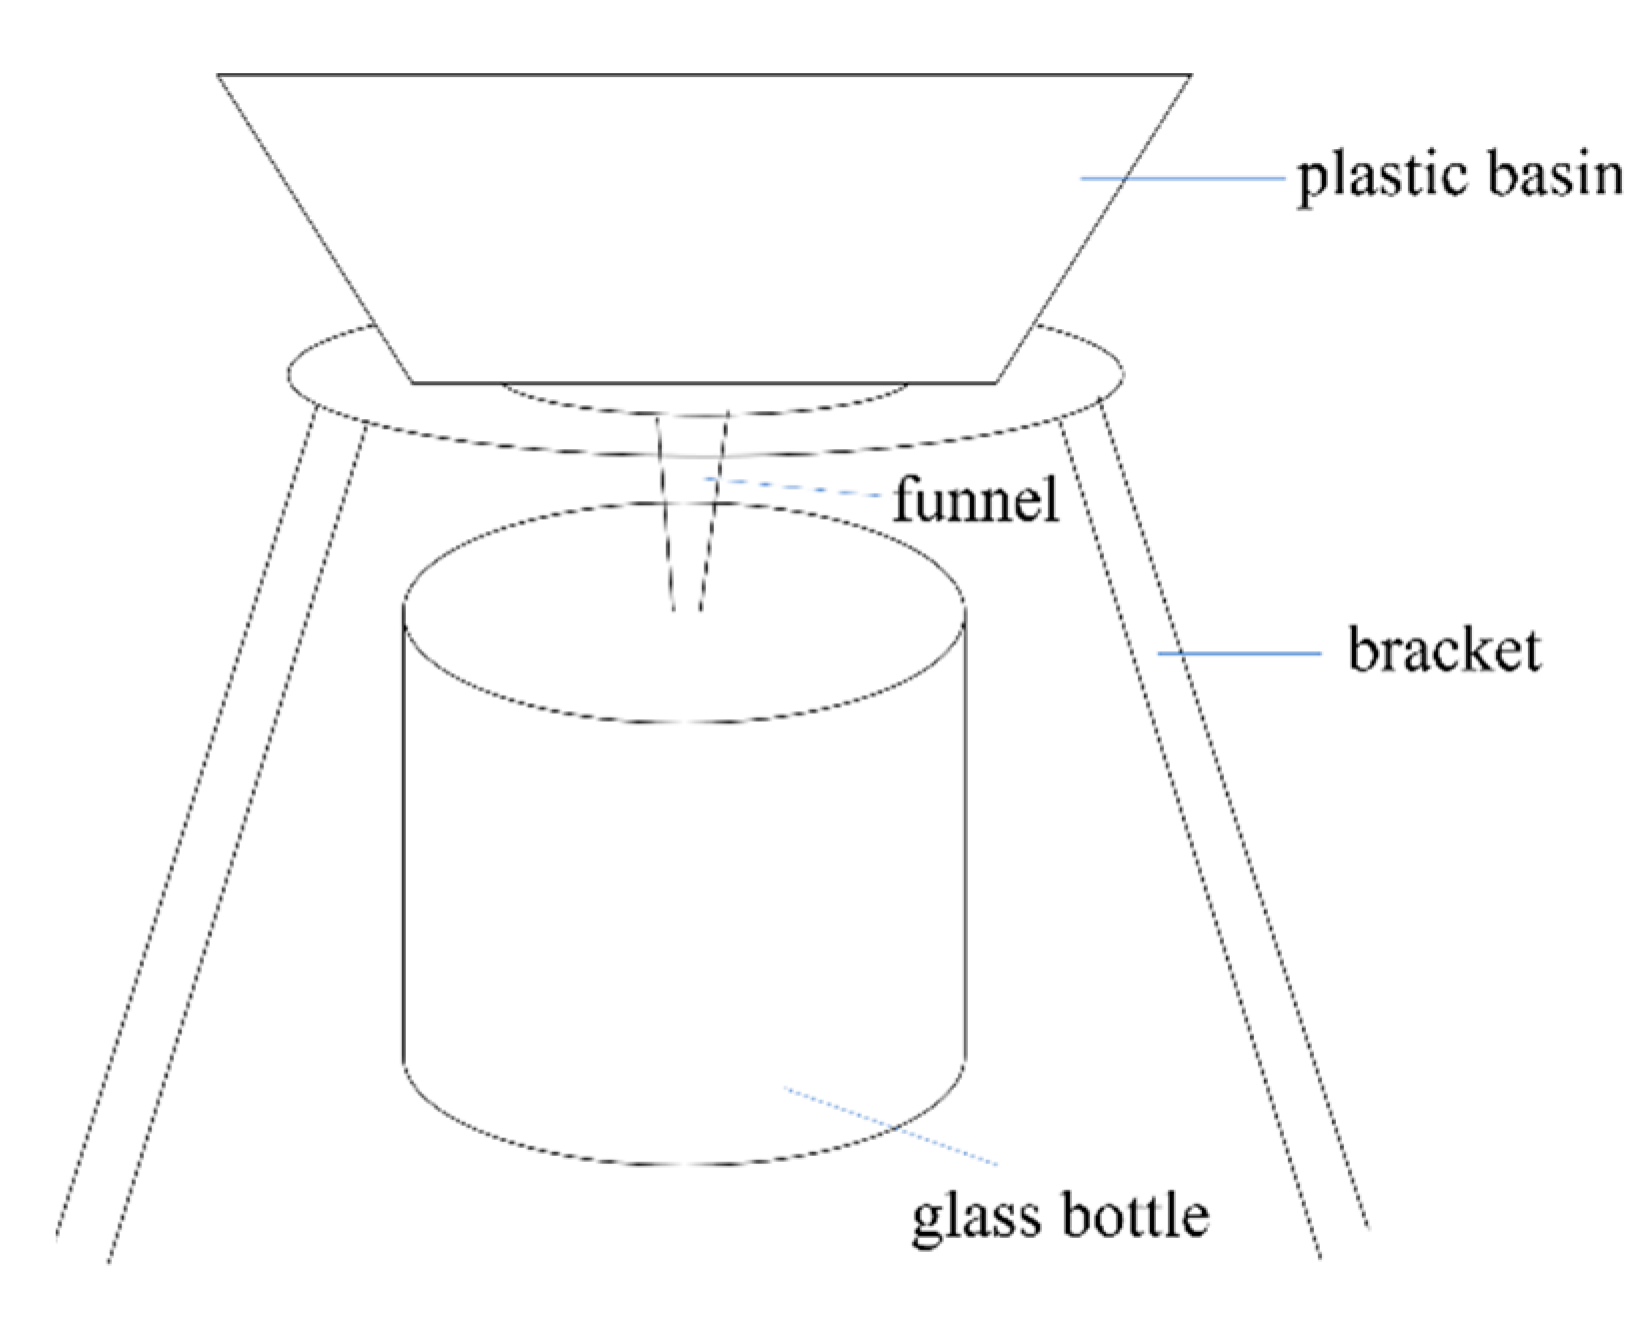
2.3.1. Experiment 1. Leaching and Desalination Experiment of E. frumentacea

The saline–alkali soil improvement experiment was carried out at the experimental base in Xidatan Qianjin Farm, Pingluo County, Ningxia Autonomous Region. The two-factor random block arrangement design was conducted in a shelter. The soil type was labeled as A with two subcategories, i.e., A1 representing saline soil and A2 representing alkaline soil, while the forage species was labeled as B with six subcategories, i.e., B1—bare land; B2—E. frumentacea; B3—barnyard grass; B4—oat; B5—S. europaea; B6-alfalfa. Each treatment was repeated thrice, with 36 treatments in total.
The leaching experimental device is shown in Figure 1, and the main section includes a plastic basin, a bracket and a glass bottle to receive the leaching solution. The outer diameter of the plastic basin is 44 cm, the inner diameter is 38 cm and there are three holes in the basin bottom. A 300-mesh nylon filter screen was fixed at the bottom of the plastic basin, and a 300-mesh nylon filter screen was also fixed in the funnel (upper diameter 18.5 cm and lower diameter 2.5 cm). The funnel, which was installed on a bracket, was inserted into a 5 L glass bottle with a rubber stopper. The whole device was well sealed. For the leaching experiment, each plastic basin was filled with 25 kg of fully mixed soil. Seeds were sown in holes, with a sowing depth of 2 cm for E. frumentacea, barnyard grass, oat and S. europaea and 4 cm for alfalfa. There were 50 sowing holes for E. frumentacea, barnyard grass and oat in each plastic basin, with 3 seeds sown in each hole. After emergence, seedling numbers were thinned to 45 per basin. There were 30 seeding holes for S. europaea per basin, with 3 seeds per hole, and 25 seedlings were left per basin after emergence. Alfalfa sowing rate was 25 holes per pot, 3 seeds per hole and 20 seedlings were left per basin after emergence. Management measurements, such as watering, leaching and weeding, were consistent for each treatment throughout the whole growth period.

2.3.2. Experiment 2. The Experiment for Improving Saline–Alkali Land by Planting E. frumentacea Coupled with Soil Conditioners

The field experiment was conducted from May to September 2022. The single-factor randomized block design was adopted, and seven treatments were set up. The plot area was 24 m2 (length × width: 4 m × 6 m, respectively), the row spacing was 20 cm and the sowing rate was 37.5 kg·ha−1. Before sowing, the mixed modifiers were applied to each plot, and the modifiers consisted of phosphogypsum, superphosphate and decomposed sheep dung. The specific treatments were as follows:
  • CK: Bare land, control;
  • Treatment A: No soil modifier;
  • Treatment B: Phosphogypsum (22.5 t·ha−1) + decomposed sheep dung (15 t·ha−1);
  • Treatment C: Superphosphate (300 kg·ha−1) + decomposed sheep dung (15 t·ha−1);
  • Treatment D: Phosphogypsum (22.5 t·ha−1) + superphosphate (300 kg·ha−1) + decomposed sheep dung (15 t·ha−1);
  • Treatment E: Phosphogypsum (30 t·ha−1) + superphosphate (600 kg·ha−1) + decomposed sheep dung (30 t·ha−1);
  • Treatment F: Phosphogypsum (30 t·ha−1) + superphosphate (900 kg·ha−1) + decomposed sheep dung (30 t·ha−1).
In total, 450 mm water was applied by flood irrigation in May, June and July. Weeds in the plots of each treatment were eliminated manually.

2.3.3. Experiment 3. Effects of Intercropping of E. frumentacea with Leguminous Forages on Productivity and Bacterial Diversity

Field experiments were conducted in April to August in 2021 and 2022, with a randomized block design. There were five treatments, namely, E. frumentacea monoculture, semi-wild soybean monoculture, fodder soybean monoculture, E. frumentacea intercropped with semi-wild soybeans (TES) and E. frumentacea intercropped with fodder soybeans (TEF). Each treatment was repeated thrice, and there were 15 experimental plots, with an area of 24 m2 (length × width: 4 m × 6 m, respectively), and a 1 m wide isolation belt between the different experimental plots.
The sowing rates of E. frumentacea (EE), semi-wild soybeans (SS) and fodder soybeans (FF) were 15 kg·ha−1, 30 kg·ha−1 and 60 kg·ha−1, respectively. The sowing rates of E. frumentacea (ES, EF), semi-wild soybeans (SE) and fodder soybeans (FE) in intercropping treatments were 9 kg·ha−1, 19.5 kg·ha−1 and 36 kg·ha−1, respectively. The row spacing was 40 cm for monoculture treatments. The row ratio was 2:2 (2 rows of E. frumentacea intercropped with 2 rows of semi-wild soybean) for intercropping treatments, the row spacing of E. frumentacea was 30 cm, the row spacing of leguminous forage was 30 cm, while the row spacing was 50 cm between E. frumentacea and the leguminous forage. Management measures were consistent throughout the growth period.

2.4. Measurements

2.4.1. Soil Sample Collection and Processing

Experiment 1. On 15 August 2020 the soil was poured out of the pots. After mixing the soil in each pot evenly, the soil samples were collected in self-sealed bags, which were placed in sampling boxes with ice cubes and brought to the laboratory for refrigeration.
Experiment 2. On 12 September 2022, at the mature stage of E. frumentacea, soil samples of the 0–20 cm soil layer were collected using the five-point sampling method, and the obtained samples were freed from roots, stones and other impurities. After air drying, the samples were screened using a 1 mm sieve to determine soil chemical properties.
Experiment 3. Rhizosphere soil was collected on 19 August 2021 and 20 August 2022. Six plants were randomly selected for each treatment. The soil attached to the rhizosphere was evenly mixed with a disinfected soft brush and placed into a sterile sampling bag, which was put on ice and quickly brought back to the laboratory. One part was packaged in a sterile centrifuge tube and stored in an ultra-low temperature refrigerator at −80 °C for later use, and the remainder was used to detect soil nutrients after air drying.

2.4.2. Determination of Soil Chemical Properties

Soil pH was measured by a pH meter. The total water soluble salt content (TS) of 1:5 (soil/water) water solution was measured with a conductivity meter (Multiparameter SevenCompact™, Mettler Toledo, Shanghai, China). Referring to LY-T1249-1999 for the determination and calculation method of soil alkalinity, alkalinity = (exchangeable sodium/cation exchange capacity) × 100%. Soil organic matter, total N, available N, available P and available K were separately measured by the potassium dichromate outer Heaton oxidation method, the micro-Kjeldahl alkaline solution diffusion method, the sodium bicarbonate extraction spectrophotometer method and the ammonium acetate flame photometer method, respectively [21]. Soil salt ions Na+ and K+ were measured by an FP640 flame photometer; Ca2+, Mg2+ and SO42− were measured by EDTA titration; and Cl was measured by silver nitrate standard solution titration [22].

2.4.3. High-Throughput Sequencing of Soil Bacteria

A soil DNA kit (QIAGEN, Hilden, Germany) was used to extract soil bacterial DNA, according to the manufacturer’s instructions. The PCR amplification primer of 16S rDNA was 338F (″-ACTCCTACGGGAGGCAGCAG-″) and 806R (″-GGACTACHVGGGTWTCTAAT-″). The concentration and purity of DNA were measured by NanoDrop2000. DNA integrity was determined by means of agarose gel electrophoresis with a concentration of 1%, voltage of 5 V/cm and time of 20 min. A 20 μL reaction system was adopted in the formal PCR experiment using the TransGen AP221-02. The PCR instrument was the abi gene amp 9700. PCR reaction parameters were as follows: (a) 1× (3 min at 95 °C); (b) cycle number × (30 s at 95 °C; 30 s at annealing temperature (°C); 45 s at 72 °C); (c) 10 min at 72 °C; and at 10 °C until halted by user. The identification of the gel map by PCR amplification results were as follows: the 2% agarose gel electrophoresis was used to detect PCR products, and the 3 μL sample was used to detect the gel map.
Sequencing was carried out by using the Miseq PE300 platform of the Illumina Company (Shanghai Majorbio Bio-pharm Technology Co., Ltd., Shanghai, China). The paired reads were merged into a sequence, and the quality of reads and the effects of the merging process were filtered during the quality control procedure. According to the barcode and primer sequences at the beginning and end of the sequence, the samples were distinguished in order to obtain an effective sequence. Flash (V1.2.11) software was used for sequence denoising. The RDP classifier Bayesian algorithm was used to classify and analyze the OTU representative sequences with similar levels at ninety-seven percent. Through comparison with the RDP (16S rdp11.5/16s_bacteria) database, species annotation information was obtained.

2.4.4. Determination Method of Plant Yields

In experiment 3, the harvest time of the forage was 19 August 2021 and 20 August 2022. The fresh grass yield of three representative 1 m segments in each experimental plot was determined after cutting. After taking 200–500 g of fresh samples back to the laboratory, the samples were dried at 105 °C for 30 min and then dried at 65 °C for 48 h until they reached a constant weight. The hay yield per unit area was based on the ratio of dry to fresh weight. The yield measurement method used in experiment 2 was the same as in experiment 3.

2.4.5. Evaluation Index of Land Use Efficiency

The land equivalent ratio (LER), actual yield loss index (AYL) and competition ratio (CR) can be used to evaluate land use efficiency under intercropping. The calculation formulas of LER, AYL and CR are as follows [23]:
  • LER: This index used to measure yield advantages, which can reflect the land use efficiency of intercropping.
LER = LERE + LERL = YEL/YEE + YLE/YLL
In this formula, YEL and YLE represent the yields of E. frumentacea and leguminous forages in intercropping, respectively, YEE and YLL represent the yields of E. frumentacea and leguminous forages in monoculture, respectively. When LER > 1, the intercropping advantage is extant; when LER < 1, the intercropping disadvantage is extant.
2.
AYL: Compared with monoculture, the relative yield of intercropping under a certain planting ratio is lost or increased. AYL > 0, which means that the processing shows a gain compared with single processing; AYL < 0, indicating that the treatment shows a loss compared with single treatment. The positive and negative of AYLE and AYLL indicate the contribution of E. frumentacea or leguminous forages to gains or losses in the system.
AYL = AYLE + AYLL
AYLE = (YEL/ZEL)/(YEE/PEE) − 1
AYLL = (YLE/ZLE)/(YLL/PLL) − 1
YEL and YLE represent the yields of intercropping E. frumentacea and intercropping leguminous forages, respectively, and ZEL and ZLE represent the planting ratio of intercropping E. frumentacea and intercropping leguminous forages, respectively. PEE and PLL, respectively, represent the ratio of monocropping E. frumentacea and leguminous forages (both are 1), and YEE and YLL, respectively, represent the yields of monocropping E. frumentacea and leguminous forages.
3.
CR is an index used to evaluate the competition among species. When CR > 1, it indicates that the competitiveness of intercropping crops is greater than that of companion crops.
CR = (LERE/LERL) × (ZEL/ZLE)
CR represents the competition ratio between E. frumentacea and leguminous forages. When CR > 1, the competition ability of E. frumentacea in intercropping system is stronger than that of leguminous forages.

2.5. Statistical Analysis

Origin 2021 was used to create the output column chart; mothur (version v.1.30.2) software was used to calculate the Shannon diversity index (Shannon), Simpson diversity index (Simpson) and richness index (Chao1, ACE); and R language software (version 3.3.1) was used to create the column chart of species community (bar chart).

3. Results

3.1. Effects of Planting Different Forage Species on Soil Ions under Saline–Alkali Stress

As shown in Table 1, compared with the bare lands, the contents of Na+, K+, Ca2+, Cl, SO42−, CO32− and HCO3 in the soil after the growth of E. frumentacea in alkaline soil decreased by 35.90%, −75.07%, 38.89, 14.89%, 44.83%, 22.22% and 29.17% (p < 0.05), respectively. The content of Na+ in the soil after the growth of E. frumentacea was lower than that after the growth of barnyard grass, oat, S. europaea and alfalfa by 10.71%, 25.37%, 28.57% and 26.47% (p < 0.05), respectively. The content of SO42− in the treatment of planting E. frumentacea was lower than that after planting oat, S. europaea and alfalfa by 15.79%, 38.46% and 23.81% (p < 0.05). CO32− content in the soil was higher in the treatment of planting E. frumentacea than that of planting alfalfa and S. europaea (p < 0.05). HCO3 content in the soil for the treatment of planting E. frumentacea was higher than that of planting barnyard grass, S. europaea and alfalfa by 6.25%, 13.33% and 30.77% (p < 0.05), respectively.
Compared with the bare land, the contents of Na+, K+, Cl, SO42−, CO32− and HCO3 in the soil planted with E. frumentacea decreased by 53.64%, 28.89%, 11.90%, 21.67%, 9.52% and 26.55% (p < 0.05). The content of Na+ in soil planted with E. frumentacea was 4.11%, 19.54% and 33.33% lower than that planted with barnyard grass, S. europaea and alfalfa (p < 0.05), respectively. The content of Cl in the soil planted with E. frumentacea was 7.42% and 6.69% lower than that of the soil planted with S. europaea and alfalfa (p < 0.05), respectively. The content of SO42− was lower in soil planted with E. frumentacea than that planted with barnyard grass, oat, S. europaea and alfalfa by 13.76%, 14.55%, 17.54% and 10.48% (p < 0.05), respectively.

3.2. Effects of Planting E. frumentacea on the Soil pH, Total Water Soluble Salt Content and Soil Nutrients

As shown in Table 2, compared with bare land (CK), the soil pH and total water soluble salt content of treatment A decreased by 1.59% and 20.18%, respectively, after the planting of E. frumentacea (p < 0.05). The soil pH in the treatments B, C, D, E and F decreased by 3.57%, 8.53%, 9.42%, 12.30% and 15.48%, respectively, and total salt content decreased by 45.74%, 27.35%, 35.13%, 58.74% and 50.82%, respectively (p < 0.07). The highest decrease in soil pH was 15.48% in treatment F, and the highest decrease in total salt content was 58.74% in treatment E.
Compared with CK, the organic matter in the soil under treatments B, C, D, E and F increased significantly (p < 0.05) by 46.04%, 33.27%, 37.53%, 54.77% and 67.55%, respectively (Table 2). Compared with CK, the available N in the soil under treatments B, D, E and F increased significantly (p < 0.05) by 48.57%, 58.21%, 16.43% and 12.86%, respectively. Compared with CK, the available P in soil under treatments B, C, D, E and F increased significantly (p < 0.05) by 268.61%, 128.25%, 600.00%, 755.16% and 657.85%, respectively. Compared with CK, the available K in soil under treatments A–F increased significantly (p < 0.05) by 8.88%, 53.50%, 25.43%, 56.09%, 82.54% and 71.19%, respectively.

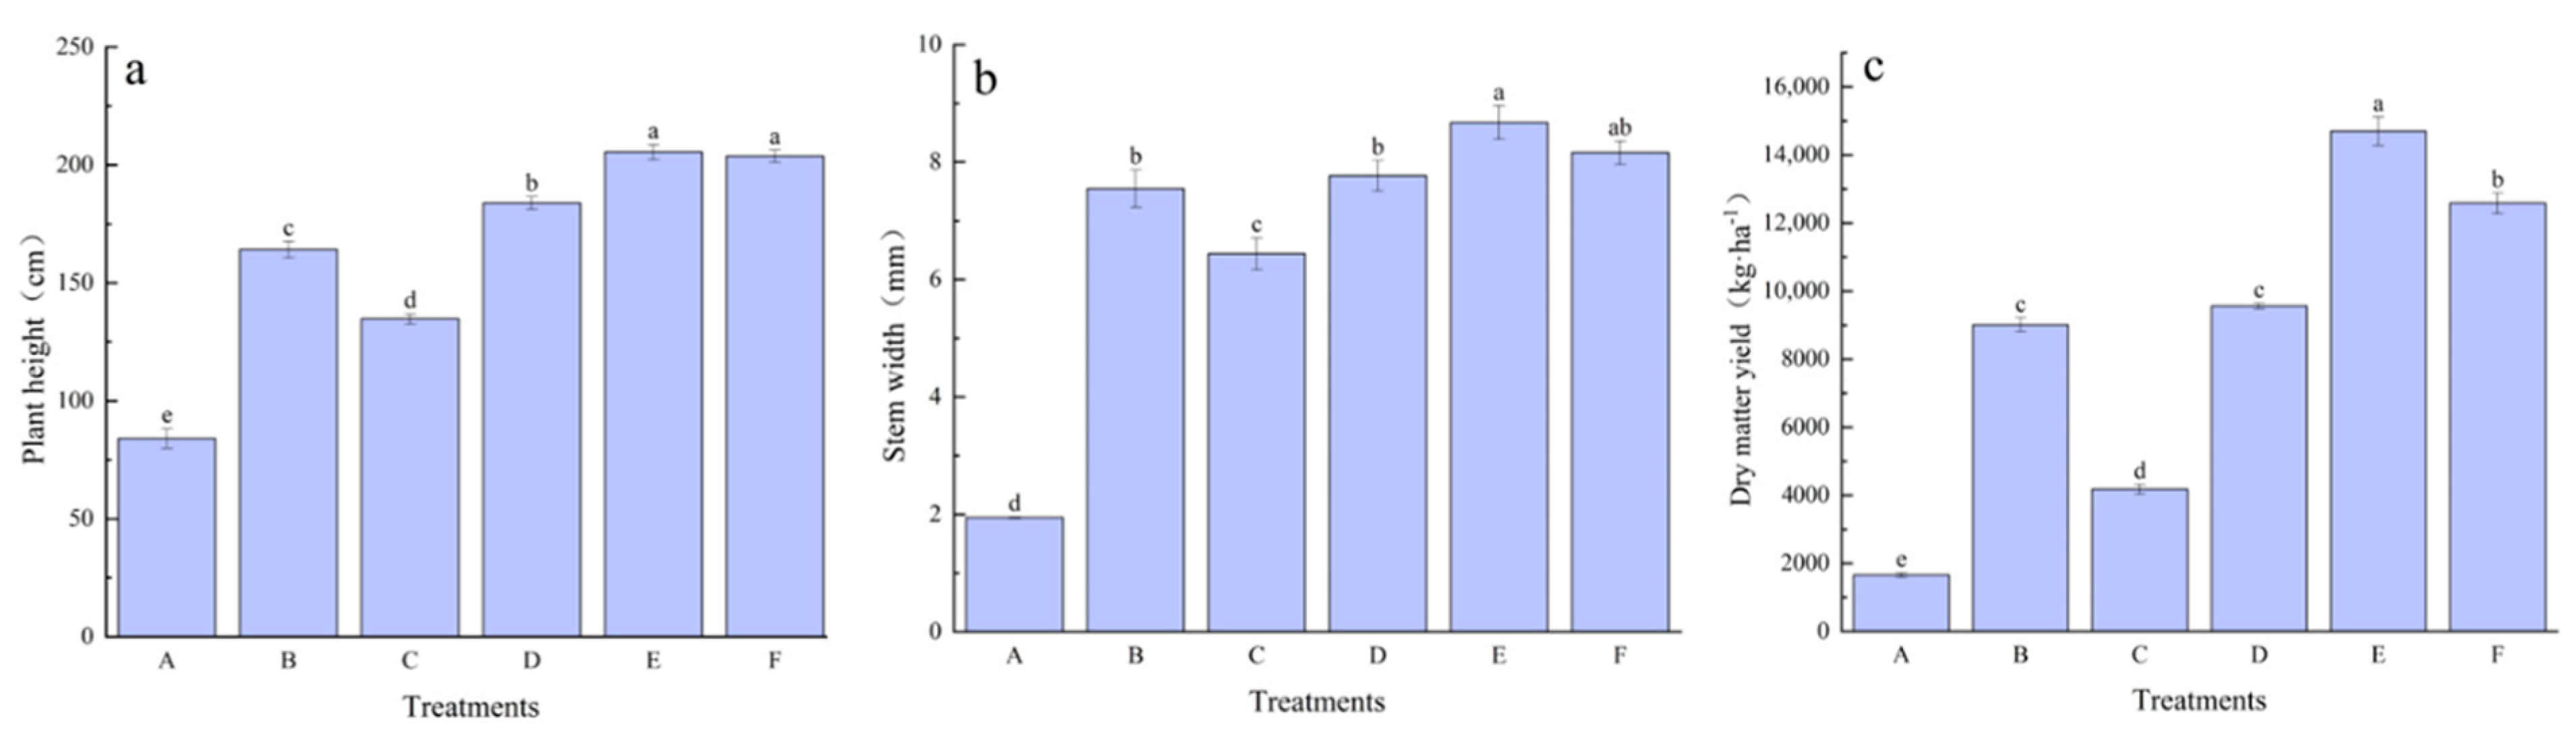
3.3. Effects of Modifiers on Growth and Yields of E. frumentacea

As shown in Figure 2, the plant height, stem diameter and yields of E. frumentacea after applying different proportions of soil improvers were significantly higher than those of treatment A (p < 0.05). Compared with treatment A without the improver, the plant height of E. frumentacea under the treatments that applied improver increased by 95.24%, 60.27%, 118.72%, 144.41% and 142.35%, respectively; the stem width increased by 287.81%, 230.94%, 299.11%, 345.70% and 319%, respectively; and the hay yield increased by 443.76%, 152.32%, 476.94%, 787.16% and 659.55%, respectively. The ranking of yields in different treatments was E > F > D > C > B > A. The highest values of plant height and stem diameter were found under treatment E among the four treatments, followed by treatments F and D.

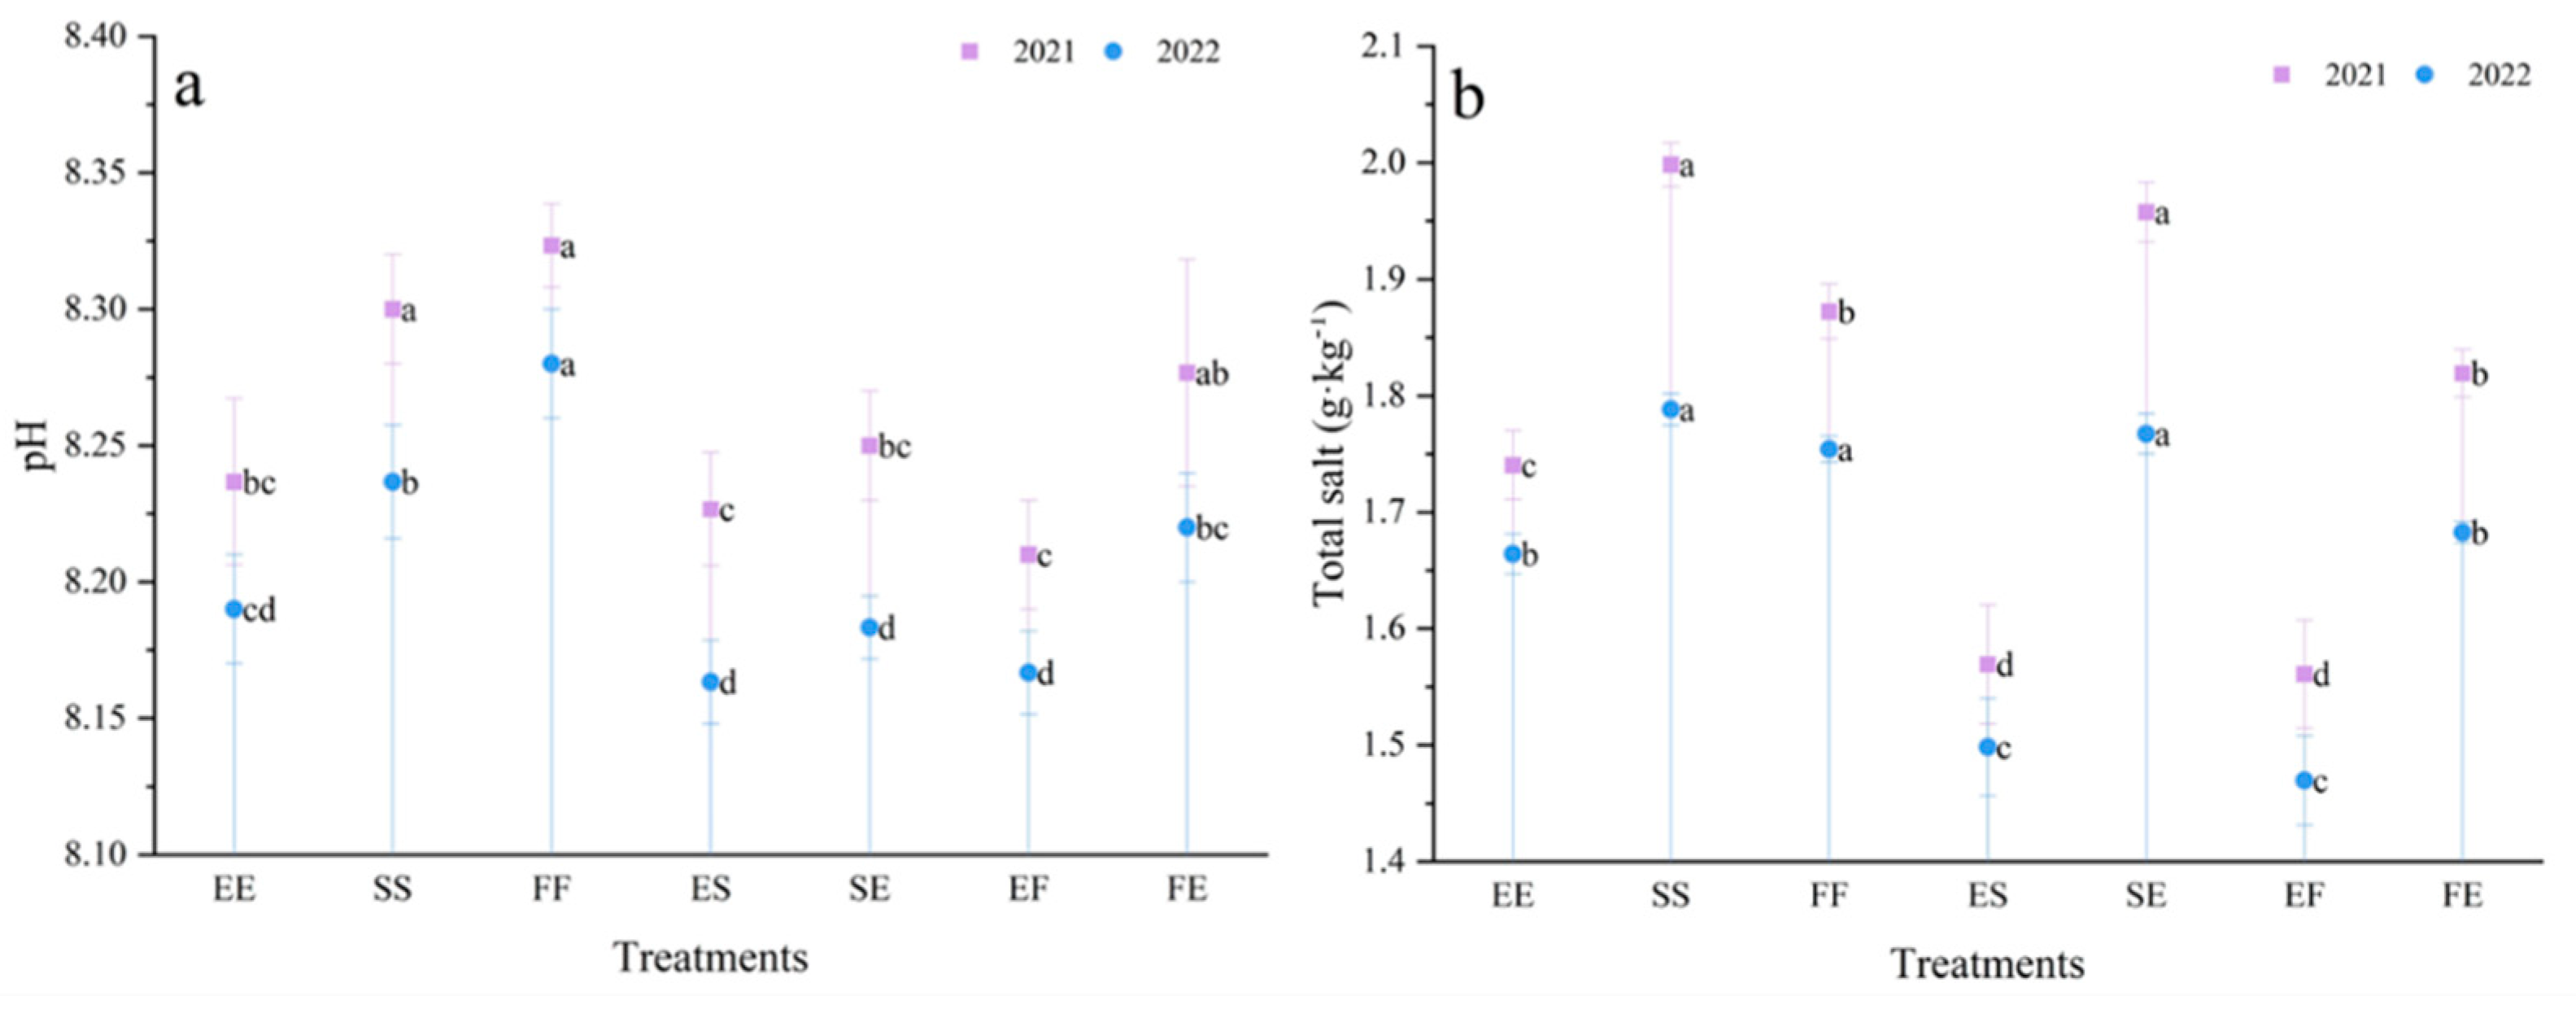
3.4. Effects of Different Planting Patterns on Soil pH and Total Salt

It can be seen from Figure 3 that the intercropping of E. frumentacea and legume forage affects the pH and total salt content of the rhizosphere soil. Compared with monocropped E. frumentacea, the total salt content of E. frumentacea rhizosphere soil intercropped with semi-wild soybeans decreased by 9.77% and 9.64% (p < 0.05) in 2021 and 2022, and the E. frumentacea intercropped with fodder soybeans decreased by 10.34% and 11.45% (p < 0.05). Intercropping reduced the pH of the rhizosphere soil of semi-wild soybean in 2021 and 2022 (p < 0.05). Intercropping reduced the pH of the rhizosphere soil of fodder soybean in 2022 (p < 0.05), and total salt content decreased 4.00% (p < 0.05) in 2022.

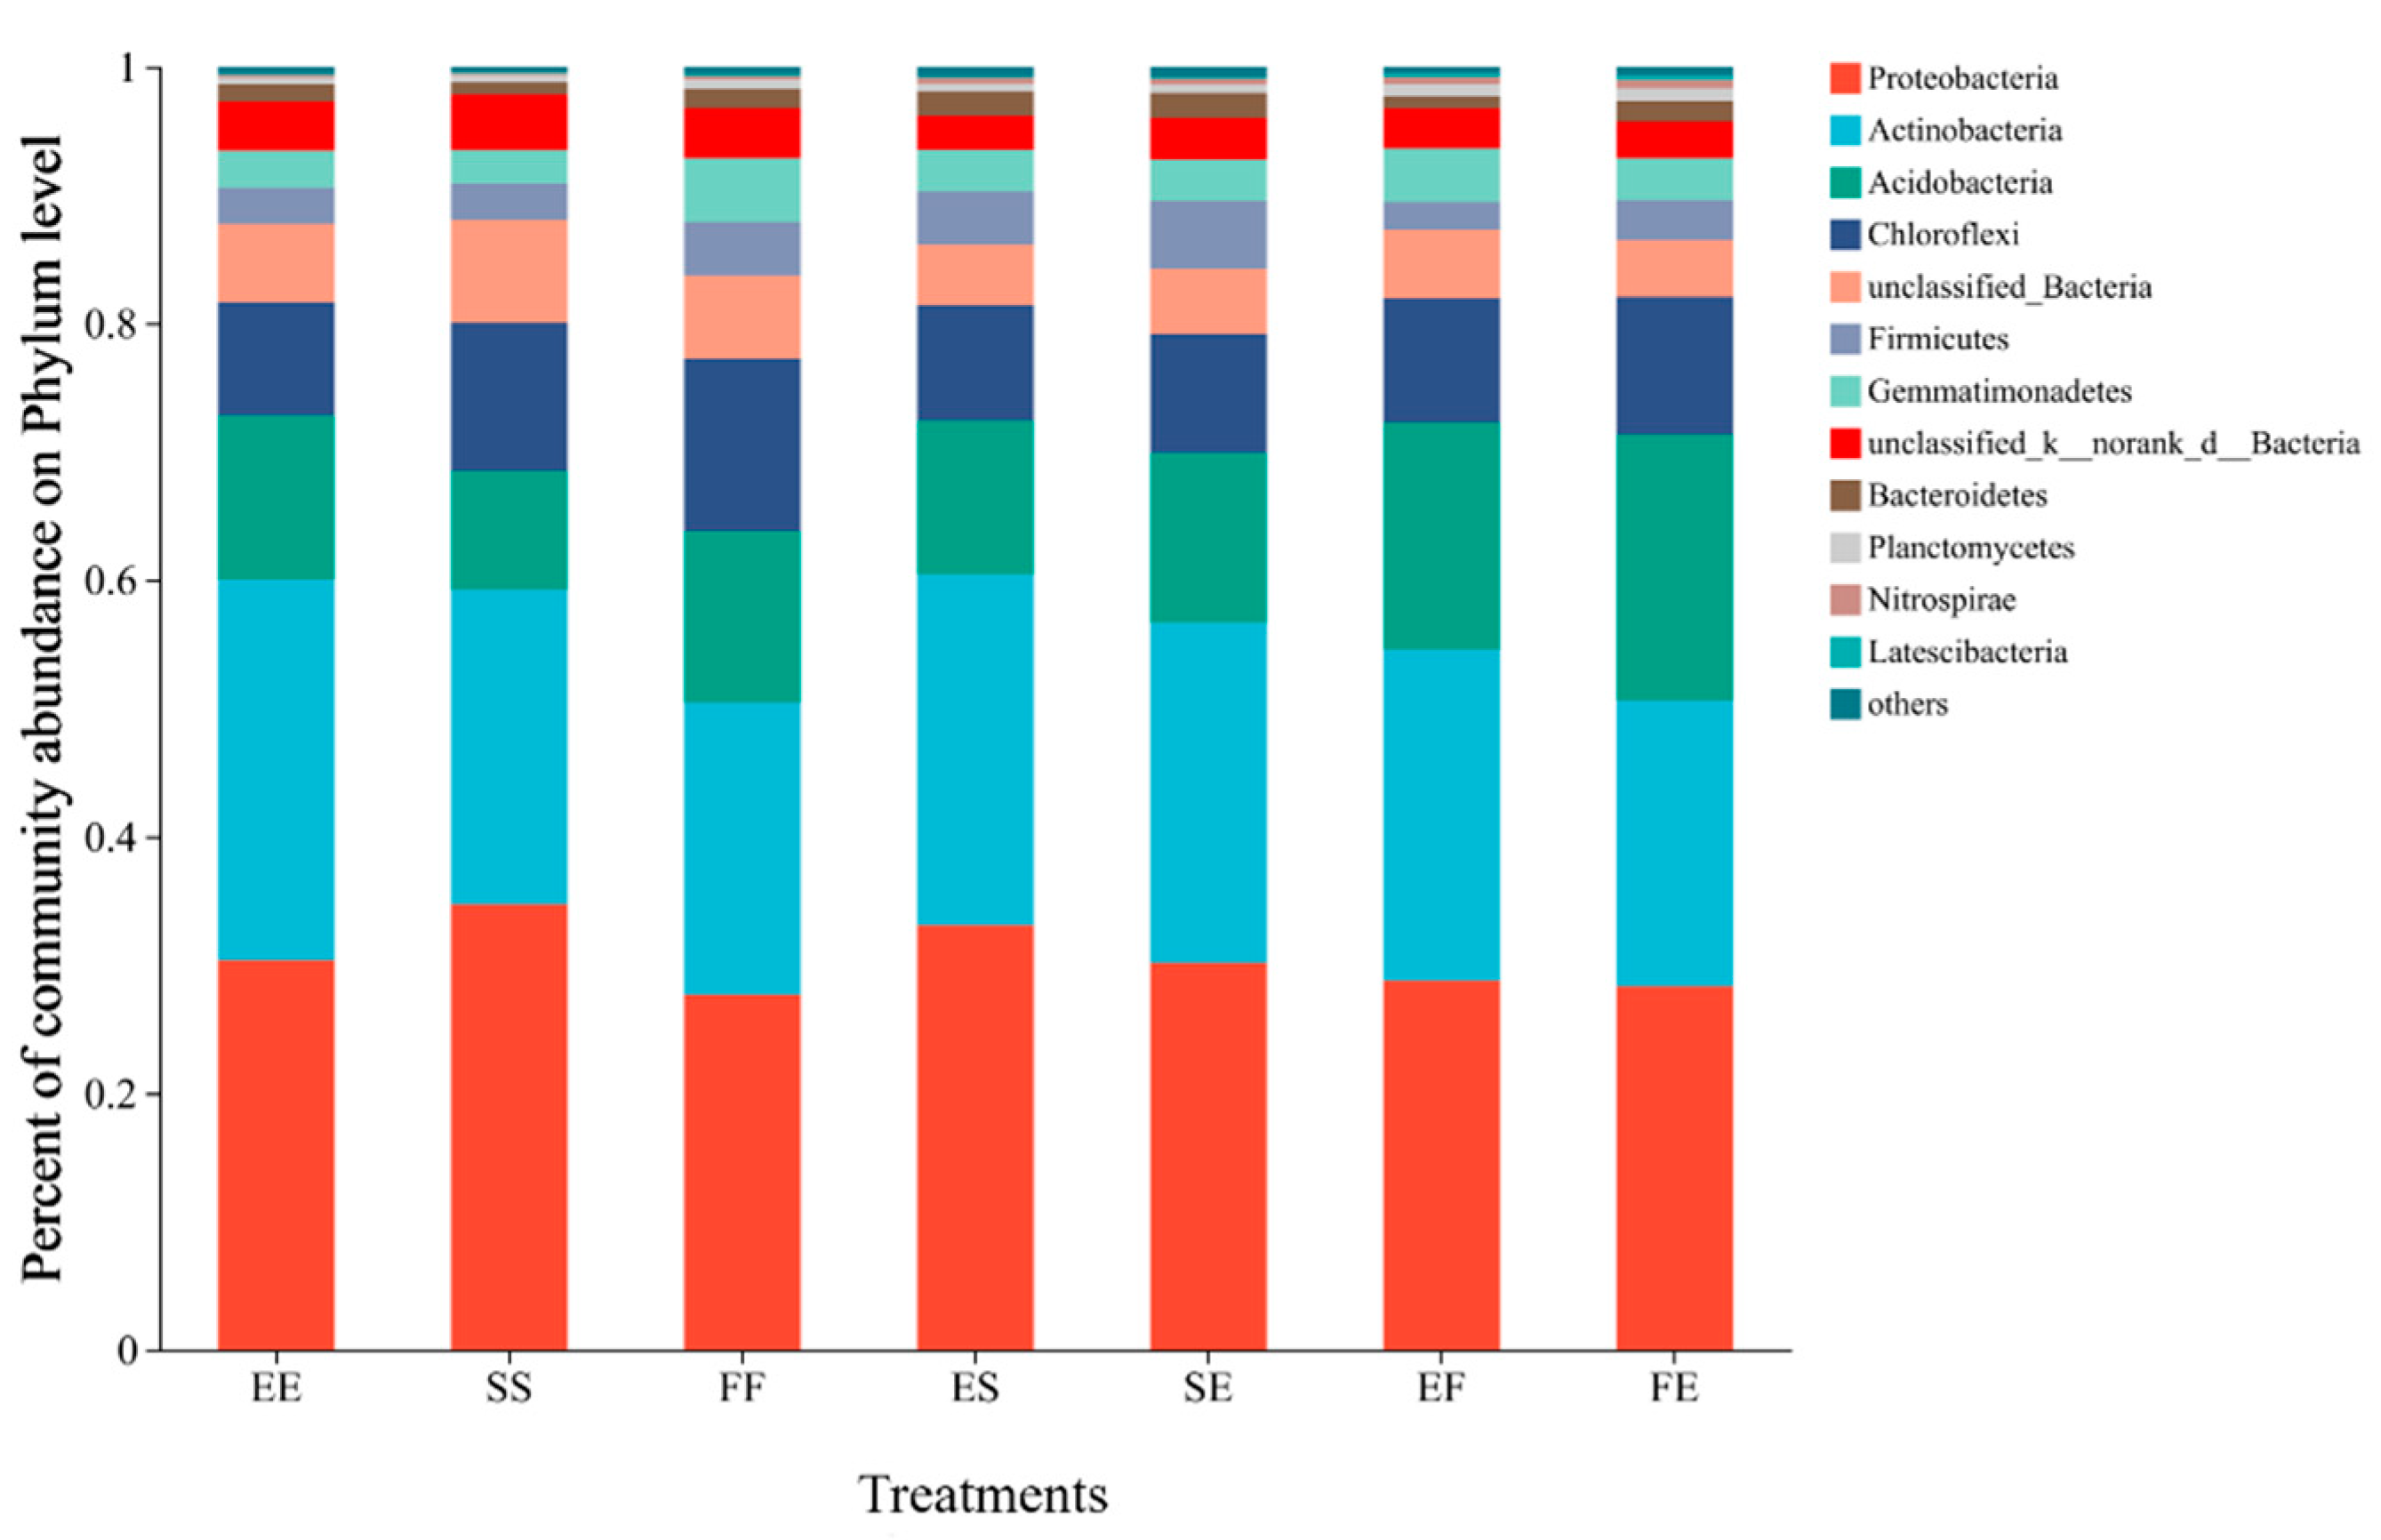
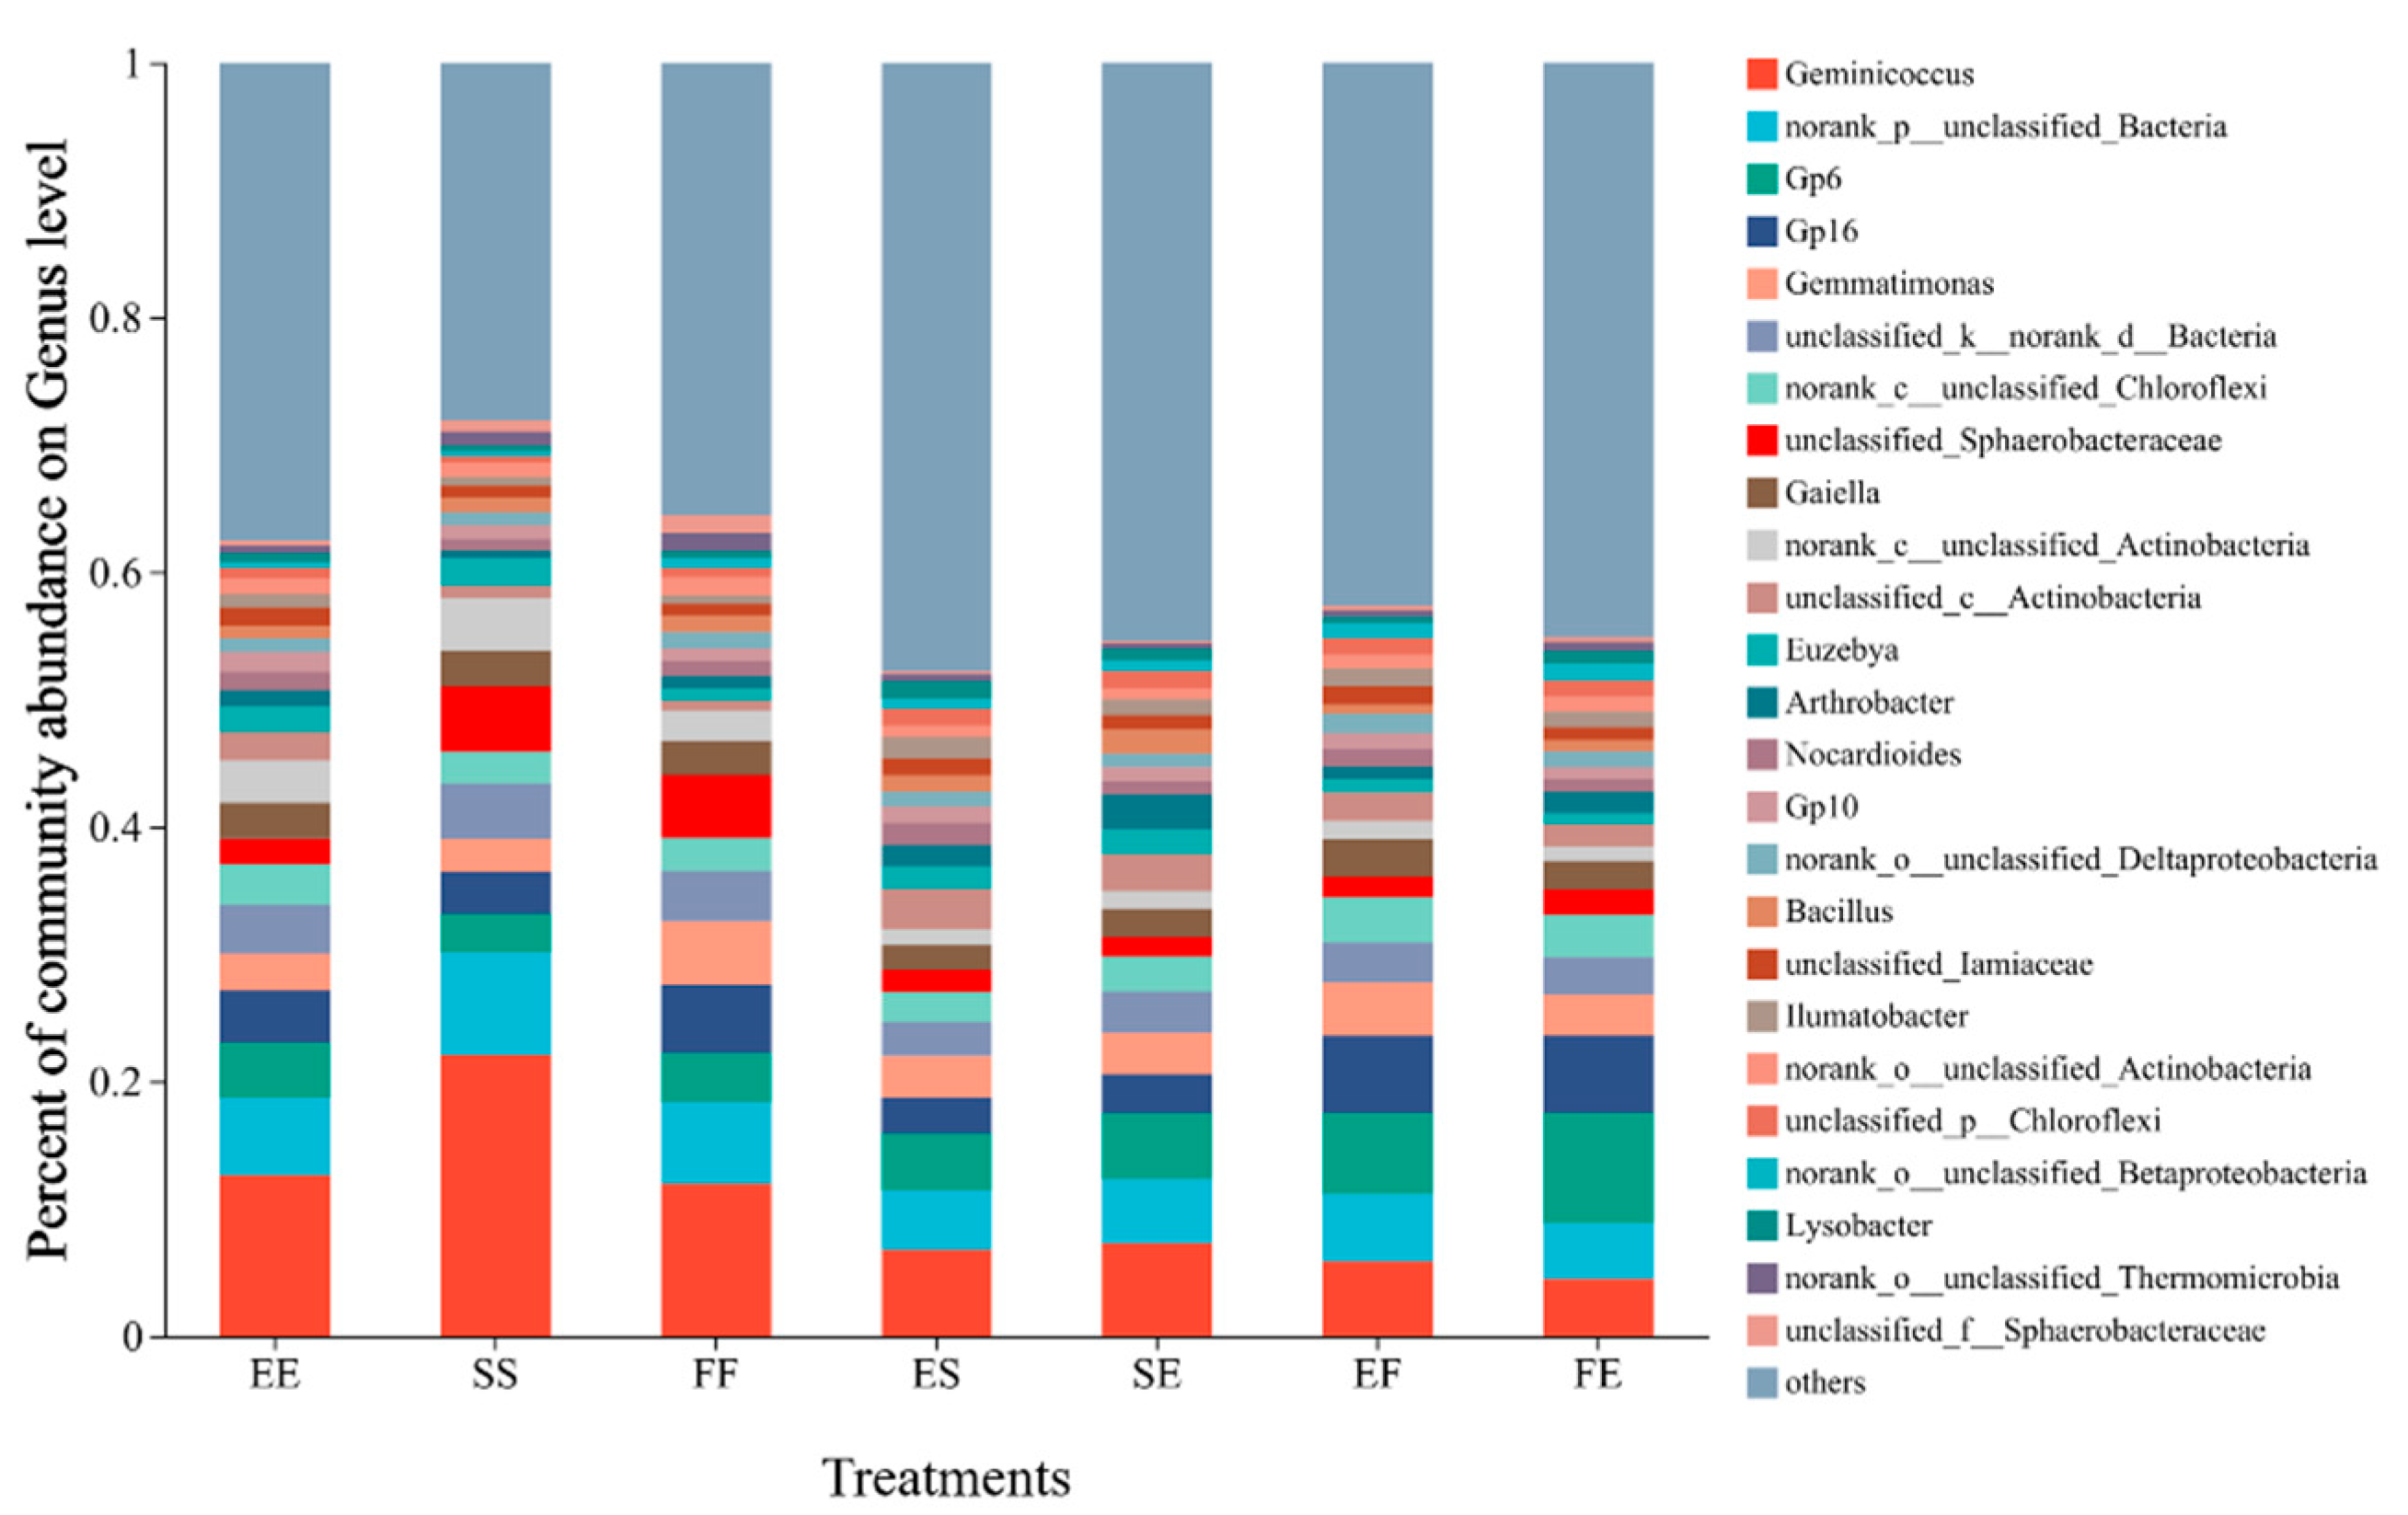
3.5. Effects of Different Planting Patterns on Bacterial Diversity and Community Structure in Rhizosphere Soil

According to Table 3, the Shannon index of the rhizosphere soil bacteria for E. frumentacea intercropped with semi-wild soybeans increased by 5.48% (p < 0.05). The Shannon index of the rhizosphere soil bacteria in E. frumentacea intercropped with fodder soybeans increased by 5.59% (p < 0.05). Intercropping treatment increased the Shannon index by 11.46% and significantly decreased the Simpson index by 50% for semi-wild soybean rhizosphere soil bacteria (p < 0.05), respectively. Intercropping increased the Shannon index (p < 0.05) of the rhizosphere soil bacteria of fodder soybeans by 4.34%. Intercropping increased the Chao1 index and the ACE index of the rhizosphere soil bacteria of E. frumentacea, semi-wild soybeans and fodder soybeans (p < 0.05), which increased by 37.96% and 37.91% for E. frumentacea intercropped with semi-wild soybeans and increased by 32.71% and 31.80% for E. frumentacea intercropped with fodder soybeans; increased by 54.51% and 52.16%, respectively, for semi-wild soybean; and increased by 24.88% and 23.07% for fodder soybeans, respectively.
It can be seen from Figure 4, that under the two intercropping modes, the bacterial groups in the rhizosphere soil of plants can be mainly classified into ten phyla, of which four species, namely, Proteobacteria Proteobacteria, Acidobacteria Actinomycetes, Acidobacteriaceae and Chloroflexi Chlorophylla, constitute the majority, whose total abundance accounted for 77.24–82.05%. Intercropping with semi-wild soybeans increased the abundance of Nitrospirae in the rhizosphere soil of E. frumentacea (p < 0.05). Intercropping with fodder soybeans increased the abundance of bacteria (p < 0.05), namely, Gemmatimonadetes, Planctomycetes, Nitrospirae and Latescibacteria, in the rhizosphere soil for E. frumentacea. Intercropping increased the abundance level of the rhizosphere soil bacteria Acidobacteria, Firmicutes and Nitrospirae in semi-wild soybeans (p < 0.05). Intercropping increased the abundance level of the rhizosphere soil bacteria Acidobacteria, Nitrospirae and Latescibacteria (p < 0.05) and decreased the abundance level of Chloroflexi (p < 0.05).
As shown in Figure 5, the abundance of bacteria Ilumatobacter and Skermanella was increased significantly (p < 0.05), while the abundance of Geminicoccus and Gaiella was decreased (p < 0.05) in the rhizosphere soil of E. frumentacea intercropped with semi-wild soybeans. Intercropping with fodder soybeans increased the abundance of Gemini cocci and Skermanella in the rhizosphere soil for E. frumentacea (p < 0.05) but decreased the abundance of Gemini cocci and Euzebya (p < 0.05). Intercropping increased the abundance of Gp6, Ilumatobacter, Lysobacter, Marmoricola, Streptomyces and Skermanella in the semi-wild soybean rhizosphere soil (p < 0.05). Intercropping increased the abundance of Gp6, Ilumatobacter, Lysobacter, Marmoricola, Streptomyces and Skermanella (p < 0.05) but decreased the abundance of Geminicoccus (p < 0.05) in the rhizosphere soil of fodder soybeans.

3.6. Effects of Different Planting Patterns on Hay Yields

As shown in Table 4, there was a significant difference in the hay yields between different cropping patterns as well as between the two different years: the ranking of the productivity among the three grasses was E. frumentacea > fodder soybean > semi-wild soybean. There was a significant interaction in hay yields between the year and cropping pattern. The hay yields of the three grasses under intercropping conditions were lower than those under the corresponding monoculture treatments (p < 0.05). The hay yields of E. frumentacea in intercropping mode accounted for more than 65% of the total hay yields, indicating the prominent contribution of E. frumentacea to the total hay yields in the intercropping system. For the two intercropping patterns, the total hay yields of E. frumentacea intercropped with fodder soybeans were higher than that of E. frumentacea intercropped with semi-wild soybeans.

3.7. Effects of Different Intercropping Modes on Land Use Efficiency

The land equivalent ratio (LER) > 1 in different intercropping modes can be seen in Table 5. The LER value in the intercropping mode of E. frumentacea intercropped with fodder soybeans was higher than that of E. frumentacea intercropped with semi-wild soybeans. AYL was greater than 0 in both intercropping modes, and the intercropping system showed a higher increment than in single cropping. The intercropping system of E. frumentacea intercropped with fodder soybeans displayed the best intercropping effect among the different modes, according to the changing trend of LER. In the two intercropping patterns, CR was greater than 1, and the competitiveness of E. frumentacea was greater than that of fodder soybeans and semi-wild soybeans.

4. Discussion

4.1. Changes in Soil Salt Ions and Chemical Properties after Planting E. frumentacea on Saline–Alkali Land

Plants can improve saline–alkali land by removing salt by cutting [24,25], improving soil aeration and water permeability, reducing soil density and increasing soil porosity through the growth of roots, which promote the downward leaching of salt, owing to the penetration and expansion of plant roots [26]. Peng et al. (2016) believed that the dual action of plant roots and downward water movement enables soil salt to move downward along with roots, which reduces the salt ion contents in soil [27]. In this study, after planting E. frumentacea in saline and alkali soil, soil ion contents were decreased compared with bare lands. Qadir et al. (2003a) also reported that halophytes were able to improve soil physical and chemical properties and further increased the leaching of Na+ and soluble salts in saline–alkali soil [28]. Na+ and SO42− contents in soil for E. frumentacea planted in alkaline soil and saline soil were lower than those for other grasses. These results demonstrate that planting E. frumentacea enhances the downward movement of harmful ions of saline–alkaline soil. Presumably, the better leaching effect on soil ions of E. frumentacea than other grasses may be due to its root penetration that leads to an increase in soil porosity, as well as improving the filtration performance of salinized soil and a drainage effect on the soil—this drainage helps reduce the soil ion contents.
Xie et al., (2017) reported that planting salt-tolerant plants on saline–alkali land improved soil physical and chemical properties, which is beneficial to the development of soil [29]. Xia et al., (2019) showed the effect on reducing salt contents by planting salt-tolerant forage grasses, mainly due to the absorption of salts in the soil layer by forages and the inhibition of salt accumulation in soil surface by an increase in coverage on the soil surface when plant transpiration replaces soil evaporation [26]. Wang et al. (2022) showed that planting E. frumentacea reduced the alkalinity and pH value, increased the contents of organic matter, total nitrogen and available phosphorus, and improved the soil fertility of the upper 0–20 cm [30]. In this study, all treatments with soil modifiers improved the yields of E. frumentacea, reduced soil pH and total salt contents, and improved soil nutrients, including organic matter, available N, available P and available K, implying that the application of soil modifiers followed by planting E. frumentacea had a good improving effect on saline–alkali land.

4.2. Effects of E. frumentacea Intercropping on Soil Bacterial Diversity and Community Structure

In this study, most of the microorganisms detected in this experiment belong to halophilic and halotolerant bacteria, which belong to Proteobacteria, Actinobacteria, Acidobacteria, Chloroflexi, Firmicutes, Gemmatimonadetes, Bacteroidetes, etc. Keshri et al. (2013) analyzed the microbial population index and community structure in saline–alkali soil and showed that Proteobacteria, Actinobacteriota, Acidobacteriota, Firmicutes and Bacteroidota were dominant in saline–alkali soil [31]. We also found that intercropping improved the diversity index and community richness index of rhizosphere soil bacterial communities of E. frumentacea, semi-wild soybeans and fodder soybeans to some extent. According to the published literature, higher plant diversity is usually related to higher soil microbial diversity, plant roots can strongly affect the structure of the soil microbial community and root exudates change the activity and composition of the microbial community. The latter is considered to be due to the increase in root exudate diversity, which leads to an increase in microbial activity [32,33]. Root exudate diversity is an important link between plant diversity and soil microorganisms. Diversified planting increases soil carbon and nitrogen storage, and the increase in carbon input provides nutrition and energy for microbial growth. The nitrogen fixation of leguminous plants can provide nitrogen and energy sources for microbial growth and supply abundant fresh residues, which are easy for microbial utilization. Intercropping improved the relative abundance of Nitrospirae in the rhizosphere soil of crops. Nitrospira is the main microorganism in the nitrosation reaction, which is able to oxidize nitrite into nitrate and has an irreplaceable ecological role in the nitrogen cycle [34]. Therefore, diversified vegetation leads to different litter and substrate inputs, which can increase soil microbial biomass and the decomposition rate [35].
Agricultural systems lack biodiversity and are vulnerable to pathogens and pests [36]. According to Zhao et al. (2019), healthy soil has a high abundance of beneficial microorganisms, and the abundance of Ilumatobacter in healthy soil is significantly higher than in unhealthy soil, which is considered to be meaningful for maintaining soil health [37]. In our study, intercropping increased the abundance of Ilumatobacter in the rhizosphere soil of E. frumentacea, semi-wild soybeans and fodder soybeans (p < 0.05). Our study suggests that the intercropping mode affects bacterial community composition, and the intercropping of E. frumentacea with leguminous forages on saline–alkali land increases the proportion of beneficial microorganisms, which is beneficial to the health and stability of the micro-ecological environment in saline–alkali lands.

4.3. Effects of E. frumentacea Intercropping with Leguminous Forages on Hay Yields and Land Use Efficiency

Our results demonstrate that the yields of the three grasses were lower in intercropping modes than in those in monoculture modes. Nevertheless, intercropping has advantages over monoculture because the LER was larger than 1 and AYL was larger than 0 under the intercropping system, which was consistent with the previous results of intercropping [38]. However, compared with previous studies, the crop combination in this study may be the key factor to determining the increase in the aboveground biomass in the intercropping system. The intercropping advantage was mainly due to the predominant contribution of E. frumentacea. Intercropping promoted yields per unit area of E. frumentacea, which could be related to the improvement in ventilation and light transmittance and the increase in the photosynthesis of E. frumentacea in the intercropping system. The results of CR analysis showed that in the intercropping systems, E. frumentacea was a competitive and dominant species compared with leguminous grasses, and the competitiveness of E. frumentacea was greater than that of semi-wild soybeans and fodder soybeans. E. frumentacea and leguminous forage were sown simultaneously, and the aboveground growth was synchronous in the early growth stage. The competition for resources between E. frumentacea and leguminous forage was relatively balanced. The resource competitiveness of E. frumentacea became stronger after the elongation stage, and then its ability to obtain resources was gradually enhanced. Given the spatial disadvantage of leguminous grasses with their relatively short stems, their resource competitiveness was weakened compared with E. frumentacea. When tall and short crops were intercropped together, the light intercepted by tall crops was mostly side light, and insufficient light in the later stages became the main limiting factor for the growth of leguminous forages. Previous studies have also reported that interspecific competition is the main driving factor for the yield advantage of a given crop species, whose aboveground dry matter yield is positively correlated with their competitiveness in an intercropping system [39,40].

5. Conclusions

The following conclusions can be drawn from our study: (1) E. frumentacea has a significant leaching effect on soil ions, especially Na+ and SO42−, in the saline–alkali land of the Hetao Ningxia Plain, indicating that E. frumentacea is a better pioneer crop, which can be used to improve saline–alkali land. (2) The application of improvers followed by the planting of E. frumentacea had a good improving effect on saline–alkali land. (3) The intercropping of E. frumentacea with leguminous forages in saline–alkali land increased the diversity and richness of rhizosphere soil bacterial communities and the proportion of beneficial microorganisms, resulting in an increased land utilization rate and a healthier soil microenvironment. Therefore, the extension and planting of E. frumentacea on the Hetao Ningxia Plain and other areas subjected to soil salinization problems will be an effective way to promote biological improvement and realize the sustainable utilization of median and mild saline–alkali land around the world.

Author Contributions

Y.C. performed the intercropping experiments, analyzed the data and wrote and revised the manuscript. X.X. (Xiaowei Xie) performed the monoculture experiments and analyzed the data. X.W. performed the leaching experiments and analyzed the data. L.Z. wrote and revised the manuscript. Q.-S.Q. wrote and revised the manuscript. X.X. (Xing Xu) supervised the study and revised the manuscript. All authors have read and agreed to the published version of the manuscript.

Funding

This research was financially supported by the Agricultural Breeding Project of Ningxia Hui Autonomous Region (Project no. 2019NYYZ0401), the National Natural Science Foundation of China (Grant no. 31860135), the Qinghai Provincial Department of Science and Technology Qinghai basic research program (2022-ZJ-724 to Q.S.Q.) and the Independent Research and Development Project of State Key Laboratory of Herbage Improvement and Grassland Agro-ecosystems (202202 to Q.S.Q.).

Data Availability Statement

The datasets used and/or analysed during the current study are available from the corresponding author on reasonable request.

Acknowledgments

We thank Ningxia Qianjin Farm and Ningxia Qianye Qing Agricultural Technology Co., Ltd. for providing the land used for experiments.

Conflicts of Interest

The authors declare no conflict of interest.

References

  1. Sun, H.; Lu, H.Y.; Chu, L.; Shao, H.B.; Shi, W.M. Biochar applied with appropriate rates can reduce N leaching, keep N reten-tion and not increase NH3 volatilization in a coastal saline soil. Sci. Total Environ. 2017, 575, 820–825. [Google Scholar] [CrossRef] [PubMed]
  2. Li, J.Y.; Wang, J.M. Integrated life cycle assessment of improving saline-sodic soil with flue gas desulfurization gypsum. J. Clean. Prod. 2018, 202, 332–341. [Google Scholar] [CrossRef]
  3. Liu, L.; Long, X.; Shao, H.; Liu, Z.; Tao, Y.; Zhou, Q.; Zong, J. Ameliorants improve saline–alkaline soils on a large scale in northern Jiangsu Province, China. Ecol. Eng. 2015, 81, 328–334. [Google Scholar]
  4. Zhao, Y.; Wang, S.; Li, Y.; Liu, J.; Zhuo, Y.; Chen, H.; Wang, J.; Xu, L.; Sun, Z. Extensive reclamation of saline-sodic soils with flue gas desulfurization gypsum on the Songnen Plain, Northeast China. Geoderma 2018, 321, 52–60. [Google Scholar] [CrossRef]
  5. Singh, K. Microbial and Enzyme Activities of Saline and Sodic Soils. Land Degrad. Dev. 2015, 27, 706–718. [Google Scholar] [CrossRef]
  6. Yang, J.; Zhang, S.; Li, Y.; Bu, K.; Zhang, Y.; Chang, L.; Zhang, Y. Dynamics of saline-alkali land and its ecological regionalization in western Songnen Plain, China. Chin. Geogr. Sci. 2010, 20, 159–166. [Google Scholar] [CrossRef] [Green Version]
  7. Yan, N.; Marschner, P.; Cao, W.; Zuo, C.; Qin, W. Influence of salinity and water content on soil microorganisms. Int. Soil Water Conserv. Res. 2015, 3, 316–323. [Google Scholar] [CrossRef] [Green Version]
  8. Kursakova, V.S. The effect of perennial herbs on the physical properties of saline soils. Eurasian Soil Sci. 2006, 39, 748–752. [Google Scholar] [CrossRef]
  9. Liang, J.; Shi, W. Cotton/halophytes intercropping decreases salt accumulation and improves soil physicochemical properties and crop productivity in saline-alkali soils under mulched drip irrigation: A three-year field experiment. Field Crop. Res. 2020, 262, 108027. [Google Scholar] [CrossRef]
  10. Li, Y.-H.; Shi, D.-Y.; Li, G.-H.; Zhao, B.; Zhang, J.-W.; Liu, P.; Ren, B.; Dong, S.-T. Maize/peanut intercropping increases photosynthetic characteristics, 13C-photosynthate distribution, and grain yield of summer maize. J. Integr. Agric. 2019, 18, 2219–2229. [Google Scholar] [CrossRef]
  11. Du, J.B.; Han, T.F.; Gai, J.Y.; Yong, T.W.; Xin, S.; Wang, X.C.; Feng, Y.; Jiang, L.; Kai, S.; Liu, W.; et al. Maize-soybean strip intercropping: Achieved a balance between high productivity and sustainability. J. Integr. Agric. 2018, 17, 747–754. [Google Scholar] [CrossRef] [Green Version]
  12. Raza, M.A.; Gul, H.; Wang, J.; Yasin, H.S.; Qin, R.; Bin Khalid, M.H.; Naeem, M.; Feng, L.Y.; Iqbal, N.; Gitari, H.; et al. Land productivity and water use efficiency of maize-soybean strip intercropping systems in semi-arid areas: A case study in Punjab Province, Pakistan. J. Clean. Prod. 2021, 308, 127282. [Google Scholar] [CrossRef]
  13. Stefan, L.; Hartmann, M.; Engbersen, N.; Six, Z.; Schöb, C. Positive Effects of Crop Diversity on Productivity Driven by Changes in Soil Microbial Composition. Front. Microbiol. 2021, 12, 660749. [Google Scholar] [CrossRef] [PubMed]
  14. Cappelli, S.L.; Domeignoz-Horta, L.A.; Loaiza, V.; Laine, A.-L. Plant biodiversity promotes sustainable agriculture directly and via belowground effects. Trends Plant Sci. 2022, 27, 674–687. [Google Scholar] [CrossRef]
  15. Upadhyaya, H.D.; Dwivedi, S.L.; Singh, S.K.; Singh, S.; Vetriventhan, M.; Sharma, S. Forming core collections in barnyard, kodo, and little millets using mor-phoagronomic descriptors. Crop Sci. 2014, 54, 2673–2682. [Google Scholar] [CrossRef]
  16. Muldoon, D. The effect of photoperiod on the growth and development of Echinochloa spp. Millets. Aust. J. Exp. Agric. 1985, 25, 428–433. [Google Scholar] [CrossRef]
  17. Gandhimeyyan, V.R.; Vanniarajan, C.; Nirmalakumari, A.; Arunachalam, P.; Thiyageshwari, S.; Karthikeyan, A.; Govindaraj, M. Gene effects and heterosis for grain Fe and Zn content in barnyard millet (Echinochloa frumentacea (Roxb.) link). Genetika 2020, 52, 621–639. [Google Scholar] [CrossRef]
  18. Chandrasekar, B.R.; Ambrose, G.; Jayabalan, N. Influence of biofertilizers and nitrogen source level on the growth and yield of Echinochloa frumentacea (Roxb.) Link. J. Agric. Sci. Technol. 2005, 1, 223–234. [Google Scholar]
  19. Subramanian, A.; Rajendran, N.R.; Jeyaprakash, P. In vitro and in vivo screening of barnyard millet (Echinochloa frumentacea (roxb.) link) germplasm for salinity tolerance. Plant Arch. 2020, 20, 7389–7397. [Google Scholar]
  20. Sood, S.; Khulbe, R.K.; Gupta, A.K.; Agrawal, P.K.; Upadhyaya, H.D.; Bhatt, J.C. Barnyard millet—A potential food and feed crop of future. Plant Breed. 2015, 134, 135–147. [Google Scholar] [CrossRef]
  21. Dan, B.S. Soil Agricultural Chemistry Analysis; China Agriculture Press: Beijing, China, 2000. (In Chinese) [Google Scholar]
  22. Rukun, L. Analysis Methods of Soil Agrochemistry; China Agricultural Science and Technology Press: Beijing, China, 1999; pp. 156–157. (In Chinese) [Google Scholar]
  23. Litourgidis, A.S.; Vlachostergios, D.N.; Dordas, C.A.; Damalas, C.A. Dry matter yield, nitrogen content, and competition in pea–cereal intercropping systems. Eur. J. Agron. 2011, 34, 287–294. [Google Scholar] [CrossRef]
  24. MacFall, J.S.; Johnson, G.A.; Kramer, P.J. Comparative water uptake by roots of different ages in seedlings of loblolly pine (Pinus taeda L.). New Phytol. 1991, 119, 551–560. [Google Scholar] [CrossRef] [Green Version]
  25. Enstone, D.E.; Peterson, C.A.; Ma, F. Root Endodermis and Exodermis: Structure, Function, and Responses to the Environment. J. Plant Growth Regul. 2002, 21, 335–351. [Google Scholar] [CrossRef]
  26. Xia, J.; Ren, J.; Zhang, S.; Wang, Y.; Fang, Y. Forest and grass composite patterns improve the soil quality in the coastal saline-alkali land of the Yellow River Delta, China. Geoderma 2019, 349, 25–35. [Google Scholar] [CrossRef]
  27. Peng, B.; Xu, W.; Shao, R.; Feng, G.; Shi, W. Growth of suaeda salsa tin response to salt stress in different habitats. Acta Pratacul. Sin. 2016, 25, 81–90. (In Chinese) [Google Scholar]
  28. Qadir, M.; Steffens, D.; Yan, F.; Schubert, S. Sodium removal from a calcareous saline-sodic soil through leaching and plant uptake during phytoremediation. Land Degrad. Dev. 2003, 14, 301–307. [Google Scholar] [CrossRef]
  29. Xie, X.; Pu, L.; Wang, Q.; Zhu, M.; Xu, Y.; Zhang, M. Response of soil physicochemical properties and enzyme activities to long-term reclamation of coastal saline soil, Eastern China. Sci. Total. Environ. 2017, 607–608, 1419–1427. [Google Scholar] [CrossRef]
  30. Wang, X.; Xu, X.; Lu, A.; Li, X.; Zhang, F. Cultivation of two barnyard varieties improves physicochemical properties of saline-alkali land through mediating rhizospheric microbiome and metabolome. Agronomy 2022, 12, 1322. [Google Scholar] [CrossRef]
  31. Keshri, J.; Mishra, A.; Jha, B. Microbial population index and community structure in saline–alkaline soil using gene targeted metagenomics. Microbiol. Res. 2013, 168, 165–173. [Google Scholar] [CrossRef]
  32. Lange, M.; Eisenhauer, N.; Sierra, C.A.; Bessler, H.; Engels, C.; Griffiths, R.I.; Mellado-Vázquez, P.G.; Malik, A.A.; Roy, J.; Scheu, S.; et al. Plant diversity increases soil microbial activity and soil carbon storage. Nat. Commun. 2015, 6, 6707. [Google Scholar] [CrossRef] [Green Version]
  33. Steinauer, K.; Chatzinotas, A.; Eisenhauer, N. Root exudate cocktails: The link between plant diversity and soil microorgan-isms? Ecol. Evol. 2016, 6, 7387–7396. [Google Scholar] [CrossRef] [PubMed] [Green Version]
  34. You, J.; Das, A.; Dolan, E.M.; Hu, Z. Ammonia-oxidizing archaea involved in nitrogen removal. Water Res. 2009, 43, 1801–1809. [Google Scholar] [CrossRef] [PubMed]
  35. Yan, Z.; Zhou, J.; Yang, L.; Gunina, A.; Yang, Y.; Peixoto, L.; Zeng, Z.; Zang, H.; Kuzyakov, Y. Diversified cropping systems benefit soil carbon and nitrogen stocks by increasing aggregate stability: Results of three fractionation methods. Sci. Total. Environ. 2022, 824. [Google Scholar] [CrossRef]
  36. Savary, S.; Willocquet, L.; Pethybridge, S.J.; Esker, P.; McRoberts, N.; Nelson, A. The global burden of pathogens and pests on major food crops. Nat. Ecol. Evol. 2019, 3, 430–439. [Google Scholar] [CrossRef] [PubMed]
  37. Zhao, F.; Zhang, Y.; Dong, W.; Zhang, Y.; Zhang, G.; Sun, Z.; Yang, L. Vermicompost can suppress Fusarium oxysporum f. sp. lycopersici via generation of benefi-cial bacteria in a long-term tomato monoculture soil. Plant Soil 2019, 440, 491–505. [Google Scholar] [CrossRef]
  38. Jo, S.-G.; Kang, Y.-I.; Om, K.-S.; Cha, Y.-H.; Ri, S.-Y. Growth, photosynthesis and yield of soybean in ridge-furrow intercropping system of soybean and flax. Field Crop. Res. 2021, 275, 108329. [Google Scholar] [CrossRef]
  39. Li, C.; Dong, Y.; Li, H.; Shen, J.; Zhang, F. The Dynamic Process of Interspecific Interactions of Competitive Nitrogen Capture between In-tercropped Wheat (Triticum aestivum L.) and Faba Bean (Vicia faba L.). PLoS ONE 2014, 9, e115804. [Google Scholar] [CrossRef] [Green Version]
  40. Zhang, G.; Yang, Z.; Dong, S. Interspecific competitiveness affects the total biomass yield in an alfalfa and corn intercropping system. Field Crop. Res. 2011, 124, 66–73. [Google Scholar] [CrossRef]
Figure 1. Schematic diagram of the leaching experiment device.
Sustainability 15 05319 g001
Figure 2. Effects of mixed applications of modifiers on the plant growth and hay yields of E. frumentacea. (a) Plant height. (b) Stem diameter. (c) Hay yields. CK, bare lands, control; A, no soil conditioner; B, phosphogypsum (22.5 t·ha−1) + decomposed sheep dung (15 t·ha−1); C, superphosphate (300 kg·ha−1) + decomposed sheep dung (15 t·ha−1); D, phosphogypsum (22.5 t·ha−1) + superphosphate (300 kg·ha−1) + decomposed sheep dung (15 t·ha−1); E, phosphogypsum (30 t·ha−1) + superphosphate (600 kg·ha−1) + decomposed sheep dung (30 t·ha−1); F, phosphogypsum (30 t·ha−1) + superphosphate (900 kg·ha−1) + decomposed sheep dung (30 t·ha−1). Different letters above the bars indicate statistically significant differences based on Duncan’s test (p < 0.05).
Sustainability 15 05319 g002
Figure 3. Effects of different planting modes on the pH of rhizosphere soil (a), and the effect of different planting modes on the total salt of rhizosphere soil (b). EE, monocropped E. frumentacea; SS, monocropped semi-wild soybeans; FF, monocropped fodder soybeans; ES, E. frumentacea intercropped with semi-wild soybeans; SE, intercropped semi-wild soybeans; EF, E. frumentacea intercropped with fodder soybeans; FE, intercropped fodder soybeans. Different letters within the same column indicate statistically significant differences based on Duncan’s test (p < 0.05).
Sustainability 15 05319 g003
Figure 4. Community structure of rhizosphere soil bacteria (phylum) under different planting modes. EE, monocropped E. frumentacea; SS, monocropped semi-wild soybeans; FF, monocropped fodder soybeans; ES, E. frumentacea intercropped with semi-wild soybeans; SE, intercropped semi-wild soybeans; EF, E. frumentacea intercropped with fodder soybeans; FE, intercropped fodder soybeans.
Sustainability 15 05319 g004
Figure 5. Community structure of rhizosphere soil bacteria (genus) under different planting patterns. EE, monocropped E. frumentacea; SS, monocropped semi-wild soybeans; FF, monocropped fodder soybeans; ES, E. frumentacea intercropped with semi-wild soybeans; SE, intercropped semi-wild soybeans; EF, E. frumentacea intercropped with fodder soybeans; FE, intercropped fodder soybeans.
Sustainability 15 05319 g005
Table 1. Soil ion changes of alkaline soil and salinized soil by affected cultivated herbages.
Saline–Alkali
Soil Type
TreatmentNa+
(g·kg−1)
K+
(g·kg−1)
Ca2+
(g·kg−1)
Mg2+
(g·kg−1)
Cl
(g·kg−1)
SO42−
(g·kg−1)
CO32−
(g·kg−1)
HCO3
(g·kg−1)
Alkalized
soil
Bare land (CK)0.78 ± 0.03a20.06 ± 1.02a0.20 ± 0.04a0.04 ± 0.01b0.47 ± 0.02a0.29 ± 0.01a0.27 ± 0.03a0.24 ± 0.02a
E. frumentacea0.50 ± 0.01e5.00 ± 0.35d0.12 ± 0.01e0.04 ± 0.00b0.40 ± 0.03b0.16 ± 0.05e0.21 ± 0.06bc0.17 ± 0.05b
Barnyard grass0.56 ± 0.04d5.50 ± 0.29d0.15 ± 0.02c0.04 ± 0.01b0.41 ± 0.01b0.17 ± 0.01de0.18 ± 0.01c0.16 ± 0.01c
Oat0.67 ± 0.04c9.90 ± 0.31c0.11 ± 0.02d0.04 ± 0.01b0.41 ± 0.03ab0.19 ± 0.08cd0.19 ± 0.04c0.17 ± 0.07bc
S. europaea0.70 ± 0.03b17.36 ± 1.73b0.18 ± 0.06b0.05 ± 0.00a0.43 ± 0.01ab0.26 ± 0.06b0.23 ± 0.02b0.15 ± 0.03d
Alfalfa0.68 ± 0.07bc8.90 ± 1.19c0.06 ± 0.03f0.05 ± 0.00a0.42 ± 0.02ab0.21 ± 0.02c0.15 ± 0.04d0.13 ± 0.03e
Salinized
soil
Bare land (CK)1.51 ± 0.42a54.00 ± 7.23a0.26 ± 0.03a0.37 ± 0.04a2.69 ± 0.23a1.20 ± 0.12a0.021 ± 0.00a0.113 ± 0.02a
E. frumentacea0.70 ± 0.13e38.40 ± 3.81de0.16 ± 0.05b0.33 ± 0.03b2.37 ± 0.16d0.94 ± 0.20c0.019 ± 0.00bc0.083 ± 0.00bc
Barnyard grass0.73 ± 0.10d39.00 ± 4.97d0.19 ± 0.03b0.34 ± 0.02ab2.40 ± 0.17d1.09 ± 0.18b0.018 ± 0.00cd0.076 ± 0.01bc
Oat0.71 ± 0.35e43.90 ± 5.54c0.20 ± 0.04b0.33 ± 0.02b2.42 ± 0.10cd1.10 ± 0.13ab0.017 ± 0.00d0.071 ± 0.00bc
S. europaea0.87 ± 0.09c49.90 ± 3.81b0.25 ± 0.02a0.36 ± 0.03a2.56 ± 0.15b1.14 ± 0.19ab0.020 ± 0.00ab0.091 ± 0.00ab
Alfalfa1.05 ± 0.70b35.86 ± 5.92e0.17 ± 0.06b0.32 ± 0.02b2.54 ± 0.16bc1.05 ± 0.17b0.015 ± 0.00e0.063 ± 0.00c
Note: Different letters within the same column indicate statistically significant differences based on Duncan’s test (p < 0.05).
Table 2. Effects of planting E. frumentacea on the soil nutrients.
TreatmentpHTotal SaltOrganic MatterAvailable NAvailable PAvailable K
g·kg−1g·kg−1mg·kg −1mg·kg −1mg·kg −1
CK10.08 ± 0.02a2.23 ± 0.03a4.93 ± 0.16d2.80 ± 0.16ce2.23 ± 0.14e83.37 ± 2.45f
A9.92 ± 0.01b1.78 ± 0.01b5.40 ± 0.32cd3.07 ± 0.16bcde3.06 ± 0.37e90.77 ± 2.64e
B9.72 ± 0.01c1.21 ± 0.02e7.20 ± 0.49ab4.61 ± 0.27a8.22 ± 0.08c127.97 ± 3.22c
C9.22 ± 0.00d1.62 ± 0.10c6.57 ± 1.57bc3.16 ± 0.16bcd5.09 ± 0.52d104.57 ± 3.55d
D9.13 ± 0.01e1.45 ± 0.03d6.78 ± 0.49b4.43 ± 0.16a15.61 ± 0.08b130.13 ± 2.45c
E8.84 ± 0.02f0.92 ± 0.02g7.63 ± 0.64ab3.26 ± 0.27b19.07 ± 1.36a152.18 ± 2.04a
F8.52 ± 0.01g1.10 ± 0.03f8.26 ± 0.32a3.16 ± 0.16bc16.90 ± 1.80b142.72 ± 1.54b
Note: CK, bare land, control; A, no soil conditioner; B, phosphogypsum (22.5 t·ha−1) + decomposed sheep dung (15 t·ha−1); C, superphosphate (300 kg·ha−1) + decomposed sheep dung (15 t·ha−1); D, phosphogypsum (22.5 t·ha−1) + superphosphate (300 kg·ha−1) + decomposed sheep dung (15 t·ha−1); E, phosphogypsum (30 t·ha−1) + superphosphate (600 kg·ha−1) + decomposed sheep dung (30 t·ha−1); F, phosphogypsum (30 t·ha−1) + superphosphate (900 kg·ha−1) + decomposed sheep dung (30 t·ha−1). Different letters within the same column indicate statistically significant differences based on Duncan’s test (p < 0.05).
Table 3. Alpha diversity of rhizosphere soil bacteria under different planting patterns.
TreatmentDiversity IndexCommunity Richness Index
ShannonSimpsonChao1ACE
EE6.221 ± 0.20c0.006 ± 0.00b2748.178 ± 153.28bc2739.791 ± 154.71bc
SS5.872 ± 0.11d0.010 ± 0.00a2509.509 ± 312.92c2541.299 ± 352.43c
FF6.358 ± 0.12bc0.005 ± 0.00b3013.089 ± 237.52b3025.151 ± 247.87b
ES6.562 ± 0.07ab0.004 ± 0.00b3791.356 ± 258.01a3778.554 ± 182.07a
SE6.545 ± 0.20ab0.005 ± 0.00b3877.336 ± 280.03a3866.806+260.16a
EF6.569 ± 0.06ab0.004 ± 0.00b3647.032 ± 168.69a3610.956 ± 187.72a
FE6.634 ± 0.013a0.004 ± 0.00b3762.663 ± 316.51a3723.070 ± 286.45a
Note: EE, monocropped E. frumentacea; SS, monocropped semi-wild soybeans; FF, monocropped fodder soybeans; ES, E. frumentacea intercropped with semi-wild soybeans; SE, intercropped semi-wild soybeans; EF, E. frumentacea intercropped with fodder soybeans; FE, intercropped fodder soybeans. Different letters within the same column indicate statistically significant differences based on Duncan’s test (p < 0.05).
Table 4. Dry matter yields of forages under different planting modes.
Treatment20212022F Value
Dry Matter Yield(kg·ha−1)Dry Matter Yield(kg·ha−1)Year (df = 1)Treatment (df = 6)YT (df = 6)
EE16,551.45 ± 276.03aB17,014.64 ± 242.21aA169.64 ***5161.44 ***9.57 ***
SS6421.66 ± 153.67dB6871.18 ± 127.13dA
FF9489.78 ± 173.90cB10,991.09 ± 161.45cA
ES11,557.69 ± 151.79bB12,384.39 ± 182.92bA
SE2502.8 ± 66.53fA2681.74 ± 75.19fA
EF11,465.81 ± 183.75bB12,293.64 ± 180.00bA
FE4018.90 ± 123.44eB4533.81 ± 148.87eA
Note: EE, monocropped E. frumentacea; SS, monocropped semi-wild soybeans; FF, monocropped fodder soybeans; ES, E. frumentacea intercropped with semi-wild soybeans; SE, intercropped semi-wild soybeans, EF, E. frumentacea intercropped with fodder soybeans; FE, intercropped fodder soybeans. Different capital letters and lowercases represent significant differences between years and treatments at p < 0.05 level, respectively. *** indicate significance at 0.001 probability levels, respectively.
Table 5. Land use efficiency under two intercropping modes.
TreatmentYearLERAYLCR
TES20211.09 ± 0.01a0.17 ± 0.02a1.80 ± 0.06a
20221.12 ± 0.02a0.23 ± 0.03a1.63 ± 0.05b
TEF20211.12 ± 0.02a0.24 ± 0.04a1.87 ± 0.08a
20221.14 ± 0.02a0.27 ± 0.03a1.75 ± 0.07a
Note: TES, E. frumentacea intercropped with semi-wild soybeans; TEF, E. frumentacea intercropped with fodder soybeans. Different letters within the same column indicate statistically significant differences based on Duncan’s test (p < 0.05).
Disclaimer/Publisher’s Note: The statements, opinions and data contained in all publications are solely those of the individual author(s) and contributor(s) and not of MDPI and/or the editor(s). MDPI and/or the editor(s) disclaim responsibility for any injury to people or property resulting from any ideas, methods, instructions or products referred to in the content.

