
Determining the Contributions in a Denim Fabric Production for Sustainable Development Goals: Life Cycle Assessment and Material Input Approaches
 , , ,
, , ,
Abstract
:1. Introduction
2. Materials and Methods
2.1. Materials
2.2. Methods
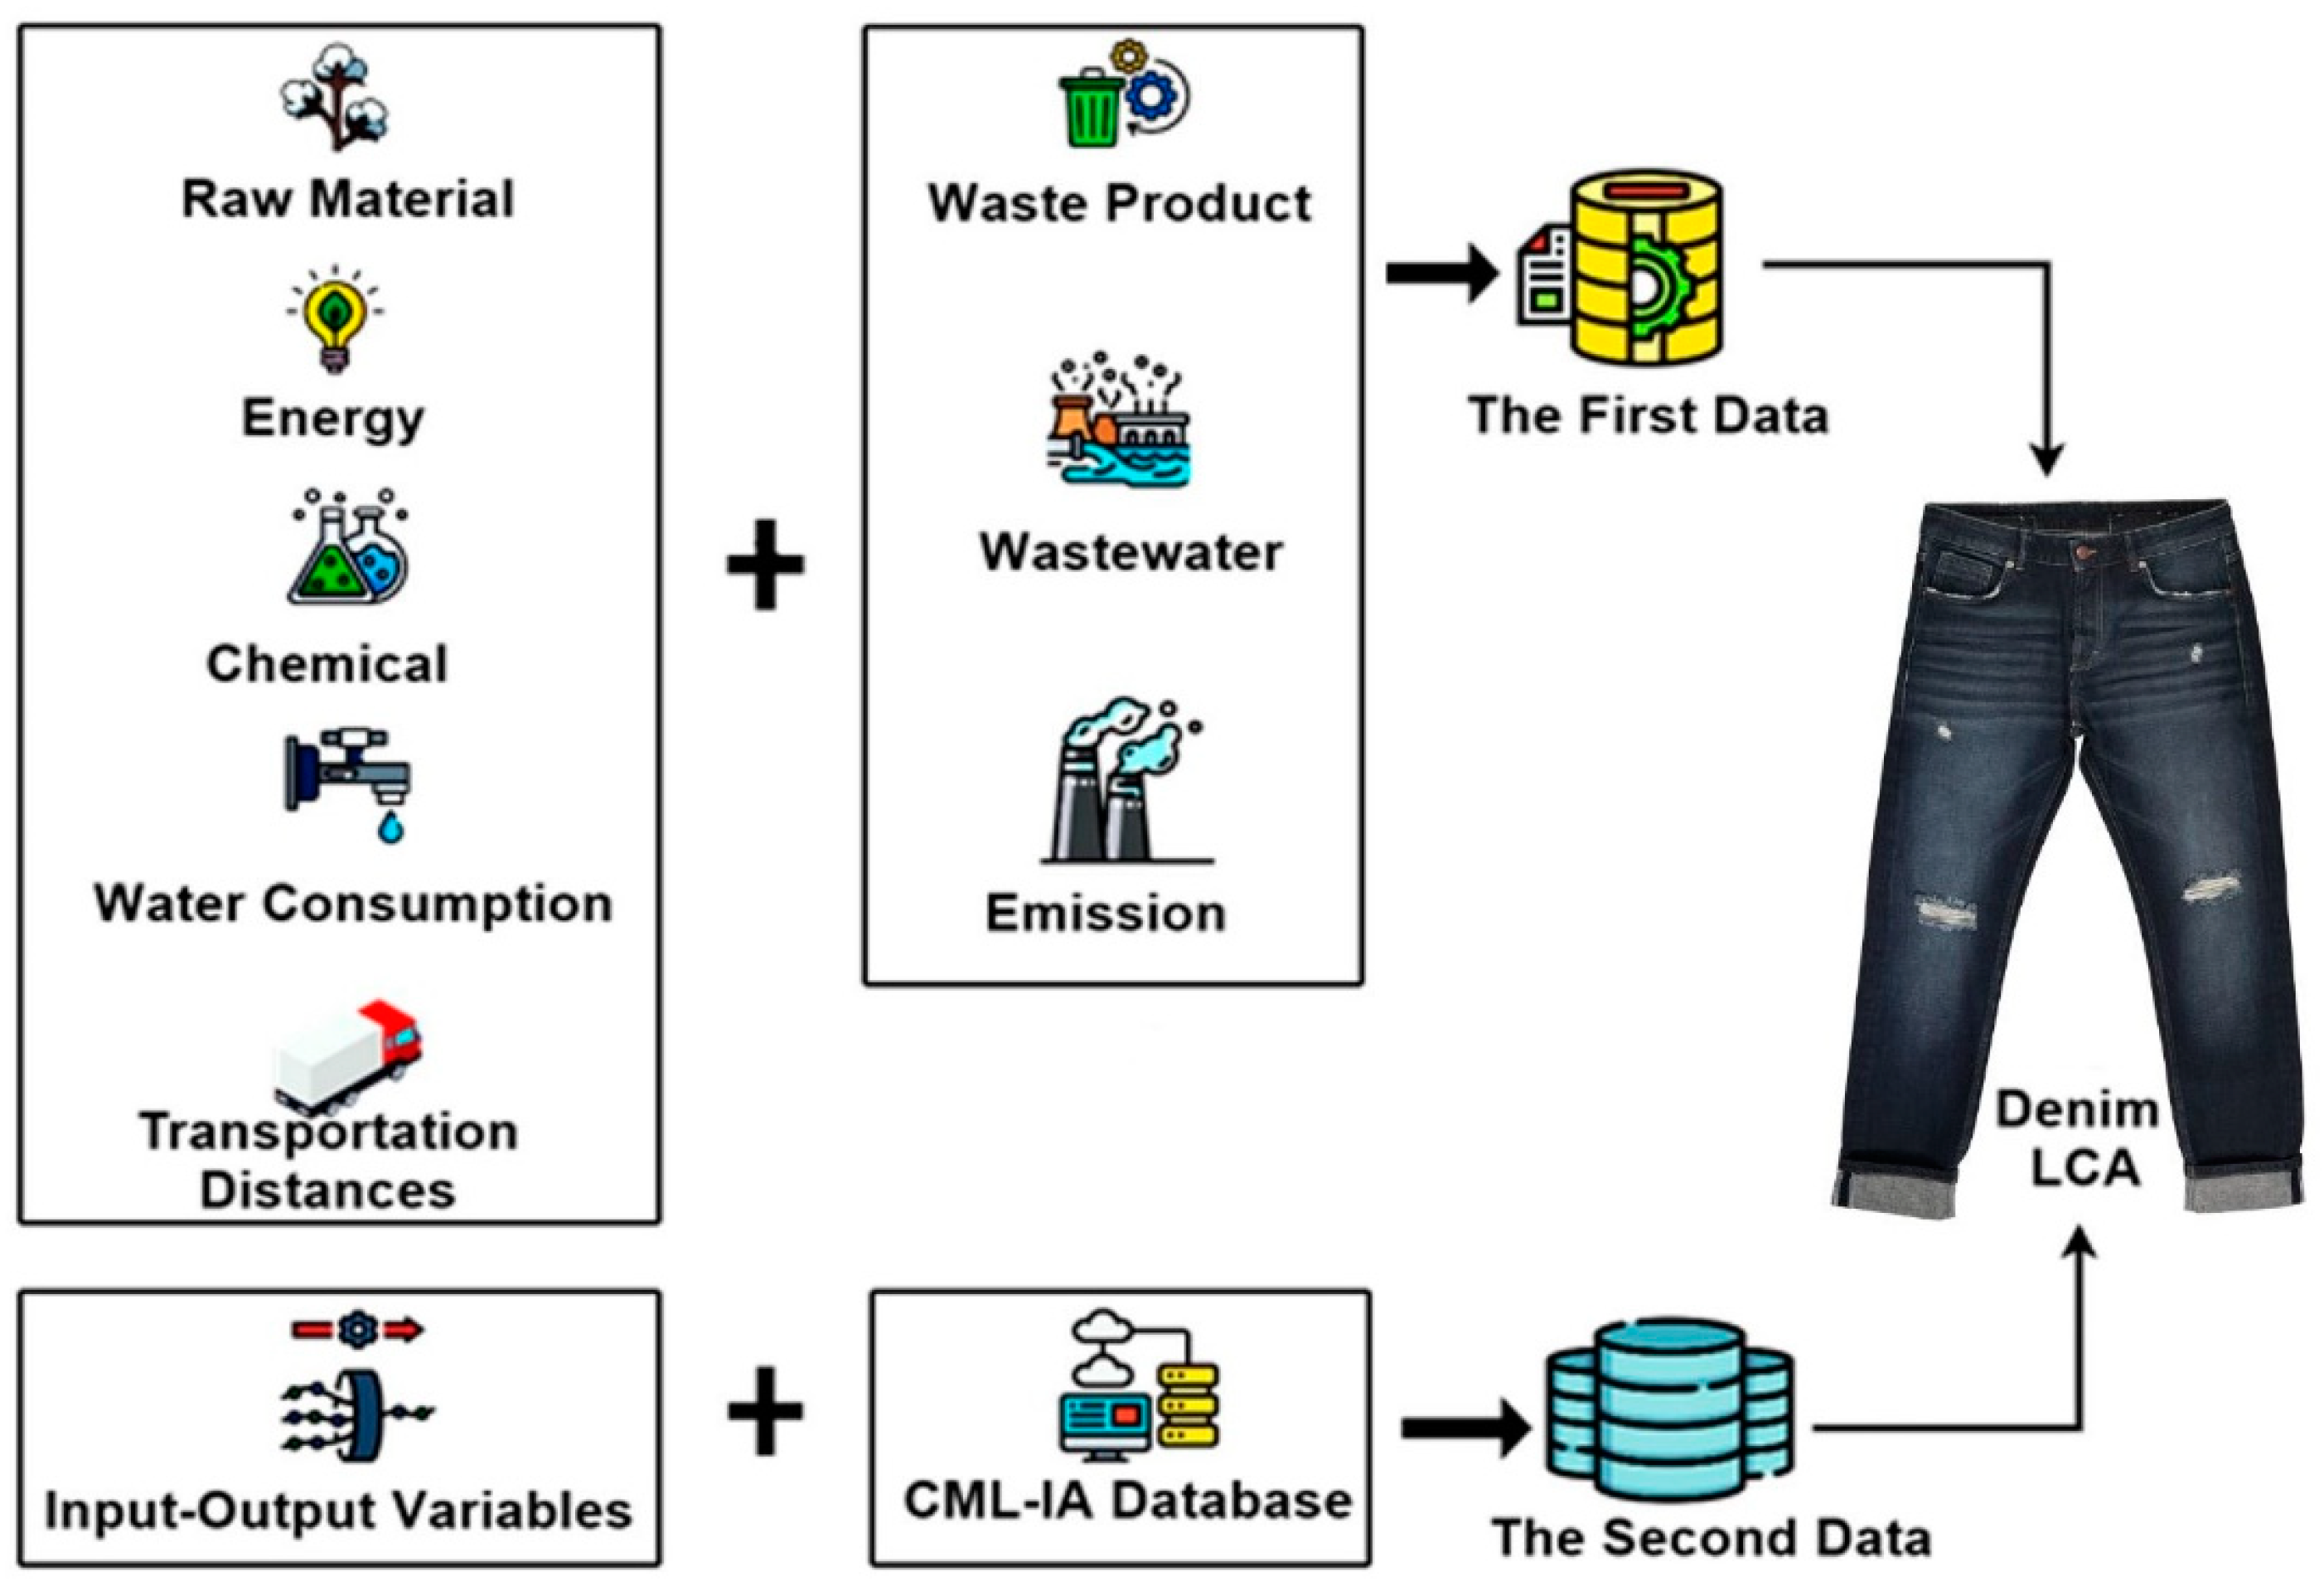
2.2.1. Life Cycle Assessment (LCA)
2.2.2. Material Input per Service of Unit (MIPS)
3. Results and Discussion
3.1. Sustainability Assessment Based on “Total Production Capacity”
3.1.1. LCA Evaluation Based on “Total Production Capacity”
- SDG 12, Responsible Production and Consumption: The factory has achieved an 11.4% improvement in managing natural resources, reducing waste and pollutants, and ensuring their final disposal.
- SDG 13, Climate Action: In the fight against climate change and its effects, positive improvements were achieved in some sub-headings (+8.5% in global warming), whereas there was a lack of improvements in some sub-headings (−27.67% in abiotic depletion-fossil fuels and −7.8% ozone layer depletion were observed).
- SDG 14, Life in Water: In terms of managing marine and coastal ecosystems sustainably, protecting them from pollution, and investigating the effects of ocean acidification; +13.5%, +10.7%; +1.97%, and +13.8% recovery rates were achieved for freshwater ecotoxicity, marine aquatic ecotoxicity, acidification, and eutrophication, respectively.
- SDG 15, Terrestrial Life: Plant improvements in 2017 and 2019 are aimed at protecting and restoring terrestrial ecosystems such as forests, wetlands, drylands, and mountains, combating desertification, stopping and reversing land degradation, and halting biodiversity loss. Accordingly, a +14% contribution was gained.
- As seen in the “total production capacity-based” LCA calculations and the UNEP 2030 SDG assessments of the denim factory, it can be argued that improvements were made in terms of raw materials, chemicals, and water consumption for 2017 and 2019 within the scope of sustainable production, and these contribute to SDGs 12, 14, and 15. However, arguing that sustainable production is realized within the scope of SDG 13 due to the increase in the use of natural gas for cogenerator purposes in the factory during the period taken into account is not possible. It is thought that this is important in terms of determining cleaner production opportunities and focal points in the factory. Cleaner production practices are one of the important tools of sustainable production and contribution to the SDGs [42].
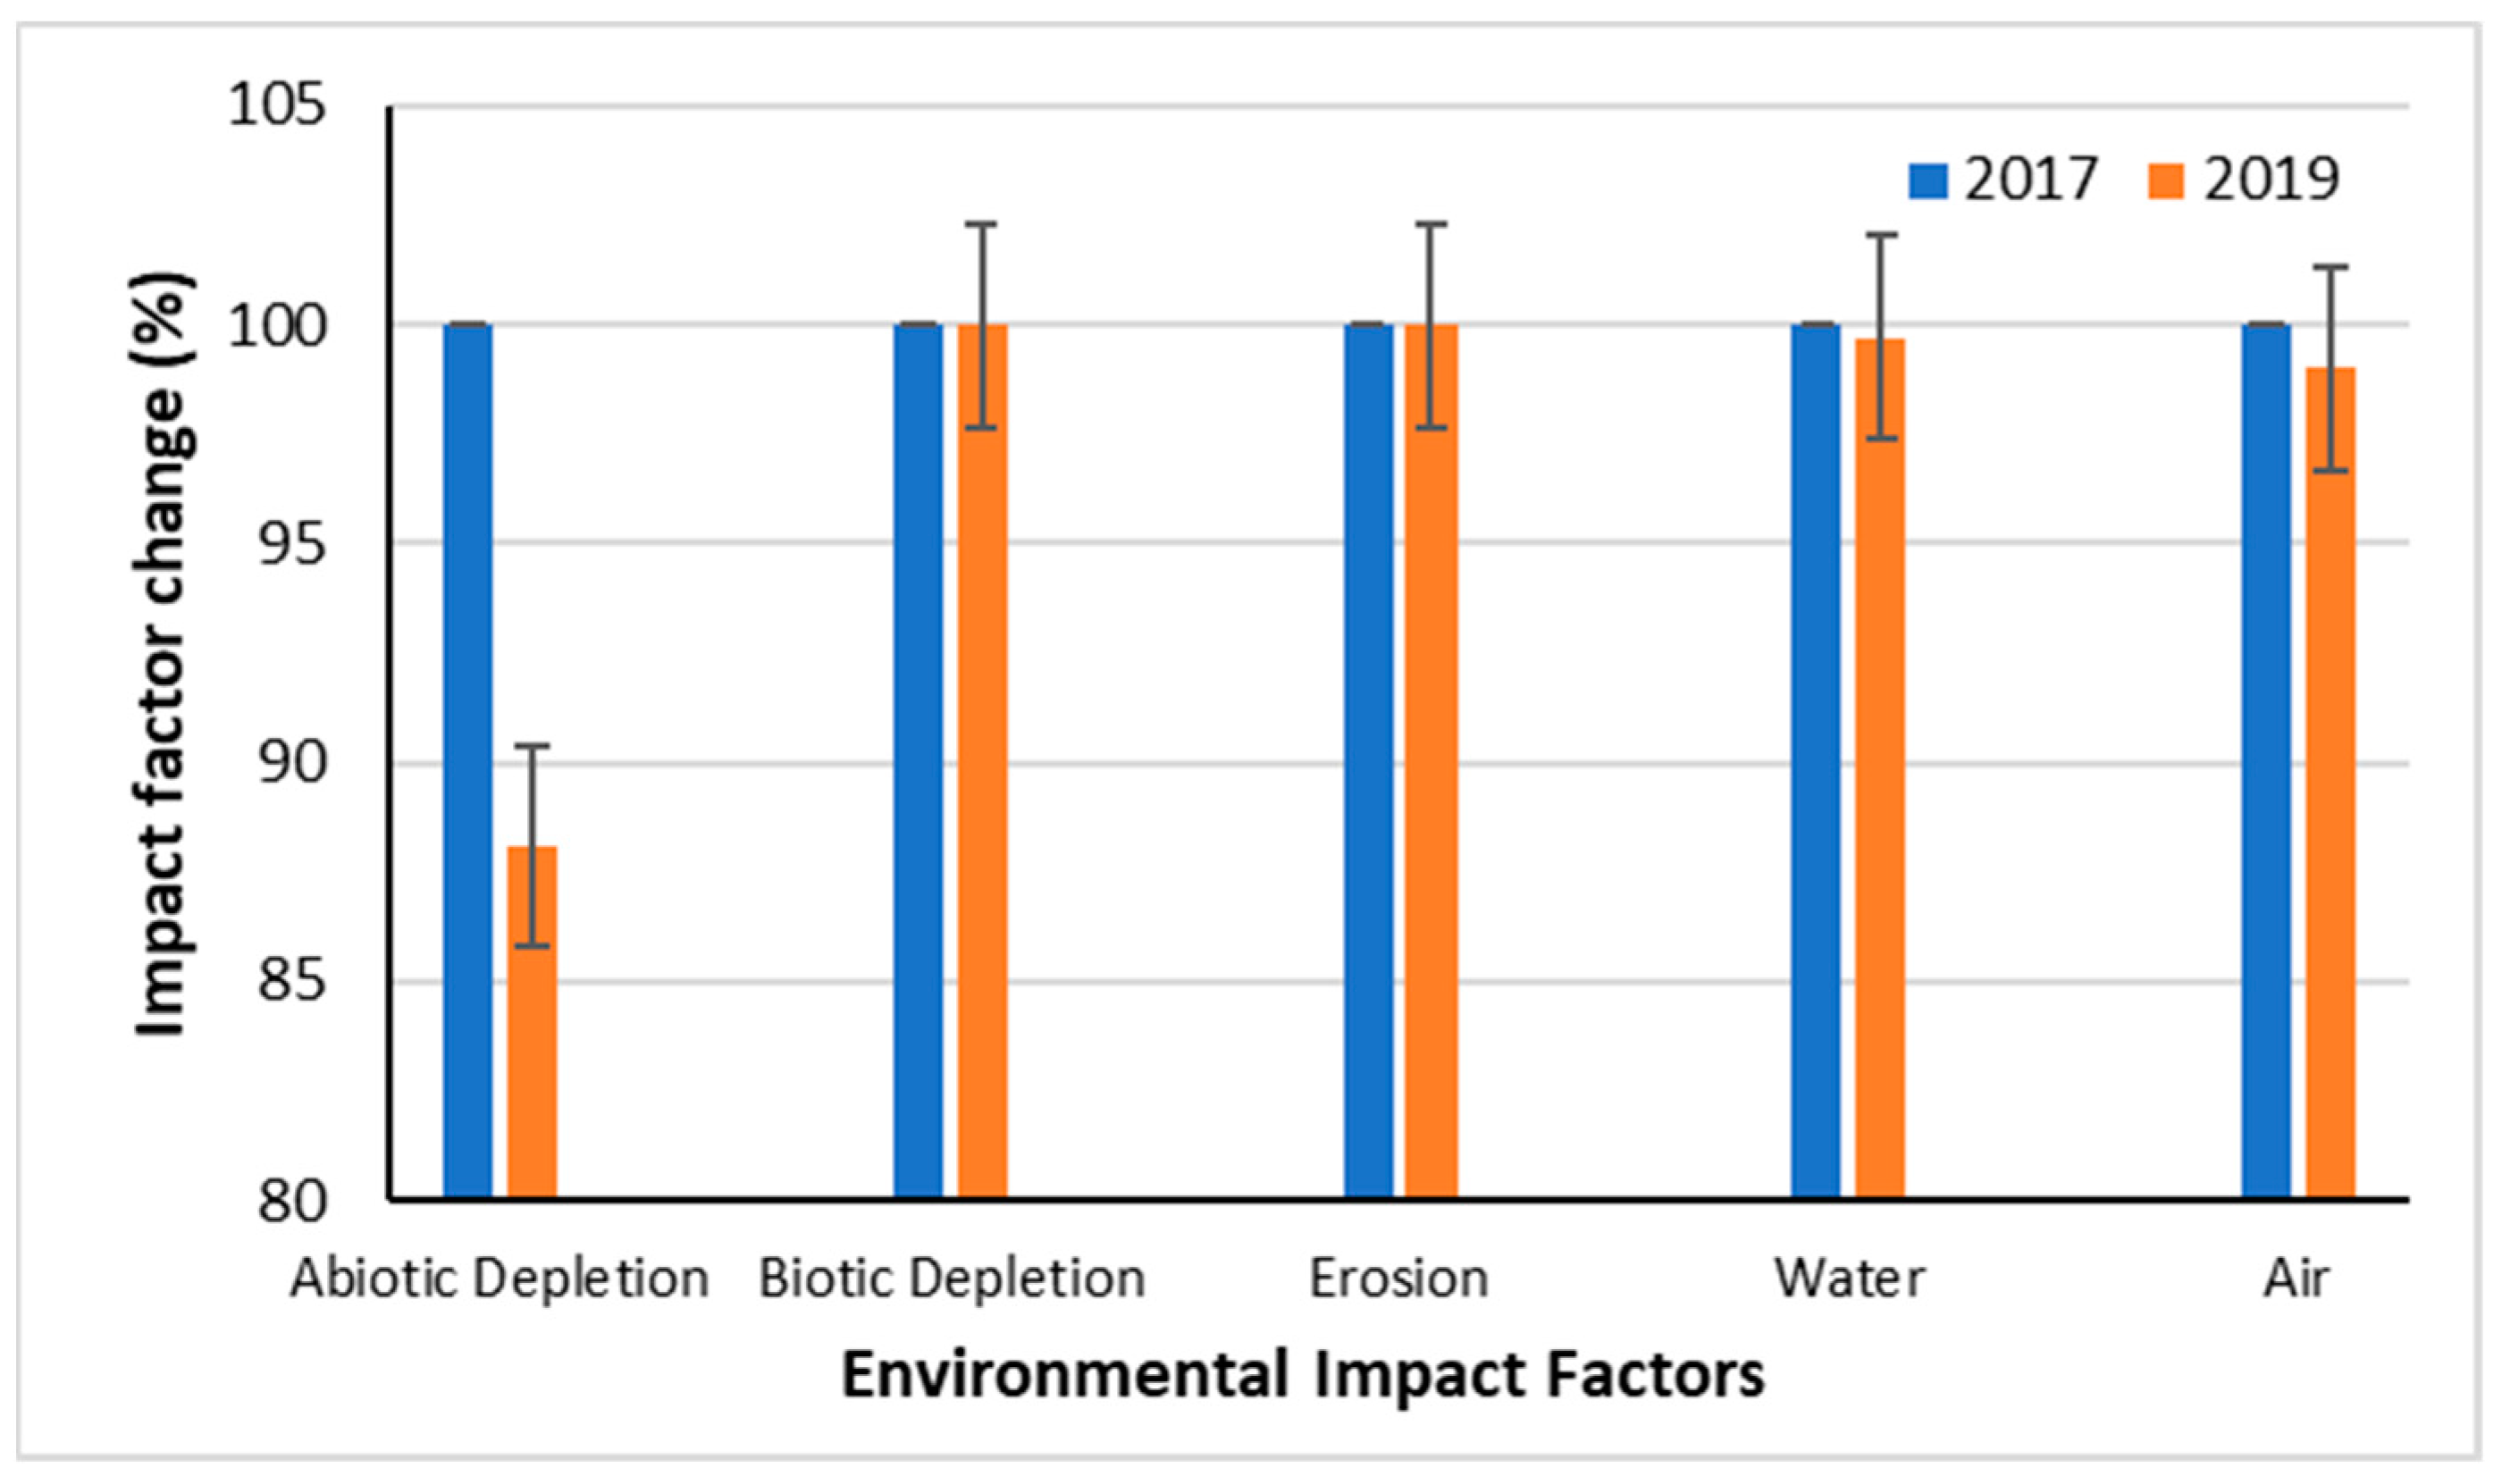
3.1.2. MIPS Evaluation Based on “Total Production Capacity”
- SDG 12: There was a +11.91% improvement in the scope of abiotic consumption environmental impact factor.
- In SDG 13: The air environmental impact factor had a slight improvement of +0.98%.
- SDG 14: There was a slight improvement of +0.29% in the water environmental impact factor. Since the inputs (raw materials, chemicals, and other resources) used in denim production are variable according to the product type and the effect of the type, the difference cannot be determined. No changes were observed in the environmental impact factors such as biotic consumption and erosion in the MIPS calculations. Zamcopé et al. [35] stated that the inputs used in the production of different product types are very variable. Therefore, the effect of type differences on the results could not be determined. In this respect, the MIPS assessment used for the “total production capacity-based” sustainable production potential of the factory is likely to reduce the deviations that may occur due to the excess product variety in the enterprise.
3.2. Sustainability Assessment Based on a “Selected Product”
3.2.1. LCA Evaluation Based on a “Selected Product”
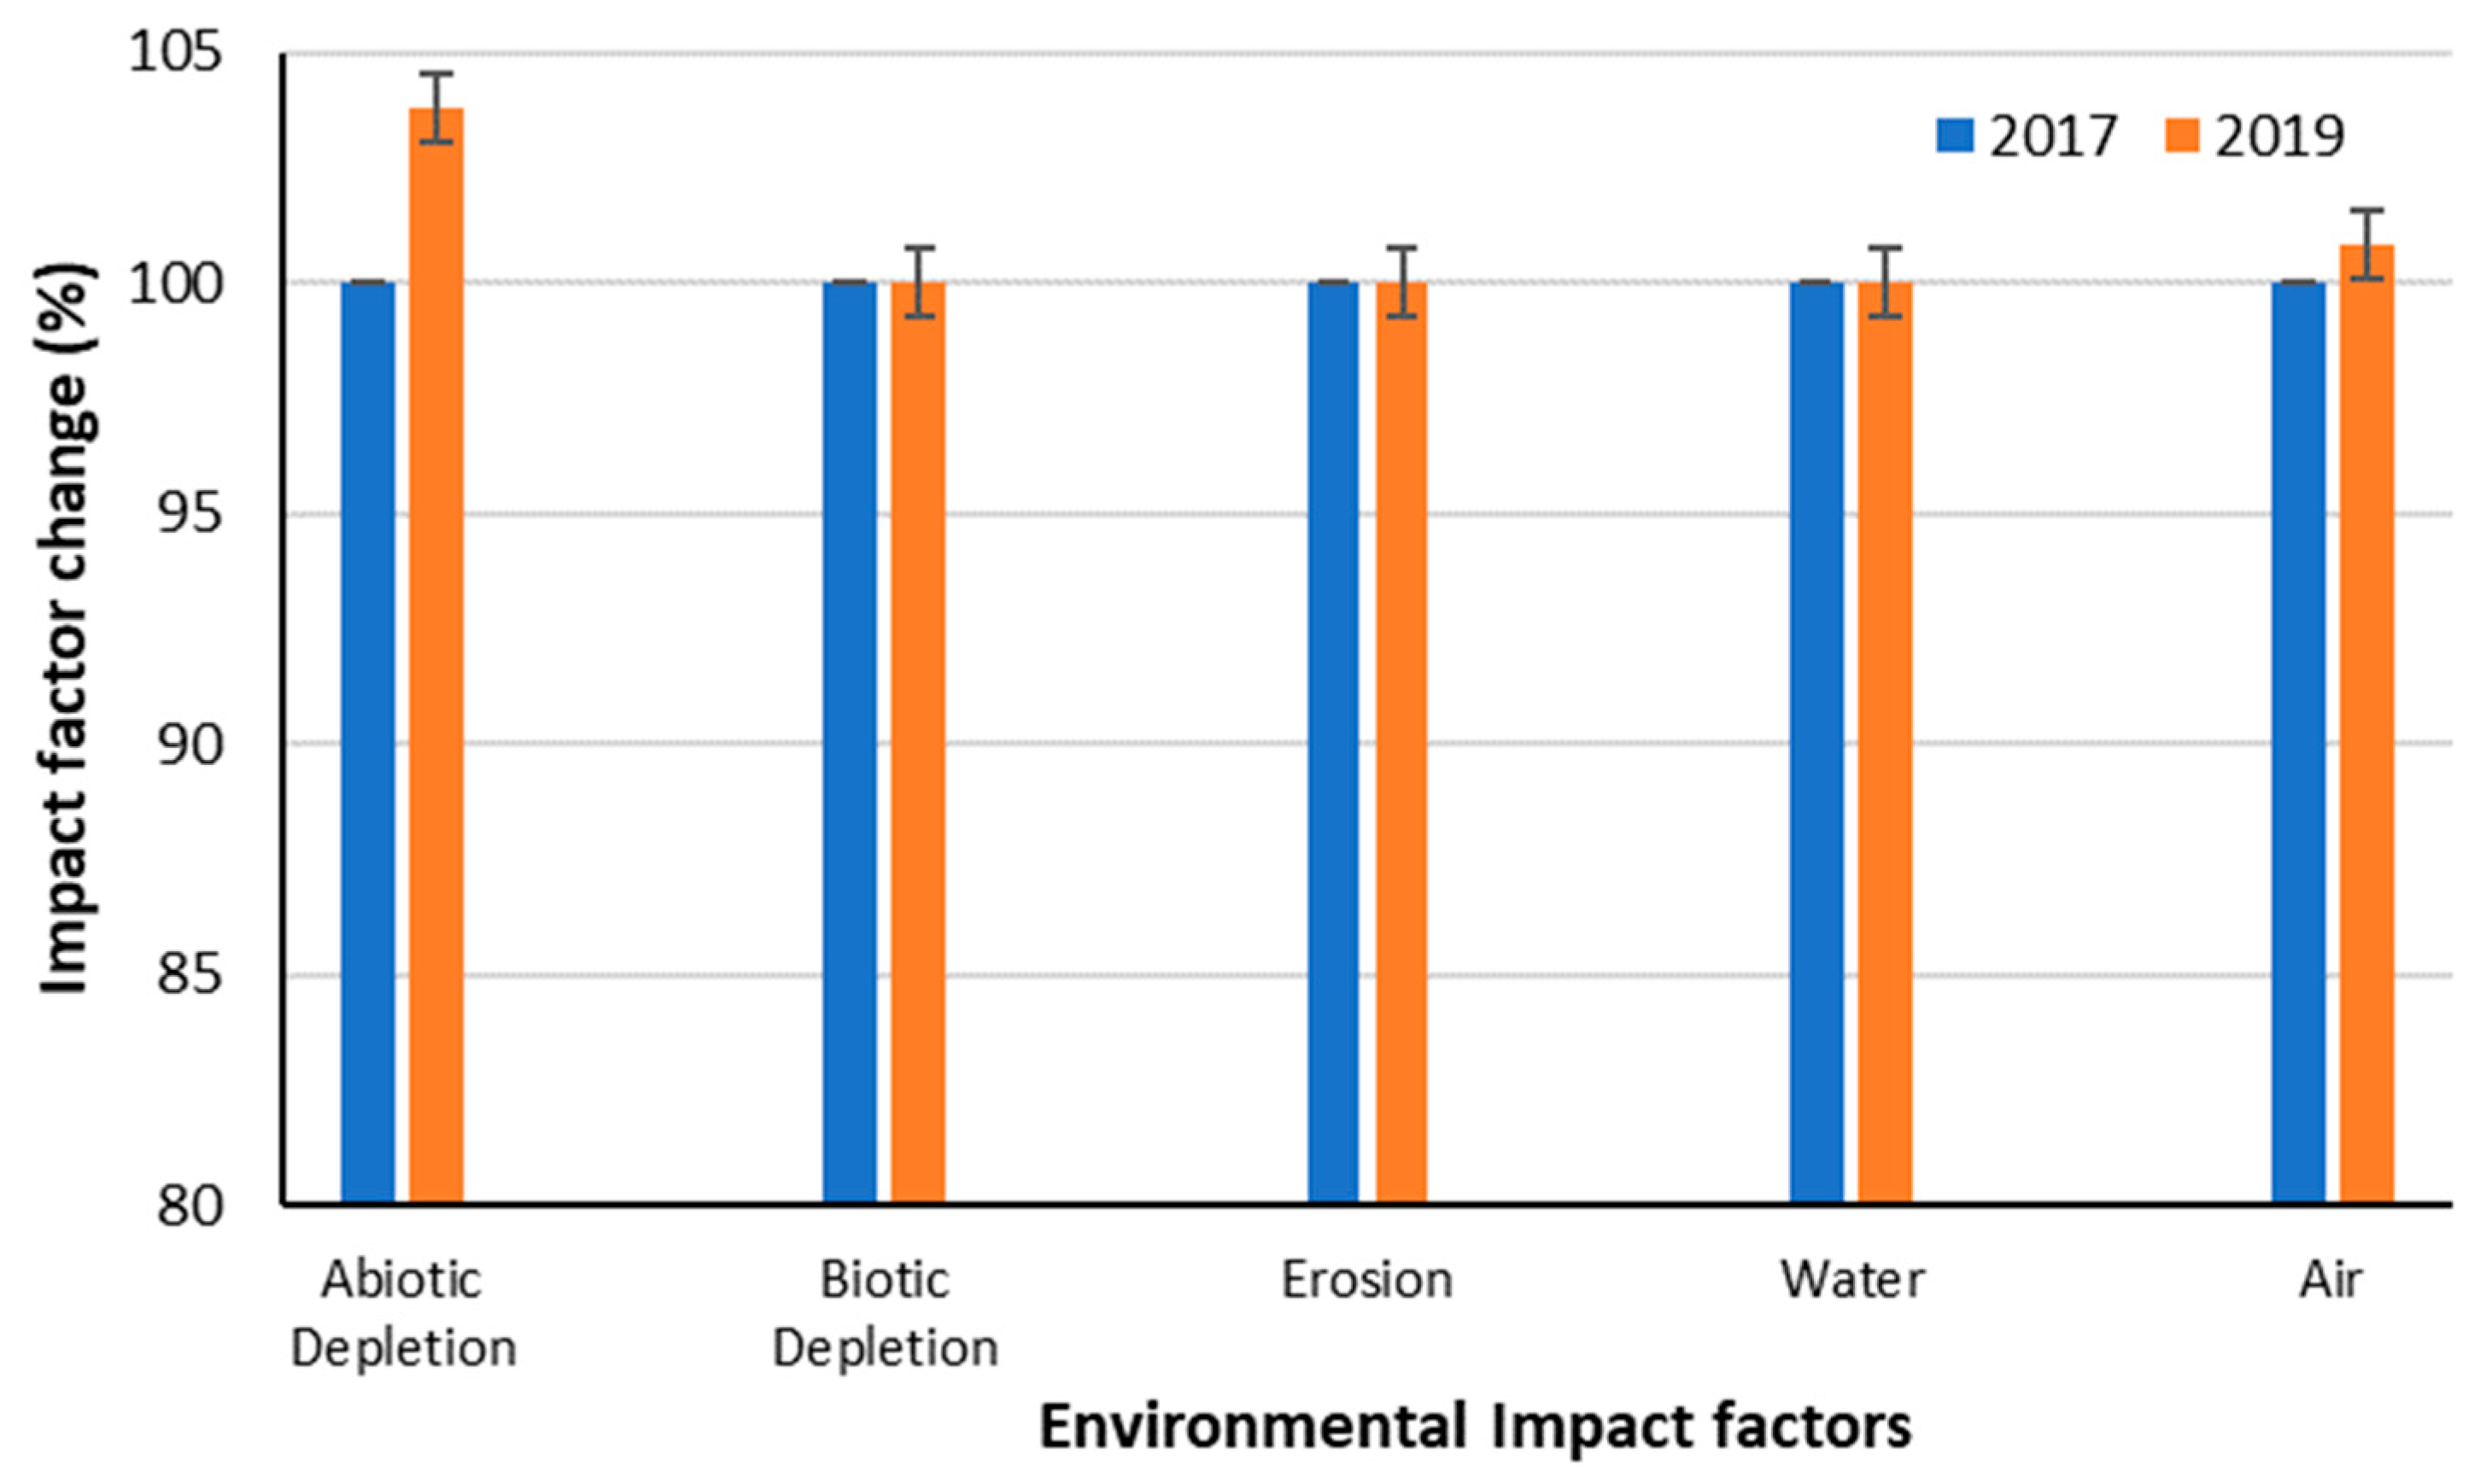
3.2.2. MIPS Evaluation Based on “Selected Product”
3.3. Sustainability Assessment Based on “Wet Process”
3.3.1. LCA Evaluation Based on “Wet Process”
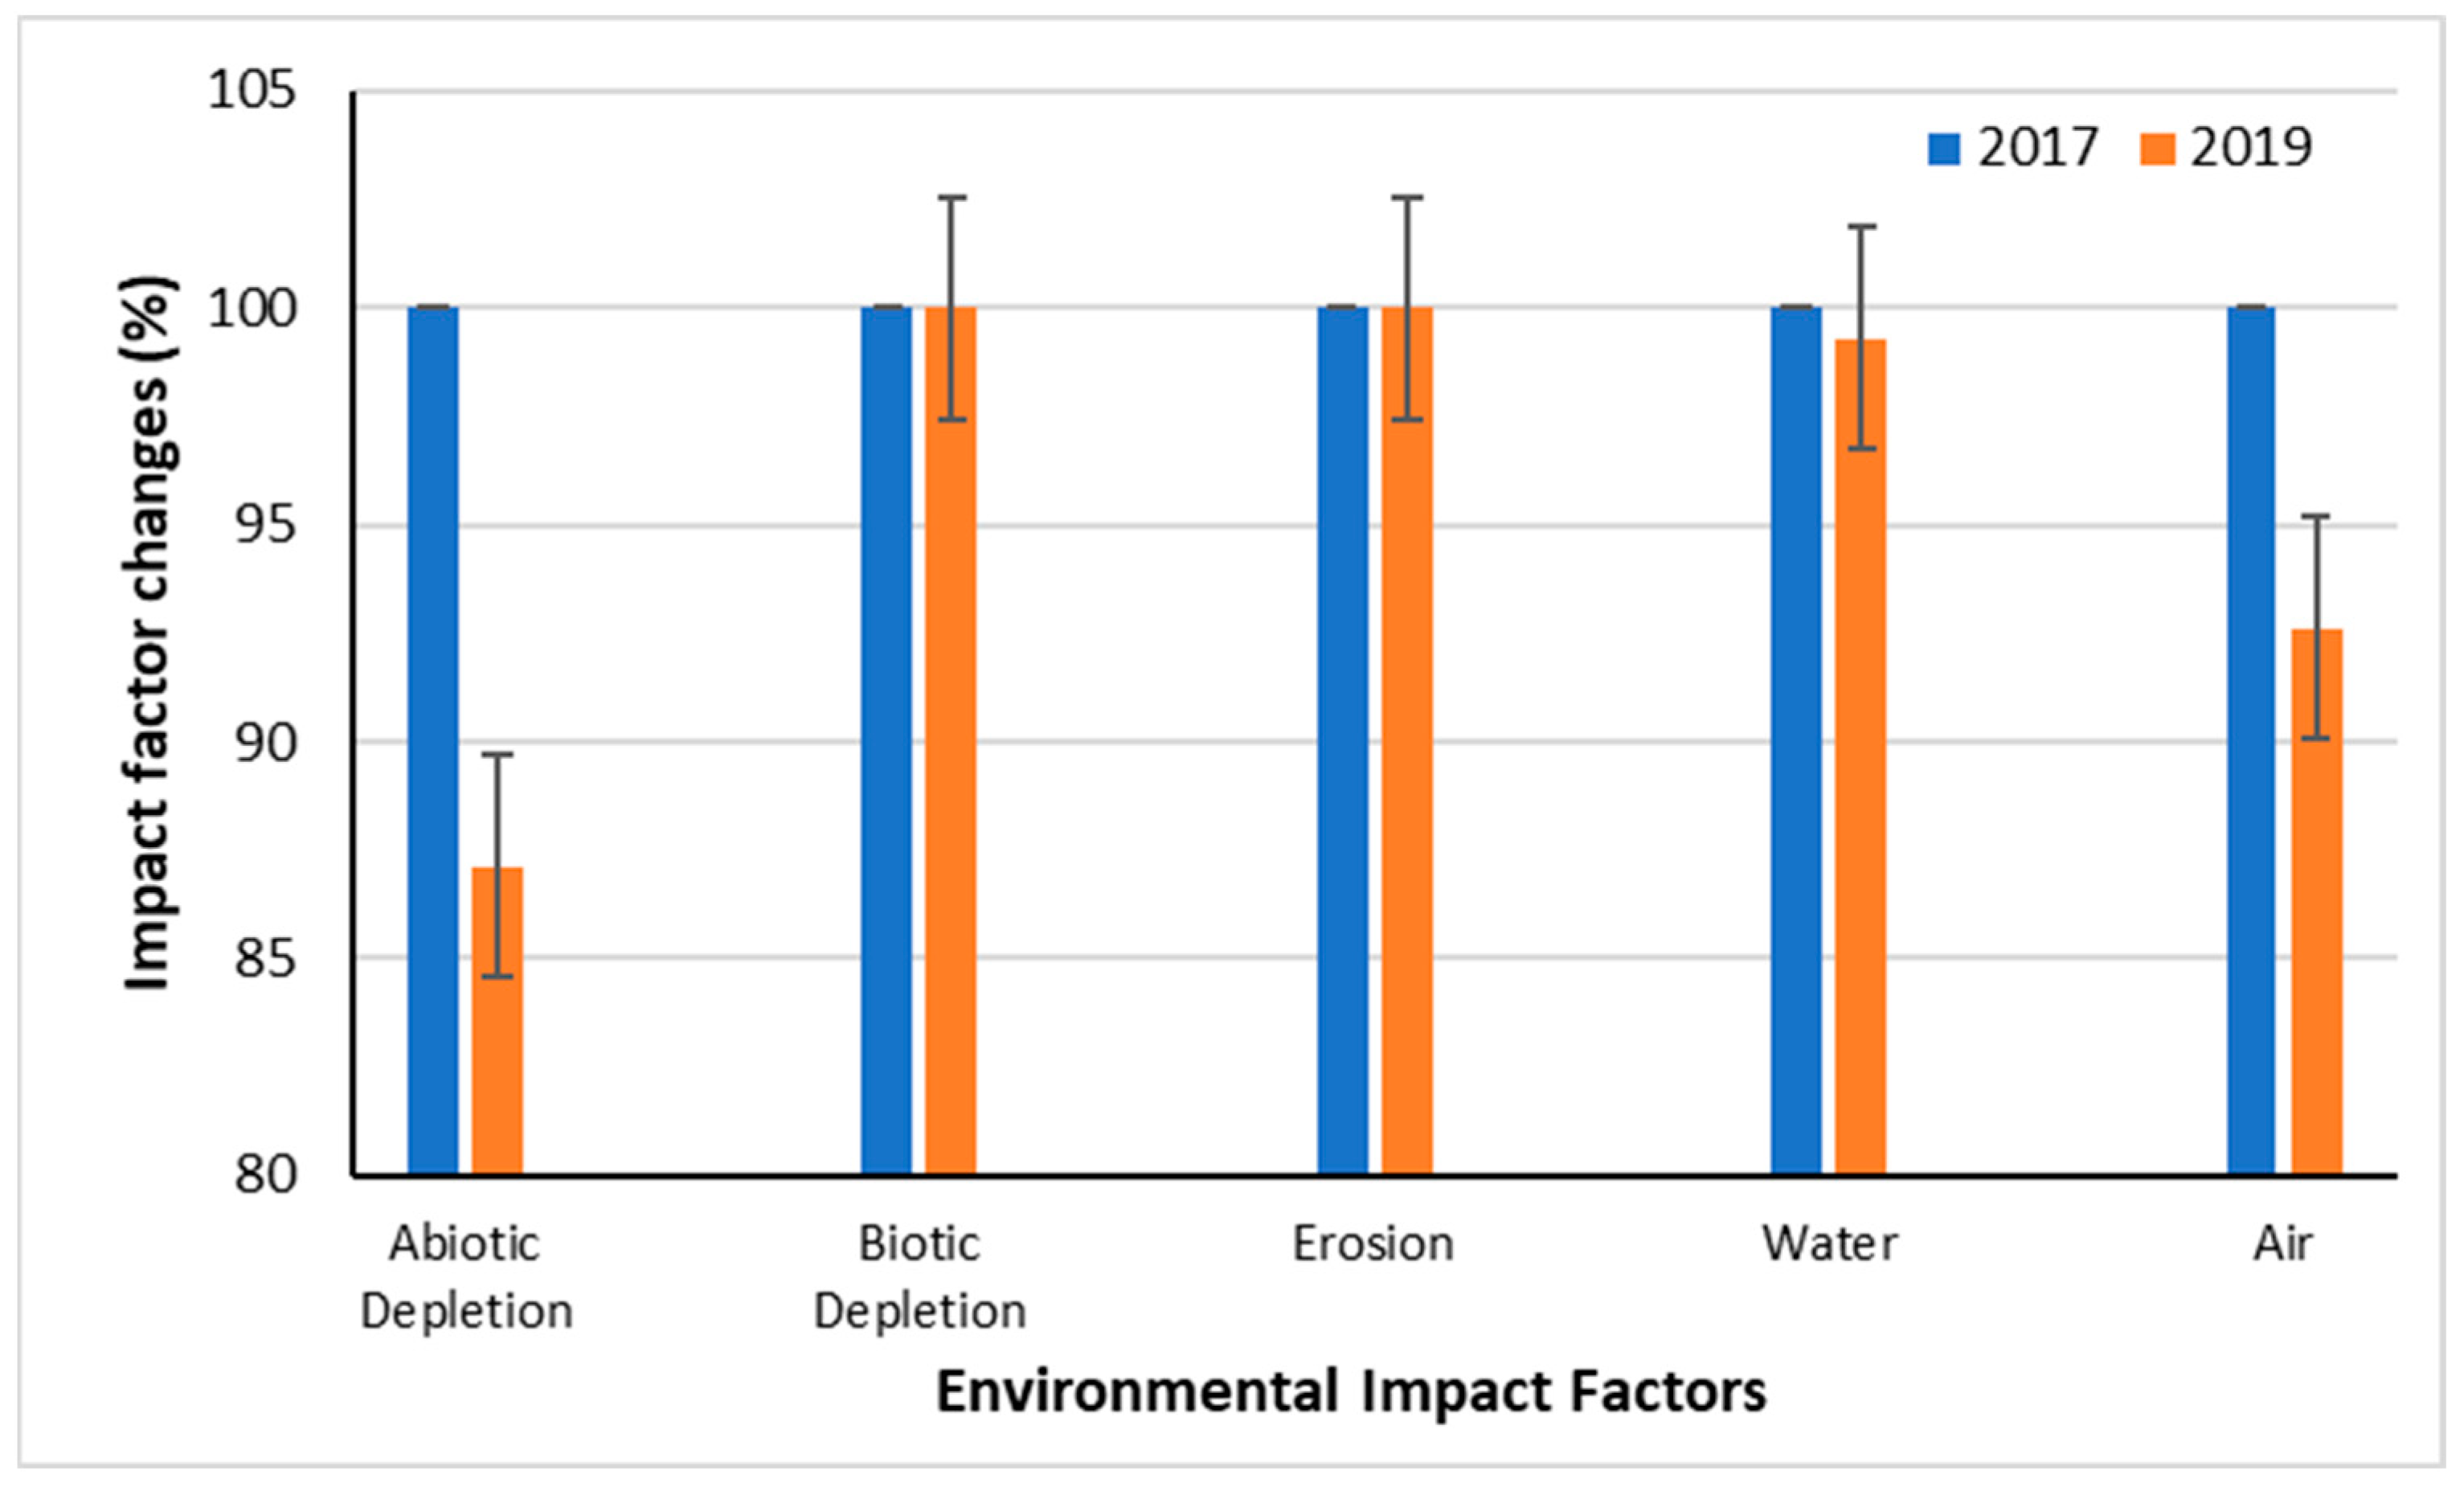
3.3.2. MIPS Evaluation Based on “Wet Process”
3.4. General Evaluations
4. Conclusions and Prospects
- It is recommended to use “total production capacity-based” data to evaluate the contribution to sustainability and SDGs in denim production.
- In the sustainability evaluation according to “total production capacity,” it was determined that approximately 12% had been contributed to SDG 12 with both the LCA and MIPS approaches.
- Although there are inconsistencies in the LCA and MIPS results, it is predicted that there are economic and environmental gain potentials related to SDGs 13, 14, and 15, and the sustainable production potential of the factory can be increased in line with these targets.
- The targets that need to be worked on to increase the sustainable production potential in the denim sector were determined to be SDGs 9, 12, 13, 14, and 15.
- It is possible to say that cotton and electricity consumption are the most important sources of the environmental impact in the denim sector.
- The examined LCA and MIPS sustainability assessment methods did not generally yield consistent results within the scope of determining the contributions to UNEP 2030 SDGs in denim production. This shows that both methods alone produce results in a narrow framework, and there is a need for research and the development of integrated sustainability assessment methods for a more reliable and accurate sustainability assessment in a wider framework.
- It is thought that the findings will provide opportunities and focal points for the determination of cleaner production practices to be implemented in the factory in the future.
- It is thought that the study will guide the readers, researchers, and especially, denim manufacturers about associating the sustainable production potential with the SDGs. It is important to develop the work carried out in a single factory to apply it to the entire denim industry in the future and to create an integrated and standardized approach for the denim industry.
Author Contributions
Funding
Informed Consent Statement
Data Availability Statement
Conflicts of Interest
Abbreviations
| SDG | Sustainable development goal |
| LCA | Life Cycle Assessment |
| MIPS | Material Input per Service of Unit |
| UNEP | United Nations environment program |
| ISO | International organization for standardization |
| TS | Turkish standard |
| TS-EN-ISO | Quality management certification system |
| TS ISO | Quality Management system |
| CML | An impact assessment category |
| CML-IA | A database that contains characterization factors for life cycle impact assessment |
| ODP | Ozone layer depletion |
| MI | Material Input |
| MIT | Total material density |
| MIF | Mass density factor |
| MIC | Mass Intensity per Compartment |
| EU25 | A Normalization method |
References
- Paul, R. Denim: Manufacture, Finishing, and Applications; Woodhead Publishing: Cambridge, UK, 2015; pp. 1–11. ISBN 10:9780857098436. [Google Scholar]
- Morali, E.K.; Uzal, N.; Yetiş, U. Ozonation pre and post-treatment of denim textile mill effluents: Effect of cleaner production measures. J. Clean. Prod. 2016, 137, 1–9. [Google Scholar] [CrossRef]
- Venkatraman, P.D.; Liauw, C.M. Use of a carbon dioxide laser for environmentally beneficial generation of distressed/faded effects on indigo-dyed denim fabric: Evaluation of colour change, fibre morphology, degradation and textile properties. Opt. Laser Technol. 2019, 111, 701–713. [Google Scholar] [CrossRef]
- Fidan, F.Ş.; Aydoğan, E.K.; Uzal, N. An integrated life cycle assessment approach for denim fabric production using recycled cotton fibers and combined heat and power plant. J. Clean. Prod. 2021, 287, 125439. [Google Scholar] [CrossRef]
- UNEP. The United Nations Environment Programme And The 2030 Agenda. Global Action For People And The Planet. 2015, p. 8. Available online: https://wedocs.unep.org/20.500.11822/9851 (accessed on 10 October 2022).
- Cai, Y.J.; Choi, T.M. A United Nations’ Sustainable Development Goals perspective for sustainable textile and apparel supply chain management. Transp. Res. E Logist. Transp. Rev. 2020, 141, 102010. [Google Scholar] [CrossRef] [PubMed]
- Luken, R.A.; Saieed, A.; Magvasi, M. Industry-related sustainable development Goal-9 progress and performance indices and policies for Sub-Saharan African countries. Environ. Dev. 2022, 42, 100694. [Google Scholar] [CrossRef]
- Kumar, V.; Agrawal, T.K.; Wang, L.; Chen, Y. Contribution of traceability towards attaining sustainability in the textile sector. Text. Cloth. Sustain. 2017, 3, 5. [Google Scholar] [CrossRef] [Green Version]
- Panigrahi, S.S.; Rao, N.S. A stakeholders’ perspective on barriers to adopt sustainable practices in MSME supply chain: Issues and challenges in the textile sector. Res. J. Text. Appar. 2018, 22, 59–76. [Google Scholar] [CrossRef]
- de Oliveira Neto, G.C.; Ferreira Correia, J.M.; Silva, P.C.; de Oliveira Sanches, A.G.; Lucato, W.C. Cleaner Production in the textile industry and its relationship to sustainable development goals. J. Clean. Prod. 2019, 228, 1514–1525. [Google Scholar] [CrossRef]
- Blackburn, W.R. The Sustainability Handbook: The Complete Management Guide to Achieving Social, Economic and Environmental Responsibility; Earthscan: London, UK, 2012; p. 550. ISBN 978-1-84407-495-2. [Google Scholar]
- de Oliveira Neto, G.C.; de Sousa, W.C. Economic and environmental advantage evaluation of the reverse logistic implementation in the supermarket retail. IFIP Adv. Inf. Commun. Technol. 2014, 197–204. [Google Scholar]
- Klemeš, J.J. Assessing and Measuring Environmental Impact and Sustainability; Elsevier Ltd.: Amsterdam, The Netherlands, 2015; ISBN 978-0-12-799968-5. [Google Scholar]
- Tarne, P. Life Cycle Sustainability Assessment at An Automotive Company. Ph.D. Thesis, Technical University of Berlin, Berlin, Germany, 2019. [Google Scholar] [CrossRef]
- Janjua, S.Y.; Sarker, P.K.; Biswas, W.K. Development of triple bottom line indicators for life cycle sustainability assessment of residential bulidings. J. Environ. Manag. 2020, 264, 110476. [Google Scholar] [CrossRef]
- Shrivastava, S.; Unnikrishnan, S. Life cycle sustainability assessment of crude oil in India. J. Clean. Prod. 2021, 283, 124654. [Google Scholar] [CrossRef]
- Aghbashlo, M.; Khounani, Z.; Hosseinzadeh-Bandbafha, H.; Gupta, V.K.; Amiri, H.; Lam, S.S.; Morosuk, T.; Tabatabaei, M. Exergoenvironmental analysis of bioenergy systems: A comprehensive review. Renew. Sustain. Energy Rev. 2021, 149, 111399. [Google Scholar] [CrossRef]
- Aghbashlo, M.; Hosseinzadeh-Bandbafha, H.; Shahbeik, H.; Tabatabaei, M. The role of sustainability assessment tools in realizing bioenergy and bioproduct systems. Biofuel Res. J. 2022, 9, 1697–1706. [Google Scholar] [CrossRef]
- International Organization for Standardization. Environmental Management: Life Cycle Assessment: Principles and Framework; ISO: Geneva, Switzerland, 2006; p. 14040. Available online: https://www.iso.org/standard/37456.html (accessed on 8 October 2022).
- International Organization for Standardization. Environmental Management: Life Cycle Assessment: Principles and Framework, 2nd ed.; ISO: Geneva, Switzerland, 2006; p. 14044. Available online: https://www.iso.org/standard/37456.html (accessed on 8 October 2022).
- Finkbeiner, M.; Schau, E.M.; Lehmann, A.; Traverso, M. Towards life cycle sustainability assessment. Sustainability 2010, 2, 3309–3322. [Google Scholar] [CrossRef] [Green Version]
- Demirer, G.N. Pratik yaşam döngüsü analizi kılavuzu AB sürecinde işletmeler ve kamu için yaşam döngüsü analizi yöntem ve örnekleri. Sürdürülebilir Üretim Ve Tüketim Yayınları-1 2017, 44. [Google Scholar]
- Akı, S.U.; Candan, C.; Nergis, B.; Önder, N.S. Understanding denim recycling: A quantitative study with lifecycle assessment methodology. In Waste in Textile and Leather Sectors; IntechOpen: London, UK, 2020. [Google Scholar] [CrossRef]
- Zhao, M.; Zhou, Y.; Meng, J.; Zheng, H.; Cai, Y.; Shan, Y.; Yang, Z. Virtual carbon and water flows embodied in global fashion trade-a case study of denim products. J. Clean. Prod. 2021, 303, 127080. [Google Scholar] [CrossRef]
- Chico, D.; Aldaya, M.M.; Garrido, A. A water footprint assessment of a pair of jeans: The influence of agricultural policies on the sustainability of consumer products. J. Clean. Prod. 2013, 57, 238–248. [Google Scholar] [CrossRef] [Green Version]
- Roos, S.; Sandin, G.; Zamani, B.; Peters, G. Environmental Assessment of Swedish Fashion Consumption. In Five Garments–Sustainable Futures. Mistra Future Fashion; Future Fashion Consortium: Gånghester, Sweden, 2015; Available online: https://refashion.fr/ecodesign/sites/default/files/fichiers/Environmental%20assessment%20of%20Swedish%20fashion%20consumption.pdf (accessed on 11 October 2022).
- Karthik, T.; Murugan, R. Carbon Footprint in Denim Manufacturing. In Sustainability in Denim; Woodhead Publishing: Sawston, UK, 2017; pp. 125–159. [Google Scholar] [CrossRef]
- Vos, R.O. The spatially explicit water footprint of blue jeans: Spatial methods in action for sustainable consumer products and corporate management of water. Case Stud. Environ. 2019, 3, 1–14. [Google Scholar] [CrossRef]
- Schmidt-Bleek, F.; Bierter, W. Das MIPS-Konzept:Weniger Naturverbrauch-Mehr Lebensqualität durch Faktor 10; Droemer Knaur: München, German, 1998; ISBN 9783426269824. [Google Scholar]
- Bringezu, S.; Bleischwitz, R. Sustainable Resource Management: Global Trends, Visions and Policies; Routledge: Oxfordshire, UK, 2009; ISBN 9781906093266. [Google Scholar]
- Schmidt-Bleek, F. Wieviel Umwelt braucht der Mensch: MIPS—Das Maß Für Ökologisches Wirtschaften; Springer-Verlag: Munich, German, 2013; ISBN 978-3-0348-5651-5. [Google Scholar]
- Lettenmeier, M.; Rohn, H.; Liedtke, C.; Schmidt-Bleek, F.; Bienge, K.; Urbaneja, D.M.; Buddenberg, J. Resource productivity in 7 steps: How to develop eco-innovative products and services and improve their material footprint (No. 41). Wupp. Inst. Clim. Environ. Energy 2009, 41, 56. [Google Scholar]
- Mancini, L. Food Habits and Environmental Impact: An Assessment of the Natural Resource Demand in Three Agri-Food Systems; Wuppertal Institut für Klima, Umwelt, Energie: Ancona, İtaly, 2012; p. 175. Available online: https://epub.wupperinst.org/frontdoor/index/index/docId/4301 (accessed on 14 October 2022).
- Liedtke, C.; Bienge, K.; Wiesen, K.; Teubler, J.; Greiff, K.; Lettenmeier, M.; Rohn, H. Resource Use in the Production and Consumption System—The MIPS Approach. Resources 2014, 3, 544–574. [Google Scholar] [CrossRef] [Green Version]
- Zamcopé, F.C.; Ensslin, L.; Ensslin, S.R. Construction of a model for corporate sustainability assessment: A case study in the textile industry. Gestão Produção 2012, 19, 303–321. [Google Scholar] [CrossRef]
- Kabir, S.M.F.; Chakraborty, S.; Hoque, S.M.A.; Mathur, K. Sustainability Assessment of Cotton-Based Textile Wet Processing. Clean. Technol. 2019, 1, 232–246. [Google Scholar] [CrossRef] [Green Version]
- SimaPro. PRé Sustainability. 2018. Available online: https://www.pre-sustainability.com (accessed on 13 October 2022).
- Ritthoff, M.; Rohn, H.; Liedtke, C. Calculating MIPS: Resource productivity of products and services. Wupp. Inst. Clim. Environ. Energy 2002, 27e, 52. Available online: https://nbn-resolving.org/urn:nbn:de:101:1-200910191108 (accessed on 3 October 2022).
- Schmidt-Bleek, F.; Bringezu, S.; Hinterberger, F.; Liedtke, C.; Spangenberg, J.; Stiller, H.; Welfens, M.J. Einführung in die Material Intensitäts-Analyse nach dem MIPS-Konzept. In MAIA: Einführung in die Material-Intensitäts-Analyse nach dem MIPS-Konzept; Birkhäuser: Berlin, Germany, 1999; 58p. [Google Scholar]
- Aoe, T.; Michiyasu, T. “Ecological rucksack” of high-definition TVs. Mater. Trans. 2005, 46, 2561–2566. [Google Scholar] [CrossRef] [Green Version]
- Wuppertal Institute. Calculating MIPs, Resources Productivity of Products and Services. 2015. Available online: http://wupperinst.org/uploads/tx_wupperinst/MIT_2015.pdf (accessed on 22 April 2018).
- Alkaya, E.; Demirer, G.N. Sustainable textile production: A case study from a woven fabric manufacturing mill in Turkey. J. Clean. Prod. 2014, 65, 595–603. [Google Scholar] [CrossRef]
- Zhang, H.; Gao, A.; Song, X.; Hou, A. Cleaner production applied to urea-free printing of cotton fabrics using polyethylene glycol polymers as alternative additives. J. Clean. Prod. 2016, 124, 126–131. [Google Scholar] [CrossRef]
- Wang, Q.L.; Li, W.; Gao, X.; Li, S.J. Life cycle assessment on biogas production from straw and its sensitivity analysis. Bioresour. Technol. 2016, 201, 208–214. [Google Scholar] [CrossRef] [PubMed]
- Shimako, A.H.; Tiruta-Barna, L.; de Faria, A.B.B.; Ahmadi, A.; Spérandio, M. Sensitivity analysis of temporal parameters in a dynamic LCA framework. Sci. Total Environ. 2018, 624, 1250–1262. [Google Scholar] [CrossRef]
- Liu, Y.; Huang, H.; Zhu, L.; Zhang, C.; Ren, F.; Liu, Z. Could the recycled yarns substitute for the virgin cotton yarns: A comparative LCA. Int. J. Life Cycle Assess. 2020, 25, 2050–2062. [Google Scholar] [CrossRef]
- Backes, J.G.; Traverso, M. Life cycle sustainability assessment as a metrics towards SDGs agenda 2030. Curr. Opin. Green Sustain. Chem. 2022, 38, 100683. [Google Scholar] [CrossRef]


| SDG | Social | SDG | Economic | SDG | Environmental |
|---|---|---|---|---|---|
| (1) | End poverty | (8) | Decent Work and Economic Growth | (6) | Clean Water and Sanitation |
| (2) | End hunger | (9) | Industry, Innovation, and Infrastructure | (7) | Accessible and Clean Energy |
| (3) | Healthy individuals | (10) | Reducing Inequalities | (13) | Climate Action |
| (4) | Qualified Education | (12) | Responsible Production and Consumption | (14) | Life in the water |
| (5) | Gender Equality | (17) | Partnerships for Goals | (15) | Life on land |
| (11) | Sustainable Cities and Living Spaces | (17) | Partnerships for Goals | ||
| (16) | Peace, Justice, and Strong Institutions | ||||
| (17) | Partnerships for Goals |
| Impact Category | Unit |
|---|---|
| Abiotic depletion (elements and final reserves) | kg Sb eq |
| Abiotic depletion (fossil fuels) | MJ |
| Global warming (GWP100a) | kg CO2 eq |
| Ozone layer depletion (ODP) | kg CFC-11 eq |
| Human toxicity | kg 1,4-DB eq |
| Freshwater aquatic ecotox. | kg 1,4-DB eq |
| Marine aquatic ecotoxicity | kg 1,4-DB eq |
| Terrestrial ecotoxicity | kg 1,4-DB eq |
| Photochemical oxidation | kg C2H4 eq |
| Acidification | kg SO2 eq |
| Eutrophication | kg PO4 eq |
| Total Water Use | m3 |
| Total Water Use (life cycle group) | UBP |
| Total Water Use (Hoekstra) | m3 |
| Material | Unit | 2017 | 2019 |
|---|---|---|---|
| Total fabric produced/year | ton | 13,069,514.00 | 17,400,000.00 |
| Cotton | kg | 1175.00 | 1175.00 |
| Electric | kWh | 654.71 | 619.51 |
| Natural gas | MJ | 29,330.20 | 24,270.72 |
| Sodium hydroxide, without water, in a 50% solution state | kg | 468.31 | 457.02 |
| Diresul Black RDT M, Sulfur, Chemical, inorganic | kg | 77.90 | 58.14 |
| Acetic acid, without water, in 98% solution state | kg | 58.08 | 56.20 |
| Indigo, INDIGO | kg | 27.96 | 37.13 |
| Antioxidant B | kg | 24.98 | - |
| Prosize AFN, Starch Maize starch | kg | 19.31 | 47.80 |
| Hydrosulfide Sodium hydrosulfide | kg | 15.50 | 19.28 |
| Organic Chemistry | kg | 36.00 | 88.10 |
| Chemical, inorganic | kg | 18.07 | - |
| Oxidante Bri | kg | 8.09 | 11.37 |
| Saquest FCT, Ion Sequestrant, Phosphoric acid | kg | 6.07 | 7.11 |
| Arkofil CO, Acrylic acid | kg | 5.41 | 9.15 |
| Optisize, Vinyl Acetate Vinyl acetate | kg | 3.56 | 2.63 |
| Belsoft 300, Fatty alcohol sulfate | kg | 3.23 | 2.62 |
| DNG Blue Notear (Resinblue), Acrylic Polymer | kg | 3.00 | 1.25 |
| Hydrogen peroxide | kg | 2.91 | 4.36 |
| Antioxidant M | kg | 2.41 | - |
| Sodium sulfate, anhydrite | kg | 1.79 | 1.38 |
| Cerat 985, Wax, lost-wax casting | kg | 1.62 | 1.95 |
| Sodium silicate, solid | kg | 1.57 | 1.04 |
| Sodium hypochlorite, without water, in a 15% solution state | kg | 1.52 | 1.30 |
| Floranit 40/2B, Ethoxylated alcohol | kg | 1.51 | 1.65 |
| Soda ash, light, crystalline, heptahydrate | kg | 1.38 | 0.76 |
| Evo Fin PE, Wax, lost-wax casting | kg | 1.05 | - |
| Rucofin MES, Silicone product | kg | 0.85 | - |
| Setalan SW Dispergator, Naphthalene sulfonic acid | kg | 0.80 | 0.77 |
| Colorsize IQ Size, Acrylic Polymer | kg | 0.79 | 0.64 |
| Cottoclorin Arrow Dispergator | kg | 0.70 | 0.57 |
| Belfoft EG, Fatty alcohol sulfate | kg | 0.64 | - |
| Expanded perlite | kg | 0.62 | - |
| Alfalina PRM New, Silicone product | kg | - | 0.69 |
| Antioxidant M | kg | - | 2.88 |
| Antioxidant BB | kg | - | 31.92 |
| Arkofil CO, Methanol | kg | - | 1.18 |
| Benzyl alcohol | kg | - | 0.75 |
| Cerofil LF, Wax, lost-wax casting | kg | - | 1.78 |
| Denimblue 30, INDIGO | kg | - | 1.13 |
| Optisize, Vinyl Acetate Vinyl acetate | kg | - | 1.43 |
| Optisize WX-B, Wax, lost-wax casting | kg | - | 0.67 |
| Product RD 462, Acrylic Polymer Acrylic dispersion | kg | - | 11.36 |
| Product RD 611, Acrylic Polymer | kg | - | 0.66 |
| Sodium chloride powder | kg | - | 9.02 |
| Rucowet DWA, Alkylbenzene sulfonate, linear | kg | - | 2.88 |
| Serawet M-BK wetting agent, Ethylene glycol | kg | - | 2.91 |
| Waste Water Amount (for the total factory) | m3 | 2,080,090.00 | 2,312,891.00 |
| BOD5 | kg | 570,627.70 | 673,143.80 |
| COD | kg | 2,282,690.77 | 2,692,598.30 |
| Impact Category | Unit | 2017 | 2019 |
|---|---|---|---|
| Abiotic depletion (elements, final reserves) | kg Sb eq | 2.81 × 10⁻⁵ | 2.49 × 10⁻⁵ |
| Abiotic depletion (fossil fuels) | MJ | 112 | 143 |
| Global warming (GWP100a) | kg CO2 eq | 8.20 | 7.50 |
| Ozone layer depletion (ODP) | kg CFC-11 eq | 1.53 × 10⁻⁶ | 1.65 × 10⁻⁶ |
| Human toxicity | kg 1.4-DB eq | 3.11 | 2.92 |
| Freshwater aquatic ecotox. | kg 1.4-DB eq | 30.40 | 26.30 |
| Marine aquatic ecotoxicity | kg 1.4-DB eq | 7.33 × 10³ | 6.54 × 10³ |
| Terrestrial ecotoxicity | kg 1.4-DB eq | 2.21 | 1.90 |
| Photochemical oxidation | kg C2H4 eq | 0.0022 | 0.0023 |
| Acidification | kg SO2 eq | 0.0556 | 0.0545 |
| Eutrophication | kg PO4 eq | 0.0246 | 0.0212 |
| Total Water Use | m3 | 2.96 | 2.54 |
| Total Water Use (life cycle group) | UBP | 803 | 691 |
| Total Water Use (Hoekstra) | m3 | 1.32 | 1.13 |
| Unit | Abiotic Depletion | Biotic Depletion | Erosion | Water | Air | |
|---|---|---|---|---|---|---|
| 2017 | kg/kg | 54,772.45 | 3407.50 | 5886.75 | 8255.64 | 4169.40 |
| 2019 | kg/kg | 48,251.58 | 3407.50 | 5886.75 | 8231.81 | 4128.75 |
| Change | % | 11.91 | 0.00 | 0.00 | 0.29 | 0.98 |
| Material | Unit | 2017 | 2019 |
|---|---|---|---|
| Type production | ton | 408.72 | 769.65 |
| Cotton | kg | 1175.00 | 1175.00 |
| Electric | kWh | 99,028.51 | 118,668.90 |
| Natural gas | MJ | 1.40 | 1.06 |
| Sodium hydroxide | kg | 87,650.20 | 165,053.20 |
| Floranit 40/2B, Ethoxylated alcohol (AE11) | kg | 1255.86 | 2364.90 |
| Saquest FCT, Ion Sequestrant, Phosphoric acid | kg | 1912.15 | 3600.75 |
| Antioxidant B, Chemical, inorganic | kg | 6037.14 | 11,368.48 |
| Rucowet DWA, Alkylbenzene sulfonate | kg | 1837.43 | 3460.04 |
| Acetic acid | kg | 24,003.60 | 45,200.98 |
| Prosize AFN, Starch Maize starch | kg | 24,107.16 | 45,395.94 |
| Optisize, Vinyl Acetate | kg | 4767.77 | 8978.15 |
| Cerat 985, Wax | kg | 1324.28 | 2493.74 |
| Antioxidant BB, Chemical, inorganic | kg | 18,009.70 | 33,913.88 |
| Diresul Black RDT M, Sulfur | kg | 15,335.03 | 28,877.23 |
| Organic Chemistry, Chemical | kg | 81,454.62 | 153,386.30 |
| Water, decarbonized | kg | 71,660,636.00 | 1.13 × 10⁸ |
| Impact Category | Unit | 2017 | 2019 |
|---|---|---|---|
| Abiotic depletion (elements, final reserves) | kg Sb eq | 2.05 × 10⁻⁵ | 2.05 × 10⁻⁵ |
| Abiotic depletion (fossil fuels) | MJ | 55.90 | 55.90 |
| Global warming (GWP100a) | kg CO2 eq | 4.44 | 4.43 |
| Ozone layer depletion (ODP) | kg CFC-11 eq | 9.24 × 10⁻⁷ | 9.24 × 10⁻⁷ |
| Human toxicity | kg 1.4-DB eq | 2.08 | 2.07 |
| Freshwater aquatic ecotox. | kg 1.4-DB eq | 28.10 | 28.10 |
| Marine aquatic ecotoxicity | kg 1.4-DB eq | 4.43 × 10³ | 4.43 × 10³ |
| Terrestrial ecotoxicity | kg 1.4-DB eq | 2.09 | 2.09 |
| Photochemical oxidation | kg C2H4 eq | 0.00124 | 0.00124 |
| Acidification | kg SO2 eq | 0.0334 | 0.0324 |
| Eutrophication | kg PO4 eq | 0.0153 | 0.0153 |
| Total Water Use | m3 | 2.81 | 2.77 |
| Total Water Use (life cycle group) | UBP | 761 | 758 |
| Total Water Use (Hoekstra) | m3 | 1.25 | 1.23 |
| Unit | Abiotic Depletion | Biotic Depletion | Erosion | Water | Air | |
|---|---|---|---|---|---|---|
| 2017 | kg/kg | 15,032.21 | 3407.50 | 5886.75 | 8,049,087.62 | 3584.87 |
| 2019 | kg/kg | 15,608.81 | 3407.50 | 5886.75 | 8,051,025.41 | 3614,32 |
| Change | % | −3.84 | 0.00 | 0.00 | −0.02 | −0.82 |
| Material | Unit | 2017 | 2019 |
|---|---|---|---|
| Cotton | kg | 1000.00 | 1000.00 |
| Water | m3 | 86.00 | 54.93 |
| Hydroxide, without water, in a 50% solution state | kg | 813.42 | 457.02 |
| Diresul Black RDT M, Sulfur, Chemical, inorganic | kg | 135.31 | 58.4 |
| Indigo, INDIGO | kg | 48,57 | 37.13 |
| Antioxidant B, Chemical, inorganic | kg | 43.40 | - |
| Prosize AFN, Starch Maize starch | kg | 33.54 | 47.80 |
| Hydrosulfite, Sodium hydrosulfide | kg | 26.92 | 19.28 |
| Saquest FCT, Ion Sequestrant, Phosphoric acid | kg | 10.54 | 7.11 |
| Arkofil CO, Acrylic acid | kg | 9.40 | 9.15 |
| Optimize, Vinyl Acetate | kg | 6.19 | 2.63 |
| Antioxidant M, Chemical, inorganic | kg | 4.19 | 2.88 |
| Sodium sulfate, anhydrite | kg | 3.11 | - |
| Cerat 985, Wax, lost-wax casting | kg | 2.82 | 1.95 |
| Floranit 40/2B, Ethoxylated alcohol (AE11) | kg | 2.62 | 1.65 |
| Evo Fin PE, Wax, lost-wax casting | kg | 1.83 | - |
| Setalan SW Dispergator, Naphthalene sulfonic acid | kg | 1.40 | 0.77 |
| Colorsize IQ Size, Acrylic Polymer | kg | 1.37 | 0.64 |
| Cottoclorin Arrow Dispergator, Naphthalene sulfonic acid | kg | 1.22 | 0.57 |
| Water, decarbonized | kg | 85,996.39 | 37,887.7 |
| Natural gas, liquefied | m3 | 205.57 | 1051.48 |
| Electricity, high voltage | kWh | 23.43 | 10.73 |
| Alfalina PRM New, Silicone product | kg | - | 0.69 |
| Antioxidant BB, Chemical, inorganic | kg | - | 31.92 |
| Arkofil CO, Methanol | kg | - | 1.18 |
| Cerofil LF, Wax, lost-wax casting | kg | - | 1.78 |
| Optisize, Vinyl Acetate Vinyl acetate | kg | - | 1.43 |
| Optisize WX-B, Wax, lost-wax casting | kg | - | 0.67 |
| Rucowet DWA, Alkylbenzene sulfonate, linear, petrochemical | kg | - | 2.88 |
| Serawet M-BK wetting agent, Ethylene glycol | kg | - | 2.91 |
| Impact Category | Unit | 2017 | 2019 |
|---|---|---|---|
| Abiotic depletion (elements, final reserves) | kg Sb eq | 2.72 × 10⁻⁵ | 2.59 × 10⁻⁵ |
| Abiotic depletion (fossil fuels) | MJ | 58.1 | 120 |
| Global warming (GWP100a) | kg CO2 eq | 4.62 | 5.28 |
| Ozone layer depletion (ODP) | kg CFC-11 eq | 1.25 × 10⁻⁶ | 9.58 × 10⁻⁷ |
| Human toxicity | kg 1,4-DB eq | 2.09 | 2.31 |
| Freshwater aquatic ecotox. | kg 1,4-DB eq | 24.40 | 24.50 |
| Marine aquatic ecotoxicity | kg 1,4-DB eq | 5.24 × 10³ | 5.34 × 10³ |
| Terrestrial ecotoxicity | kg 1,4-DB eq | 1.79 | 1.79 |
| Photochemical oxidation | kg C2H4 eq | 0.00122 | 0.00172 |
| Acidification | kg SO2 eq | 0.0348 | 0.0441 |
| Eutrophication | kg PO4 eq | 0.0151 | 0.015 |
| Total Water Use | m3 | 2.35 | 2.31 |
| Total Water Use (life cycle group) | UBP | 644 | 641 |
| Total Water Use (Hoekstra) | m3 | 1.04 | 1.02 |
| Unit | Abiotic Depletion | Biotic Depletion | Erosion | Water | Air | |
|---|---|---|---|---|---|---|
| 2017 | kg/kg | 54,772.46 | 3407.50 | 5886.75 | 8,120,075.90 | 4169.40 |
| 2019 | kg/kg | 48,251.58 | 3407.50 | 5886.75 | 8,118,303.96 | 4128.75 |
| Change | % | 12.86 | 0.00 | 0.00 | 0.69 | 7.38 |
| UNEP 2030 SDGs | Environmental Impact Factor | Based on the Total Production Capacity (%) | Based on a Selected Product (%) | Based on the Wet Process (%) |
|---|---|---|---|---|
| 12 | Abiotic depletion (elements, final reserves) | 11.40 | 0 | 4.77 |
| Abiotic depletion (fossil fuels) | −27.67 | 0 | −106 | |
| 13 | Global warming (GWP100a) | 8.50 | 0.2 | −14. 28 |
| Ozone layer depletion (ODP) | −7.80 | 0 | 23.36 | |
| 14 | Freshwater aquatic ecotox. | 13.50 | 0 | −0.40 |
| Marine aquatic ecotoxicity | 10.70 | 0 | −1.90 | |
| Acidification | 1.97 | 0.1 | −26.72 | |
| Eutrophication | 13.80 | 0 | 0 | |
| 15 | Terrestrial ecotoxicity | 14 | 0 | 0 |
| UNEP 2030 SDGs | Environmental Impact Factor | Based on the Total Production Capacity (%) | Based on a Selected Product (%) | Based on the Wet Process (%) |
|---|---|---|---|---|
| 12 | Abiotic Depletion | 11.91 | −3.84 | 12.86 |
| 13 | Air | 0.98 | −0.82 | 7.38 |
| 14 | Water | 0.29 | −0.02 | 0.69 |
| 15 | Erosion | 0 | 0 | 0 |
| Input Source | Environmental Impact Percentage Change | |||||||||||
|---|---|---|---|---|---|---|---|---|---|---|---|---|
| Abiotic Depletion (kg Sb eq) | Abiotic Depletion (Fossil Fuels) (MJ) | Global Warming (GWP100a) (kg CO2 eq) | Ozone Layer Depletion (ODP) (kg CFC-11 eq) | Human Toxicity (kg 1,4-DB eq) | Freshwater Aquatic Ecotox. (kg 1,4-DB eq) | Marine Aquatic Ecotoxicity (kg 1,4-DB eq) | Terrestrial Ecotoxicity (kg 1,4-DB eq) | Photochemical Oxidation (kg C2H4 eq) | Acidification (kg SO2 eq) | Eutrophication (kg PO43− eq) | Total Water Use (m3) | |
| Electricity | 0.66 | 9.18 | 8.72 | 0.92 | 6.95 | 0.85 | 11.79 | 0.05 | 7.90 | 6.83 | 7.57 | 0.10 |
| Natural gas | 0.07 | 3.09 | 2.10 | 1.82 | 0.25 | 0.02 | 0.26 | 0.00 | 0.91 | 0.40 | 0.17 | 0.02 |
| Water | 0.56 | 0.64 | 0.65 | 0.39 | 0.80 | 0.21 | 1.11 | 0.02 | 0.83 | 0.46 | 0.46 | 5.48 |
| Coton | 18.62 | 6.81 | 9.55 | 11.35 | 12.78 | 23.56 | 7.06 | 24.84 | 9.43 | 13.30 | 14.78 | 19.24 |
| Dye chemicals | 4.25 | 3.16 | 2.67 | 9.20 | 3.20 | 0.31 | 3.74 | 0.08 | 4.58 | 3.17 | 1.63 | 0.13 |
Disclaimer/Publisher’s Note: The statements, opinions and data contained in all publications are solely those of the individual author(s) and contributor(s) and not of MDPI and/or the editor(s). MDPI and/or the editor(s) disclaim responsibility for any injury to people or property resulting from any ideas, methods, instructions or products referred to in the content. |
© 2023 by the authors. Licensee MDPI, Basel, Switzerland. This article is an open access article distributed under the terms and conditions of the Creative Commons Attribution (CC BY) license (https://creativecommons.org/licenses/by/4.0/).
Share and Cite
Sarı, B.; Zarifi, F.; Alhasan, M.; Güney, H.; Türkeş, S.; Sırlıbaş, S.; Civan Yiğit, D.; Kılınççeker, G.; Şahin, B.; Keskinkan, O. Determining the Contributions in a Denim Fabric Production for Sustainable Development Goals: Life Cycle Assessment and Material Input Approaches. Sustainability 2023, 15, 5315. https://doi.org/10.3390/su15065315
Sarı B, Zarifi F, Alhasan M, Güney H, Türkeş S, Sırlıbaş S, Civan Yiğit D, Kılınççeker G, Şahin B, Keskinkan O. Determining the Contributions in a Denim Fabric Production for Sustainable Development Goals: Life Cycle Assessment and Material Input Approaches. Sustainability. 2023; 15(6):5315. https://doi.org/10.3390/su15065315
Chicago/Turabian StyleSarı, Bülent, Farhad Zarifi, Muhammed Alhasan, Hakan Güney, Selman Türkeş, Serdal Sırlıbaş, Deniz Civan Yiğit, Güray Kılınççeker, Beşir Şahin, and Olcayto Keskinkan. 2023. "Determining the Contributions in a Denim Fabric Production for Sustainable Development Goals: Life Cycle Assessment and Material Input Approaches" Sustainability 15, no. 6: 5315. https://doi.org/10.3390/su15065315