Article

Study on the Evaluation of the Development Efficiency of Smart Mine Construction and the Influencing Factors Based on the US-SBM Model

College of Mines, Liaoning Technical University, Fuxin 123000, China
*
Author to whom correspondence should be addressed.
Sustainability 2023, 15(6), 5183; https://doi.org/10.3390/su15065183
Submission received: 11 December 2022 / Revised: 7 March 2023 / Accepted: 11 March 2023 / Published: 15 March 2023
(This article belongs to the Special Issue Energy Transition: Growth and Efficiency in Resource Economics)

Abstract

:
Taking the panel data of 13 provinces (autonomous regions and municipalities directly under the central government) in Shanxi and Xinjiang from 2011 to 2020 as the research object, we establish an evaluation index system for assessing smart mine construction development efficiency combined with the global reference method. The non-desired output super-efficiency slacks-based measure and the kernel density model were used to measure the development efficiency of smart mine construction and spatial structure evolution characteristics. This study explores the internal and external factors affecting the efficiency in various regions using the Tobit regression model. After conducting the analysis, the study obtained four main findings: (1) the development efficiency is influenced by the level of technology, and the overall level is low; (2) there are spatially heterogeneous and agglomerative characteristics, with large differences in regional distribution; (3) personnel is the main factor causing the phenomenon of severe redundancy in the region; and (4) the level of regional economic development, industrial structure, and the degree of government intervention are the main external factors that have a positive impact.

1. Introduction

The construction of smart mines is the main development direction of the coal industry. Smart mine development is based on the concepts of “ lucid waters and lush mountains are invaluable assets”, “green production”, “green economy”, “carbon neutral”, and “carbon peaking” [1]. The goal of smart mine construction is to realize mining processes that are automated, intelligent, unmanned, and informatized, as well as making use of resource data [2]. Accelerating the development of smart mine construction is conducive to the total allocation and efficient utilization of coal resources under the premise of protecting the environment. This not only promotes the coordinated development of the environment, economy, society, and resources, but also drives the transformation and upgrading of mining development.
The development efficiency of smart mine construction Is a significant indicator of the extent to which regional mining construction factors are comprehensively utilized and the degree of mining development achieved, which is influenced by various factors, such as natural resources and the environment, socioeconomic factors, and human activities. The key to measurement is the selection of system input and output indicators. Qiu [3] and He et al. [4] elaborated and analyzed the primary system of smart mines from the perspective of enterprise and the definition of smart mines, respectively. They also created the evaluation index system of smart mine construction in infrastructure, production management, green mining, comprehensive automation, and digitalization.
There are two main methods for evaluating efficiency in the mining sector: non-parametric data envelopment analysis (DEA) methods and stochastic frontier approach (SFA) methods [5,6,7]. However, compared to DEA, SFA requires a larger sample size and advanced determination of the production function shape [8]. Currently, scholars are more likely to apply non-parametric DEA evaluation methods considering multiple input and output perspectives [9,10,11]. Tsolas [12] measured the environmental efficiency of surface mines in Illinois using the DEA bootstrap method and found that surface mines were environmentally inefficient. Fang et al. [13] compared the efficiency of listed coal mines in China and the United States and found that the coal mines of China were relatively less efficient than U.S. mines. Kulshreshtha and Parikh [14] found that the efficiency of Indian surface mines is lower than that of underground mines and the efficiency decreases with time. Che et al. [15] established a slacks-based measure (SBM) model that considers carbon emissions resulting from coal resources as a non-desired output. They discovered that the average coal utilization efficiency in China is only 0.269, which is considerably lower than the ideal value of 1. Yang et al. [16] used a DEA with the Malmquist index to incorporate undesired outputs, including waste, gas, and wastewater emissions, into the evaluation model and found that improving scale efficiency is the key to improving the eco-economic efficiency of China’s mining industry. Geissler et al. [17] used DEA to measure the efficiency of global phosphate mining companies from a Public Relationship (PR) market perspective and found that the efficiency of listed mining companies is generally higher than those of state-owned mining companies. Zhang et al. [18] explored the efficiency of financial support of 12 listed coal enterprises in Shanxi from 2003–2017 using the DEA–Tobit two-stage model in a supply-side context and found that the financial, scientific, and technological inputs of coal enterprises performed better in terms of usage efficiency.
Currently, efficiency evaluation studies in the coal field mainly focus on green mining and ecological and enterprise efficiency measures; however, less attention is given to the efficiency of smart construction development. Significant regional differences exist in the construction of smart mines in coal resource-based cities. There are significant regional disparities in the construction of smart mines among coal resource-based cities. Nevertheless, the lack of regional-level quantitative evaluation research makes it challenging for governments and enterprises to promptly devise targeted policies. Consequently, this is expected to hinder the development of smart mine construction to a certain extent. This study focuses on mining construction in 13 provinces (autonomous regions and municipalities directly under the central government), such as Shanxi and Xinjiang. We developed an evaluation index system for the development efficiency of smart mine construction, which was used to calculate its efficiency and analyze its spatiotemporal variation characteristics. Furthermore, we investigated the internal factors that influence the efficiency in various provinces and applied the Tobit regression model to examine the primary external factors. The study of mine construction development efficiency provides essential theoretical support for judging the actual development efficiency of smart mine construction. Moreover, it is also beneficial to accurately grasp the critical challenges of smart mine construction development in the process of efficiency improvement. In turn, such research provides a scientific basis for the government to formulate development policies and mining enterprises to make decisions, and then realize the coordinated development and comprehensive improvement in the efficiency of the coal industry.

2. Research Methodology and Data Sources

2.1. Research Methodology

The study constructed an index system for evaluating the construction of smart mines through the literature review. The spatial and temporal evolution trends and influencing factors of the development efficiency of smart mine construction in the study area were explored by combining the global reference method, the super-efficiency SBM model (US-SBM) model, the kernel density estimation (KDE) model, and the Tobit model. The entire analytical process is shown in Figure 1.

2.1.1. Global Reference Method

When performing static efficiency measurements with m inputs and n outputs, the lower limit of the number of decision-making units (DMUs) studied is referred to as max [m × n, 3 × (m + n)]. The selected input–output indicators will have a quantitative limitation due to the small number of DMUs learned. There is one-sidedness in reflecting the research problem [19]. At the same time, because the data envelopment analysis (DEA) measures relative efficiency, the measured efficiency values will not be comparable because the frontier surfaces are at different levels due to the various examination periods. The number of decision units available for the study is 13 due to the small number of regions where coal is the leading mineral endowment. The sum of the number of input–output indicators selected is limited to 5. The study introduces the global reference method based on the US-SBM model to make the constructed evaluation index system more comprehensive [20,21]. The international reference method treats the same decision unit in different examination periods as different DMUs. It forms a new frontier surface containing the whole period as a unified benchmark for the efficiency measurement to facilitate the cross-period comparison of efficiency values, which makes the research problem more accurately and comprehensively addressed based on the enrichment of the input and output indicators.

2.1.2. US-SBM Model

Compared with the DEA model, the SBM model has the advantages of objective weighting, being independent of the indicator scale, not requiring a production function setting, and combining multiple inputs and outputs. Therefore, the super-efficiency SBM model (US-SBM), which includes a non-desired output, can be used to analyze the main factors of inefficiency generation based on the proportional changes of slack variables. It compensates for the deficiency in the DEA model that does not consider slack variables in the inefficiency measurement process in the radial direction. A summary of the specific advantages is shown in Table 1 [22,23,24,25,26].
Since the properties of primary energy sources determine that the development process is inevitably accompanied by the generation of undesired outputs such as sulfur dioxide and carbon dioxide, to achieve an efficient efficiency ranking among the study regions, the study chose the US-SBM model for the efficiency measurement, with the following expression [27]:
min   ρ * = 1 1 m . i = 1 m s i x i k 1 + 1 r + t . r = 1 r s r + y r k + t = 1 t s t y t k s . t . j = 1 , j k n λ j . x i j + s i x i k j = 1 , j k n λ j . y r j + s r + y r k j = 1 , j k n λ j . y t j + s t y t k λ j 0 , j = 1 , ... , n s i 0 , s r + 0 , s t 0
where n is the number of DMUs, m is the number of input elements of each DMU, t is the number of non-desired outputs, and r is the number of desired outcomes. The vectors x i k , x r k , x t k denote the input and output variables of the kth DMU. s i , s t , s r + indicate the slack variables for the factor input, non-desired output, and desired output factors, respectively. λ j denotes the constraint, and ρ characterizes the efficiency of smart mine construction development. The greater the ρ , the higher the level of smart mine construction development.

2.1.3. KDE Model

As a nonparametric test, kernel density estimation (KDE) can describe the distribution pattern of random variables and has a wide range of applications because of its good statistical properties and weak model dependence; its detailed characteristics are summarized in Table 2.
Therefore, to explore the spatial and temporal evolution characteristics of the efficiency of smart mine construction development, the KDE model was chosen to map the trends of efficiency evolution in this study, with the following expression [28]:
f ( x ) = 1 n h i = 1 n K x x i h
where f ( x ) is the probability density function; n is the sample capacity; x i is the ith independently distributed sample point; h is the bandwidth; and K ( x ) denotes the kernel density function. The KDE model was used to analyze the spatial structure evolution characteristics of the efficiency of smart mine construction development from the perspective of the curve distribution pattern, peak, kurtosis, and position changes.

2.1.4. Tobit Regression Model

In addition to the selected input and output indicators, other external factors will also influence the development efficiency of smart mine construction. Combined with the characteristics of mine construction, the level of economic development, industrial structure, environmental policy, degree of government intervention, level of human capital, degree of openness to the outside world, technological innovation, and degree of coal resource advantage were chosen as external influencing factors of the development efficiency of smart mine construction [29,30,31].
The Tobit regression model is a dependent variable restricted model, where the dependent variable needs to be fragmented or cut in value when this model is used [32,33]. The form of the Tobit regression model is:
Y = Y * = α + β X + ε Y * > a 0 Y * a
where X is the vector of independent variables, i.e., the factors influencing the development efficiency of smart mine construction; Y is the development efficiency of smart mine construction; α is the vector of intercept terms; β is the vector of regression parameters; and ε is the disturbance term, ε N 0 , σ 2 . In the Tobit regression model, the development efficiency of smart mine construction values are taken as the dependent variables and all take positive values. These values belong to the truncated discrete distribution data. Thus, the cutoff point a was set to 0.

2.2. Indicator System Construction and Data Sources

2.2.1. Construction of the Indicator System

(1)
The evaluation index system of smart mine construction development efficiency
Based on the studies of Hou et al. [3,4,13,34], the operability and accessibility of the data, and following the principles of objectivity and scientific principles in constructing the index system, the essential elements for measuring the development level of smart mines were integrated, and selected suitable indicators were selected from four aspects: safety, unmanned operation, efficiency, and clean mines. These elements were used to construct the index system for evaluating the development efficiency of smart mine construction in the coal industries of each province (autonomous regions and municipalities directly under the central government). Due to the differences in the statistics and descriptions of the comprehensive utilization of resources in each province, such as the total utilization rate of coal gangue and the real utilization rate of gas, the number of green mines in local coal enterprises above the scale is used instead of the corresponding indicators. The evaluation index system for the development efficiency of smart mine construction is shown in Table 3.
(2)
Selection of impact factor indicators and model setting
This study drew on the current research results on the influencing factors of development in the coal industry’s development and mine construction. The indicators are selected based on the external environment and internal structural characteristics of the development of smart mine construction. To avoid multiple covariances of data during the index selection and considering the availability of data, we focus on the influence of factors such as the level of economic development, industrial structure, environmental policy, degree of government intervention, level of human capital, openness to the outside world, technological innovation, and degree of coal resource advantage on the development efficiency of smart mine construction.
Economic development level: economic development directly influences the input to mine construction development. The higher the level of economic growth, the greater the scale of investment in technology and capital, and the stronger the potential for resource exploration [31]. These conditions are more conducive to improving the development efficiency of smart mine construction. The level of economic development is expressed by the GDP per capita of each province.
Industrial structure: the industrial structure of resource-based cities reflects, to a certain extent, the contribution of energy to local development [35], which in turn affects the development of mine construction, expressed as the proportion of the primary business income of the coal industry contributing to the total output value of the secondary sector.
Environmental policy: the process of mine construction will produce a certain amount of pollution, and different ecological policies will affect the development of smart mine construction, expressed as the proportion of total investment in environmental pollution control to GDP [36].
The degree of government intervention: energy is the basis of the national economy, especially for resource-based cities. Government behavior has a guiding role in developing smart mine construction, affecting the efficiency of smart mine construction [37]. Due to the lack of measurement data on the degree of government intervention in the coal industry, this study uses the ratio of local fiscal expenditure to the GDP to measure this factor.
The level of human capital: the state of human capital catalyzes the region’s economic development. Economic growth drives the development of high-tech industries, and human capital shifts from labor-intensive to money- and technology-intensive with economic development. This directly affects the improvement of the development efficiency of smart mine construction, which is measured by the number of undergraduate students in public higher education institutions [38].
Degree of external openness: external openness is conducive to introducing advanced foreign smart mining technology, which directly affects the improvement of the development efficiency of smart mine construction, as expressed by the proportion of foreign direct investment in the GDP [39].
Technological innovation: improvement in smart mining technology can influence the input and directly benefit the economic output in the construction of smart mine infrastructure, expressed as the amount of R&D funding input in each region.
Degree of resource superiority: mineral resources are the basis for the development of smart mine construction. The total regional resources drive local mining enterprises to build smart mines logarithmically.
The study focuses on using the total efficiency of smart mine construction development as the dependent variable, with data mainly from 13 provinces including Shanxi, Xinjiang, and Shandong over multiple years. Based on this, we established a Tobit regression model to analyze the factors that affect efficiency [36,40].
E F F i t = β 0 + β 1 ln G D P i t + β 2 S T R i t + β 3 E P i t + β 4 G O V i t + β 5 ln P C L i t + β 6 O D i t + β 7 S T I i t + β 8 ( ln C R A i t ) + ε i t
where i denotes different decision units, and different regions in the study, i.e., the 13 provinces; t is the year (t examines the time series from 2011 to 2020); β 0 is the constant term; β 1 , β 2 , β 6 is the regression coefficient; ε i t is the random error term; E F F is the development efficiency of smart mine construction; G D P is the level of economic development; S T R is the industrial structure; E P is the environmental policy; G O V is the degree of government intervention; P C L is the level of human capital; O D is the degree of openness to the outside world; S T I is the technological innovation; and C R A is the degree of coal resource advantage.

2.2.2. Data Sources

We obtained all data from official Chinese statistical documents [41,42,43,44,45]. Taking 2011–2020 as the research period, 13 provinces, including Shanxi, Xinjiang, Shandong, Shaanxi, Henan, Hebei, Fujian, Guangxi, Hunan, Jilin, Jiangsu, Yunnan, and Chongqing, were taken as the decision unit (Figure 2). Total fixed asset investment, the average annual number of employees, total electricity consumption, internal expenditure of R&D funds, and converted full-time equivalent of R&D personnel in the coal industry were used as input variables, representing capital, labor, resource, and technology factor inputs, respectively. Primary business income, coal production, and the number of smart unmanned work surfaces in the coal industry were chosen as the desired output variables and the mortality rate per one million tons and carbon emission in the coal industry were selected as the undesired output variables. For individual missing data, the interpolation method was utilized to supplement and improve.

3. Analysis of Results

3.1. Analysis of the Development Efficiency of Smart Mine Construction

Combined with the global reference method, the US-SBM model under the variable scale payoff condition (VRS) was used for the comprehensive analysis. The development efficiency of smart mine construction was measured using MAXDEA Professional software; the measurement results are shown in Table 4.
In terms of total efficiency, the average value fluctuations in the development efficiency of smart mine construction show an initial decline and then steadily improve, reaching a peak state in 2020 (Figure 3), indicating that the current smart mine construction is in a stage of rapid development. The average TE is 0.6943, which is still 30.57% lower than the ideal state, with enormous development potential. From the provincial perspective, the provinces with a total efficiency higher than the average value account for 61.54% of the TE, namely, Guangxi, Jilin, Jiangsu, Shandong, Shanxi, Shaanxi, Xinjiang, and Chongqing, among which Chongqing has the highest total efficiency value of 1.1199. There are five provinces with a total efficiency lower than the average value, accounting for 38.46% of the TE, among which Henan has the lowest total efficiency value of 0.1551.
After the decomposition of total efficiency, the overall trend of change in the mean value of pure technical efficiency shows some fluctuation and increase. Moreover, three provinces reach the applicable state, namely Guangxi, Shanxi, and Chongqing (Table 4). Eight provinces have a pure technical efficiency above the mean value (0.7891), consistent with the total efficiency. Pure technical efficiency is the main influence of the development efficiency of smart mine construction. The average value of scale efficiency is relatively smooth, with an upward trend. Moreover, all provinces show an ineffective level of scale efficiency, indicating that none of the smart mine construction projects within the study area have formed a scale effect in terms of development.
Overall, the total efficiency value of smart mine construction development showed a linear downward trend between 2011 and 2014, but started to rise again in 2016 before reaching its peak in 2020, mainly due to the cumulative effect of the rough long-term development of the coal industry before 2010 and the lag effect of the implementation of the “2010 General Office of the State Council Forwarding the Opinions of the Development and Reform Commission on Accelerating the Merger and Reorganization of Coal Mining Enterprises Notice” (No. 46 of 2010). The total efficiency value fell to its lowest level in 2014, after which it began to rebound and reached the maximum in 2020. This rebound is mainly due to the birth of 5G technology, which accelerated the development process of smart mines. Indeed, 2019 was the first year of the commercial application of 5G technology, and the construction results of provinces in terms of smart mines in 2020 is yet to be revealed. The number of national smart, unmanned mining developments increased from three in 2015 to 145 in 2018 and showed an explosive growth to 494 in 2020. Meanwhile, the document “Opinions of the State Council on the Coal Industry to Resolve Excess Capacity and Achieve Destructive Development” (Guo Fa (2016) No. 7) in 2016 proposed a series of related policies, such as closing small, outdated coal mines; eliminating outdated production capacity; and promoting enterprise reform and restructuring. Related government support policy requirements forced coal enterprises to increase the scale of their investments into smart mine construction in each province, which has promoted the advancement of smart mine construction overall and contributed positively to the enhancement of its efficiency. However, the overall efficiency level of smart mine construction development is low and needs to be strengthened in terms of scale effect and resource allocation.
When analyzing the total efficiency and its decomposition from the provincial level, we found that the total efficiency values of Guangxi and Chongqing are both greater than one. These two regions have reached an ideal state regarding technical efficiency and scale efficiency of smart mine construction and have reasonably allocated and utilized their resources. The average values of total efficiency in Shandong and Shanxi are between 0.85 and one, which indicates that the two provinces can change from the current ineffective state to the ideal effective state by reasonably adjusting the input scale of resources while keeping the current technology level unchanged. The average values of the total efficiency of Jilin, Shaanxi, Jiangsu, Xinjiang, and Fujian are between 0.65 and 0.8, indicating that there is still more room for development in terms of technology level and scale, and more investment is needed in introducing new technology introduction and scale management. Hebei, Yunnan, Hunan, and Henan have mean values of total efficiency below 0.5, mainly due to their low technical efficiency, showing severe technological backwardness. The main reason for this is that, in terms of coal mine ownership, small coal mines of modest scale are dominant, and there is a lack of financial support for introducing new technology.

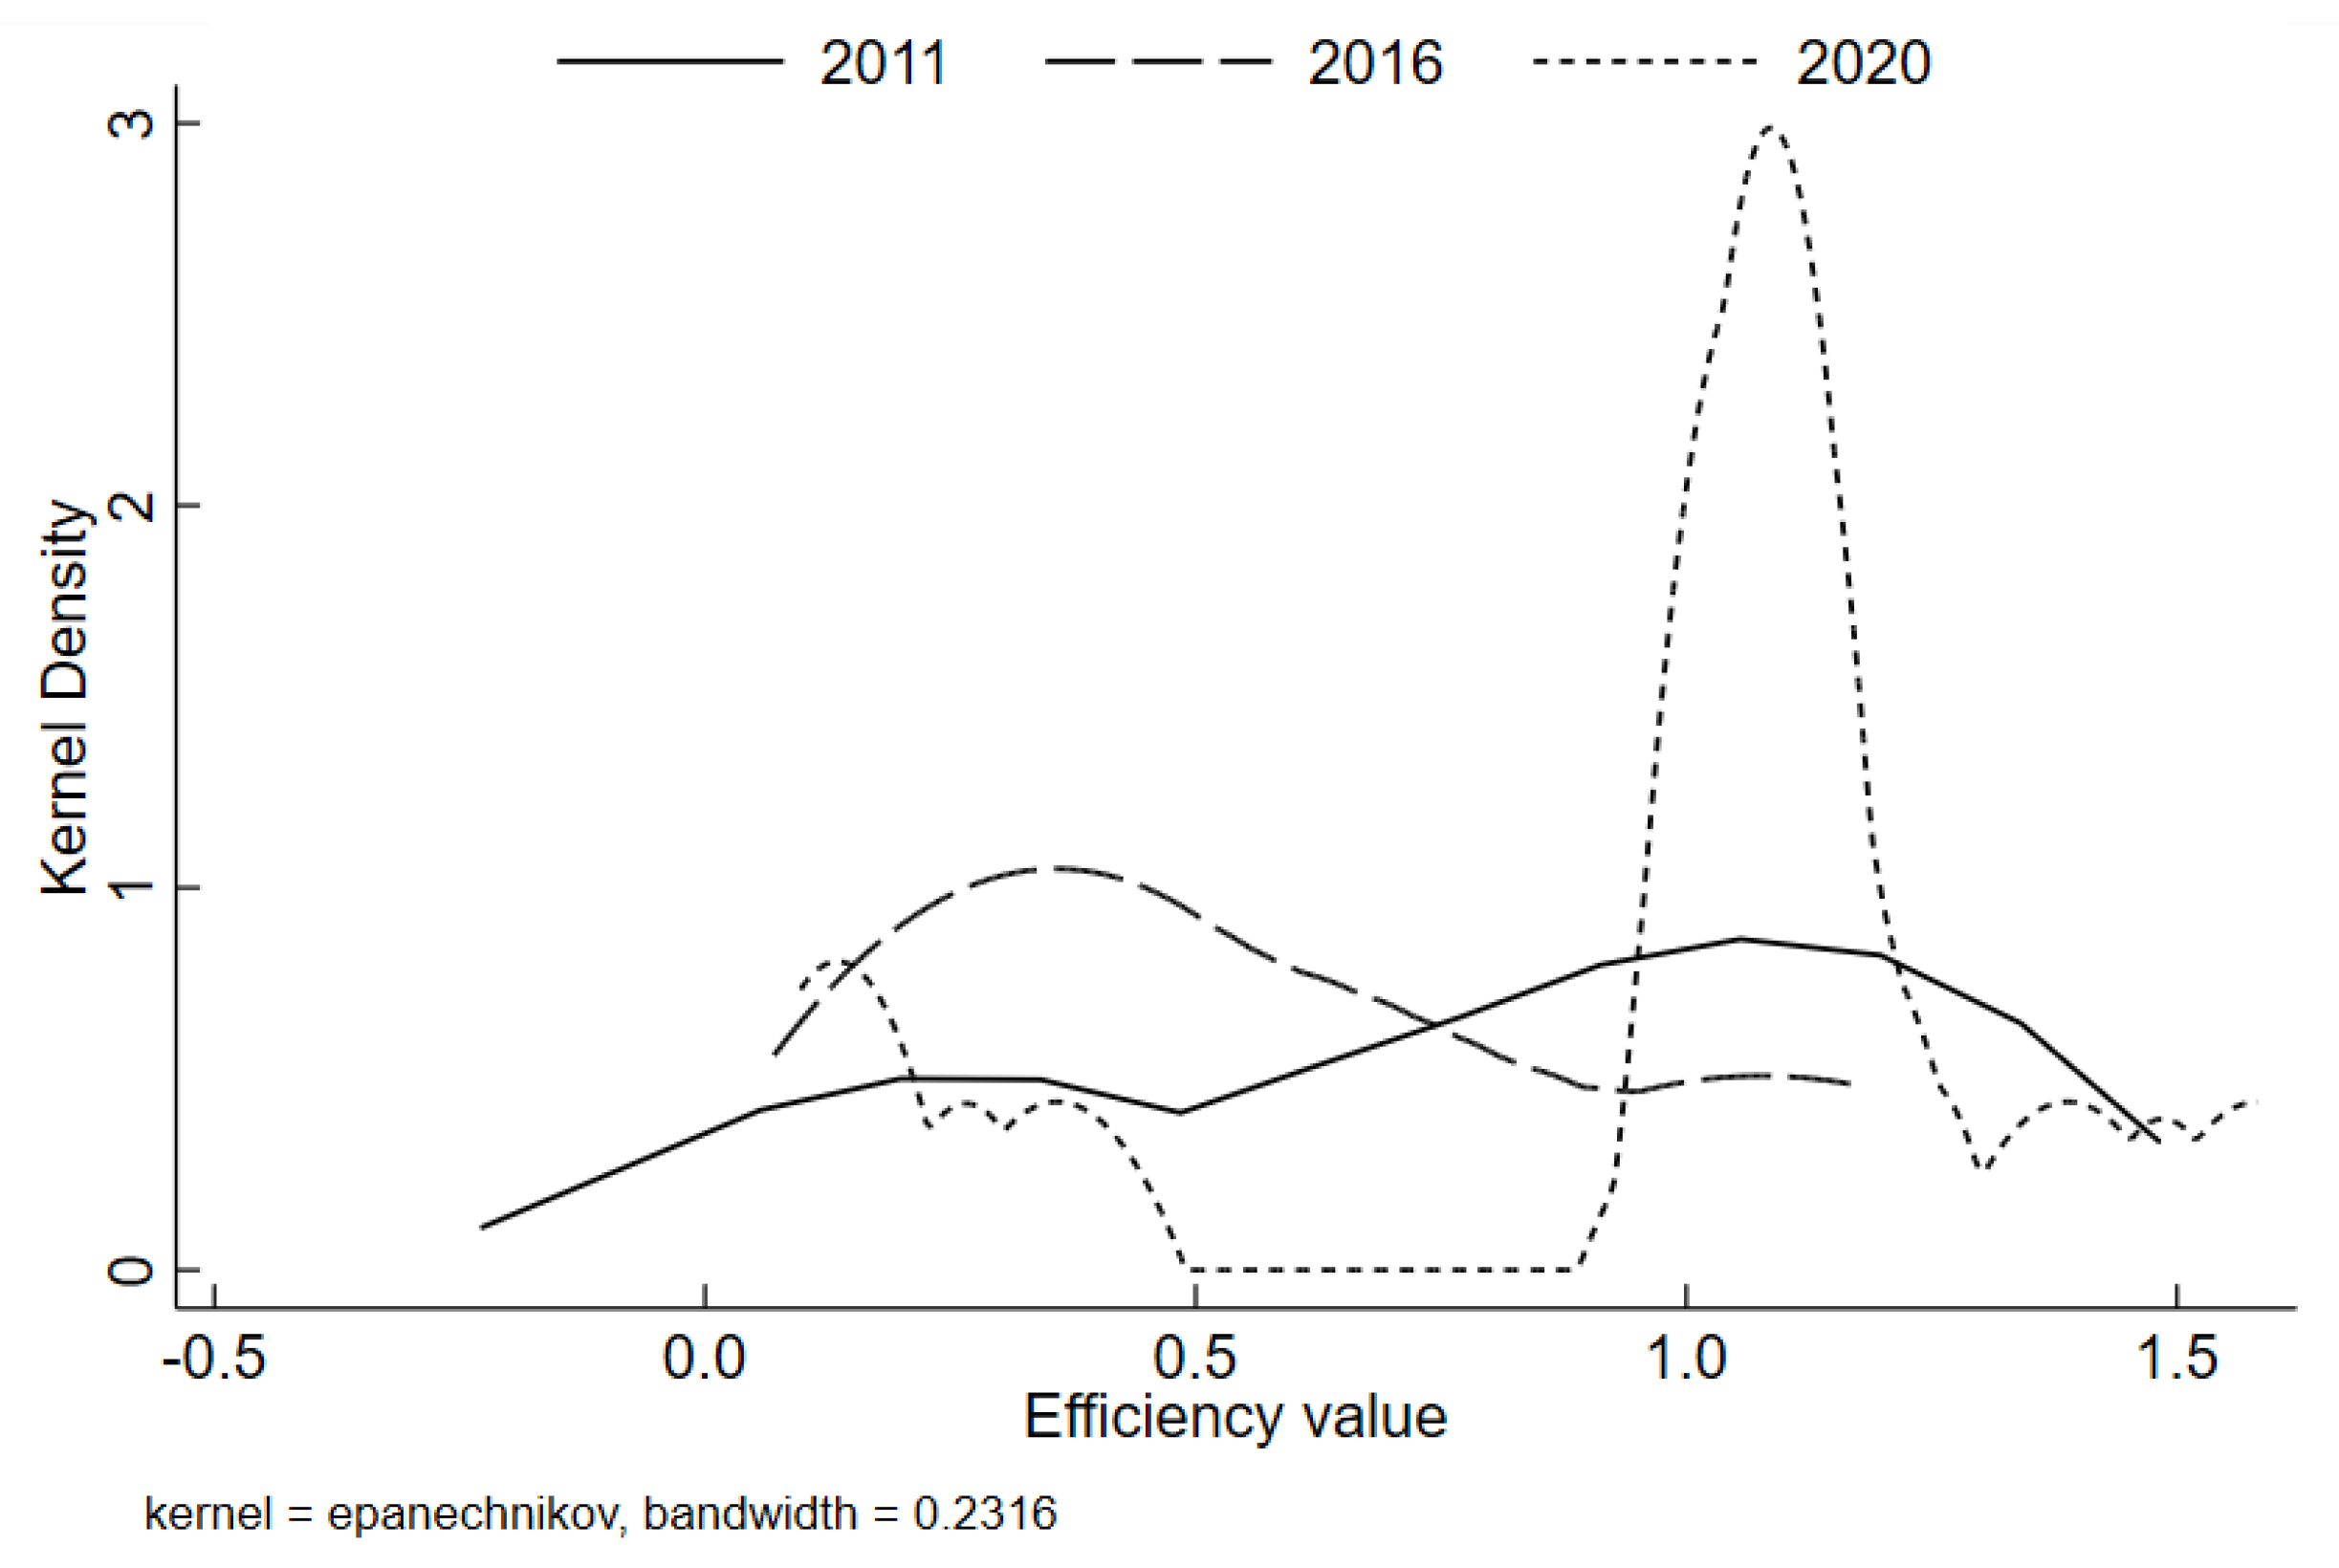
3.2. Spatial Structure Evolution

Based on the kernel density function, Stata 16.0 software was used to estimate the development efficiency of smart mine construction within the study area in 2011, 2016, and 2020 to visualize the spatial structure evolution characteristics of the development efficiency of smart mine construction (Figure 4). The results are displayed below.
By observing the changes in the shape and location of the kernel density curve in 2011, 2016, and 2020, we found that the overall trend of smart mine construction development efficiency during the examination period shows the evolution from a low-value area to a high-value area, wave peaks from low to high, and doubling in height to multiple peaks. There is an evident phenomenon of two-level polarization of smart mine construction development efficiency in the study area. The phenomenon is improving, and the difference in smart mine construction development efficiency among provinces shows a significant performance.
(1)
In terms of peak, the first wave of the rise of smart mine construction development efficiency occured around 0.4, and the second wave occurred at around 1.1, indicating that the polarization phenomenon of smart mine construction development efficiency in each region is profound.
(2)
In kurtosis, the wave height shows an overall rising trend, and the kernel density curve for all years shows a trend of increasing peak height, decreasing width, and a broad ridge evolving into a sharp rise. The degree of difference in the development efficiency of smart mine construction in each region is becoming smaller.
(3)
In terms of location, the kernel density curve from 2011–2016 shows a left shift, and the turn from 2016–2020 offers a suitable dress, indicating that the level of efficiency of smart mine construction development shows a trend of change of first decreasing and then increasing.

3.3. Analysis of Influencing Factors

3.3.1. Internal Factors Analysis (Redundancy Analysis)

Table 5 shows the input redundancy of smart mine construction in each province. We make the following observations: in terms of fixed asset investment, the input redundancy rate of Hebei, Henan, and Shandong is 0, i.e., there is no redundancy; the input redundancy rate of Shanxi, Jiangsu, and Jilin is low, all below 10%; the input redundancy rate of Fujian, Xinjiang, and Yunnan are high, reaching 40%. Overall, regarding fixed assets, the percentage of regions with input redundancy reached 61.54%, with a severe waste of resource allocation. Regarding the number of staff configurations, Hebei, Shandong, Shanxi, and Shaanxi all have an excellent configuration effect, with an input redundancy rate below 5%. In contrast, Henan and Hunan have unreasonable staff configurations, with input redundancy reaching 45%, which shows great potential for reducing redundancy and increasing efficiency in both areas. In terms of energy allocation, the input redundancy rates of all regions are low, and the resource allocation effect is good, except for in Jiangsu and Xinjiang. The input redundancy rates of the rest areas are below 10%, which is a more balanced performance.
Regarding R&D staff allocation, 46.2% of regions have an input redundancy rate above 30%. The overall resource allocation is unreasonable. Hunan has the highest input redundancy rate of over 60%, indicating that the over-inflation of the R&D staff input is the primary factor causing the inefficiency in Hunan.
There are noticeable differences among provinces in input factor redundancy. Guangxi and Chongqing do not have redundancies in each factor input. The input match between each factor is reasonable. The excessive redundancy of the number of practitioners and R&D personnel is the main factor leading to the input inefficiency of Henan and Hunan. Therefore, to improve the development efficiency of the smart mine construction, the two regions should appropriately reduce the number of relevant personnel inputs while leaving the established output unchanged. The factors affecting input redundancy in Fujian, Yunnan, and Xinjiang come from fixed asset investment, the number of employees and R&D personnel, respectively, and the blind allocation of resources and inefficient utilization, which are common factors in these three places. Technical input redundancy is the leading cause of input inefficiency in Hebei and Jilin, and these areas should strengthen their allocation and utilization of technical resources. The factors affecting input inefficiency in Jiangsu are more diversified: labor, resource, and technology inputs. The rest of the regions perform well in terms of resource allocation and utilization, especially Shandong and Shanxi, where the level of resource allocation is close to ideal.

3.3.2. Analysis of External Factors

We conducted the Tobit regression analysis using Stata 16.0 software on the development efficiency of smart mine construction in 13 provinces, such as Shanxi and other areas from 2011 to 2020 using the selected external environmental variables. The calculation results are shown in Table 6.
(1)
The level of economic development and technological innovation both have a positive promotion effect on the development efficiency of smart mine construction at a 10% significance level. Among these, the influence coefficient of the level of economic development reaches 0.384, showing that it is the main external factor enhancing the development efficiency of smart mine construction. This is because the higher economic level is conducive to the development and introduction of advanced mining technology and management models while enhancing the promotion of the transformation of human production and lifestyle. The concern of human beings for a green environment and health has made the changes in production methods in the mining industry inevitable. For example, people’s increased attention to the safe working environment and occupational health has forced mining enterprises to develop intelligent and unmanned work sites. The impact coefficient of technological innovation is only 0.000342. Even though scientific and technological innovation favorably support the transformation and development of the coal industry, the effect of technological innovation on enhancing the development efficiency of smart mine construction is weak due to the lack of key core technologies and weak innovation results in transformation ability in the domestic mine construction process.
(2)
Both the level of human development and environmental policy have a significant negative relationship on the development efficiency of smart mine construction at a 1% significance level, which is the main factor limiting the improvement in this area. Here, the regression coefficient of the human capital level reaches −0.346, which has the most significant impact on the development efficiency of smart mine construction, indicating a severe lack of talents related to smart mine construction. Skilled labor gradually moves to other fields due to the cognitive restrictions on the production environment and operational safety of traditional mining enterprises, as well as the pursuit of a high-quality lifestyle. With the development of the smart mine industry, the definition of mining enterprises by society will also change. This situation will be positively transformed by more relevant talents. The regression coefficient of the environmental policy is −0.156, which indicates that although extensive development in the mine construction process has been limited, it has not been eliminated. The government’s investment in legislation, supervision, technology, and finance has hindered the development of smart mine construction while reducing pollution emissions, indicating that the current level of smart mine construction is low and more investment in clean mine construction is needed.
(3)
Industrial structures and the degree of government intervention positively affect smart mine construction’s development efficiency at a 5% significance level, with influence coefficients of 0.0187 and 0.0204, respectively. When the ratio of primary business income and local fiscal expenditure of the coal industry increases by 1%, the development level of smart mine construction in the study area increases by 0.0187 and 0.0204, respectively, on average. Coal resource endowment, as a prerequisite for the development of smart mine construction, has an essential supporting role in the development of smart mine construction. The government has a substantial leading role at the energy development level. Government actions can directly guide the development direction of smart mine construction, promoting the development of smart mine construction.
(4)
The regression coefficient of the degree of opening up to the outside world is 0.0617, which positively promotes the development of smart mine construction, and the influence coefficient of the degree of coal resource advantage is −0.0916, which has a negative influence on the development of smart mine construction, but none of them are significant. For example, the “One Belt, One Road” strategy has helped China’s coal industry to relieve excess capacity, enrich supply and demand channels, and improve the competitiveness of the international market. However, because most of China’s coal resource cities are located in relatively backward economic regions lacking foreign investment attraction and a low degree of openness to the outside world, improvement in the development efficiency of smart mine construction is not apparent. Although coal resources are the basis for the development of smart mine construction, the severe environmental pollution and excessive waste of resources generated by the long-term rough development mode seriously limit the development of smart mine construction, especially the construction of clean mines.

4. Discussion

Smart mine construction in China has entered a stage of rapid development. Researching its development efficiency and related internal and external influencing factors helps the government and mining enterprises obtain a grasp of the current situation and promotes the coordinated development of the economy, resources, society, and environment in resource-based cities. The following development suggestions are put forward in conjunction with the research findings.
  • The evaluation of the development efficiency of smart mine construction shows that the lack of crucial technologies mainly limits the current low efficiency of smart mine construction. Because of the complex and diverse coal seam conditions, the degree of difficulty, technical paths, and effects of smart mine construction vary depending on the coal seam conditions. The lack of “transparent geology” detection technology does not provide a reasonable basis for achieving fully smart mining. At the same time, intelligent mining technology cannot flexibly adapt to complex working face environments, and the self-adaptability and reliability of smart mining equipment are poor [46]. Therefore, we should strengthen the research and development of “transparent geology” technology, realize the “transparency” and “visualization” of geological mine information, increase the study of smart equipment and self-adaptive control technology in combination with 5G technology, and improve the quality of mining equipment. At the same time, we should speed up the integration of 5G technology as the core technology ecology to facilitate the development of smart mining technology and promote technological changes in mine construction [2].
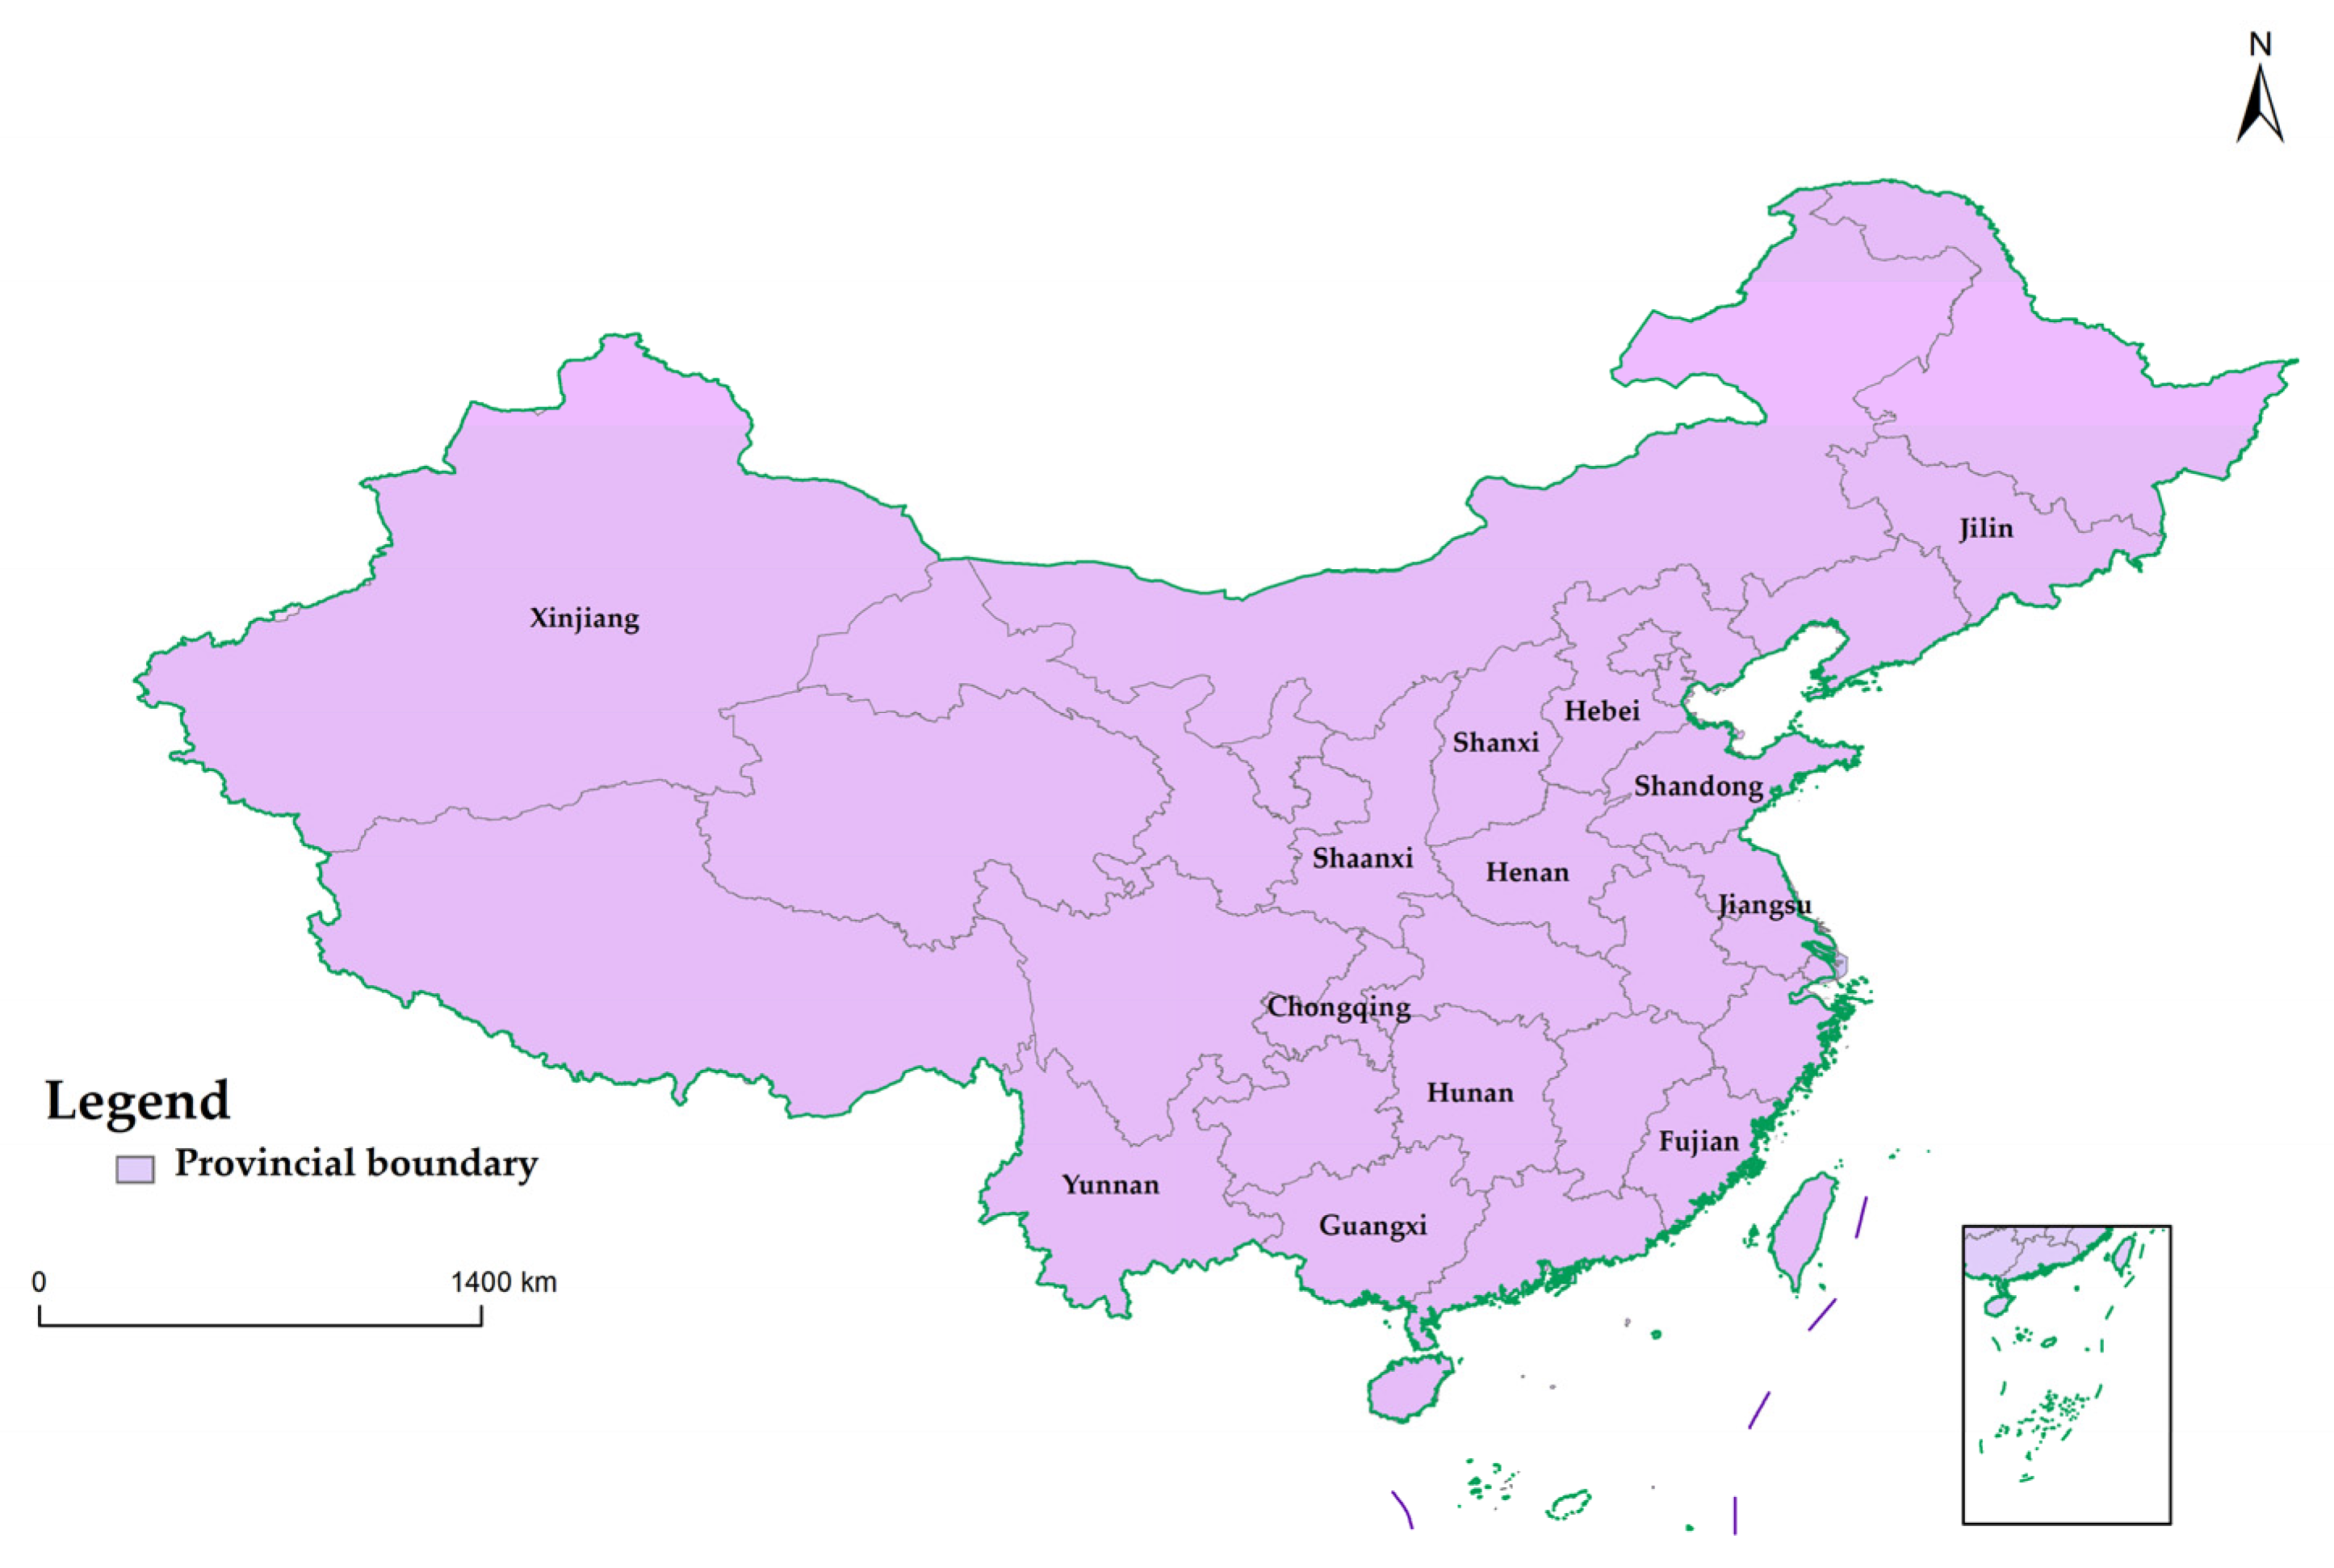
  • In order to enhance the regional targeting of mining development policies, it is imperative for regions with varying levels of development efficiencies to formulate appropriate strategies for the development of smart mine construction based on their unique circumstances. Regions such as Guangxi and Shandong, where the total development efficiency is above 0.85, should focus on technological innovation in smart mining and strive to break through technical development bottlenecks. Areas such as Fujian and Jilin, where the total development efficiency is 0.6~0.85, should focus on expanding the application of advanced mining equipment and technology, introducing advanced mine management models at home and abroad and accelerating the comprehensive benefits of their mine construction. Hebei, Henan, and other regions with a total development efficiency below 0.6 are seriously lagging in the development of smart mine construction. They should accelerate the merger and reorganization of coal enterprises, eliminate backward production capacity, and improve coal mines’ modernization, intensification, and scale. At the same time, they should also increase investment in infrastructure and technology and improve enterprises’ scientific and technological capabilities.
  • The analysis of the factors influencing the development efficiency of smart mine construction shows that internal factors, accounting for 46% of the regions, have a severe redundancy phenomenon, indicating that the mining enterprises in the study area have a poor ability to optimize resource allocation. Mining enterprises should increase the importance of the rational allocation of resources and strengthen communication and cooperation with management consulting companies [47]. They should also combine their objective conditions and develop an enterprise that meets their development strategy. Regarding external environmental factors, economic development has the most significant positive impact on the development efficiency of smart mine construction. Therefore, the government and mining enterprises should strive to promote technological innovation and improve incentive mechanisms for independent creation and technological innovation, as well as form a talent introduction system. This would accelerate industrial transformation and strengthen the opening-up to the outside world to improve their economic competitiveness and the level of openness of the economy. Environmental policies and human capital levels have inhibiting effects on the development of smart mine construction. Meanwhile, the government should improve the corresponding reward and punishment system to increase the investment in earning rewards and avoiding punishment. Smart mine construction is seriously unattractive to current talents and lacks a sound smart talent training system. We should strengthen the training of talents for smart mine construction through school–government cooperation and school–enterprise cooperation, while at the same time increasing the skills training for practitioners to improve the talent training system [47].
  • There are still some shortcomings in this study. Firstly, due to the unique nature of mine construction development, the lack of comprehensive resource utilization data in each region restricts the selection of input and output indicators in the evaluation index system. Secondly, the lack of valuable statistical data in each area limits the choice of decision-making units, resulting in the inability to evaluate the development efficiency of smart mine construction in all resource-based cities in China. Finally, future studies will require an in-depth analysis of the efficiency differences between the weighted SBM model and the current research to further optimize the evaluation index system for the development efficiency of smart mine construction.

5. Conclusions

The uniqueness of this study lies in the fact that existing research on the development of smart mines mainly focuses on theoretical and technical applications but lacks quantitative research at the regional level. We have created an index system to evaluate the development efficiency of smart mine construction and incorporated a global reference method to measure the level of efficiency. The aim is to provide a quantitative assessment of the construction effect. Therefore, the primary objective of this study is to comprehensively reflect the overall level of mining development in the research area and provide a data-based reference to assist governments and enterprises in formulating targeted policies.
Based on the total efficiency decomposition analysis, the study discovered that the development efficiency was primarily influenced by pure technical efficiency. We reckon that achieving technological progress is the primary direction for enhancing the development efficiency of smart mine construction. Governments and enterprises should expedite the introduction of advanced mining technologies and increase investment in research and development funding. In terms of input redundancy, it was found that 46% of the regions exhibit a serious redundancy phenomenon, with personnel input being the most prominent. Hence, to enhance the level of resource allocation and utilization, companies should reduce the number of relevant personnel and reinforce the management of diverse input elements according to their operational situation. Regarding external factors, the government should take an active leading role in energy construction and increase incentives for enterprises’ innovative achievements. Additionally, it should also improve the system of rewards and penalties for environmental pollution control and establish a comprehensive talent training program for smart mining.

Author Contributions

Conceptualization, M.T. and S.L.; methodology, S.L.; software, S.L.; validation, S.L.; formal analysis, S.L.; investigation, S.L. and S.F.; data curation, S.L.; writing—original draft preparation, S.L.; writing—review and editing, M.T.; visualization, S.L.; supervision, M.T. All authors have read and agreed to the published version of the manuscript.

Funding

This research received no external funding.

Institutional Review Board Statement

Not applicable.

Informed Consent Statement

Not applicable.

Data Availability Statement

The data presented in this study are available in the article.

Conflicts of Interest

The authors declare no conflict of interest.

References

  1. Wang, G.F.; Ren, S.H.; Pang, Y.H.; Qu, S.J.; Zheng, D.Z. Development achievements of China’s coal industry during the 13th Five-Year Plan period and implementation path of “dual carbon” target. Coal Sci. Technol. 2021, 49, 1–8. [Google Scholar] [CrossRef]
  2. Fan, J.D.; Li, C.; Yan, Z.G. Overall architecture and core scenario of a smart coal mine in-corporating 5G technology ecology. J. China Coal Soc. 2020, 45, 1949–1958. [Google Scholar] [CrossRef]
  3. Qiu, S.H.; Tan, Z.L. Study on index system of intelligent mine construction degree in coal enterprises. Coal Sci. Technol. 2019, 47, 259–266. [Google Scholar] [CrossRef]
  4. He, Y.Y. Discussion on evaluation index system and architecture of smart mine. Ind. Mine Autom. 2017, 43, 16–20. [Google Scholar] [CrossRef]
  5. Hosseinzadeh, A.; Smyth, S.; Valadkhani, A. Analyzing the efficiency performance of major Australian mining companies using bootstrap data envelopment analysis. Econ. Model. 2016, 57, 26–35. [Google Scholar] [CrossRef]
  6. Tsolas, I.E. Assessing performance in Greek bauxite mining by means of frontier estimation methodologies. IMA J. Manag. Math. 2009, 21, 253–265. [Google Scholar] [CrossRef]
  7. Wang, S.M. Evaluation of Safety Input-Output Efficiency of Coal Mine Based on DEA Model. Procedia Eng. 2011, 26, 2270–2277. [Google Scholar] [CrossRef] [Green Version]
  8. Cooper, W.W.; Seiford, L.M.; Tone, K. Introduction to Data Envelopment Analysis and Its Uses; Springer Books: Berlin, Germany, 2006. [Google Scholar]
  9. Kasap, Y. The effect of work accidents on the efficiency of production in the coal sector. S. Afr. J. Sci. 2011, 107, 77–85. [Google Scholar] [CrossRef]
  10. Tsolas, I.E. Performance assessment of mining operations using nonparametric production analysis: A bootstrapping approach in DEA. Resour. Policy 2011, 36, 159–167. [Google Scholar] [CrossRef]
  11. Fang, H.; Wu, J.; Zeng, C. Comparative study on efficiency performance of listed coal mining companies in China and the US. Energy Policy 2009, 37, 5140–5148. [Google Scholar] [CrossRef]
  12. Kulshreshtha, M.; Parikh, J.K. Study of efficiency and productivity growth in opencast and underground coal mining in India: A DEA analysis. Energy Econ. 2002, 24, 439–453. [Google Scholar] [CrossRef]
  13. Li, S.X.; Wang, J.C.; Cheng, J.H. Efficiency Levels and Regulation Effects of Coal Industry in China. China J. Popul. Resour. Environ. 2015, 25, 169–176. [Google Scholar]
  14. Xu, J.F.; Tian, S.Y.; Zhan, Q.Y. Ecological efficiency evaluation of coal resource-based cities in China. Urban Probl. 2016, 95, 85–93. [Google Scholar] [CrossRef]
  15. Che, L.L.; Han, X.; Zhao, L.S.; Wu, C.Y. Coal Use Efficiency Evaluation and Decoupling Analysis between Coal Use Efficiency and Economic Growth in China. China J. Popul. Resour. Environ. 2015, 25, 104–110. [Google Scholar] [CrossRef]
  16. Yang, S.W.; Zhang, K.G.; Niu, M.M. Research on Evaluation of ecological and economic efficiency of China’s mining industry. Macroeconomics 2011, 6, 66–71, 78. [Google Scholar] [CrossRef]
  17. Geissler, B.; Mew, M.C.; Weber, O. Efficiency performance of the world’s leading corporations in phosphate rock mining. Resour. Conserv. Recycl. 2015, 105 (Pt B), 246–258. [Google Scholar] [CrossRef]
  18. Zhang, L.H.; Luo, Z.R.; Zhang, X.L. Research on Financial Support Efficiency of Scientific and Technological Innovation in Coal Enterprises under the Background of Supply-side Reform. East China Econ. Manag. 2019, 33, 149–157. [Google Scholar] [CrossRef]
  19. Cheng, G. Data Envelopment Analysis and MaxDEA Software; Intellectual Property Publishing House: Beijing, China, 2014; Volume 27. [Google Scholar]
  20. Pastor, J.T.; Lovell, C. A global Malmquist productivity index. Econ. Lett. 2005, 88, 266–271. [Google Scholar] [CrossRef]
  21. Kaoru, T. A slacks-based measure of super-efficiency in data envelopment analysis. Eur. J. Oper. Res. 2002, 143, 32–41. [Google Scholar] [CrossRef] [Green Version]
  22. Huang, J.; Yang, X.; Cheng, G.; Wang, S. A comprehensive eco-efficiency model and dynamics of regional eco-efficiency in China. J. Clean. Prod. 2014, 67, 228–238. [Google Scholar] [CrossRef]
  23. Charnes, A.W.; Cooper, W.W.; Rhodes, E.L. Measuring The Efficiency of Decision Making Units. Eur. J. Oper. Res. 1979, 2, 429–444. [Google Scholar] [CrossRef]
  24. Huppes, G.; Ishikawa, M. A Framework for Quantified Eco-efficiency Analysis. J. Ind. Ecol. 2005, 9, 25–41. [Google Scholar] [CrossRef]
  25. Banker, R.D.; Thrall, R.M. Estimation of returns to scale using data envelopment analysis. Eur. J. Oper. Res. 1992, 62, 74–84. [Google Scholar] [CrossRef]
  26. Tone, K. A slacks-based measure of efficiency in data envelopment analysis. Eur. J. Oper. Res. 2001, 130, 498–509. [Google Scholar] [CrossRef] [Green Version]
  27. Andersen, P.; Petersen, N.C. A Procedure for Ranking Efficient Units in Data Envelopment Analysis. Manag. Sci. 1993, 39, 1261–1264. [Google Scholar] [CrossRef]
  28. Ye, A.Z. Nonparametric Econometrics; Nankai University Press: Tianjin, China, 2003; pp. 24–25. [Google Scholar]
  29. Fan, Z.G.; Deng, Z.K.; Zhang, P.W.; Wu, Y.F. Green development efficiency measurement and its impact mechanism in ecological civilization pilot area. Stat. Decis. 2022, 38, 75–79. [Google Scholar] [CrossRef]
  30. Zhang, P.; Yu, W. The Spatial Interaction Spillover Effects of Financial Agglomeration and Urban Development Efficiency—An Empirical Study on the Spatial Simultaneous Equations in and among Cities above the Prefecture Level. J. Shanxi Univ. Financ. Econ. 2019, 41, 1–16. [Google Scholar] [CrossRef]
  31. Yang, L.; Chen, J.J.; Shi, P.F.; Huang, G.Q. The evaluation of red tourism development efficiency and its influencing factors: Acase study of the red tourism region in Northern and Western Guizhou. J. Nat. Resour. 2021, 36, 2763–2777. [Google Scholar] [CrossRef]
  32. Hou, D.; Liang, Z.X. Research on Green Mining Efficiency of Coal Enterprises Based on Two-Stage DEA Model. Saf. Coal Mines 2020, 51, 255–259. [Google Scholar] [CrossRef]
  33. Ma, X.J.; Li, Y.D.; Wang, C.X.; Yang, Q. Ecological efficiency in the development of circular economy of China under hard constraints based on an optimal super efficiency SBM-Malmquist-Tobit model. China Environ. Sci. 2018, 38, 3584–3593. [Google Scholar] [CrossRef]
  34. Tong, J.P.; Ma, J.F.; Wang, S.; Qin, T.; Wang, Q. Research agricultural water use efficiency in Yangtze River Basin based on super-efficiency DEA Tobit model. Resour. Environ. Yangtze Basin 2015, 24, 603–608. [Google Scholar] [CrossRef]
  35. Gu, S.Z.; Wu, Y.B.; Liu, W. Reflection on the transformation and upgrading of the coal industry during the “13th Five-Year” Plan period. Study Explor. 2015, 37, 78–82. [Google Scholar]
  36. Wang, J.N.; Xu, Z.C.; Hu, X.B.; Peng, X.C. Analysis of environmental efficiencies and their changes in China based on DEA theory. China Environ. Sci. 2010, 30, 565–570. [Google Scholar]
  37. Qin, B.T.; Yu, R.Y.; Ge, Y.M. The impact of environmental regulation on the industrial structure transformation of resource-based cities. China Environ. Sci. 2021, 41, 3427–3440. [Google Scholar] [CrossRef]
  38. Zhang, Y.; Zhang, H.Y.; Ge, L.M. Study on Green Development Efficiency Measurement and Synergistic Improvement Mechanism: A Case Study of Central Plains City Group. Ecol. Econ. 2022, 38, 92–99. [Google Scholar]
  39. Wang, Z.F.; Zhao, S.S. Temporal and Spatial Dynamic Evolution and Influencing Factors of Tourism Efficiency in Hunan Province Based on DEA-Malmquist Model. Resour. Environ. Yangtze Basin 2019, 28, 1886–1897. [Google Scholar] [CrossRef]
  40. Liu, D.D.; Zhaosong, Y.Y.; Guo, Y. Energy efficiency and its determinants of western China: Total factor perspective. China Environ. Sci. 2015, 35, 1911–1920. [Google Scholar]
  41. National Bureau of Statistics of China (NBS). Available online: http://www.stats.gov.cn/tjsj/ndsj/ (accessed on 12 March 2022).
  42. National Bureau of Statistics of China (NBS). Available online: http://www.stats.gov.cn/tjgz/wzlj/dftjwz/ (accessed on 22 March 2022).
  43. Ministry of Land and Resources (MLMR). Available online: https://www.gov.cn/fuwu/bumendifangdating/bumendating/guotuziyuanbu/ (accessed on 28 March 2022).
  44. China National Coal Association (CNCA). Available online: http://www.coalchina.org.cn/ (accessed on 29 March 2022).
  45. China Emission Accounts and Datasets (CEADs). Available online: https://www.ceads.net.cn/data/ (accessed on 10 April 2022).
  46. Yuan, L.; Zhang, P.S. Key technology and path thinking of dynamic reconstruction of mine transparent geological model. J. China Coal Soc. 2023, 48, 1–14. [Google Scholar] [CrossRef]
  47. Price Waterhouse Coopers (PWC). Mining for Efficiency. Price Waterhouse Coopers, Sydney. 2014. Available online: https://www.pwc.com.au/industry/energy-utilities-mining/assets/mining-efficiency-aug14.pdf/ (accessed on 15 December 2022).
Figure 1. Technology road map.
Sustainability 15 05183 g001
Figure 2. Location of the study area.
Sustainability 15 05183 g002
Figure 3. The average value of various efficiencies from 2011 to 2020.
Sustainability 15 05183 g003
Figure 4. Kernel density curve of smart mine construction development efficiency.
Sustainability 15 05183 g004
Table 1. Comparison of the advantages of DEA models.
Model NameAdvantages
Traditional DEAIt can evaluate the effectiveness of the same type of DMUs with multiple inputs and outputs.
SBMIt can effectively avoid the bias caused by the radial and angular metrics of traditional DEA models.
Undesirable SBMIt is more reflective of the nature of efficiency evaluation by considering non-desired output factors.
Super-efficiency SBMIt can further compare and distinguish the effective DMUs in the frontier.
US-SBMIt combines the advantages of non-desired and super-efficient SBM models.
Table 2. Summary of the kernel density estimation model’s advantages.
Model NameAdvantages
KDEGood smoothness
Good statistical characteristics
High accuracy
Weak model dependency
Good visualization
Table 3. Evaluation index system for the development efficiency of smart mine construction.
Indicator TypeIndicator MeaningIndicatorsExplanation of IndicatorsUnit
Input elementsCapital InvestmentTotal fixed asset investment in the coal industryMeasuring the level of investment in infrastructure developmentRMB 100 million
Labor inputThe annual average number of employees in the coal industryMeasuring the degree of realization of unmanned work surfaces10,000 people
Resource inputTotal electricity consumption in the coal industryMeasures the degree of input of production resources in the industry100 million kWh
Technical inputInternal expenditure of R&D funds in the coal industryMeasures the degree of industrial development of science and technology funding investmentRMB 10,000
R&D personnel equivalent (full-time equivalent)Measures the degree of industry development science and technology in terms of human inputPerson-year
Output elementsExpected outputRevenue from the main business of the coal industryMeasuring the degree of comprehensive revenue-based construction in the industryRMB 100 million
Coal productionMeasuring the degree of construction of efficient mines in the industry10 kilo-tons
Number of smart, unmanned work surfacesMeasuring the degree of smart mine construction in the industryEach
Total current assets of the coal industryMeasuring the construction degree of industry management information technologyRMB 100 million
The proportion of green mines in enterprises above the scaleMeasuring the extent to which the industry has achieved green mining%
Undesired outputsMortality rate per million tonsMeasuring the degree of construction of safe mines in the industryPeople
CO2 emissions from the coal industryMeasuring the degree of construction of clean mines in the industryMillion tons
Table 4. The average efficiency of all provinces (municipalities) from 2011 to 2020.
RegionTEPTESE
Fujian0.65200.67700.9546
Guangxi1.11261.21040.9239
Hebei0.44940.49170.9157
Henan0.15510.17600.7475
Hunan0.33740.54390.6562
Jilin0.79350.88650.8795
Jiangsu0.75870.83580.8539
Shandong0.91120.97290.8936
Shanxi0.86381.00840.8223
Shaanxi0.78900.93240.8520
Xinjiang0.72350.83430.8567
Yunnan0.35990.39220.9278
Chongqing1.11991.29660.9005
Average value0.69430.78910.8603
Note Total Efficiency (TE) = Pure Technical Efficiency (PTE) × Scale Efficiency (SE).
Table 5. The average value of input redundancy of all provinces (municipalities) from 2011 to 2020.
RegionFixed Asset Investment Redundancy RateNumber of Practitioners’ Redundancy RateTotal Electricity Consumption Redundancy RateRedundancy Rate of Internal Expenditure of R&D FundsR&D Staff Redundancy Rate
Fujian0.41050.23140.01630.21460.5393
Guangxi0.00000.00000.00000.00000.0000
Hebei0.00000.03970.08870.19710.1693
Henan0.00000.44590.00000.22100.5116
Hunan0.13960.44930.05320.13250.6394
Jilin0.08250.13310.07700.23000.1954
Jiangsu0.06790.31700.22000.27020.3152
Shandong0.00000.00140.00000.04010.0413
Shanxi0.05710.02490.00000.03320.0395
Shaanxi0.16410.04730.00360.08920.1588
Xinjiang0.39480.32810.26000.18680.4146
Yunnan0.42840.39420.02070.02850.5777
Chongqing0.00000.00000.00000.00000.0000
Table 6. Regression results of factors affecting the development efficiency of smart mine construction.
RegionRegression CoefficientStandard ErrorZ-Valuep-Value
Economic Development Level0.384 *0.19901.930.053
Industry Structure0.0187 **0.00752.510.012
Environmental Policy−0.156 ***0.0586−2.670.008
Level of government intervention0.0204 **0.01012.020.044
Human capital level−0.346 ***0.1230−2.800.005
Degree of openness to the outside world0.06170.06490.950.342
Technology Innovation0.000342 *0.00021.760.079
Coal Resource Advantage Degree−0.09160.0699−1.310.190
_cons1.2962.49000.520.603
Standard errors in parentheses. * p < 0.1, ** p < 0.05, *** p < 0.01.
Disclaimer/Publisher’s Note: The statements, opinions and data contained in all publications are solely those of the individual author(s) and contributor(s) and not of MDPI and/or the editor(s). MDPI and/or the editor(s) disclaim responsibility for any injury to people or property resulting from any ideas, methods, instructions or products referred to in the content.

