
Elemental Behavior during Weathering and Pedogenesis of Clay-Rich Red Soils Developed in Different Lithologies in Java–Madura and Sulawesi in Indonesia

Abstract
:1. Introduction
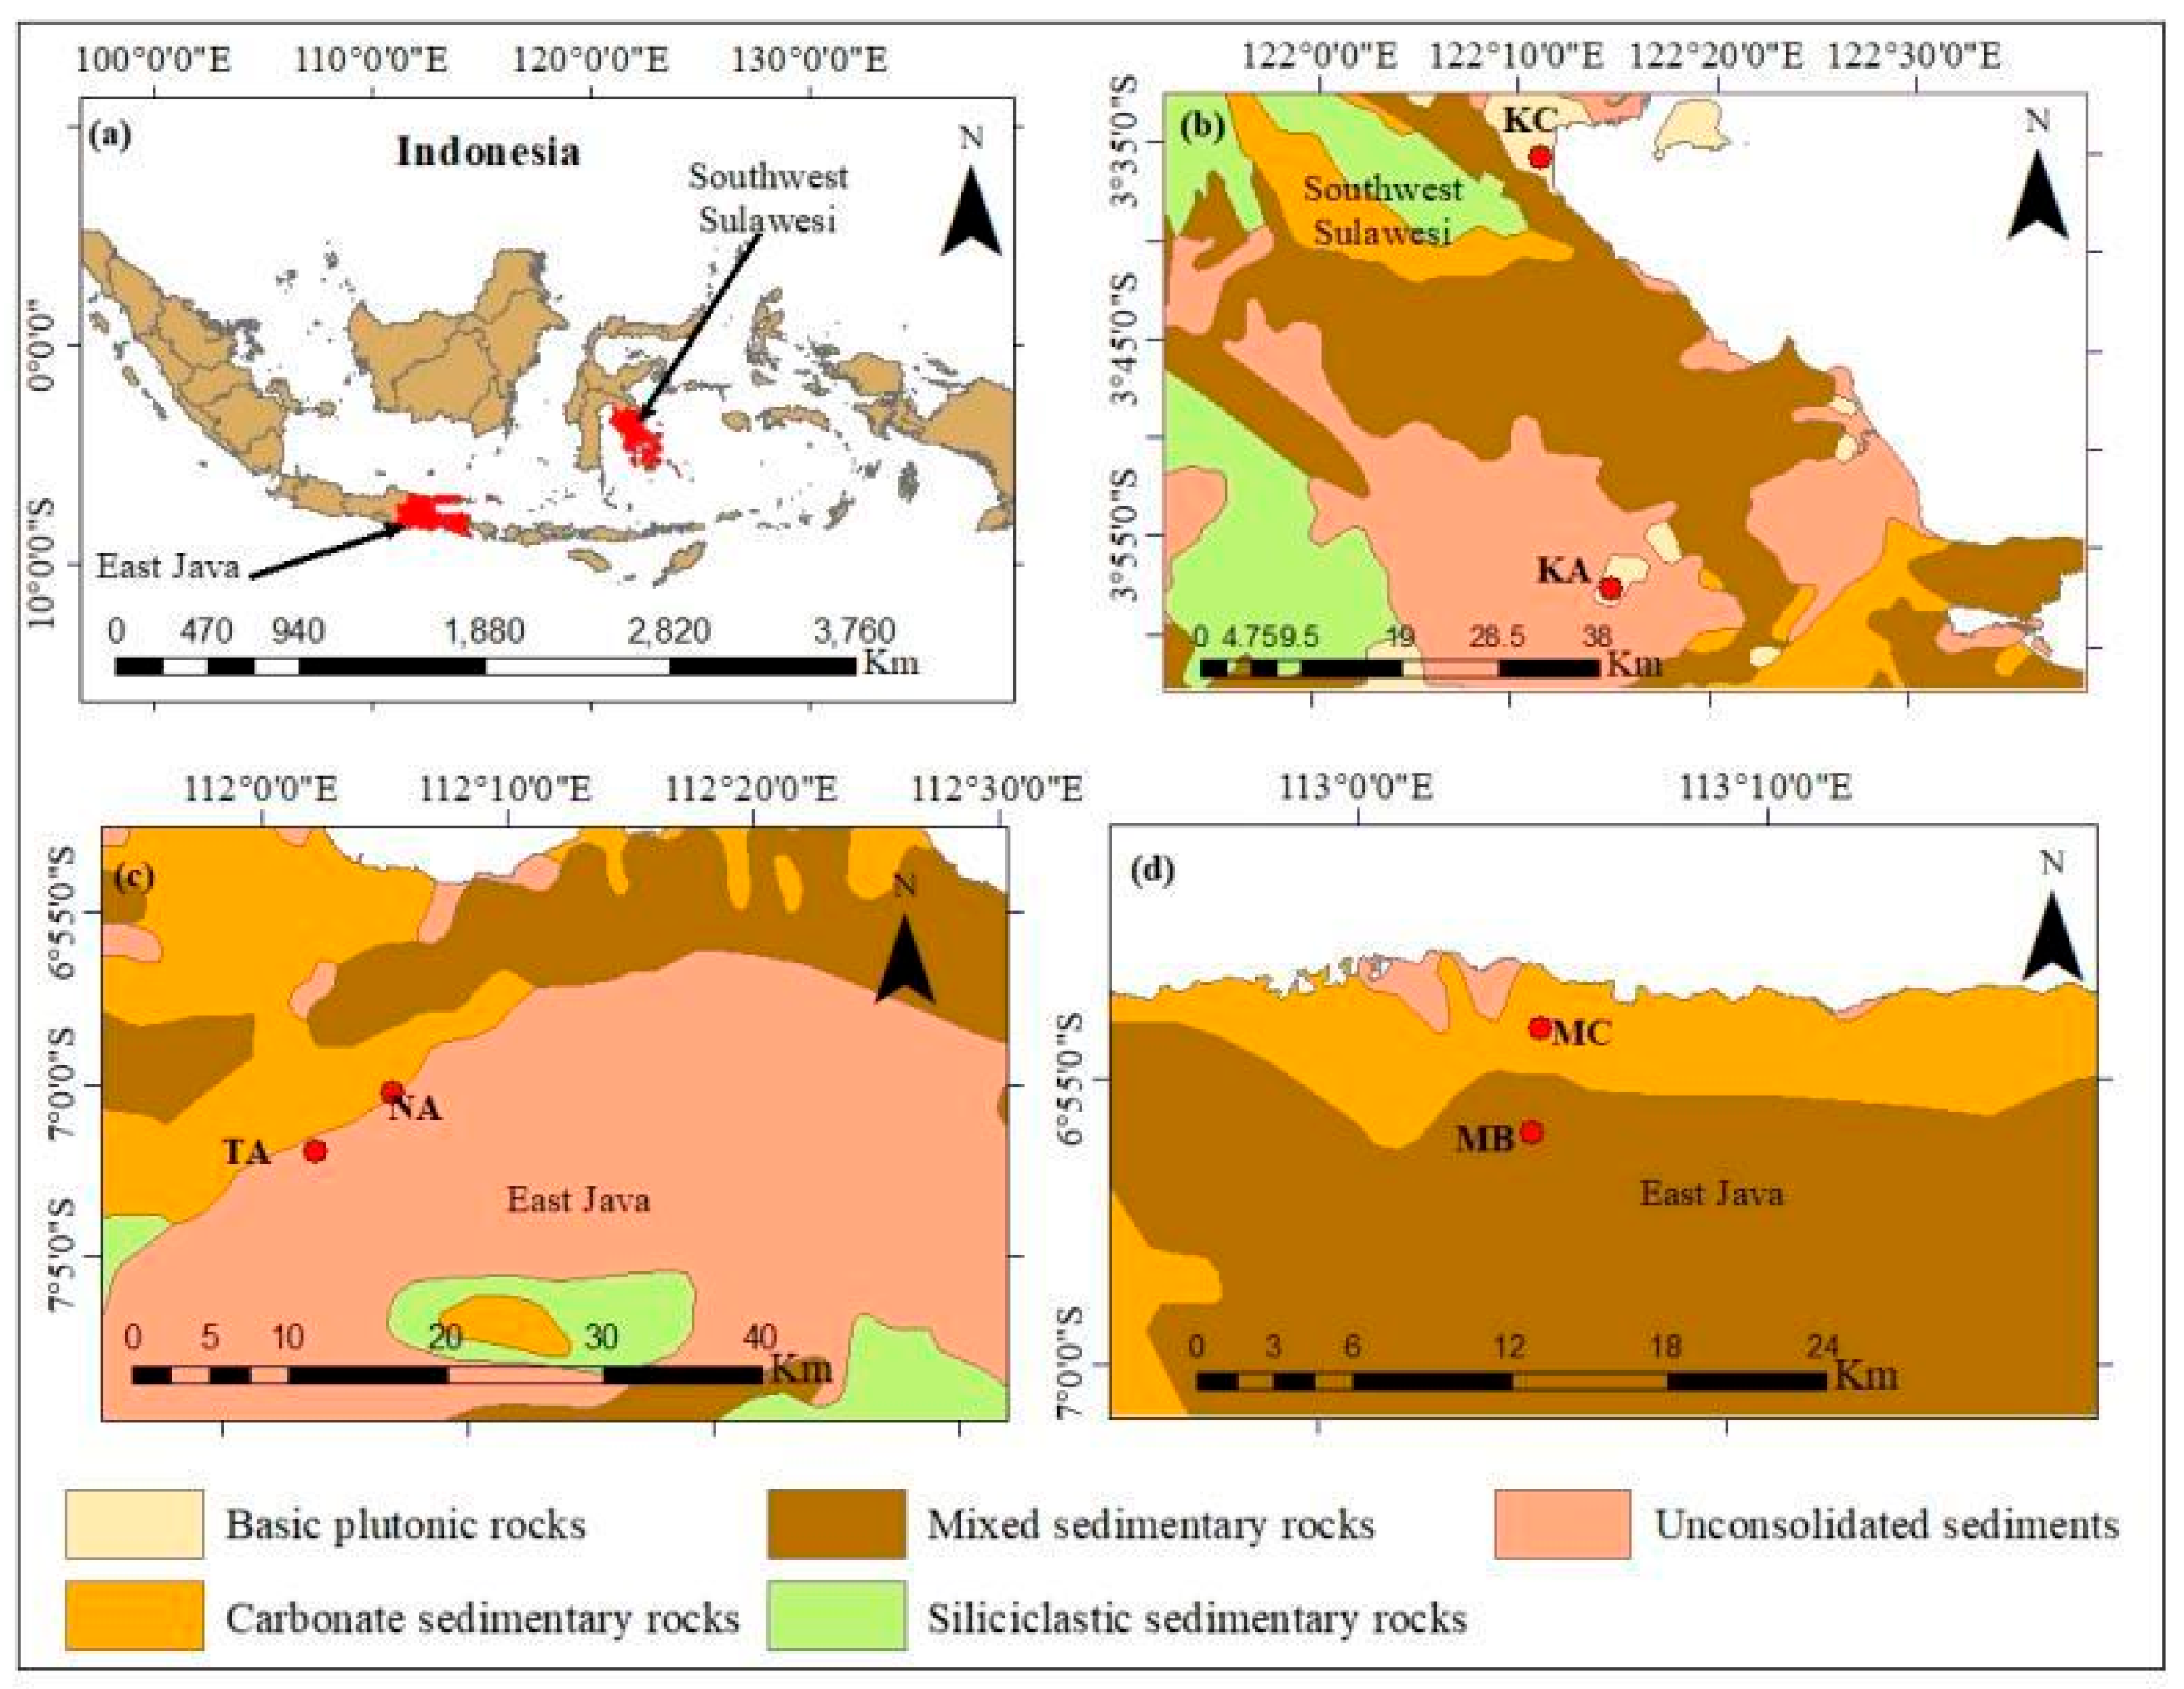
2. Geography and Geological Setting
2.1. Materials and Methods
2.2. Sampling and Analytical Methods
2.3. Experimental and Chemical Analysis Methods
2.4. Migration Coefficient
3. Results
3.1. Major Elements and Physiochemical Properties
3.2. Trace Element Distribution
3.3. Rare Earth Element (REE) Distribution

| Samples | MC-0 | MC-1 | MC-2 | MC-3 | MC-4 | MC-5 | MC-6 | MC-7 | MC-8 | MC-9 | MC-10 | MC-11 | MC-12 |
|---|---|---|---|---|---|---|---|---|---|---|---|---|---|
| La | 1.20 | 3.04 | 45.10 | 46.60 | 46.20 | 45.80 | 48.20 | 41.30 | 44.70 | 39.10 | 42.50 | 43.40 | 43.20 |
| Ce | 1.32 | 3.83 | 77.90 | 80.40 | 79.40 | 80.40 | 83.80 | 74.00 | 81.20 | 70.10 | 76.80 | 78.10 | 78.90 |
| Pr | 0.29 | 0.77 | 11.30 | 11.70 | 11.70 | 11.40 | 11.90 | 10.20 | 11.30 | 9.77 | 10.50 | 10.90 | 10.90 |
| Nd | 1.32 | 3.45 | 47.30 | 48.50 | 48.70 | 48.10 | 50.00 | 43.40 | 48.30 | 41.90 | 44.20 | 45.50 | 46.40 |
| Sm | 0.31 | 0.80 | 10.40 | 10.60 | 10.70 | 10.40 | 11.00 | 9.68 | 10.70 | 9.07 | 9.81 | 10.50 | 10.30 |
| Eu | 0.08 | 0.21 | 2.60 | 2.58 | 2.68 | 2.68 | 2.87 | 2.53 | 2.79 | 2.35 | 2.52 | 2.61 | 2.60 |
| Gd | 0.49 | 1.20 | 9.11 | 9.94 | 9.31 | 8.97 | 10.40 | 9.61 | 10.30 | 8.80 | 9.00 | 10.40 | 8.95 |
| Tb | 0.06 | 0.18 | 1.53 | 1.44 | 1.56 | 1.56 | 1.56 | 1.60 | 1.72 | 1.34 | 1.56 | 1.55 | 1.44 |
| Dy | 0.39 | 1.01 | 9.97 | 9.48 | 9.89 | 9.80 | 10.40 | 9.57 | 10.90 | 9.46 | 10.10 | 9.88 | 10.30 |
| Ho | 0.09 | 0.17 | 1.95 | 1.91 | 1.85 | 2.12 | 1.95 | 1.95 | 2.07 | 1.85 | 1.99 | 1.97 | 1.95 |
| Er | 0.24 | 0.59 | 5.59 | 5.77 | 5.69 | 5.38 | 5.83 | 4.81 | 5.74 | 5.38 | 5.27 | 5.79 | 5.89 |
| Tm | 0.01 | 0.10 | 1.21 | 1.06 | 1.10 | 1.00 | 1.16 | 1.10 | 1.09 | 1.17 | 1.15 | 1.15 | 1.06 |
| Yb | 0.28 | 0.83 | 5.92 | 6.81 | 6.07 | 6.15 | 7.11 | 5.49 | 6.30 | 5.66 | 5.84 | 6.89 | 6.10 |
| Lu | 0.03 | 0.09 | 1.00 | 0.87 | 0.89 | 0.94 | 0.87 | 0.98 | 1.03 | 0.85 | 1.02 | 0.99 | 0.94 |
| LREE | 4.52 | 12.10 | 194.60 | 200.38 | 199.38 | 198.78 | 207.77 | 181.11 | 198.99 | 172.29 | 186.33 | 191.01 | 192.30 |
| HREE | 1.59 | 4.17 | 36.28 | 37.28 | 36.36 | 35.92 | 39.28 | 35.11 | 39.15 | 34.51 | 35.93 | 38.62 | 36.63 |
| LREE/HREE | 2.84 | 2.90 | 5.36 | 5.37 | 5.48 | 5.53 | 5.29 | 5.16 | 5.08 | 4.99 | 5.19 | 4.95 | 5.25 |
| ΣREE | 6.10 | 16.27 | 230.88 | 237.66 | 235.74 | 234.70 | 247.05 | 216.22 | 238.14 | 206.80 | 222.26 | 229.63 | 228.93 |
| δCe | 0.54 | 0.60 | 0.83 | 0.83 | 0.82 | 0.85 | 0.84 | 0.87 | 0.87 | 0.86 | 0.88 | 0.86 | 0.88 |
| δEu | 0.51 | 0.59 | 1.21 | 1.18 | 1.20 | 1.26 | 1.18 | 1.16 | 1.17 | 1.18 | 1.23 | 1.13 | 1.24 |
| (La/Yb)N | 1.71 | 1.44 | 3.00 | 2.69 | 3.00 | 2.93 | 2.67 | 2.96 | 2.79 | 2.72 | 2.86 | 2.48 | 2.79 |
| (La/Sm)N | 1.53 | 1.50 | 1.71 | 1.73 | 1.70 | 1.73 | 1.72 | 1.68 | 1.64 | 1.70 | 1.70 | 1.63 | 1.65 |
| (Gd/Yb)N | 1.77 | 1.44 | 1.54 | 1.46 | 1.53 | 1.46 | 1.46 | 1.75 | 1.63 | 1.55 | 1.54 | 1.51 | 1.47 |
| Samples | MC-13 | MC-14 | MC-15 | MC-16 | MC-17 | NA-7 | NA-6 | NA-5 | NA-4 | NA-3 | NA-2 | NA-1 | NA-0 |
| La | 43.90 | 46.20 | 48.70 | 47.80 | 50.90 | 19.50 | 18.10 | 21.70 | 17.80 | 17.60 | 17.90 | 17.50 | 1.32 |
| Ce | 80.80 | 83.10 | 87.30 | 81.60 | 87.70 | 40.00 | 36.20 | 41.30 | 38.00 | 78.60 | 89.50 | 46.80 | 1.41 |
| Pr | 11.00 | 11.80 | 12.30 | 11.90 | 12.30 | 4.54 | 4.40 | 5.55 | 4.52 | 4.33 | 4.43 | 3.90 | 0.31 |
| Nd | 46.60 | 50.20 | 52.60 | 50.50 | 51.60 | 17.80 | 18.00 | 22.60 | 18.50 | 16.90 | 17.10 | 15.10 | 1.46 |
| Sm | 10.30 | 11.00 | 11.50 | 11.00 | 10.80 | 3.52 | 3.69 | 5.54 | 3.75 | 3.46 | 3.52 | 2.75 | 0.31 |
| Eu | 2.60 | 2.82 | 3.06 | 2.74 | 2.59 | 0.83 | 0.87 | 1.24 | 0.89 | 0.77 | 0.80 | 0.58 | 0.06 |
| Gd | 9.25 | 10.10 | 10.70 | 10.20 | 8.55 | 2.95 | 2.27 | 4.81 | 3.15 | 2.32 | 2.89 | 2.21 | 0.40 |
| Tb | 1.61 | 1.65 | 1.67 | 1.49 | 1.50 | 0.39 | 0.47 | 0.66 | 0.50 | 0.39 | 0.40 | 0.30 | 0.08 |
| Dy | 9.88 | 10.80 | 11.10 | 10.70 | 9.64 | 2.96 | 3.09 | 4.67 | 3.23 | 2.71 | 2.82 | 2.36 | 0.33 |
| Ho | 1.96 | 2.14 | 2.31 | 2.13 | 1.88 | 0.56 | 0.54 | 0.77 | 0.58 | 0.56 | 0.53 | 0.47 | 0.08 |
| Er | 5.35 | 5.70 | 6.04 | 5.92 | 5.21 | 1.78 | 1.58 | 2.13 | 1.68 | 1.48 | 1.32 | 1.44 | 0.17 |
| Tm | 1.10 | 1.20 | 1.20 | 1.12 | 1.08 | 0.37 | 0.38 | 0.44 | 0.37 | 0.34 | 0.43 | 0.35 | 0.04 |
| Yb | 6.31 | 5.76 | 6.99 | 6.26 | 5.62 | 1.79 | 1.86 | 2.15 | 2.21 | 1.99 | 1.79 | 2.02 | 0.14 |
| Lu | 0.87 | 0.93 | 1.09 | 0.82 | 0.96 | 0.37 | 0.33 | 0.49 | 0.31 | 0.34 | 0.34 | 0.27 | 0.04 |
| LREE | 195.20 | 205.12 | 215.46 | 205.54 | 215.89 | 86.19 | 81.26 | 97.93 | 83.46 | 121.66 | 133.25 | 86.63 | 4.87 |
| HREE | 36.33 | 38.28 | 41.10 | 38.64 | 34.44 | 11.17 | 10.51 | 16.12 | 12.04 | 10.13 | 10.52 | 9.42 | 1.28 |
| LREE/HREE | 5.37 | 5.36 | 5.24 | 5.32 | 6.27 | 7.72 | 7.73 | 6.08 | 6.93 | 12.01 | 12.66 | 9.20 | 3.82 |
| ΣREE | 231.53 | 243.40 | 256.56 | 244.18 | 250.33 | 97.36 | 91.77 | 114.05 | 95.50 | 131.80 | 143.77 | 96.04 | 6.15 |
| δCe | 0.88 | 0.86 | 0.86 | 0.82 | 0.84 | 1.02 | 0.98 | 0.91 | 1.02 | 2.17 | 2.42 | 1.36 | 0.53 |
| δEu | 1.25 | 1.19 | 1.19 | 1.16 | 1.38 | 3.45 | 3.48 | 2.23 | 3.08 | 7.72 | 7.80 | 5.28 | 1.12 |
| (La/Yb)N | 2.74 | 3.16 | 2.74 | 3.01 | 3.56 | 7.34 | 6.56 | 6.80 | 5.43 | 5.96 | 6.74 | 5.84 | 6.45 |
| (La/Sm)N | 1.68 | 1.65 | 1.67 | 1.71 | 1.85 | 3.48 | 3.09 | 2.46 | 2.99 | 3.20 | 3.20 | 4.00 | 2.69 |
| (Gd/Yb)N | 1.47 | 1.75 | 1.53 | 1.63 | 1.52 | 1.33 | 0.98 | 1.81 | 1.15 | 0.94 | 1.30 | 0.88 | 2.34 |
| Samples | MB-10 | MB-9 | MB-8 | MB-7 | MB-6 | MB-5 | MB-4 | MB-3 | MB-2 | MB-1 | MB-0 | TA-5 | TA-4 |
| La | 27.20 | 16.90 | 14.20 | 10.10 | 8.36 | 9.58 | 3.82 | 8.80 | 8.51 | 6.64 | 1.02 | 7.53 | 5.68 |
| Ce | 52.50 | 30.30 | 26.60 | 18.90 | 14.60 | 17.50 | 6.19 | 17.00 | 16.80 | 12.90 | 1.79 | 12.60 | 9.45 |
| Pr | 6.24 | 4.12 | 3.34 | 2.48 | 1.91 | 2.21 | 0.85 | 2.14 | 2.06 | 1.58 | 0.22 | 1.91 | 1.43 |
| Nd | 26.20 | 16.50 | 13.60 | 9.99 | 7.46 | 8.59 | 3.21 | 8.27 | 7.74 | 6.07 | 0.89 | 8.29 | 6.22 |
| Sm | 6.36 | 3.22 | 2.74 | 2.03 | 1.46 | 1.80 | 0.65 | 1.64 | 1.53 | 1.19 | 0.19 | 1.83 | 1.35 |
| Eu | 1.41 | 0.87 | 0.68 | 0.49 | 0.41 | 0.36 | 0.15 | 0.37 | 0.33 | 0.26 | 0.05 | 0.50 | 0.36 |
| Gd | 5.78 | 3.02 | 2.74 | 1.82 | 1.22 | 1.72 | 0.77 | 1.32 | 1.06 | 1.08 | 0.26 | 1.29 | 1.48 |
| Tb | 0.72 | 0.46 | 0.38 | 0.33 | 0.22 | 0.22 | 0.09 | 0.21 | 0.15 | 0.10 | 0.02 | 0.31 | 0.31 |
| Dy | 4.66 | 3.14 | 2.67 | 1.80 | 1.22 | 1.43 | 0.70 | 1.37 | 1.33 | 1.12 | 0.18 | 2.02 | 1.53 |
| Ho | 0.80 | 0.60 | 0.41 | 0.36 | 0.22 | 0.29 | 0.13 | 0.32 | 0.28 | 0.24 | 0.05 | 0.42 | 0.26 |
| Er | 2.39 | 1.66 | 1.26 | 0.95 | 0.76 | 0.69 | 0.32 | 0.67 | 0.72 | 0.61 | 0.08 | 1.09 | 0.84 |
| Tm | 0.45 | 0.35 | 0.33 | 0.21 | 0.15 | 0.16 | 0.06 | 0.16 | 0.12 | 0.11 | 0.01 | 0.34 | 0.20 |
| Yb | 2.83 | 2.12 | 1.82 | 1.14 | 0.70 | 0.72 | 0.44 | 0.80 | 0.72 | 0.85 | 0.11 | 1.32 | 0.65 |
| Lu | 0.45 | 0.27 | 0.18 | 0.20 | 0.14 | 0.11 | 0.09 | 0.15 | 0.18 | 0.08 | 0.01 | 0.14 | 0.18 |
| LREE | 119.91 | 71.91 | 61.16 | 43.99 | 34.20 | 40.04 | 14.86 | 38.22 | 36.97 | 28.64 | 4.16 | 32.66 | 24.49 |
| HREE | 18.07 | 11.61 | 9.80 | 6.81 | 4.62 | 5.32 | 2.60 | 5.00 | 4.58 | 4.19 | 0.73 | 6.93 | 5.44 |
| LREE/HREE | 6.63 | 6.19 | 6.24 | 6.46 | 7.40 | 7.52 | 5.72 | 7.65 | 8.07 | 6.84 | 5.74 | 4.71 | 4.50 |
| ΣREE | 137.98 | 83.52 | 70.96 | 50.80 | 38.82 | 45.36 | 17.45 | 43.22 | 41.55 | 32.82 | 4.89 | 39.59 | 29.93 |
| δCe | 0.97 | 0.87 | 0.93 | 0.91 | 0.88 | 0.92 | 0.83 | 0.94 | 0.97 | 0.96 | 0.91 | 0.80 | 0.80 |
| δEu | 2.41 | 2.70 | 2.70 | 2.73 | 3.04 | 2.77 | 2.44 | 3.21 | 3.67 | 3.16 | 2.20 | 2.28 | 1.86 |
| (La/Yb)N | 6.48 | 5.37 | 5.26 | 5.97 | 8.03 | 9.03 | 5.88 | 7.45 | 7.96 | 5.28 | 6.43 | 3.85 | 5.86 |
| (La/Sm)N | 2.69 | 3.30 | 3.26 | 3.13 | 3.60 | 3.35 | 3.72 | 3.38 | 3.50 | 3.51 | 3.31 | 2.59 | 2.65 |
| (Gd/Yb)N | 1.65 | 1.15 | 1.21 | 1.29 | 1.40 | 1.94 | 1.42 | 1.34 | 1.19 | 1.03 | 1.99 | 0.79 | 1.83 |
| Samples | TA-3 | TA-2 | TA-1 | TA-0 | KA-0 | KA-1 | KA-2 | KA-3 | KA-4 | KA-5 | KC-rock | KC-0 | KC-1 |
| La | 7.58 | 10.80 | 13.70 | 1.25 | 0.07 | 0.09 | 0.11 | 0.48 | 0.44 | 0.48 | 0.03 | 0.23 | 4.20 |
| Ce | 12.80 | 17.90 | 23.20 | 1.60 | 0.15 | 0.09 | 0.10 | 0.61 | 0.65 | 0.72 | 0.07 | 0.50 | 1.40 |
| Pr | 1.85 | 2.65 | 3.41 | 0.32 | 0.04 | 0.02 | 0.03 | 0.15 | 0.14 | 0.13 | 0.01 | 0.13 | 1.19 |
| Nd | 7.77 | 11.40 | 15.00 | 1.37 | 0.27 | 0.10 | 0.11 | 0.66 | 0.63 | 0.63 | 0.03 | 0.59 | 6.11 |
| Sm | 1.70 | 2.51 | 3.34 | 0.35 | 0.19 | 0.02 | 0.03 | 0.24 | 0.17 | 0.19 | 0.01 | 0.06 | 2.01 |
| Eu | 0.42 | 0.65 | 0.82 | 0.10 | 0.07 | 0.01 | 0.02 | 0.07 | 0.05 | 0.06 | 0.00 | 0.01 | 0.73 |
| Gd | 1.40 | 2.37 | 3.55 | 0.37 | 0.42 | 0.00 | 0.07 | 0.35 | 0.29 | 0.23 | 0.06 | 0.08 | 2.88 |
| Tb | 0.22 | 0.35 | 0.53 | 0.05 | 0.11 | 0.01 | 0.01 | 0.07 | 0.03 | 0.05 | 0.00 | 0.03 | 0.42 |
| Dy | 1.71 | 2.69 | 3.46 | 0.41 | 0.95 | 0.06 | 0.06 | 0.42 | 0.35 | 0.36 | 0.00 | 0.15 | 3.84 |
| Ho | 0.34 | 0.52 | 0.76 | 0.12 | 0.21 | 0.01 | 0.04 | 0.12 | 0.08 | 0.09 | 0.01 | 0.04 | 0.76 |
| Er | 0.90 | 1.42 | 1.76 | 0.24 | 0.79 | 0.07 | 0.11 | 0.27 | 0.27 | 0.30 | 0.01 | 0.16 | 2.50 |
| Tm | 0.16 | 0.30 | 0.38 | 0.06 | 0.18 | 0.03 | 0.01 | 0.07 | 0.04 | 0.06 | 0.01 | 0.03 | 0.57 |
| Yb | 1.22 | 1.90 | 1.76 | 0.18 | 1.17 | 0.11 | 0.17 | 0.30 | 0.34 | 0.50 | 0.00 | 0.28 | 2.91 |
| Lu | 0.13 | 0.23 | 0.35 | 0.04 | 0.10 | 0.01 | 0.01 | 0.06 | 0.03 | 0.04 | 0.01 | 0.05 | 0.44 |
| LREE | 32.12 | 45.91 | 59.47 | 4.99 | 0.79 | 0.34 | 0.39 | 2.22 | 2.09 | 2.20 | 0.14 | 1.52 | 15.64 |
| HREE | 6.08 | 9.79 | 12.56 | 1.46 | 3.92 | 0.30 | 0.47 | 1.66 | 1.43 | 1.63 | 0.11 | 0.81 | 14.31 |
| LREE/HREE | 5.28 | 4.69 | 4.73 | 3.42 | 0.20 | 1.16 | 0.83 | 1.34 | 1.46 | 1.35 | 1.30 | 1.86 | 1.09 |
| ΣREE | 38.20 | 55.69 | 72.03 | 6.45 | 4.71 | 0.64 | 0.86 | 3.88 | 3.52 | 3.83 | 0.24 | 2.33 | 29.95 |
| δCe | 0.82 | 0.81 | 0.82 | 0.61 | 0.74 | 0.52 | 0.42 | 0.55 | 0.63 | 0.69 | 1.08 | 0.70 | 0.15 |
| δEu | 2.31 | 2.04 | 1.87 | 1.23 | 0.15 | 0.06 | 0.53 | 0.59 | 0.81 | 0.97 | 1.07 | 1.88 | 0.16 |
| (La/Yb)N | 4.19 | 3.83 | 5.25 | 4.82 | 0.04 | 0.57 | 0.44 | 1.08 | 0.89 | 0.64 | 10.11 | 0.55 | 0.97 |
| (La/Sm)N | 2.80 | 2.71 | 2.58 | 2.23 | 0.21 | 2.36 | 2.00 | 1.27 | 1.61 | 1.60 | 3.77 | 2.22 | 1.31 |
| (Gd/Yb)N | 0.93 | 1.01 | 1.63 | 1.71 | 0.29 | 0.02 | 0.35 | 0.94 | 0.70 | 0.37 | 23.00 | 0.25 | 0.80 |
| Samples | KC-2 | KC-3 | KC-4 | KC-5 | KC-6 | ||||||||
| La | 2.63 | 3.57 | 3.09 | 2.40 | 1.79 | ||||||||
| Ce | 1.27 | 1.27 | 1.71 | 1.45 | 1.11 | ||||||||
| Pr | 0.79 | 1.02 | 0.89 | 0.75 | 0.58 | ||||||||
| Nd | 4.01 | 4.93 | 4.45 | 3.89 | 2.91 | ||||||||
| Sm | 1.31 | 1.51 | 1.28 | 1.39 | 1.02 | ||||||||
| Eu | 0.47 | 0.55 | 0.44 | 0.45 | 0.34 | ||||||||
| Gd | 2.27 | 2.22 | 1.56 | 1.74 | 1.67 | ||||||||
| Tb | 0.32 | 0.35 | 0.41 | 0.36 | 0.26 | ||||||||
| Dy | 2.55 | 2.71 | 2.24 | 2.66 | 1.95 | ||||||||
| Ho | 0.61 | 0.55 | 0.51 | 0.49 | 0.38 | ||||||||
| Er | 1.51 | 1.66 | 1.25 | 1.85 | 1.30 | ||||||||
| Tm | 0.35 | 0.38 | 0.27 | 0.34 | 0.17 | ||||||||
| Yb | 2.38 | 2.45 | 1.44 | 2.19 | 1.20 | ||||||||
| Lu | 0.25 | 0.45 | 0.36 | 0.32 | 0.27 | ||||||||
| LREE | 10.48 | 12.85 | 11.86 | 10.34 | 7.74 | ||||||||
| HREE | 10.24 | 10.78 | 8.04 | 9.94 | 7.20 | ||||||||
| LREE/HREE | 1.02 | 1.19 | 1.47 | 1.04 | 1.08 | ||||||||
| ΣREE | 20.72 | 23.63 | 19.90 | 20.27 | 14.94 | ||||||||
| δCe | 0.21 | 0.16 | 0.25 | 0.26 | 0.26 | ||||||||
| δEu | 0.20 | 0.19 | 0.34 | 0.26 | 0.24 | ||||||||
| (La/Yb)N | 0.75 | 0.98 | 1.45 | 0.74 | 1.01 | ||||||||
| (La/Sm)N | 1.26 | 1.49 | 1.52 | 1.09 | 1.10 | ||||||||
| (Gd/Yb)N | 0.77 | 0.73 | 0.87 | 0.64 | 1.12 |

3.4. Migration Coefficient
4. Discussion
4.1. Source of Red Soil Materials
4.1.1. Major Elements Evidence
4.1.2. Trace Element Evidence
4.1.3. Rare Earth Elements Evidence
4.2. Elemental Behavior during Weathering and Pedogenesis
4.3. Chemical Weathering and Pedogenesis of Red Soil Profiles
5. Conclusions
Author Contributions
Funding
Data Availability Statement
Acknowledgments
Conflicts of Interest
References
- Birkeland, P.W. Soils and Geomorphology; Oxford University Press: London, UK, 1999. [Google Scholar]
- Mee, A.C.; Bestland, E.A.; Spooner, N.A. Age and origin of Terra Rossa soils in the Coonawarra area of South Australia. Geomorphology 2004, 58, 1–25. [Google Scholar] [CrossRef]
- Muhs, D.R.; Bettis, E.A.; Been, J.; Mcgeehin, J.P. Impact of Climate and Parent Material on Chemical Weathering in Loess-derived Soils of the Mississippi River Valley. Soil Sci. Soc. Am. J. 2001, 65, 1761–1777. [Google Scholar] [CrossRef]
- Muhs, D.R.; Budahn, J.R. Geochemical evidence for African dust and volcanic ash inputs to terra rossa soils on carbonate reef terraces, northern Jamaica, West Indies. Quat. Int. 2009, 196, 13–35. [Google Scholar] [CrossRef] [Green Version]
- Olson, C.G.; Ruhe, R.V.; Mausbach, M.J. The terra rossa limestone contact phenomena in karst, Southern Indiana. Soil Sci. Soc. Am. J. 1980, 44, 1075–1079. [Google Scholar] [CrossRef]
- Wiharso, D. Characteristics of Red Soils from The University of Lampung Experiment Station in Tanjungan, South Lampung. J. Trop. Soil 1996, 2, 15–22. [Google Scholar]
- FAO. World Reference Base for Soil Resources. International Soil Classification System for Naming Soils and Creating Legends for Soil Maps; Update 2015; World Soil Resources Report No. 106; FAO: Rome, Italy, 2015. [Google Scholar]
- Feng, J.L.; Cui, Z.J.; Zhu, L.P. Origin of terra rossa over dolomite on the Yunnan Guizhou Plateau, China. Geochem. J. 2009, 43, 151–166. [Google Scholar] [CrossRef] [Green Version]
- Sustersic, F.; Rejsek, K.; Misic, M.; Eichler, F. The role of loamy sediment in the context of steady state karst surface lowering. Geomorphology 2009, 106, 35–45. [Google Scholar] [CrossRef]
- Merino, E.; Banerjee, A. Terra rossa genesis, implications for karst, and eolian dust; a geodynamic thread. J. Geol. 2008, 116, 62–75. [Google Scholar] [CrossRef] [Green Version]
- Berner, R.A.; Lasaga, A.C.; Garrels, R.M. The carbonate–silicate geochemical cycle and its effect on atmospheric carbon-dioxide over the past 100 million years. Am. J. Sci. 1983, 283, 641–683. [Google Scholar] [CrossRef]
- Berner, R.A.; Berner, E.K. Silicate weathering and climate. In Tectonic Uplift and Climate Change; Springer: New York, NY, USA, 1997; pp. 19–40. [Google Scholar]
- Dessert, C.; Dupré, B.; Gaillardet, J.; François, L.M.; Allègre, C.J. Basalt weathering laws and the impact of basalt weathering on the global carbon cycle. Chem. Geol. 2003, 202, 257–273. [Google Scholar] [CrossRef]
- Gislason, S.R.; Oelkers, E.H.; Eiriksdottir, E.S.; Kardjilov, M.I.; Gisladottir, G.; Sigfusson, B.; Snorrason, A.; Elefsen, S.; Hardardottir, J.; Torssander, P.; et al. Direct evidence of the feedback between climate and weathering. Earth Planet. Sci. Lett. 2009, 277, 213–222. [Google Scholar] [CrossRef]
- Jha, P.K.; Tiwari, J.; Singh, U.K.; Kumar, M.; Subramanian, V. Chemical weathering and associated CO2 consumption in the Godavari River basin, India. Chem. Geol. 2009, 264, 364–374. [Google Scholar] [CrossRef]
- Kump, L.R.; Brantley, S.L.; Arthur, M.A. Chemical, weathering, atmospheric CO2, and climate. Annu. Rev. Earth Planet. Sci. 2000, 28, 611–667. [Google Scholar] [CrossRef] [Green Version]
- Lerman, A.; Wu, L.L.; Mackenzie, F.T. CO2 and H2SO4 consumption in weathering and material transport to the ocean, and their role in the global carbon balance. Mar. Chem. 2007, 106, 326–350. [Google Scholar] [CrossRef]
- Nesbitt, H.W.; Young, G.M. Early Proterozoic climates and plate motions inferred from major element chemistry of lutites. Nature 1982, 229, 715–717. [Google Scholar] [CrossRef]
- Scott, C.; Lyons, T.W.; Bekker, A.; Shen, Y.; Poulton, S.W.; Chu, X.; Anbar, A.D. Tracing the stepwise oxygenation of the Proterozoic Ocean. Nature 2008, 452, 456–459. [Google Scholar] [CrossRef]
- Wang, L.; Zhang, L.J.; Cai, W.J.; Wang, B.S.; Yu, Z.G. Consumption of atmospheric CO2 via chemical weathering in the Yellow River basin: The Qinghai-Tibet Plateau is the main contributor to the high dissolved inorganic carbon in the Yellow River. Chem. Geol. 2016, 430, 34–44. [Google Scholar] [CrossRef] [Green Version]
- White, A.F.; Brantley, S.L. Chemical weathering rates of silicate minerals: An overview. In: Chemical Weathering. Rates of Silicate. Minerals 1995, 31, 1–22. [Google Scholar]
- Cao, X.; Wu, P.; Cao, Z. Element geochemical characteristics of a soil developed on dolomite in central Guizhou, southern China: Implications for parent materials. Acta Geochem. 2016, 35, 445–462. [Google Scholar] [CrossRef]
- Ji, H.B.; Wang, S.J.; Ouyang, Z.Y.; Zhang, S.; Sun, C.X.; Liu, X.M.; Zhou, D.Q. Geochemistry of red residua underlying dolomites in karst terrains of Yunnan–Guizhou Plateau: I. The formation of the Pingba profile. Chem. Geol. 2004, 203, 1–27. [Google Scholar] [CrossRef]
- Ji, H.B.; Wang, S.J.; Ouyang, Z.Y.; Zhang, S.; Sun, C.X.; Liu, X.M.; Zhou, D.Q. Geochemistry of red residua underlying dolomites in karst terrains of Yunnan–Guizhou Plateau: II. The mobility of rare earth elements during weathering. Chem. Geol. 2004, 203, 29–50. [Google Scholar] [CrossRef]
- Jiang, K.; Hua-Wen, Q.; Rui-Zhong, H. Element mobilization and redistribution under extreme tropical weathering of basalts from the Hainan Island, South China. J. Asian Earth Sci. 2018, 158, 80–102. [Google Scholar] [CrossRef]
- Muhs, D.R.; Budahn, J.R. Geochemical evidence for the origin of late Quaternary loess in central Alaska. Can. J. Earth Sci. 2006, 43, 323–337. [Google Scholar] [CrossRef]
- Wei, X.; Ji, H.B.; Li, D.; Zang, F.; Wang, S.J. Material source analysis and element geochemical research about two types of representative bauxite deposits and terra rossa in western Guangxi, southern China. J. Geochem. Explor. 2013, 133, 68–87. [Google Scholar] [CrossRef]
- Aldrian, E.; Dwi Susanto, R. Identification of Three Dominant Rainfall Regions within Indonesia and Their Relationship to Sea Surface Temperature. Int. J. Climatol. 2003, 23, 1435–1452. [Google Scholar] [CrossRef]
- Li, X.Y.; Zhang, Z.W.; Wu, C.Q.; Xu, J.H.; Jin, Z.R. Geology and geochemistry of Gunung Subang gold deposit, Tanggeung, Cianjur, West Java, Indonesia. Ore Geol. Rev. 2019, 113, 103060. [Google Scholar] [CrossRef]
- Fu, W.; Yang, J.; Yang, M.; Pang, B.; Liu, X.; Niu, H.; Huang, X. Mineralogical and geochemical characteristics of a serpentinite-derived laterite profile from East Sulawesi, Indonesia: Implications for the lateritization process and Ni supergene enrichment in the tropical rainforest. J. Asian Earth Sci. 2014, 93, 74–88. [Google Scholar] [CrossRef]
- Wang, M.; Nan, C.; Wang, Z. Determination of pH in Soil; China Agriculture Press: Beijing, China, 2007. [Google Scholar]
- Soil Survey Staff. Keys to Soil Taxonomy, 12th ed.; USDA—Natural Resources Conservation Service: Washington, DC, USA, 2014. [Google Scholar]
- Babechuk, M.G.; Widdowson, M.; Kamber, B.S. Quantifying chemical weathering intensity and trace element release from two contrasting basalt profiles, Deccan Traps, India. Chem. Geol. 2014, 363, 56–75. [Google Scholar] [CrossRef]
- Babechuk, M.G.; Widdowson, M.; Murphy, M.; Kamber, B.S. A combined Y/Ho, high field strength element (HFSE) and Nd isotope perspective on basalt weathering, Deccan Traps, India. Chem. Geol. 2015, 396, 25–41. [Google Scholar] [CrossRef]
- Brantley, S.L.; Lebedeva, M. Learning to read the chemistry of regolith to understand the Critical Zone. Annu. Rev. Earth Planet. Sci. 2011, 39, 387–416. [Google Scholar] [CrossRef]
- Kurtz, A.C.; Derry, L.A.; Chadwick, O.A.; Alfano, M.J. Refractory element mobility in volcanic soils. Geology 2000, 28, 683–686. [Google Scholar] [CrossRef]
- Nesbitt, H.W. Mobility and fractionation of Rare-Earth elements during weathering of a granodiorite. Nature 1979, 279, 206–210. [Google Scholar] [CrossRef]
- Nesbitt, H.W.; Markovics, G.; Price, R.C. Chemical processes affecting alkalis and alkaline earths during continental weathering. Geochim. Comochim. Acta 1980, 44, 1659–1666. [Google Scholar] [CrossRef]
- Anderson, S.P.; Dietrich, W.E.; Brimhall, G.H. Weathering profiles, mass-balance analysis, and rates of solute loss: Linkages between weathering and erosion in a small, steep catchment. Geol. Soc. Am. Bull. 2002, 114, 1143–1158. [Google Scholar] [CrossRef]
- Brimhall, G.H.; Dietrich, W.E. Constitutive mass balance relations between chemical composition, volume, density, porosity, and strain in metasomatic hydrochemical systems: Results on weathering and pedogenesis. Geochim. Cosmochim. Acta 1987, 51, 567–587. [Google Scholar] [CrossRef]
- Gong, Q.; Deng, J.; Yang, L.; Zhang, J.; Wang, Q.; Zhang, G. Behaviour of major and trace elements during weathering of sericite-quartz schist. J. Asian Earth Sci. 2011, 42, 1–13. [Google Scholar] [CrossRef]
- Rudnick, R.L.; Gao, S. Composition of the continental crust. In Treatise on Geochemistry; Rudnick, R.L., Ed.; Elsevier: Amsterdam, The Netherlands, 2003; Volume 3, pp. 1–64. [Google Scholar]
- Taylor, S.R.; McLennan, S.M. The Continental Crust: Its Composition and Evolution; Blackwell Scientific Publication: London, UK, 1985; p. 311. [Google Scholar]
- Gromet, P.L.; Dymek, P.F.; Haskin, L.A.; Korotev, R.L. The North American Shale Composite: Its Composition, Major and Minor Element Characteristics. Geochim. Cosmochim. Acta 1984, 48, 2469–2482. [Google Scholar] [CrossRef]
- Ujvari, G.; Varga, A.; Balogh-Brunstad, Z. Origin, weathering and geochemical composition of loess in southwestern Hungary. Quat. Res. 2008, 69, 421–437. [Google Scholar] [CrossRef]
- Boynton, W.V. Cosmochemistry of the rare earth elements: Meteorite studies. In Rare Earth Element Geochemistry; Henderson, P., Ed.; Elsevier: Amsterdam, The Netherlands, 1984; Volume 2, pp. 63–114. [Google Scholar]
- Palme, H.; Jones, A. Solar system abundances of the element. In Meteorite, Comets, and Planets, Treatise on Geochemistry; Davis, A.M., Ed.; Elsevier: Amsterdam, The Netherlands, 2005; pp. 41–62. [Google Scholar]
- Young, G.M.; Nesbitt, H.W. Processes controlling the distribution of Ti and Al in weathering profiles, siliciclastic sediments and sedimentary rocks. J. Sediment. Res. 1998, 68, 448–455. [Google Scholar] [CrossRef]
- Gallet, S.; Jahn, B.; Van Vliet Lanoë, B.; Dia, A.; Rossello, E. Loess geochemistry and its implications for particle origin and composition of the upper continental crust. Earth Planet. Sci. Lett. 1998, 156, 157–172. [Google Scholar] [CrossRef]
- Muhs, D.R.; Budahn, J.; Reheis, M.; Beann, J.; Skipp, G.; Fisher, E. Airborne dust transport to the eastern Pacific Ocean off southern California: Evidence from San Clemente Island. J. Geophys. Res. 2007, 112, D13203.1–D13203.17. [Google Scholar] [CrossRef] [Green Version]
- Sak, P.B.; Navarre-Sitchler, A.K.; Miller, C.E.; Daniel, C.C.; Gaillardet, J.; Buss, H.L.; Lebedeva, M.I.; Brantley, S.L. Controls on rind thickness on basaltic andesite clasts weathering in Guadeloupe. Chem. Geol. 2010, 276, 129–143. [Google Scholar] [CrossRef]
- Plank, T.; Langmuir, C.H. The chemical composition of subducting sediment and its consequences for the crust and mantle. Chem. Geol. 1998, 145, 325–394. [Google Scholar] [CrossRef]
- Bauer, A.; Velde, B.D. Geochemistry at the Earth’s Surface: Movement of Chemical Elements; Springer: Berlin/Heidelberg, Germany, 2014. [Google Scholar]
- Collins, R.N.; Kinsela, A.S. The aqueous phase speciation and chemistry of cobalt in terrestrial environments. Chemosphere 2010, 79, 763–771. [Google Scholar] [CrossRef]
- Panahi, A.; Young, G.M.; Rainbird, R.H. Behaviour of major and trace elements (including REE) during Paleoproterozoic pedogenesis and diagenetic alteration of an Archean granite near Ville Marie, Quebec, Canada. Geochim. Cosmochim. Acta 2000, 64, 2199–2220. [Google Scholar] [CrossRef]
- Guthrie, V.A.; Kleeman, J.D. Changing uranium distributions during weathering of granite. Chem. Geol. 1986, 54, 113–126. [Google Scholar] [CrossRef]
- Kraemer, D.; Kopf, S.; Bau, M. Oxidative mobilization of cerium and uranium and enhanced release of “immobile” high field strength elements from igneous rocks in the presence of the biogenic siderophore desferrioxamine B. Geochim. Cosmochim. Acta 2015, 165, 263–279. [Google Scholar] [CrossRef]
- Middelburg, J.J.; Van der Weijden, C.H.; Woittiez, J.R.W. Chemical processes affecting the mobility of major, minor, and trace elements during weathering of granitic rocks. Chem. Geol. 1988, 68, 253–273. [Google Scholar] [CrossRef]
- Zhang, L.; Ji, H.B.; Gao, J.; Li, R.; Li, J.J. Geochemical characteristics of major, trace and rare earth elements in typical carbonate weathered profiles of Guizhou Plateau. Geochimica 2015, 44, 323–336. [Google Scholar]
- Ellis, A.S.; Johnson, T.M.; Bullen, T.D. Chromium isotopes and the fate of hexavalent chromium in the environment. Science 2002, 295, 2060–2062. [Google Scholar] [CrossRef] [Green Version]
- Berger, A.; Frei, R. The fate of chromium during tropical weathering: A laterite profile from Central Madagascar. Geoderma 2014, 213, 521–532. [Google Scholar] [CrossRef]
- Oze, C.; Bird, D.K.; Fendorf, S. Genesis of hexavalent chromium from natural sources in soil and groundwater. Proc. Natl. Acad. Sci. USA 2007, 104, 6544–6549. [Google Scholar] [CrossRef] [PubMed] [Green Version]
- Braun, J.J.; Viers, J.; Dupre, B.; Polve, M.; Ndam, J.; Muller, J.P. Solid/liquid REE fractionation in the lateritic system of Goyoum, East Cameroon: The implication for the present dynamics of the soil covers of the humid tropical regions. Geochim. Cosmochim. Acta 1998, 62, 273–299. [Google Scholar] [CrossRef]
- Boulange, B.; Colin, F. Rare earth element mobility during conversion of nepheline syenite into lateritic bauxite at Passa Quatro. Minais Gerais, Brazil. Appl. Geochem. 1994, 9, 701–711. [Google Scholar] [CrossRef]
- Braun, J.J.; Pagel, M.; Muller, J.P.; Bilong, P.; Michard, A.; Cuillet, B. Cerium anomalies in lateritic profiles. Geochim. Cosmochim. Acta 1990, 54, 781–795. [Google Scholar] [CrossRef]
- Aubert, D.; Stille, P.; Probst, A. REE fractionation during granite weathering and removal by waters and suspended loads: Sr and Nd isotopic evidence. Geochim. Cosmochim. Acta 2001, 65, 387–406. [Google Scholar] [CrossRef] [Green Version]
- Laveuf, C.; Cornu, S. A review on the potentiality of Rare Earth Elements to trace pedogenetic processes. Geoderma 2009, 154, 1–12. [Google Scholar] [CrossRef]
- Yusoff, Z.M.; Ngwenya, B.T.; Parsons, I. Mobility and fractionation of REEs during deep weathering of geochemically contrasting granites in a tropical setting, Malaysia. Chem. Geol. 2013, 349, 71–86. [Google Scholar] [CrossRef]
- Krupka, K.M.; Serne, R.J. Geochemical Factors Affecting the Behaviour of Antimony, Cobalt, Europium, Technetium, and Uranium in Vadose Sediments; Pacific Northwest National Laboratory: Richland, WA, USA, 2002. [Google Scholar]
- Buss, H.L.; White, A.F.; Murphy, S.F. Weathering processes in the Icacos and Mameyes Watersheds in Eastern Puerto Rico. In Water Quality and Landscape Process of Four Watersheds in Eastern Puerto Rico; Murphy, S.F., Stallard, R.F., Eds.; US Geological Survey: Reston, WV, USA, 2012; pp. 249–287. [Google Scholar]
- Tan, P.; Oberhardt, N.; Dypvik, H.; Riber, L.; Ferrell, R.E. Weathering profiles and clay mineralogical developments, Bornholm, Denmark. Mar. Petrol. Geol. 2017, 80, 32–48. [Google Scholar] [CrossRef] [Green Version]
- Nesbitt, H.W.; Young, G.M. Formation and diagenesis of weathering profiles. J. Geol. 1989, 97, 129–147. [Google Scholar] [CrossRef]
- Le Blond, J.S.; Cuadras, J.; Molla, Y.B.; Berhanu, T.; Umer, M.; Baxter, P.J.; Davey, G. Weathering of the Ethiopian volcanic province: A new weathering index to characterize and compare soils. Am. Mineral. 2015, 100, 2518–2532. [Google Scholar] [CrossRef] [Green Version]
- Ji, H.B.; Ouyang, Z.Y.; Wang, S.J.; Zhou, D.Q. Element geochemistry of weathering profile of dolomitite and its implications for the average chemical composition of the upper continental crust. Sci. China Ser. D Earth Sci. 2000, 43, 23–35. [Google Scholar] [CrossRef]
- Lu, S.; Wang, S.; Chen, Y. Palaeopedogenesis of red palaeosols in Yunnan Plateau, southwestern China: Pedogenical, geochemical and mineralogical evidence and palaeoenvironmental implication. Palaeogeogr. Palaeoclimatol. Palaeoecol. 2015, 420, 35–48. [Google Scholar] [CrossRef]
- Peucker-Ehrenbrink, B.; Miller, M.W. Quantitative bedrock geology of east and Southeast Asia (Brunei, Cambodia, eastern and southeastern China, East Timor, Indonesia, Japan, Laos, Malaysia, Myanmar, North Korea, Papua New Guinea, Philippines, far-eastern Russia, Singapore, South Korea, Taiwan, Thailand, Vietnam). Geochem. Geophys. Geosyst. 2004, 5, Q01B06. [Google Scholar] [CrossRef] [Green Version]
- Derakhshan-Babaei, F.; Nosrati, K.; Tikhomrov, D.; Christl, M.; Sadough, H.; Egli, M. Relating the spatial variability of chemical weathering and erosion to geological and topographical zones. Geomorphology 2020, 363, 107235. [Google Scholar] [CrossRef]
- Ouyang, N.; Zhang, Y.; Sheng, H.; Zhou, Q.; Huang, Y.; Yu, Z. Clay mineral composition of upland soils and its implication for pedogenesis and soil taxonomy in subtropical China. Nature 2021, 11, 9707. [Google Scholar] [CrossRef]
- Dal’Bò, P.F.F.; Basilici, G.; Angèlica, R.S. Factors of palaeosol formation in a Late Cretaceous eolian sand sheet paleoenvironment, Marilia Formation, Southeastern Brazil. Palaeogeogr. Palaeoclimatol. Palaeoecol. 2010, 292, 349–365. [Google Scholar] [CrossRef]
- Qiao, Y.S.; Hao, Q.Z.; Peng, S.S.; Wang, Y.; Li, J.W.; Liu, Z.X. Geochemical characteristics of the eolian deposits in southern China, and their implications for provenance and weathering intensity. Palaeogeogr. Palaeoclimatol. Palaeoecol. 2011, 308, 513–523. [Google Scholar] [CrossRef]
- Sheldon, N.D.; Retallack, G.J.; Tanaka, S. Geochemical climofunctions from North America soils and application to palaeosols across the Eocene–Oligocene boundary. J. Geol. 2002, 110, 687–696. [Google Scholar] [CrossRef] [Green Version]
- Meunier, A.; Caner, L.; Hubert, F.; El Albani, A.; Prêt, D. The weathering intensity scale (WIS): An alternative approach of the chemical index of alteration (CIA). Am. J. Sci. 2013, 313, 113–143. [Google Scholar] [CrossRef]
- Beckford, H.O.; Chu, H.; Song, C.; Chang, C.; Ji, H. Geochemical characteristics and behaviour of elements during weathering and pedogenesis over karst area in Yunnan–Guizhou Plateau, southwestern China. Environ. Earth Sci. 2021, 80, 61. [Google Scholar] [CrossRef]
- Condie, K.C. Chemical composition and evolution of the upper continental crust: Contrasting results from surface samples and shales. Chem. Geol. 1993, 104, 1–37. [Google Scholar] [CrossRef]
- Kovács, J. Chemical weathering intensity of the Late Cenozoic red clay deposits in the Carpathian Basin. Geochem. Int. 2007, 45, 1056–1063. [Google Scholar] [CrossRef]
- Kovács, J.; Fábián, S.Á.; Varga, G.; Újvári, G.; Varga, G.; Dezső, J. Plio-Pleistocene red clay deposits in the Pannonian basin: A review. Quat. Int. 2011, 240, 35–43. [Google Scholar] [CrossRef]


| Soil Profiles | Location | Elevation (m) | Thickness (cm) | Parent Material | Soil Texture | Visible Characteristics |
|---|---|---|---|---|---|---|
| TA | 7°1′56″ S, 112°3′6″ E | 139 | 120 | Limestone | Silty clay loam | Gray soil layer with crushed stones |
| MB | 6°55′57″ S, 113°4′46″ E | 85.1 | 140 | Limestone | Silty loam | Red with semi weathered bedrock layer |
| NA | 7°0′14″ S, 112°6′5″ E | 89 | 210 | Dolomite | Silty loam | Red-brown |
| MC | 6°54′9″ S, 113°4′49″ E | 60.9 | 85 | Dolomite | Silty clay | Brown-yellow with rock powder layer |
| KA | 3°57′21″ S, 122°14′59″ E | 120 | 120 | Basalt | Silty clay | Red |
| KC | 3°35′34″ S, 122°11′10″ E | 20 | 150 | Basalt | Silty clay | Yellowish-brown with purplish-red iron layer |
| Profile | SiO2 | Al2O3 | Fe2O3T | MgO | CaO | Na2O | K2O | MnO | TiO2 | P2O5 | LOI | Total | pH | CIA | TOC |
|---|---|---|---|---|---|---|---|---|---|---|---|---|---|---|---|
| TA-5 | 13.81 | 3.70 | 1.74 | 12.28 | 27.88 | 0.09 | 0.10 | 0.05 | 0.20 | 0.78 | 39.33 | 99.96 | 7.36 | 89.87 | 14.25 |
| TA-4 | 10.88 | 2.85 | 1.38 | 12.60 | 30.36 | 0.05 | 0.07 | 0.04 | 0.16 | 0.75 | 40.85 | 99.99 | 7.32 | 92.11 | 14.24 |
| TA-3 | 13.29 | 3.47 | 1.68 | 12.08 | 29.07 | 0.06 | 0.09 | 0.05 | 0.19 | 0.84 | 39.09 | 99.91 | 7.22 | 91.97 | 14.22 |
| TA-2 | 20.21 | 5.30 | 2.64 | 9.83 | 24.78 | 0.08 | 0.12 | 0.08 | 0.29 | 1.29 | 35.30 | 99.92 | 7.15 | 92.58 | 12.92 |
| TA-1 | 27.91 | 7.89 | 3.85 | 7.63 | 19.39 | 0.12 | 0.17 | 0.11 | 0.40 | 1.43 | 31.07 | 99.97 | 7.15 | 92.74 | 11.74 |
| TA-0 | 1.04 | 0.11 | 0.06 | 8.90 | 44.48 | 0.02 | 0.02 | 0.00 | 0.02 | 0.09 | 44.71 | 99.45 | - | 60.29 | - |
| MB-10 | 36.45 | 11.69 | 5.23 | 0.56 | 19.50 | 0.07 | 0.32 | 0.08 | 0.68 | 0.08 | 25.26 | 99.92 | 7.36 | 95.00 | 4.61 |
| MB-9 | 20.00 | 7.51 | 3.05 | 0.41 | 34.68 | 0.03 | 0.20 | 0.05 | 0.41 | 0.05 | 33.57 | 99.96 | 7.36 | 95.82 | 7.49 |
| MB-8 | 18.41 | 6.75 | 2.61 | 0.40 | 36.47 | 0.02 | 0.19 | 0.05 | 0.38 | 0.05 | 34.66 | 99.99 | 7.34 | 95.92 | 8.70 |
| MB-7 | 13.50 | 4.76 | 1.83 | 0.34 | 41.96 | 0.02 | 0.14 | 0.04 | 0.28 | 0.04 | 37.02 | 99.93 | 7.33 | 95.34 | 7.48 |
| MB-6 | 11.57 | 3.05 | 1.13 | 0.40 | 45.19 | 0.02 | 0.15 | 0.02 | 0.21 | 0.03 | 38.00 | 99.77 | 7.43 | 93.11 | 6.09 |
| MB-5 | 13.45 | 3.87 | 1.40 | 0.43 | 43.03 | 0.02 | 0.18 | 0.02 | 0.26 | 0.03 | 37.22 | 99.91 | 7.41 | 93.15 | 6.05 |
| MB-4 | 4.12 | 1.18 | 0.46 | 0.39 | 51.74 | 0.02 | 0.08 | 0.01 | 0.08 | 0.02 | 41.33 | 99.43 | 7.58 | 88.18 | 4.72 |
| MB-3 | 13.19 | 3.83 | 1.42 | 0.41 | 43.03 | 0.02 | 0.17 | 0.03 | 0.25 | 0.03 | 37.55 | 99.93 | 7.36 | 93.26 | 6.76 |
| MB-2 | 14.85 | 3.92 | 1.38 | 0.46 | 42.34 | 0.03 | 0.22 | 0.02 | 0.25 | 0.03 | 36.46 | 99.96 | 7.38 | 91.77 | 5.89 |
| MB-1 | 11.51 | 2.95 | 1.03 | 0.39 | 45.43 | 0.02 | 0.18 | 0.02 | 0.20 | 0.02 | 38.07 | 99.82 | 7.43 | 91.59 | 5.81 |
| MB-0 | <0.010 | 0.02 | 0.03 | 0.72 | 55.10 | 0.03 | <0.010 | 0.00 | 0.01 | 0.01 | 43.49 | 99.41 | - | 18.24 | - |
| MC-0 | 0.18 | 0.11 | 0.10 | 20.13 | 32.53 | 0.02 | <0.010 | 0.00 | 0.02 | 0.12 | 46.21 | 99.42 | - | 61.41 | - |
| MC-1 | 1.36 | 0.61 | 0.40 | 19.07 | 32.28 | 0.01 | 0.01 | 0.01 | 0.05 | 0.20 | 45.43 | 99.43 | - | 91.04 | - |
| MC-2 | 54.00 | 20.74 | 11.83 | 0.24 | 0.28 | 0.02 | 0.04 | 0.12 | 1.27 | 0.31 | 11.14 | 99.99 | 7.34 | 99.46 | 0.35 |
| MC-3 | 54.54 | 20.64 | 11.52 | 0.21 | 0.23 | 0.02 | 0.04 | 0.12 | 1.26 | 0.31 | 11.07 | 99.96 | 7.07 | 99.38 | 0.32 |
| MC-4 | 54.30 | 20.68 | 11.58 | 0.21 | 0.23 | 0.02 | 0.04 | 0.13 | 1.27 | 0.30 | 11.18 | 99.94 | 6.86 | 99.43 | 0.33 |
| MC-5 | 54.16 | 20.78 | 11.75 | 0.23 | 0.23 | 0.03 | 0.04 | 0.14 | 1.28 | 0.30 | 11.05 | 99.99 | 6.75 | 99.38 | 0.33 |
| MC-6 | 54.15 | 20.72 | 11.69 | 0.22 | 0.27 | 0.02 | 0.04 | 0.13 | 1.27 | 0.30 | 11.15 | 99.96 | 6.58 | 99.41 | 0.36 |
| MC-7 | 55.71 | 20.22 | 11.24 | 0.21 | 0.23 | 0.04 | 0.04 | 0.13 | 1.21 | 0.27 | 10.61 | 99.91 | 6.20 | 99.10 | 0.38 |
| MC-8 | 56.03 | 19.93 | 11.26 | 0.23 | 0.27 | 0.04 | 0.04 | 0.11 | 1.24 | 0.28 | 10.43 | 99.86 | 6.23 | 99.06 | 0.43 |
| MC-9 | 56.48 | 19.63 | 11.05 | 0.21 | 0.28 | 0.03 | 0.04 | 0.12 | 1.19 | 0.30 | 10.54 | 99.87 | 6.23 | 99.30 | 0.46 |
| MC-10 | 56.08 | 19.91 | 11.23 | 0.23 | 0.24 | 0.03 | 0.04 | 0.12 | 1.20 | 0.28 | 10.51 | 99.87 | 6.30 | 99.32 | 0.51 |
| MC-11 | 56.45 | 19.66 | 11.08 | 0.22 | 0.25 | 0.02 | 0.04 | 0.12 | 1.19 | 0.28 | 10.62 | 99.93 | 6.32 | 99.39 | 0.43 |
| MC-12 | 54.79 | 20.57 | 11.48 | 0.23 | 0.26 | 0.03 | 0.04 | 0.13 | 1.23 | 0.28 | 10.89 | 99.93 | 6.28 | 99.32 | 0.39 |
| MC-13 | 53.93 | 20.76 | 11.66 | 0.26 | 0.29 | 0.03 | 0.04 | 0.13 | 1.26 | 0.28 | 11.23 | 99.87 | 6.44 | 99.34 | 0.41 |
| MC-14 | 53.22 | 21.11 | 11.87 | 0.27 | 0.30 | 0.03 | 0.04 | 0.13 | 1.27 | 0.28 | 11.46 | 99.98 | 6.43 | 99.36 | 0.42 |
| MC-15 | 53.10 | 21.08 | 12.10 | 0.27 | 0.29 | 0.03 | 0.03 | 0.13 | 1.26 | 0.28 | 11.37 | 99.94 | 6.44 | 99.39 | 0.37 |
| MC-16 | 53.37 | 20.97 | 11.71 | 0.34 | 0.42 | 0.02 | 0.04 | 0.12 | 1.26 | 0.29 | 11.42 | 99.96 | 6.59 | 99.43 | 0.36 |
| MC-17 | 53.17 | 21.19 | 12.00 | 0.27 | 0.30 | 0.02 | 0.04 | 0.12 | 1.31 | 0.31 | 11.15 | 99.88 | 6.51 | 99.46 | 0.00 |
| NA-0 | 0.25 | 0.19 | 0.11 | 8.31 | 45.75 | 0.01 | <0.010 | 0.02 | 0.02 | 0.11 | 44.66 | 99.43 | 79.49 | - | |
| NA-7 | 72.28 | 12.53 | 5.97 | 0.23 | 0.22 | 0.03 | 0.38 | 0.05 | 0.63 | 0.05 | 7.53 | 99.9 | 5.36 | 95.75 | 0.43 |
| NA-6 | 71.94 | 12.68 | 6.28 | 0.21 | 0.20 | 0.03 | 0.38 | 0.04 | 0.65 | 0.06 | 7.49 | 99.96 | 5.34 | 95.82 | 0.42 |
| NA-5 | 72.28 | 12.62 | 6.36 | 0.19 | 0.20 | 0.04 | 0.34 | 0.02 | 0.64 | 0.06 | 7.16 | 99.91 | 5.31 | 96.10 | 0.30 |
| NA-4 | 74.03 | 11.55 | 6.09 | 0.19 | 0.18 | 0.03 | 0.32 | 0.02 | 0.62 | 0.06 | 6.86 | 99.95 | 5.27 | 96.05 | 0.23 |
| NA-3 | 72.52 | 10.90 | 8.36 | 0.18 | 0.17 | 0.04 | 0.32 | 0.05 | 0.64 | 0.06 | 6.75 | 99.99 | 5.22 | 95.74 | 0.11 |
| NA-2 | 71.20 | 10.68 | 9.86 | 0.20 | 0.27 | 0.04 | 0.35 | 0.03 | 0.66 | 0.06 | 6.63 | 99.98 | 5.18 | 95.32 | 0.10 |
| NA-1 | 76.50 | 10.06 | 6.31 | 0.18 | 0.15 | 0.04 | 0.40 | 0.02 | 0.70 | 0.04 | 5.52 | 99.92 | 4.98 | 94.50 | 0.10 |
| KA-0 | 51.60 | 6.47 | 7.63 | 23.08 | 9.53 | 0.31 | <0.010 | 0.30 | 0.08 | 0.01 | 0.40 | 99.41 | - | 85.53 | - |
| KA-1 | 49.10 | 1.67 | 16.29 | 15.29 | 0.86 | <0.010 | <0.010 | 0.23 | 0.03 | 0.01 | 15.94 | 99.42 | 5.50 | 97.30 | 0.00 |
| KA-2 | 50.63 | 1.26 | 16.41 | 14.20 | 0.61 | 0.01 | <0.010 | 0.25 | 0.02 | 0.01 | 16.09 | 99.49 | 5.43 | 96.45 | 0.00 |
| KA-3 | 53.41 | 3.12 | 21.94 | 5.62 | 0.27 | 0.03 | 0.01 | 0.13 | 0.08 | 0.02 | 14.78 | 99.41 | 5.43 | 96.21 | 1.27 |
| KA-4 | 53.19 | 2.82 | 20.69 | 7.72 | 0.43 | 0.02 | 0.01 | 0.17 | 0.07 | 0.02 | 14.25 | 99.39 | 5.32 | 96.74 | 0.80 |
| KA-5 | 62.76 | 2.59 | 19.07 | 4.13 | 0.23 | 0.01 | 0.01 | 0.14 | 0.07 | 0.02 | 10.39 | 99.42 | 5.17 | 97.73 | 1.09 |
| KC-rock | 38.84 | 0.13 | 9.11 | 38.80 | 0.10 | <0.010 | <0.010 | 0.12 | 0.01 | 0.01 | 12.61 | 99.73 | - | 72.96 | - |
| KC-0 | 42.90 | 1.90 | 12.48 | 34.68 | 1.20 | <0.010 | <0.010 | 0.17 | 0.03 | 0.01 | 4.59 | 97.96 | 7.36 | 97.62 | 0.00 |
| KC-1 | 21.77 | 17.34 | 39.64 | 0.95 | 0.04 | <0.010 | <0.010 | 1.16 | 0.41 | 0.02 | 16.07 | 97.4 | 4.96 | 99.73 | 0.04 |
| KC-2 | 15.80 | 16.69 | 46.12 | 0.94 | 0.05 | 0.01 | <0.010 | 0.83 | 0.47 | 0.02 | 15.96 | 96.89 | 5.17 | 99.70 | 0.07 |
| KC-3 | 19.51 | 17.83 | 41.74 | 1.00 | 0.04 | 0.01 | <0.010 | 0.62 | 0.41 | 0.02 | 16.19 | 97.37 | 4.96 | 99.68 | 0.03 |
| KC-4 | 23.10 | 18.43 | 39.28 | 0.39 | 0.04 | 0.01 | <0.010 | 0.67 | 0.41 | 0.01 | 15.40 | 97.74 | 4.61 | 99.75 | 0.03 |
| KC-5 | 17.04 | 18.30 | 42.41 | 1.29 | 0.04 | 0.01 | <0.010 | 0.62 | 0.51 | 0.02 | 16.71 | 96.95 | 5.13 | 99.75 | 0.10 |
| KC-6 | 18.02 | 17.43 | 42.47 | 1.88 | 0.04 | 0.02 | <0.010 | 0.48 | 0.53 | 0.02 | 16.93 | 97.82 | 5.25 | 99.56 | 0.06 |
| UCCa | 66.62 | 15.40 | 5.04 | 2.48 | 3.59 | 3.27 | 2.80 | 0.10 | 0.64 | 0.15 | - | - | - | - | - |
| PAASb | 62.8 | 18.9 | 7.22 | 2.2 | 1.3 | 1.2 | 3.7 | 0.11 | 1 | 0.16 | - | - | - | - | - |
| NASCc | 64.8 | 16.9 | 5.65 | 2.2 | 3.63 | 1.14 | 3.97 | 0.06 | 0.7 | 0.13 | - | - | - | - | - |
| AVLd | 71.19 | 11.63 | 3.68 | 2.86 | 6.46 | 1.69 | 2.21 | 0.07 | 0.69 | 0.14 | - | - | - | - | - |
| Samples | MC-0 | MC-1 | MC-2 | MC-3 | MC-4 | MC-5 | MC-6 | MC-7 | MC-8 | MC-9 | MC-10 | MC-11 | MC-12 |
|---|---|---|---|---|---|---|---|---|---|---|---|---|---|
| Li | 1.1 | 2.5 | 34.1 | 38 | 36.5 | 38.3 | 39.6 | 37.2 | 39.1 | 33.9 | 35.9 | 38.7 | 34.3 |
| Be | 0.004 | 0.14 | 1.8 | 1.91 | 1.39 | 2.35 | 1.83 | 1.95 | 2.87 | 1.21 | 1.34 | 1.49 | 2 |
| Sc | 0.395 | 1.34 | 28.1 | 31.1 | 29.8 | 29.7 | 30.4 | 27.3 | 30.5 | 27.4 | 28.2 | 28.5 | 27.6 |
| V | 13.6 | 23.6 | 225 | 225 | 226 | 229 | 233 | 205 | 232 | 198 | 209 | 218 | 224 |
| Cr | 16.2 | 29.4 | 102 | 82.1 | 97.4 | 94.4 | 82.4 | 96 | 102 | 84.7 | 87.9 | 96.4 | 104 |
| Co | 7.2 | 16.3 | 30.5 | 27.5 | 36.4 | 29.7 | 30.6 | 29.2 | 33.6 | 29.2 | 34.3 | 33.1 | 33.4 |
| Ni | 8.07 | 13.5 | 22.8 | 22.9 | 23.2 | 23.1 | 24 | 21 | 23.3 | 20.1 | 21.7 | 22.9 | 23.6 |
| Cu | 1.7 | 3.02 | 78.3 | 80 | 87.1 | 81.3 | 83.2 | 73.9 | 81.1 | 69.8 | 73.9 | 77.3 | 79.3 |
| Zn | 2.29 | 3.29 | 64.8 | 68.7 | 68.2 | 69.6 | 71.1 | 62.4 | 67.8 | 59.1 | 64.1 | 65.3 | 64.3 |
| Ga | 0.129 | 0.763 | 23.4 | 24.5 | 24.8 | 24.6 | 24.7 | 22.9 | 25.2 | 21.6 | 23.2 | 23.6 | 23.9 |
| Rb | 0.294 | 0.517 | 5.66 | 5.92 | 5.69 | 5.54 | 5.74 | 5.08 | 5.64 | 5 | 5.34 | 5.43 | 5.37 |
| Sr | 147 | 155 | 39.4 | 40.7 | 40 | 38.9 | 41.2 | 34.3 | 39.5 | 33 | 34.4 | 36 | 36.8 |
| Y | 3.05 | 7.54 | 54.3 | 53.6 | 52.2 | 54.5 | 56.4 | 53.8 | 60.5 | 51.1 | 54.6 | 56.3 | 55.7 |
| Mo | 0.191 | 0.381 | 3.19 | 3.19 | 3.34 | 3.6 | 2.95 | 3.53 | 3.41 | 2.87 | 3.16 | 3.14 | 3.42 |
| Cd | 0.058 | 0.106 | 0.151 | 0.158 | 0.216 | 0.159 | 0.141 | 0.09 | 0.166 | 0.167 | 0.133 | 0.173 | 0.106 |
| In | <0.002 | 0.004 | 0.158 | 0.129 | 0.143 | 0.137 | 0.13 | 0.083 | 0.131 | 0.09 | 0.133 | 0.145 | 0.105 |
| Samples | MB-10 | MB-9 | MB-8 | MB-7 | MB-6 | MB-5 | MB-4 | MB-3 | MB-2 | MB-1 | MB-0 | TA-5 | TA-4 |
| Li | 30.6 | 15 | 13.6 | 8.44 | 8.12 | 9.87 | 11.5 | 8.66 | 10.6 | 7.03 | 0.553 | 7.33 | 5.36 |
| Be | 1.42 | 0.568 | 0.668 | 0.163 | 0.403 | 0.57 | 2.47 | 0.501 | 0.171 | 0.323 | 0.004 | 0.362 | 0.127 |
| Sc | 13.4 | 8.27 | 7.94 | 5.39 | 4.23 | 5.09 | 1.66 | 4.92 | 4.36 | 2.81 | 0.437 | 5.26 | 3.68 |
| V | 135 | 63.5 | 76 | 39.3 | 40.1 | 47.9 | 19.6 | 50.9 | 33.9 | 36.9 | 5.61 | 35.4 | 26.5 |
| Cr | 85.1 | 48.7 | 43.4 | 30.8 | 23.1 | 25.5 | 11.8 | 30.4 | 28.1 | 19.4 | 1.48 | 34.4 | 28.5 |
| Co | 16 | 9.47 | 10.4 | 7.63 | 7.05 | 6.27 | 6.11 | 7.94 | 8.2 | 6.29 | 8.79 | 12.1 | 8.52 |
| Ni | 36.5 | 36.3 | 30.3 | 23.1 | 21 | 19.7 | 27.1 | 45.1 | 24.6 | 18.4 | 16.9 | 14.4 | 13.2 |
| Cu | 27.1 | 18.9 | 18.6 | 14.1 | 7.15 | 8.23 | 2.47 | 7.4 | 5.31 | 3.81 | 1.02 | 21.2 | 15.4 |
| Zn | 51.8 | 31.7 | 29.7 | 19.3 | 32.7 | 18 | 8.97 | 20.8 | 20.6 | 13.8 | 1.71 | 40.3 | 31.7 |
| Ga | 13.2 | 7.86 | 7.34 | 4.88 | 3.26 | 4.01 | 1.33 | 4.09 | 4.35 | 3.08 | 0.04 | 4.29 | 2.97 |
| Rb | 38.1 | 19.6 | 17.5 | 11.9 | 9.14 | 11.3 | 4.96 | 11.7 | 12.9 | 9.54 | 0.114 | 10.7 | 7.89 |
| Sr | 80.5 | 68.7 | 68 | 59.6 | 146 | 122 | 216 | 128 | 115 | 102 | 625 | 160 | 140 |
| Y | 25.1 | 16.8 | 13.6 | 10.4 | 7.57 | 7.58 | 4.09 | 7.8 | 6.96 | 5.63 | 0.944 | 12.4 | 9.29 |
| Mo | 0.833 | 0.52 | 0.621 | 0.395 | 0.344 | 0.421 | 0.176 | 0.3 | 0.443 | 0.427 | 0.02 | 0.257 | 0.284 |
| Cd | 0.348 | 0.308 | 0.303 | 0.222 | 0.167 | 0.098 | 0.066 | 0.147 | 0.113 | 0.072 | 0.006 | 0.247 | 0.284 |
| In | 0.091 | 0.037 | 0.044 | 0.004 | 0.004 | 0.015 | 0.011 | 0.021 | 0.012 | 0.008 | <0.002 | 0.042 | 0.008 |
| Samples | TA-3 | TA-2 | TA-1 | TA-0 | KA-0 | KA-1 | KA-2 | KA-3 | KA-4 | KA-5 | KC-rock | KC-0 | KC-1 |
| Li | 5.57 | 8.72 | 11.7 | 0.799 | 1.25 | 0.488 | 0.312 | 1.56 | 0.982 | 2.19 | 2.88 | 0.979 | 7.24 |
| Be | 0.414 | 0.322 | 0.632 | 0.004 | 0.093 | 0.004 | 0.004 | 0.256 | 0.092 | 0.093 | 0.103 | 0.206 | 0.108 |
| Sc | 4.82 | 7.32 | 9.51 | 0.7 | 38.7 | 16.8 | 14.8 | 28.5 | 28.3 | 22 | 3.46 | 18.8 | 73.3 |
| V | 30.4 | 44 | 51.7 | 8.13 | 287 | 42.8 | 34.8 | 89.2 | 85.8 | 81.3 | 18.5 | 76.6 | 221 |
| Cr | 31.1 | 42.4 | 54.7 | 14.9 | 2036 | 2276 | 1793 | 3528 | 3002 | 2991 | 2044 | 2433 | 12437 |
| Co | 10.5 | 12.8 | 18.2 | 45.4 | 210 | 223 | 240 | 136 | 170 | 148 | 149 | 164 | 1530 |
| Ni | 13.4 | 13.6 | 13.8 | 14.6 | 913 | 4443 | 5417 | 5128 | 5200 | 4287 | 2876 | 10873 | 7281 |
| Cu | 17.5 | 26.5 | 34.4 | 5.74 | 3.28 | 45 | 47.9 | 35.9 | 65.6 | 68.9 | 2.27 | 24.8 | 133 |
| Zn | 34.6 | 53.2 | 69.6 | 2.65 | 29.3 | 70.5 | 72.2 | 72.3 | 90.8 | 80.7 | 42.9 | 48 | 187 |
| Ga | 3.49 | 5.53 | 8.26 | 0.077 | 5.89 | 1.25 | 1.04 | 2.98 | 2.54 | 2.58 | 0.48 | 1.56 | 16.3 |
| Rb | 10.2 | 15.7 | 20.7 | 0.514 | 0.13 | 0.172 | 0.183 | 1.03 | 1.06 | 1.31 | 0.286 | 0.108 | 0.404 |
| Sr | 144 | 131 | 112 | 87.9 | 2.63 | 6.33 | 6.68 | 1.71 | 7.26 | 7.2 | 1.2 | 3.2 | 1.14 |
| Y | 10.8 | 15.8 | 21.9 | 2.75 | 6.35 | 0.511 | 0.512 | 2.39 | 1.86 | 2.05 | 0.054 | 1.1 | 21 |
| Mo | 0.191 | 0.344 | 0.287 | 0.108 | 0.162 | 0.078 | 0.107 | 0.127 | 0.148 | 0.173 | 0.087 | 0.057 | 0.028 |
| Cd | 0.325 | 0.3 | 0.367 | 0.014 | 0.077 | 0.073 | 0.074 | 0.025 | 0.072 | 0.053 | 0.035 | 0.518 | 0.046 |
| In | 0.023 | 0.034 | 0.034 | 0.013 | 0.022 | 0.016 | 0.021 | 0.029 | 0.023 | 0.012 | 0.009 | 0.019 | 0.029 |
| Samples | KC-2 | KC-3 | KC-4 | KC-5 | KC-6 | NA-7 | NA-6 | NA-5 | NA-4 | NA-3 | NA-2 | NA-1 | |
| Li | 3.25 | 2.07 | 7.26 | 1.91 | 2.37 | 24.1 | 21.4 | 25.7 | 20.8 | 16.4 | 15.9 | 19.6 | |
| Be | 0.422 | 0.31 | 0.217 | 0.115 | 0.114 | 1.38 | 1.21 | 0.664 | 0.336 | 1.2 | 1.64 | 1.14 | |
| Sc | 81.6 | 73.2 | 41.7 | 89.7 | 86 | 13.4 | 12.3 | 14.9 | 12.3 | 11.9 | 13.7 | 11.4 | |
| V | 296 | 221 | 209 | 374 | 375 | 127 | 115 | 138 | 125 | 146 | 163 | 124 | |
| Cr | 16553 | 10888 | 9204 | 18540 | 21714 | 43.8 | 46.6 | 52.4 | 46.7 | 66.8 | 71.5 | 55.8 | |
| Co | 932 | 661 | 795 | 754 | 591 | 38.5 | 36.2 | 33 | 34.9 | 49.9 | 32.3 | 29.5 | |
| Ni | 8931 | 6667 | 3754 | 9649 | 7506 | 17.9 | 15.3 | 18.2 | 16.3 | 16 | 17.1 | 13.6 | |
| Cu | 123 | 90 | 56.6 | 153 | 141 | 18.1 | 17.1 | 21.8 | 17.3 | 18.6 | 18.4 | 12.2 | |
| Zn | 189 | 151 | 152 | 265 | 255 | 45.3 | 39.6 | 41.4 | 35.3 | 40.4 | 48 | 32.7 | |
| Ga | 15.4 | 13.2 | 14.2 | 17.1 | 14.5 | 14.3 | 12.7 | 17.3 | 12.9 | 13 | 13.8 | 11.4 | |
| Rb | 0.281 | 0.26 | 0.681 | 0.273 | 0.306 | 35.3 | 29.8 | 35.2 | 29.2 | 25.1 | 24.8 | 25.4 | |
| Sr | 1.37 | 1.51 | 1.51 | 1.55 | 1.49 | 24.8 | 23 | 25.6 | 25.3 | 24.9 | 26.4 | 27 | |
| Y | 11.9 | 13.4 | 10.4 | 10.4 | 7.4 | 15.2 | 15.1 | 18.1 | 15.7 | 12.7 | 13.1 | 11.2 | |
| Mo | 0.042 | 0.079 | 0.02 | 0.052 | 0.02 | 2.1 | 2.2 | 2.61 | 2.29 | 2.66 | 1.96 | 2.11 | |
| Cd | 0.181 | 0.066 | 0.09 | 0.159 | 0.068 | 0.064 | 0.059 | 0.065 | 0.109 | 0.037 | 0.044 | 0.068 | |
| In | 0.039 | 0.076 | 0.054 | 0.076 | 0.063 | 0.042 | 0.066 | 0.042 | 0.054 | 0.056 | 0.052 | 0.185 |
Disclaimer/Publisher’s Note: The statements, opinions and data contained in all publications are solely those of the individual author(s) and contributor(s) and not of MDPI and/or the editor(s). MDPI and/or the editor(s) disclaim responsibility for any injury to people or property resulting from any ideas, methods, instructions or products referred to in the content. |
© 2023 by the authors. Licensee MDPI, Basel, Switzerland. This article is an open access article distributed under the terms and conditions of the Creative Commons Attribution (CC BY) license (https://creativecommons.org/licenses/by/4.0/).
Share and Cite
Beckford, H.O.; Chang, C.; Ji, H. Elemental Behavior during Weathering and Pedogenesis of Clay-Rich Red Soils Developed in Different Lithologies in Java–Madura and Sulawesi in Indonesia. Sustainability 2023, 15, 4936. https://doi.org/10.3390/su15064936
Beckford HO, Chang C, Ji H. Elemental Behavior during Weathering and Pedogenesis of Clay-Rich Red Soils Developed in Different Lithologies in Java–Madura and Sulawesi in Indonesia. Sustainability. 2023; 15(6):4936. https://doi.org/10.3390/su15064936
Chicago/Turabian StyleBeckford, Howard Omar, Cheng Chang, and Hongbing Ji. 2023. "Elemental Behavior during Weathering and Pedogenesis of Clay-Rich Red Soils Developed in Different Lithologies in Java–Madura and Sulawesi in Indonesia" Sustainability 15, no. 6: 4936. https://doi.org/10.3390/su15064936