Article

Removal of Dye from Aqueous Solution Using Ectodermis of Prickly Pear Fruits-Based Bioadsorbent

by
Fatimah A. M. Al-Zahrani
1,*,
Badria M. Al-Shehri
1,2,3 and
Reda M. El-Shishtawy
4,5,*
1
Chemistry Department, Faculty of Science, King Khalid University, P.O. Box 9004, Abha 61413, Saudi Arabia
2
Research Center for Advanced Materials Science (RCAMS), King Khalid University, P.O. Box 9004, Abha 61413, Saudi Arabia
3
Unit of Bee Research and Honey Production, Faculty of Science, King Khalid University, P.O. Box 9004, Abha 61413, Saudi Arabia
4
Chemistry Department, Faculty of Science, King Abdulaziz University, P.O. Box 80203, Jeddah 21589, Saudi Arabia
5
National Research Centre, Dyeing, Printing and Textile Auxiliaries Department, Institute of Textile Research and Technology, 33 EL Buhouth St., Dokki, Giza 12622, Egypt
*
Authors to whom correspondence should be addressed.
Sustainability 2023, 15(6), 4700; https://doi.org/10.3390/su15064700
Submission received: 4 February 2023 / Revised: 27 February 2023 / Accepted: 1 March 2023 / Published: 7 March 2023

Abstract

:
Billions of grams of ectodermic fruits, such as prickly pear fruits, are removed and thrown as waste worldwide. In this study, an inexpensive approach was used to successfully transform the agricultural waste prickly pear fruit peels (PPFP) into a new adsorbent used to remove dye (PTZIDM). The adsorbent PPFP revealed a porous structure and a fair surface area. It was characterized and evaluated using a scanning electron microscope (SEM), Fourier transform infrared spectroscopy (FTIR), and surface area measurements (BET). The effectiveness of the PPFP’s adsorption was assessed in relation to pH, PPFP dose, contact time, and initial dye concentration. The kinetics and isotherm characteristics were investigated. More than 95% removal efficiency was obtained within 60 min at the adsorbent dose of 0.1 g for an initial dye concentration of 1 × 10⁻⁵ M at pH 3. The pseudo-second-order models and the Langmuir isotherm are excellent at explaining the characteristic of dye adsorption. This work offers a rapid and simple method for efficiently converting biomass waste and using it to remove pollutants.

1. Introduction

The two ecological problems of the twenty-first century that have the greatest impact on the environment are water pollution and environmental change. Water pollution is quite concerning because the effluents from the textile sector include so many synthetic colors, many of which are dangerous contaminants [1]. Therefore, it is essential to control the amount of dye in wastewater before discharging it into the environment. Since most synthetic dyes are not biodegradable and have a high level of oxidation resistance, removal can be challenging. To cope with colors, organic debris, heavy metals, and other impurities, removal techniques encompass photocatalysis, membrane treatment, adsorption, and advanced oxidation processes.
Adsorption is commonly employed to eliminate contaminants, including heavy metals and dyes since it is a secure, efficient, clean, and technically possible procedure. Because of this, the adsorption method is a fascinating separation method that uses an appropriate substance known as an absorbent. This substance has a relatively greater surface part and absorbency, enabling a reasonable adsorption symmetry kinetic [2,3]. This technology is the widely utilized technique of removing water pollution due to several factors, including its high efficiency, eco-friendliness, low price, ability to eliminate both organic and inorganic pollutants, penetrable and porous substantial resistance to toxins, high efficiency, unsophisticated design, and ease of operation [4,5,6]. Pollutants are transferred from an aqueous solution to an adsorbent during the adsorption process [7]. To establish an adsorbent’s appropriateness and applicability in pollutant removal, equilibrium models, kinetics, and thermodynamic parameters should be examined using experimental data [8,9]. The Langmuir, Temkin, Freundlich, Halsey, and Dubinin–Radushkevik isotherm patterns were utilized to investigate the adsorption data. On the other hand, models for intra-particle diffusion and pseudo first and second orders have been frequently used to characterize kinetics data [10,11,12,13,14].
It is essential to mention that husks, fruit shells, peel, and seeds are particularly beneficial as adsorbents since employing these in wastewater handling boosts their usefulness while easing the discarding issues [15,16,17]. Moreover, it is reported that activated carbon is frequently used to treat wastewater to eliminate pollutants. This is typically made from carbon-rich substances such as wood, lignite, coal, cooking oil, etc. Several teams are working to create suitable adsorbents from these types of spoils and waste [18,19], and stimulated carbon is typically a significant adsorbent in eliminating contaminants and impurities from wastewater due to its larger precise surface area and the supplementary active places. Activation has the drawback of being expensive and using a lot of energy. Therefore, it is crucial to find novel, inexpensive materials that may be used as adsorbents [20].
Prickly pear fruits are a sort of the genus Cactus in the family Cactuaceae. Its fruit, cladodes, and flowers have historically been utilized. Because of their nutritional properties, they are used in folk medicine [21]. According to various reports, the peel of this fruit accounts for approximately 50% as a percentage of its total weight [22]. As a result, every year, massive amounts of kilos of fruit peels are wasted, resulting in landfilling and ecological disasters, whereas proper use of these waste materials may result in a significant new therapeutic resource. The fruits of the prickly pear have a high medicinal significance, with anti-ulcerogenic [23], neuroprotective [24], antioxidant [25], anticancer [26], and hepatoprotective properties [27]. Prickly pear fruit juice contains polyphenols. It is high in flavonoids and ascorbate, making it a good supplier of vitamin C [28].
Some prickly pear preparations (fruit peel, mucilage, and cladodes) were tested as bioadsorbents for dye removal. Prickly pears were subjected to different treatment methods, such as simple heat and/or chemicals, prior to use. Cladode-activated carbon form (with H3PO4 at 450 °C) [29] has been utilized to eliminate methylene blue and iodine. The fruit peels showed a great opportunity as a biosorption for methylene blue [30]. The capacity of adsorption was 222 mg/L when the fruit peels were boiled in water, solar-dried for 20 days, cleaned with distilled water, dried (40–50 °C), and smashed (0.315 mm). Similarly, dried peels treated with sulfuric acid (1 M) and sodium chlorate yielded an effective bioadsorbent at 20 °C and pH 3, the maximum adsorption capacity of brilliant green was 167 mg g−1 [31]. Sodium hydrate and sodium chlorate were also used to treat other fruit peel extracts separately. Sodium perchlorate and sodium hydroxide dramatically increased decolorization percentage up to 96% [32].
In this empirical research, peels of prickly pear (Opuntia ficus indica), a readily available adsorbent from the Asir area, were tested for its ability to absorb the PTZIDM dye. FTIR and SEM were used to produce and characterize the natural PPFP. On dye adsorption onto PPFP, the impact of several factors involving contact time, adsorbent dose, and pH were assessed and examined. Adsorption isotherms were investigated.

2. Materials and Methods

2.1. Materials

The chemicals utilized in this study, including NaOH, 10H-phenothiazine, 1-bromohexane, and KI, are reagent grade chemicals, ≥98%, and were purchased from Sigma-Aldrich (Saint Louis, MO, USA). In addition, 10-hexyl-10H-phenothiazine, 10-hexyl-10H-phenothiazine-3-carbaldehyde, and PTZIDM were synthesized using the previously described methods [33,34].

2.2. Methods

2.2.1. Bioadsorbent Preparation and Characterization

Bioadsorbent Preparation

Newly split prickly pear fruit peel (PPFP) was gathered from Alsoda in the Asir region in Saudi Arabia. PPFP was repeatedly purified with distilled water and dehydrated at temperatures ranging from 50 degrees Celsius. The obtained material was crushed in mortar and pestle, passed through 45 micro sieves and treated in an alcoholic solution under a sonicate for half an hour, then cleaned with distilled water and dried with acetone according to Figure 1.

Characterization

To study the chemical activities of the skin, PPFP was described using the Perkin–Elmer spectrum RXI FTIR spectrometer (PerkinElmer, Beaconsfield, UK). The surface characteristics of PPFP were demonstrated using scanning electron microscope (HIROX SH 400M, Bruker, Bremen, Germany). The specific total surface area was measured by the N2-sorption. isotherms on a QuantaChrome Autosorb-6B (QuantaChrome Instruments, Boynton Beach, FL, USA). The point of zero charge (PZC) was determined using the reported method [35]. The crystalline structure was determined by an X-ray diffractometer (XRD) (Shimadzu Corporation, Kyoto, Japan) [35].

2.2.2. Dye Preparation

PTZIDM was synthesized according to Scheme 1, as previously reported [34]. Thus, phenothiazine was N-alkylated, followed by Vilsmeier formylation to afford the corresponding 10-hexyl-10H-phenothiazine-3-carbaldehyde in good yield. Knoevenagel condensation reaction of the carbaldehyde with 2,2′-(1H-indene-1,3(2H)-diylidene) dimalononitrile afforded the corresponding PTZIDM. The charts of analysis are provided in the Supplementary File.

2.3. Adsorption Tests

The dye (535 mg) was dissolved in one liter of deionized water (water, HPLC grade, Milli-Q apparatus, Sigma-Aldrich) to make stock solutions of PTZID 0.001 M. Using the produced material, the impacts of contact time, adsorbent dose, initial concentration, solution pH, and temperature on the adsorption were examined. All pH readings were measured using a pH meter, and 0.1 M hydrochloric acid and 0.1 M sodium hydroxide were used to change the solution’s pH. A UV–Vis spectrometer with a wavelength of 518 nm for PTZIDM dye was used to measure the final dye concentration after the supernatant was collected and filtered at a given time. The quantity of dye adsorption per gram of the prepared PPFP (q) at equilibrium (qe) or at a time (qt) was calculated using
q t = V m C o C t
qt (mg/g) denotes the amount of dye adsorbed in each unit weight of the adsorbent; Co and Ce (mg/L) denote the dye concentration at initial and equilibrium, respectively. V (L) represents the dye solution volume, and m (g) represents the adsorbent weight. The percentage of dye removal was calculated using Equation (2).
% R = [(CoCe)/Co] × 100

2.3.1. Adsorption Kinetics

Pseudo-first order, pseudo-second order, Elovich, and intra-particle diffusion models were applied significantly to provide information on the adsorption rate of the adsorbent, as shown in Table S1, S means hereinafter Supplementary Materials [36,37,38,39,40,41,42,43]. The kinetic studies may explain the mechanisms and the dye adsorption rate onto adsorbents to examine further and explore the kinetics of adsorption.

Pseudo-First-Order Model

If first-order kinetics is used, the log (qeqt) against t in Equation (S1) should yield a linear relationship from which the constants k1 can be calculated.

Pseudo-Second-Order Model

The data on sorption were also defined as a pseudo-second-order method [37]. If second-order kinetics is used, the plot of t/qt against t in Equation (S2) should yield a linear relationship from which the constants qe and k2 can be calculated.

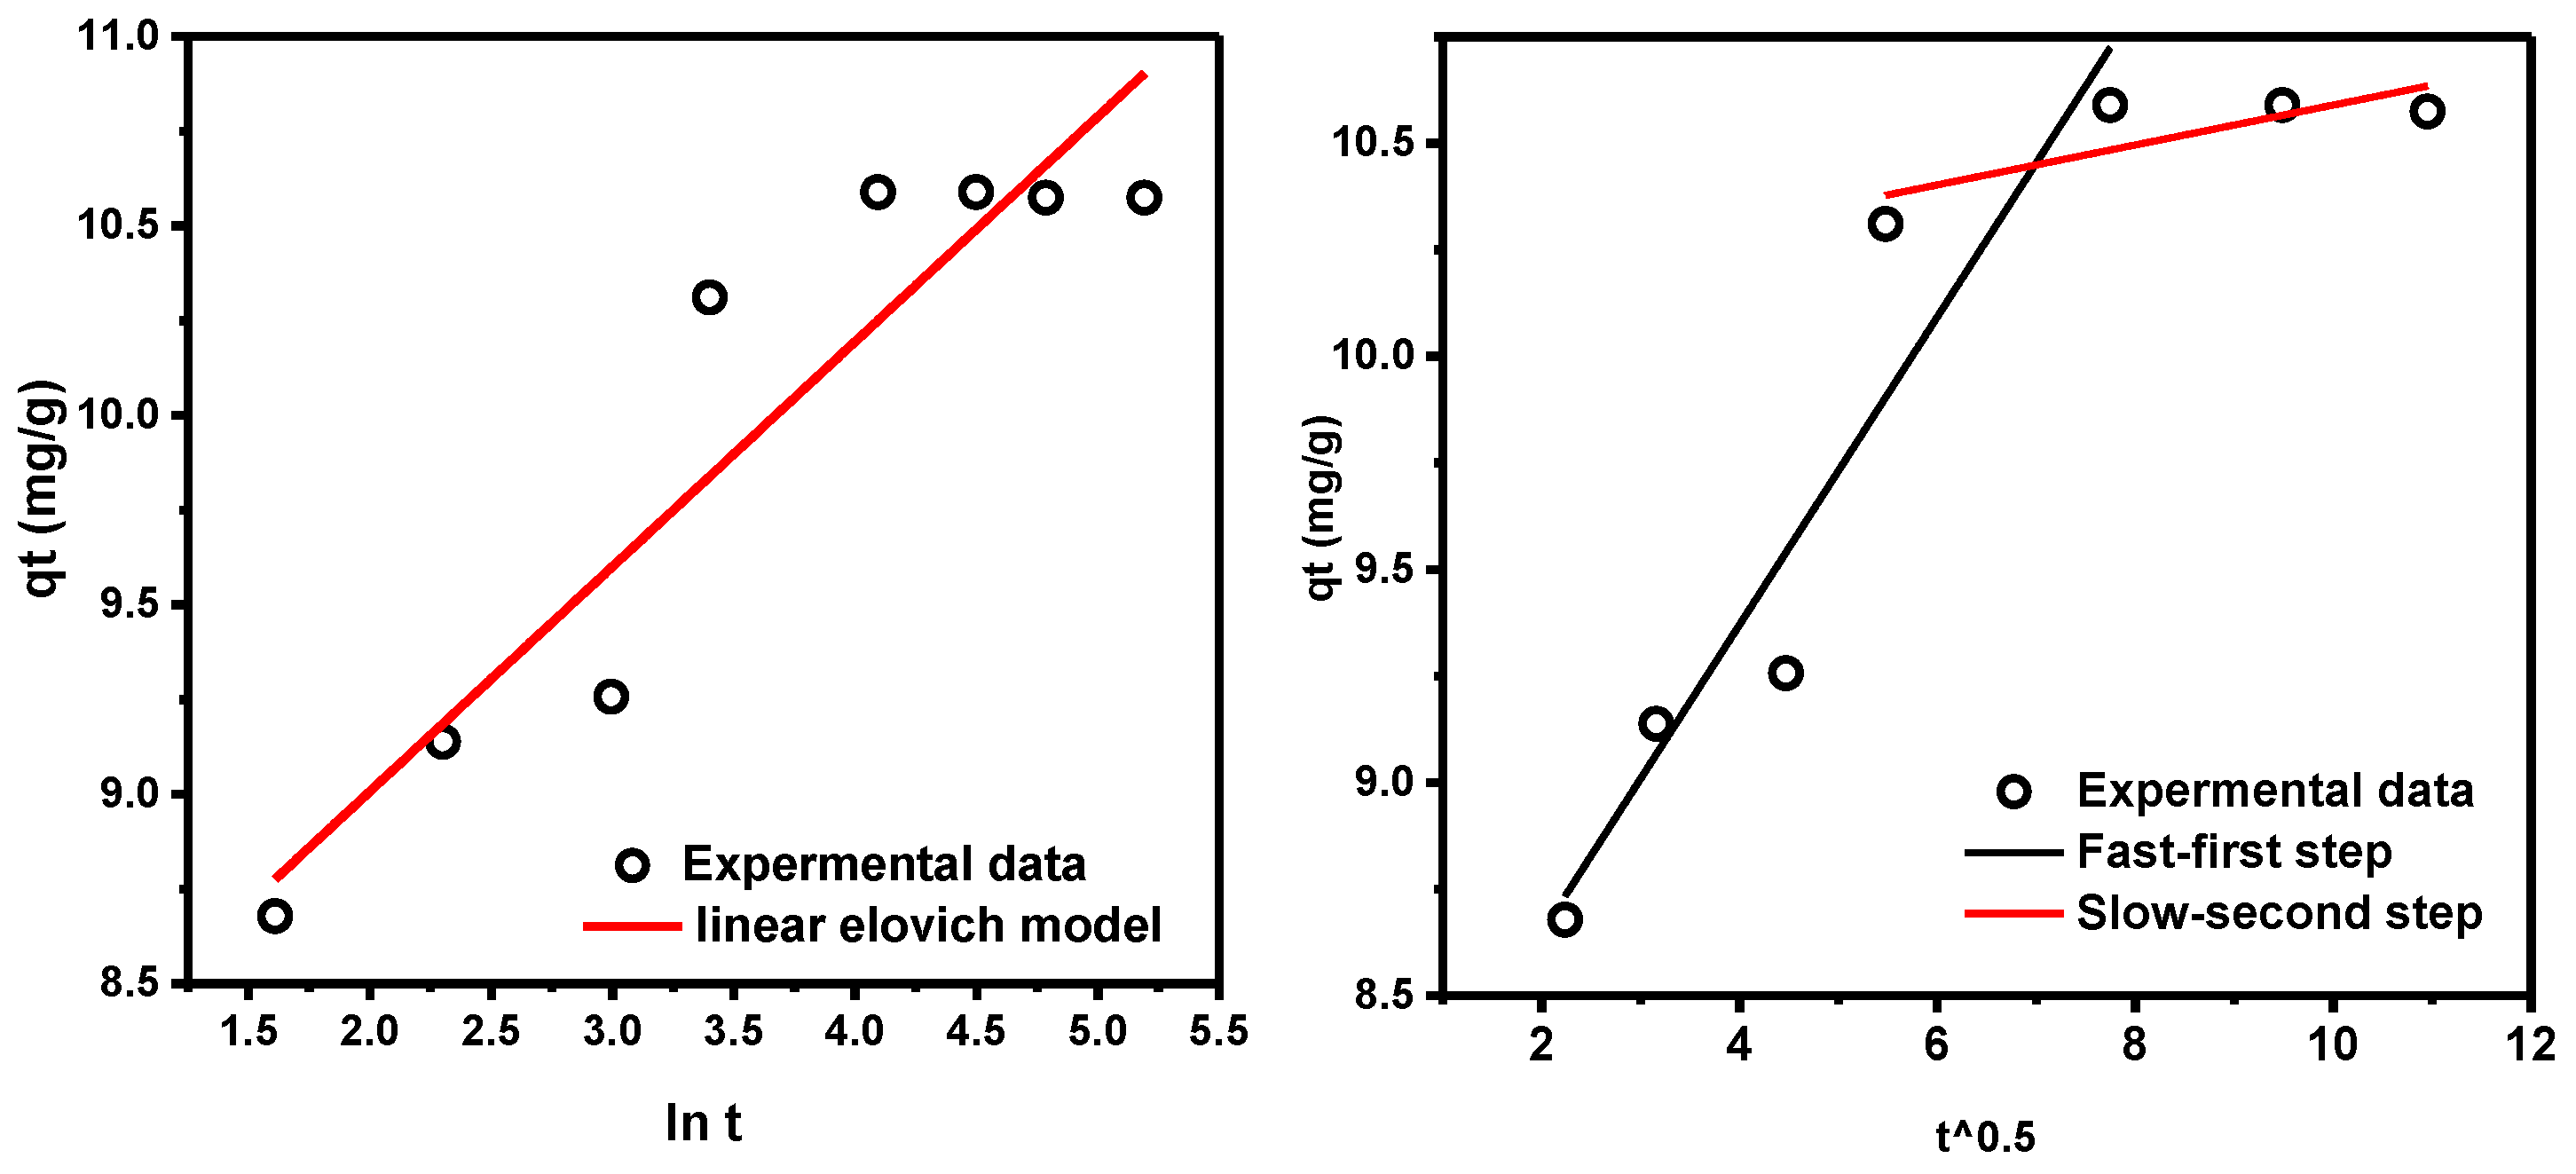
Elovich Kinetic Model

The Elovich kinetic model (Equation (S3)) has been used to simulate the gas adsorption process on surface sites and solid systems and has been used to investigate the separation of contaminants from aqueous systems. The Elovich kinetic model aids in the prediction of a system’s mass and surface diffusion, activation and deactivation energy. According to the model, the rate of solute adsorption decreases exponentially as the amount of adsorbed solute increases.

Kinetic Model of Intra-Particle Diffusion

Three steps can be used to describe intra-particle diffusion, Equation (S4): (i) The transfer of sorbate from a bulk solution to the sorbent’s external layer via molecular diffusion, also called external (or) film diffusion. (ii) Internal diffusion, the movement of sorbate from the surface of a particle into its interior. (iii) Solute particle sorption from active species into the internal surfaces of the pores. The slowest, rate-limiting step will manage the overall percentage of the dye adsorption. The properties of the solute and sorbent can be used to study the type of rate-limiting step in a batch mode. The intra-particle diffusion approach illustrated by Weber and Morris [39] can be used in adsorption, where the diffusion coefficient could be the rate-limiting stage. Weber and Morris’ [39] equation calculates the rate constants for intra-particle diffusion (kdiff). The slope of the straight-line portions of the plot of qt versus t0.5 is kdiff. These plots have mostly a double nature, i.e., initial curve portions and final linear portions. The initial curved parts are because of surface diffusion effects. Intra-particle diffusion effects cause the final linear segments. When the linear portions of the plots are extrapolated back to the axis, the intercepts (c) are proportional to the thickness of the boundary layer [39].

2.3.2. The Isotherms of Dye Adsorption

The adsorption isotherms indicate the isotherm type of dye adsorption at various starting concentrations at equilibrium. Adsorption isotherms give a complete explanation of the characteristic of the interface between adsorbates and adsorbents. For this kind of study, several equations for isotherms were created and utilized, including the crucial isotherms of Langmuir and Freundlich.

Langmuir Isotherm Model

A little interface between adsorbed molecules was observed with a small number of recognized sites, where the monolayer adsorption on a surface was modeled using Langmuir’s isotherm. Furthermore, the monolayer’s saturation level impacts the maximal adsorption [40,44]. The model can be seen from the linear equation as depicted in Equations (S5) and (S6) in Table S1. When Ce/qe is charted against Ce, a straight line with a slope of 1/q max and an intercept of 1/qmaxKL is formed.

Freundlich Isotherm Model

According to [41], the Freundlich model calculation supposes that adsorbents have heterogeneous surfaces with various adsorption capacities that each kind of position will adsorb particles as in the Freundlich Equation (S7) in Table S1.
By graphing logqe vs. logCe, which produced an upright line with a gradient of 1/n and a divert of lnKF, it was possible to determine that KF is persistent (a function of the power of temperature and adsorption) where n signified an invariable linked to the strength of adsorption. The value (1/n) is in the range of 0 and 1, and it represents the degree of surface heterogeneity or adsorption intensity for a favorable process. A number that is closer to zero indicates higher surface heterogeneity [45,46].

Dubinin–Radushkevich Isotherm Model

The Dubinin–Radushkevich model is commonly used to demonstrate the adsorption process onto a heterogeneous surface with a Gaussian energy distribution. The method has frequently fitted data with high solute activities and intermediate concentration ranges. The strategy was commonly used to distinguish physical and chemical adsorption of dyes with its mean free energy, E per molecule of sorbent (for trying to remove a molecule from its position in the adsorbents space to infinity), which can be calculated using the relationships (S8)–(S10) in Table S1.

Temkin Isotherm Model

The Temkin model proposes linearly decreasing adsorption heat with uniform distribution of the bounding energy rather than logarithmic with coverage. This isotherm model calculates the value of sorption heat (B) by plotting lnCe against qe in Equation (S11) in Table S1. From the values of the slope and the intercept AT, B, and bT can be calculated.

2.3.3. Thermodynamics of Adsorption

In order to achieve the best results, adsorption thermodynamics tests were carried out at different temperature levels (between 25 and 75 °C).
These thermodynamic parameters can be expressed in the following way at first.
K d = q e C e F o r   e q u i l i b r i u m   c o n s t a n t   3
Δ G = R T l n   K d F o r   G i b b s   e n e r g y   c h a n g e   4
ln K d = Δ S R Δ H R T F o r   e n t r o p y   a n d   e n t h a l p y   c h a n g e   5
where Kc is the equilibrium constant, Go is the Gibbs free energy (J mol−1), So is the entropy (KJ mol−1 K−1), Ho is the enthalpy (KJ mol−1), T is the absolute temperature (K), Co initial IBU concentration, Ce PAC-IBU equilibrium concentration, V volume of solution, M mass of the MP-AC, and R gas constant (8.314 J mol−1 K−1) [43].

3. Results

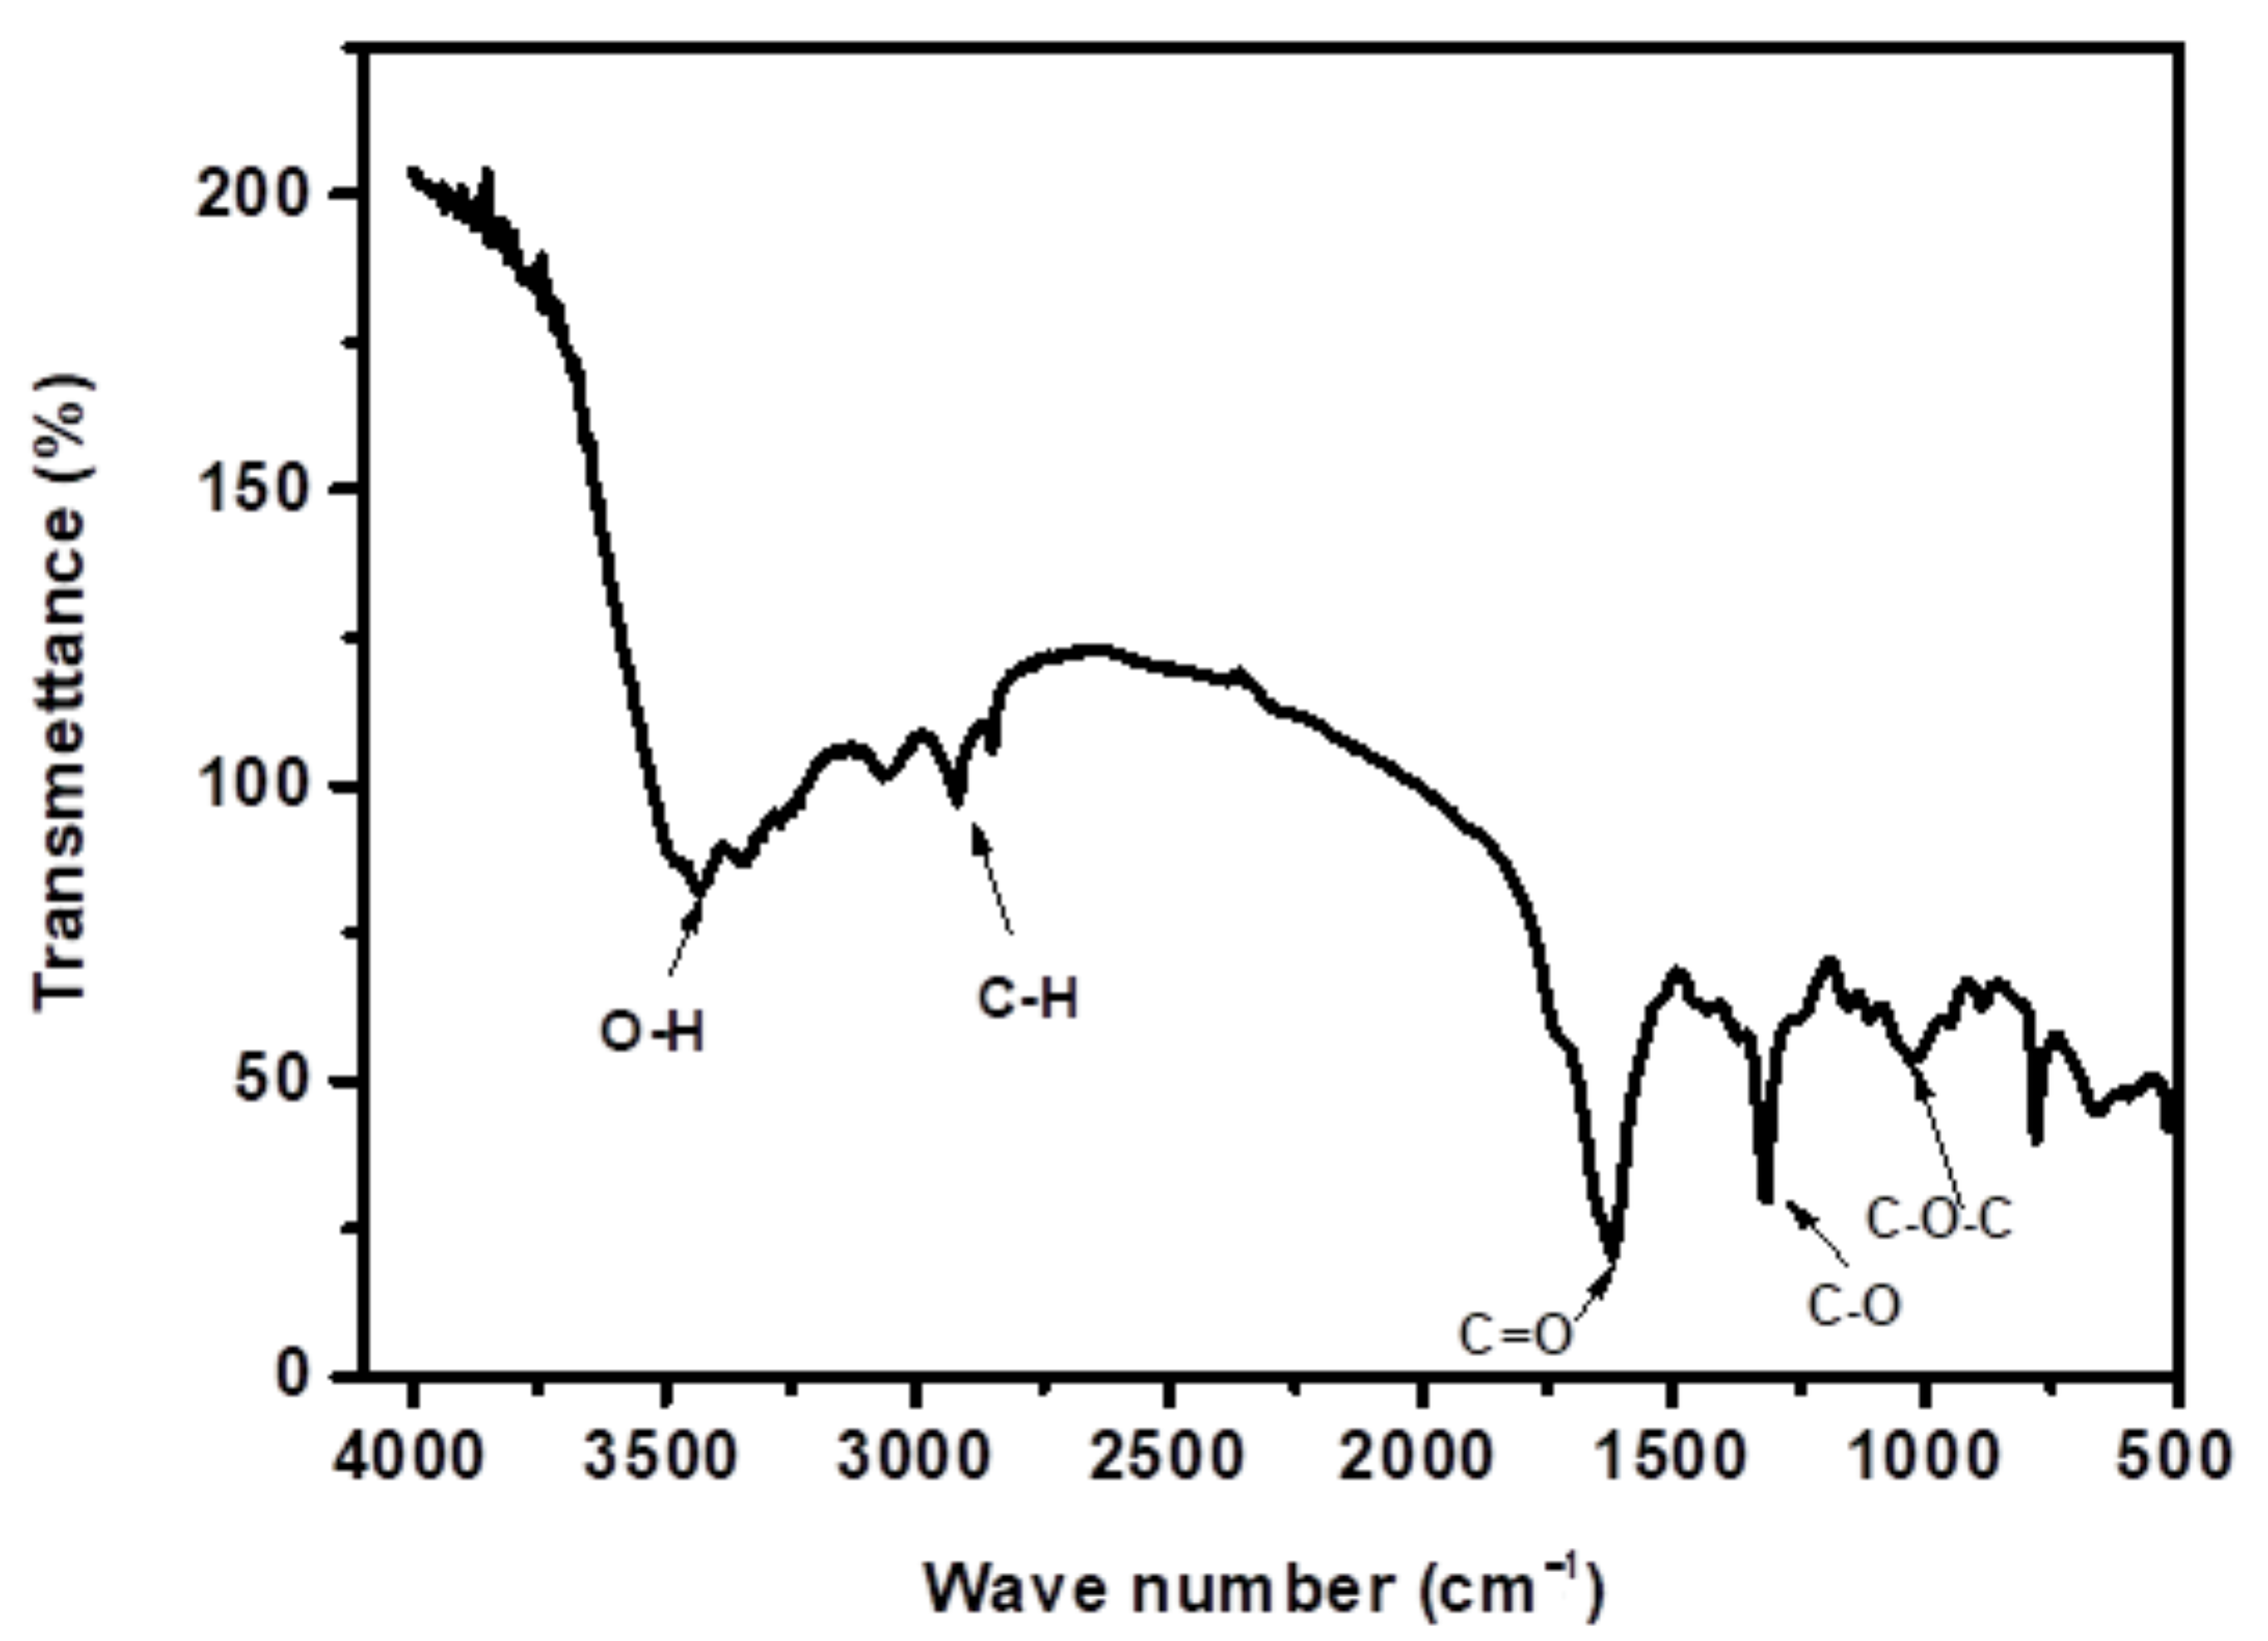
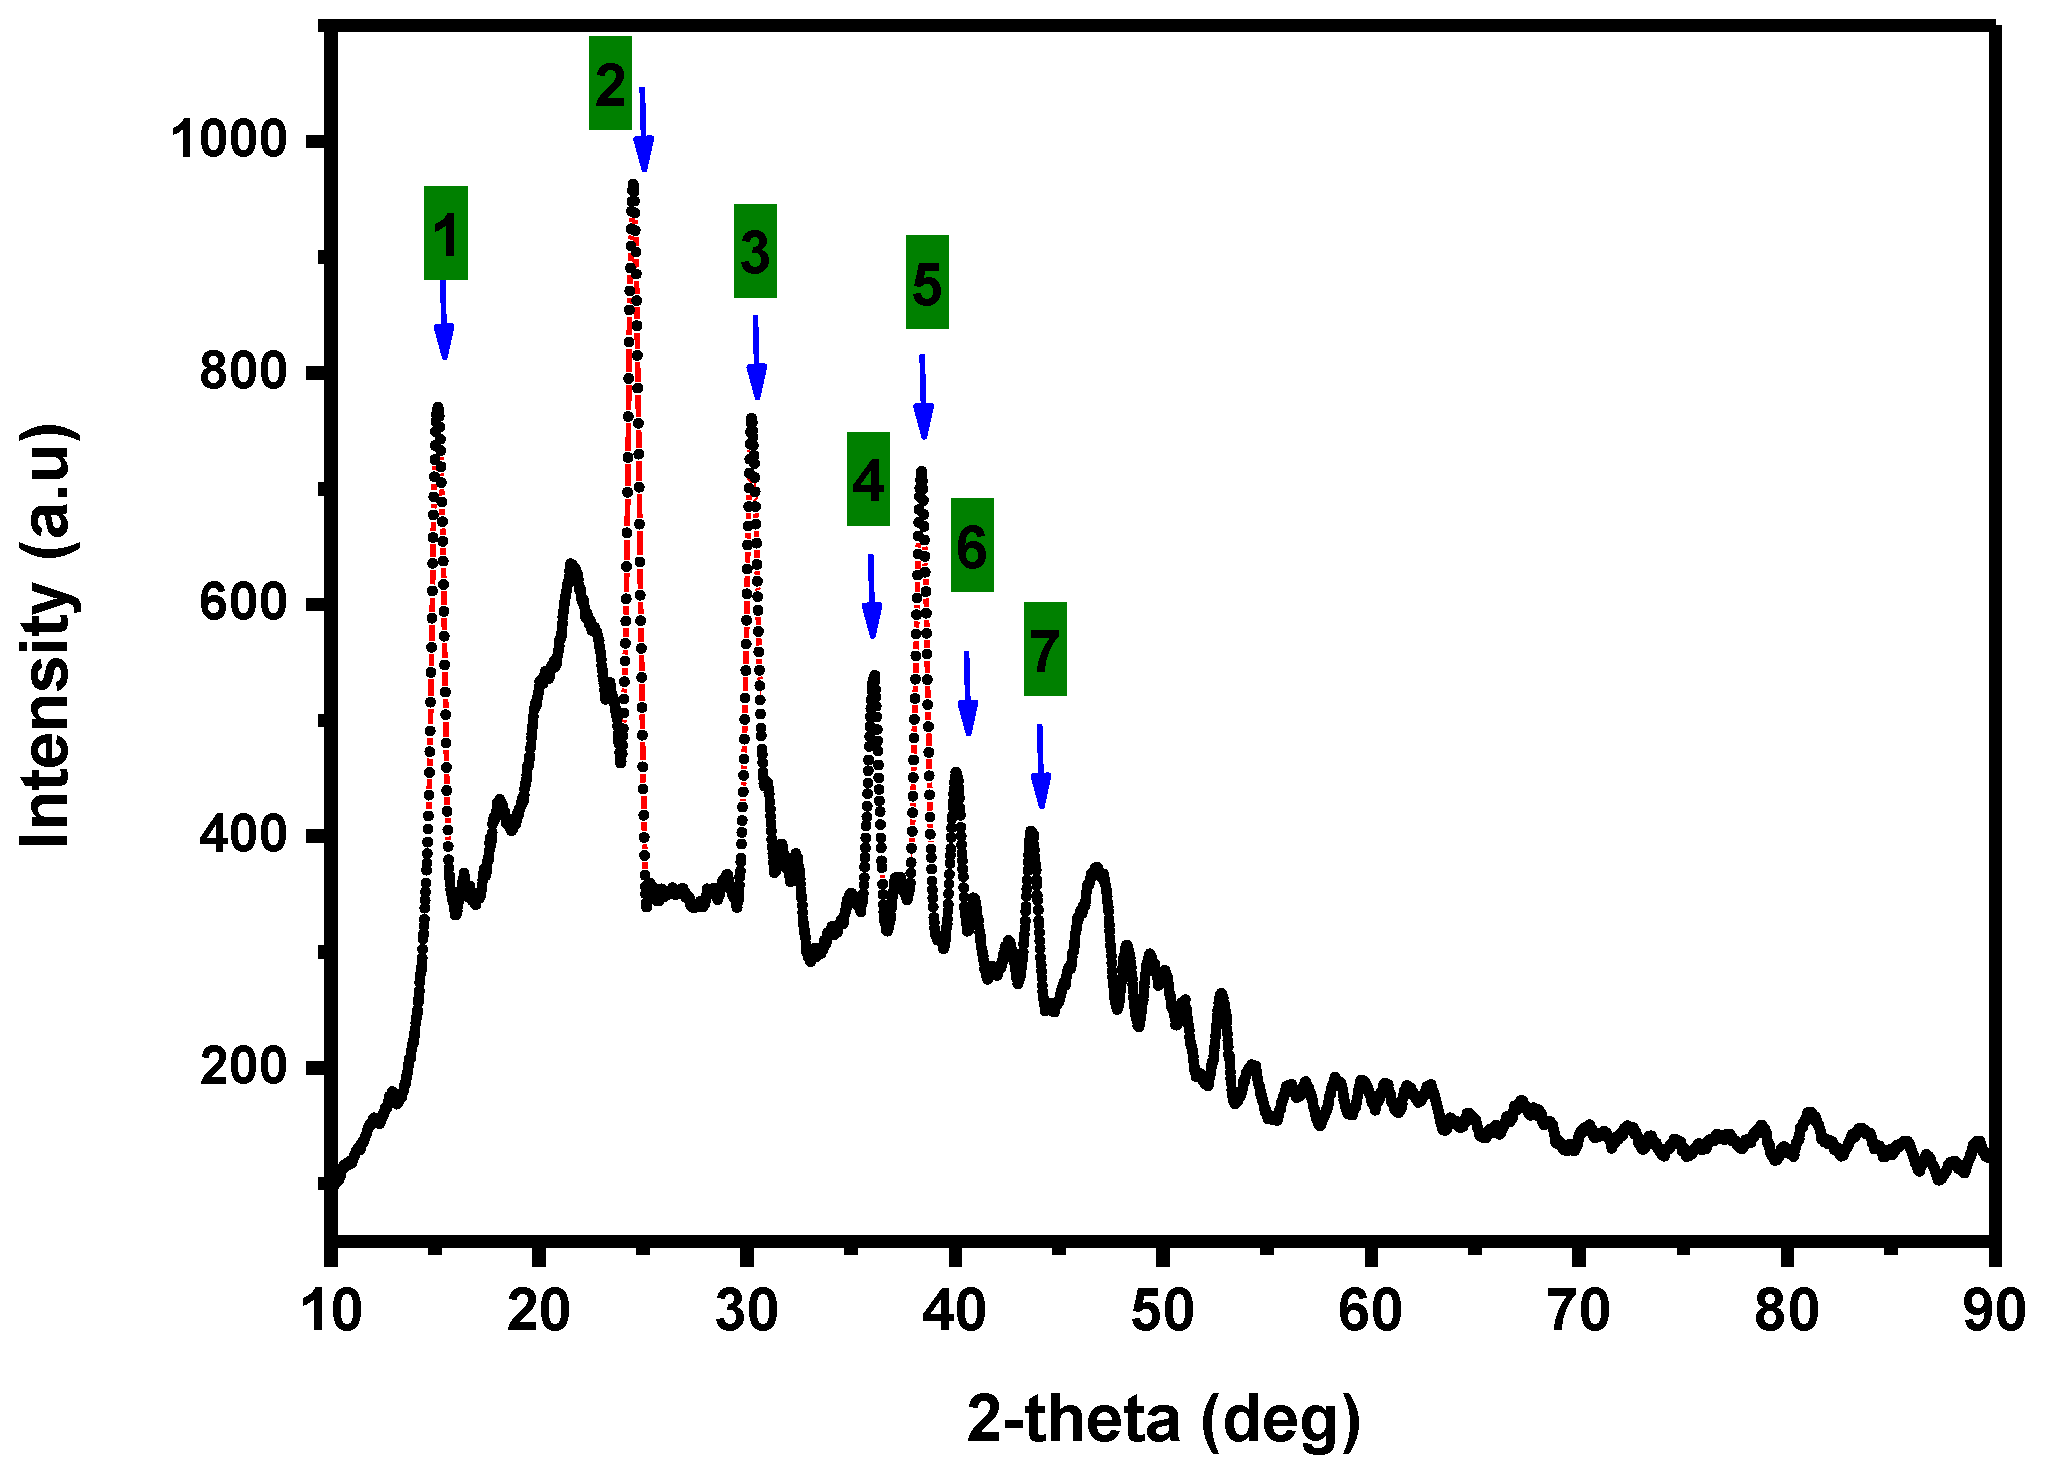
3.1. Characterization of PPFP

FTIR measurements are used to identify the functional groups of PPFP surface. Figure 2 shows a broad band corresponding to the OH stretching in the carboxylic group at 4327 cm−1 and the aliphatic C-H stretching bonds at 2904 cm−1. The band at 1613 cm−1 is due to the presence of C=O bonds in a carboxylic acid. The peak appeared at 1310 cm−1 due to C-O stretching in esters, ether, phenol, or carboxylic groups. The band at 1018 cm−1 indicates the C-O-C bending [30].
Table 1 shows the B.E.T. surface area and particle size of PPFP. According to the table, the surface area of powdered prickly pear fruit peels is very tiny. This result indicated that the morphology of this biomaterial has holes. The SEM images in Figure 3 depict the general appearance of the PPFP surface, which has a high hardness and an agglomeration of small particles. They also indicate the existence of pores on a heterogeneous surface.
The identification of four crystalline phases was made possible by measuring the X-ray diffraction pattern of a dry solid sample of PPFP. These crystal phases corresponded with the diffraction patterns registered at 21.70°, as shown in Figure 4 and Table 1 and Table 2. For β-alanine protein, the amino acids β-Lglutaminic acid, and α-glutamic acid, and at 15.12° and 30.30° the hydrated calcium oxalate in its syn form [47].

3.2. Adsorption Studies

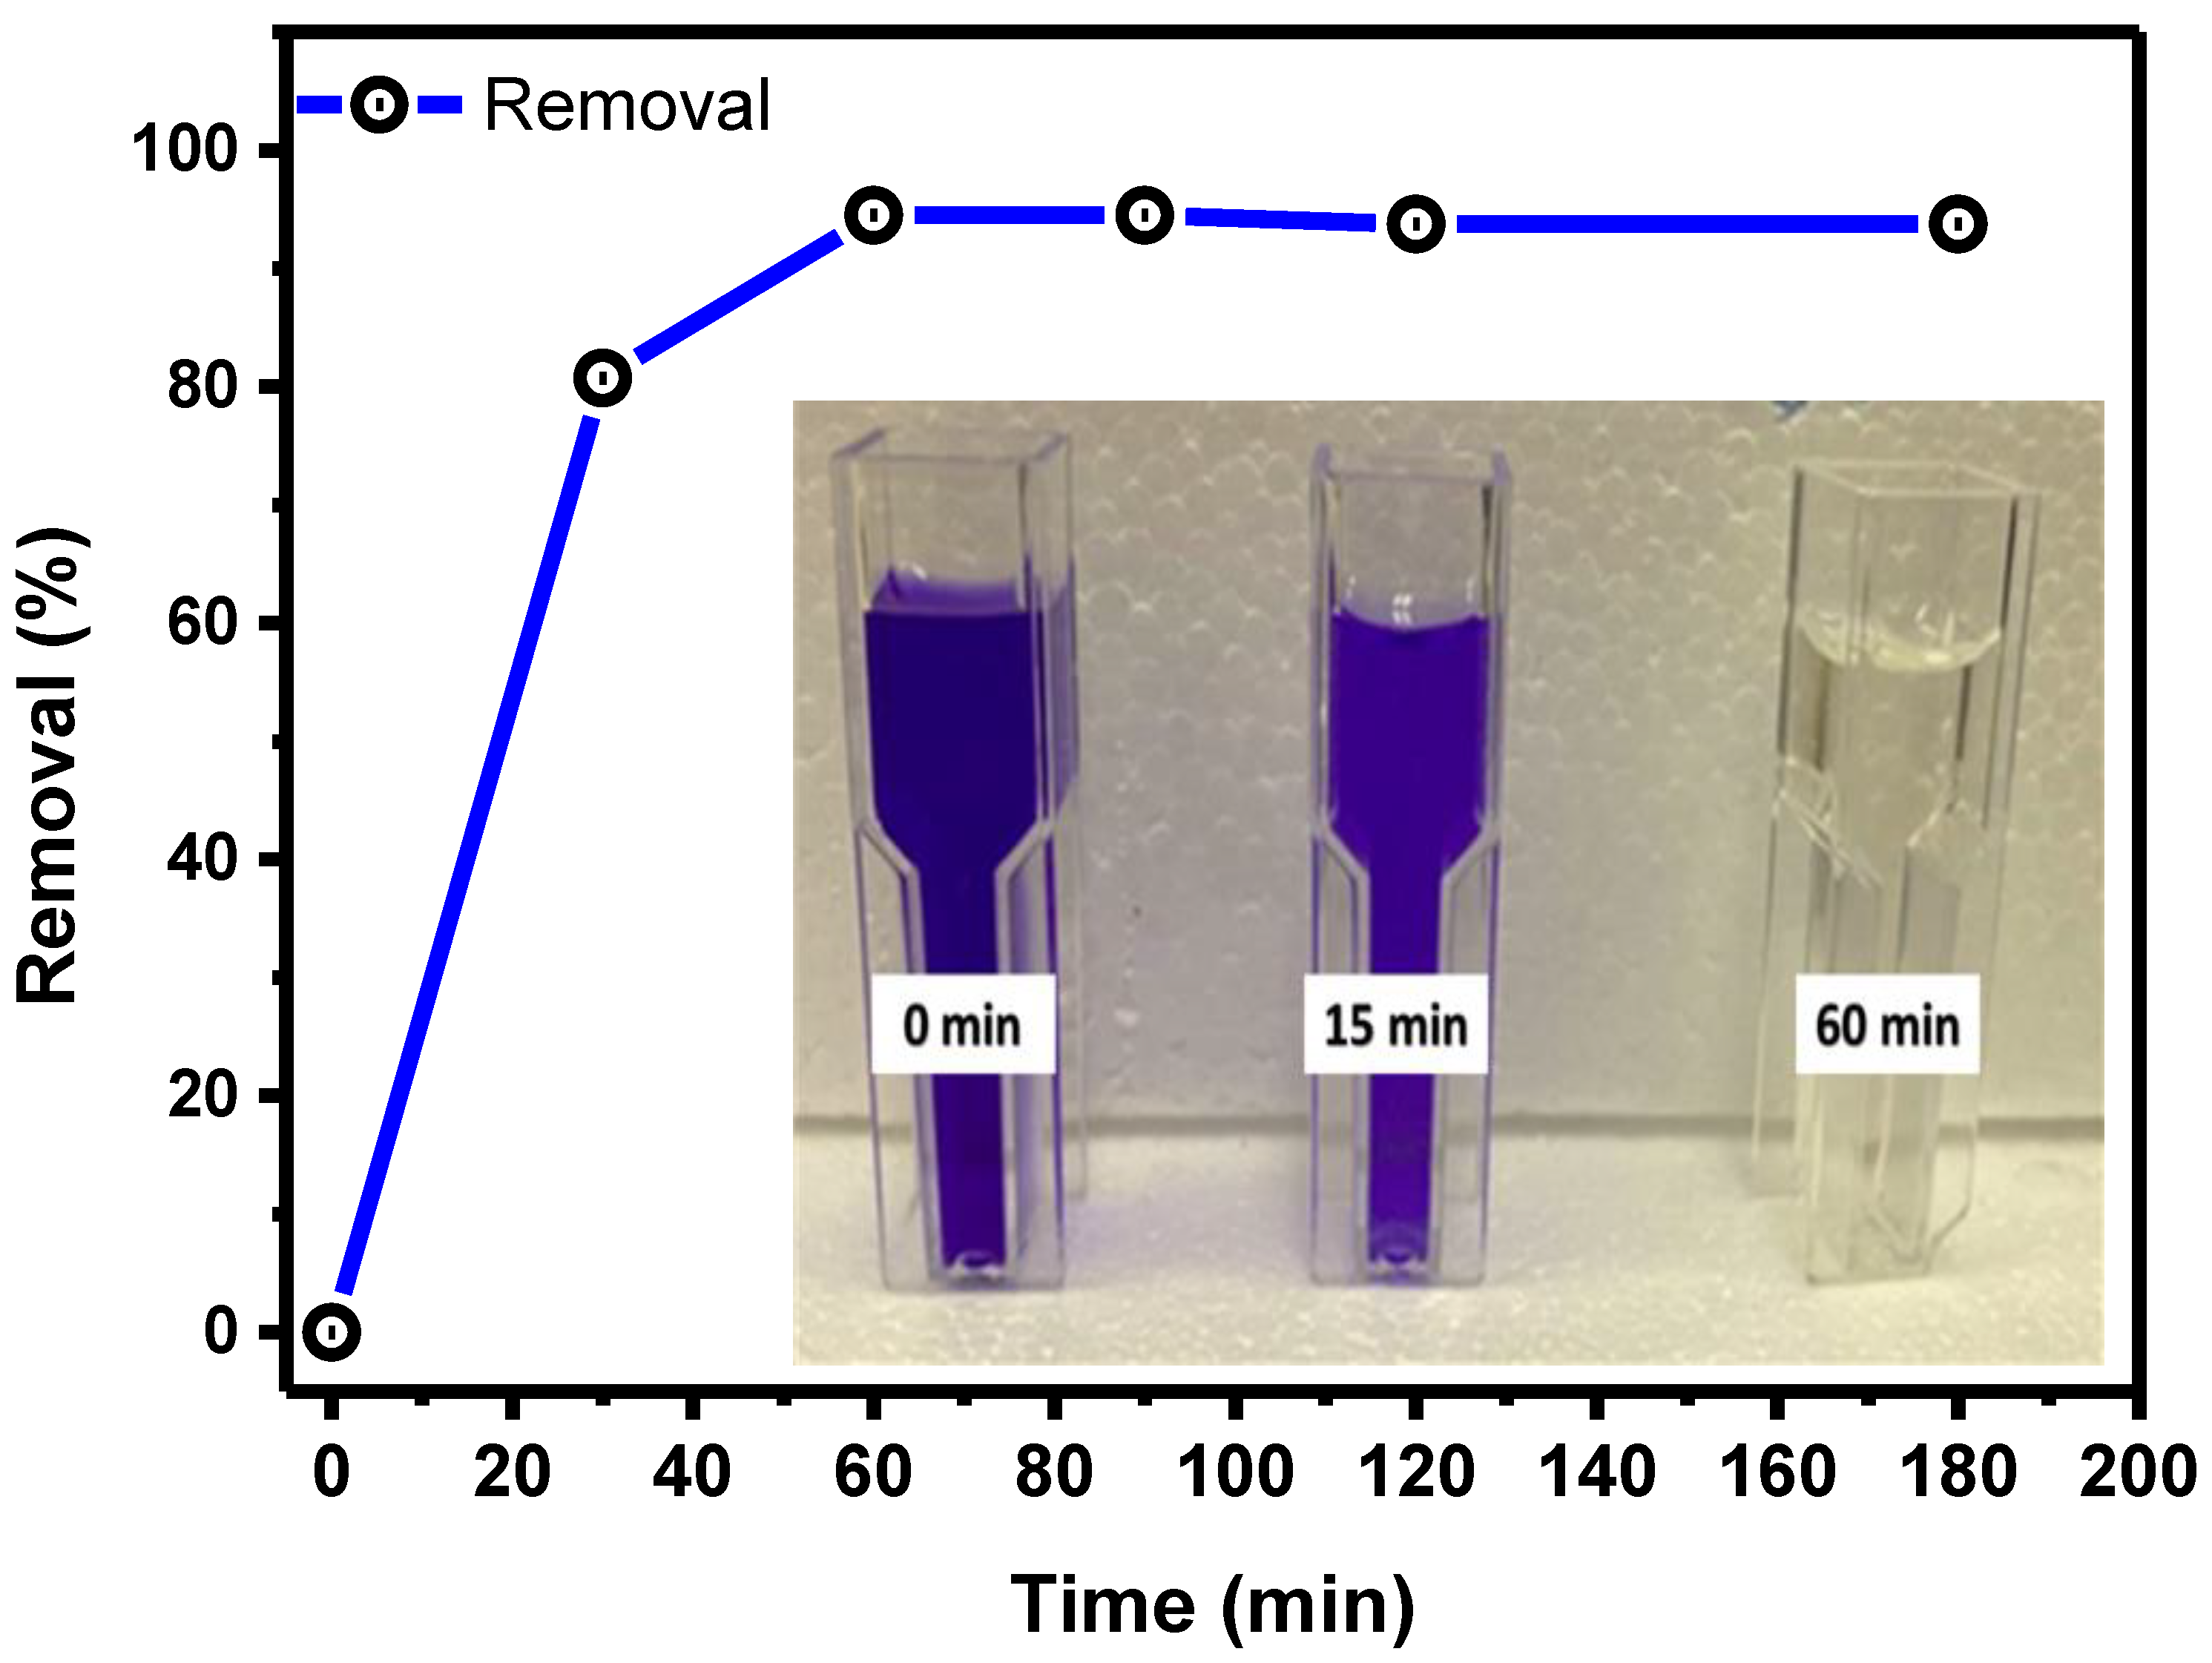
3.2.1. The Impact of Contact Time

The removal percentage value increases with time, as seen in Figure 5, initially swiftly, later gradually, and eventually steadily. This can result from the first adsorption stage’s availability of free surface sites for adsorption [31]. Due to the repelling interactions between the dye molecules in the solution and those that have been adsorbed onto the adsorbent, the remaining vacant surface sites are challenging to exploit in later phases. The equilibrium of PTZIDM dye adsorption on PPFP was attained after 60 min. The ideal contact time is 60 min, with an adsorption efficiency of 95%. The experimental findings show that the adsorption capacity of PTZIDM remains the same after 60 min; this might be because there are not many unoccupied sites available. Thus, 95% is the greatest proportion of PTZIDM elimination at symmetry time.

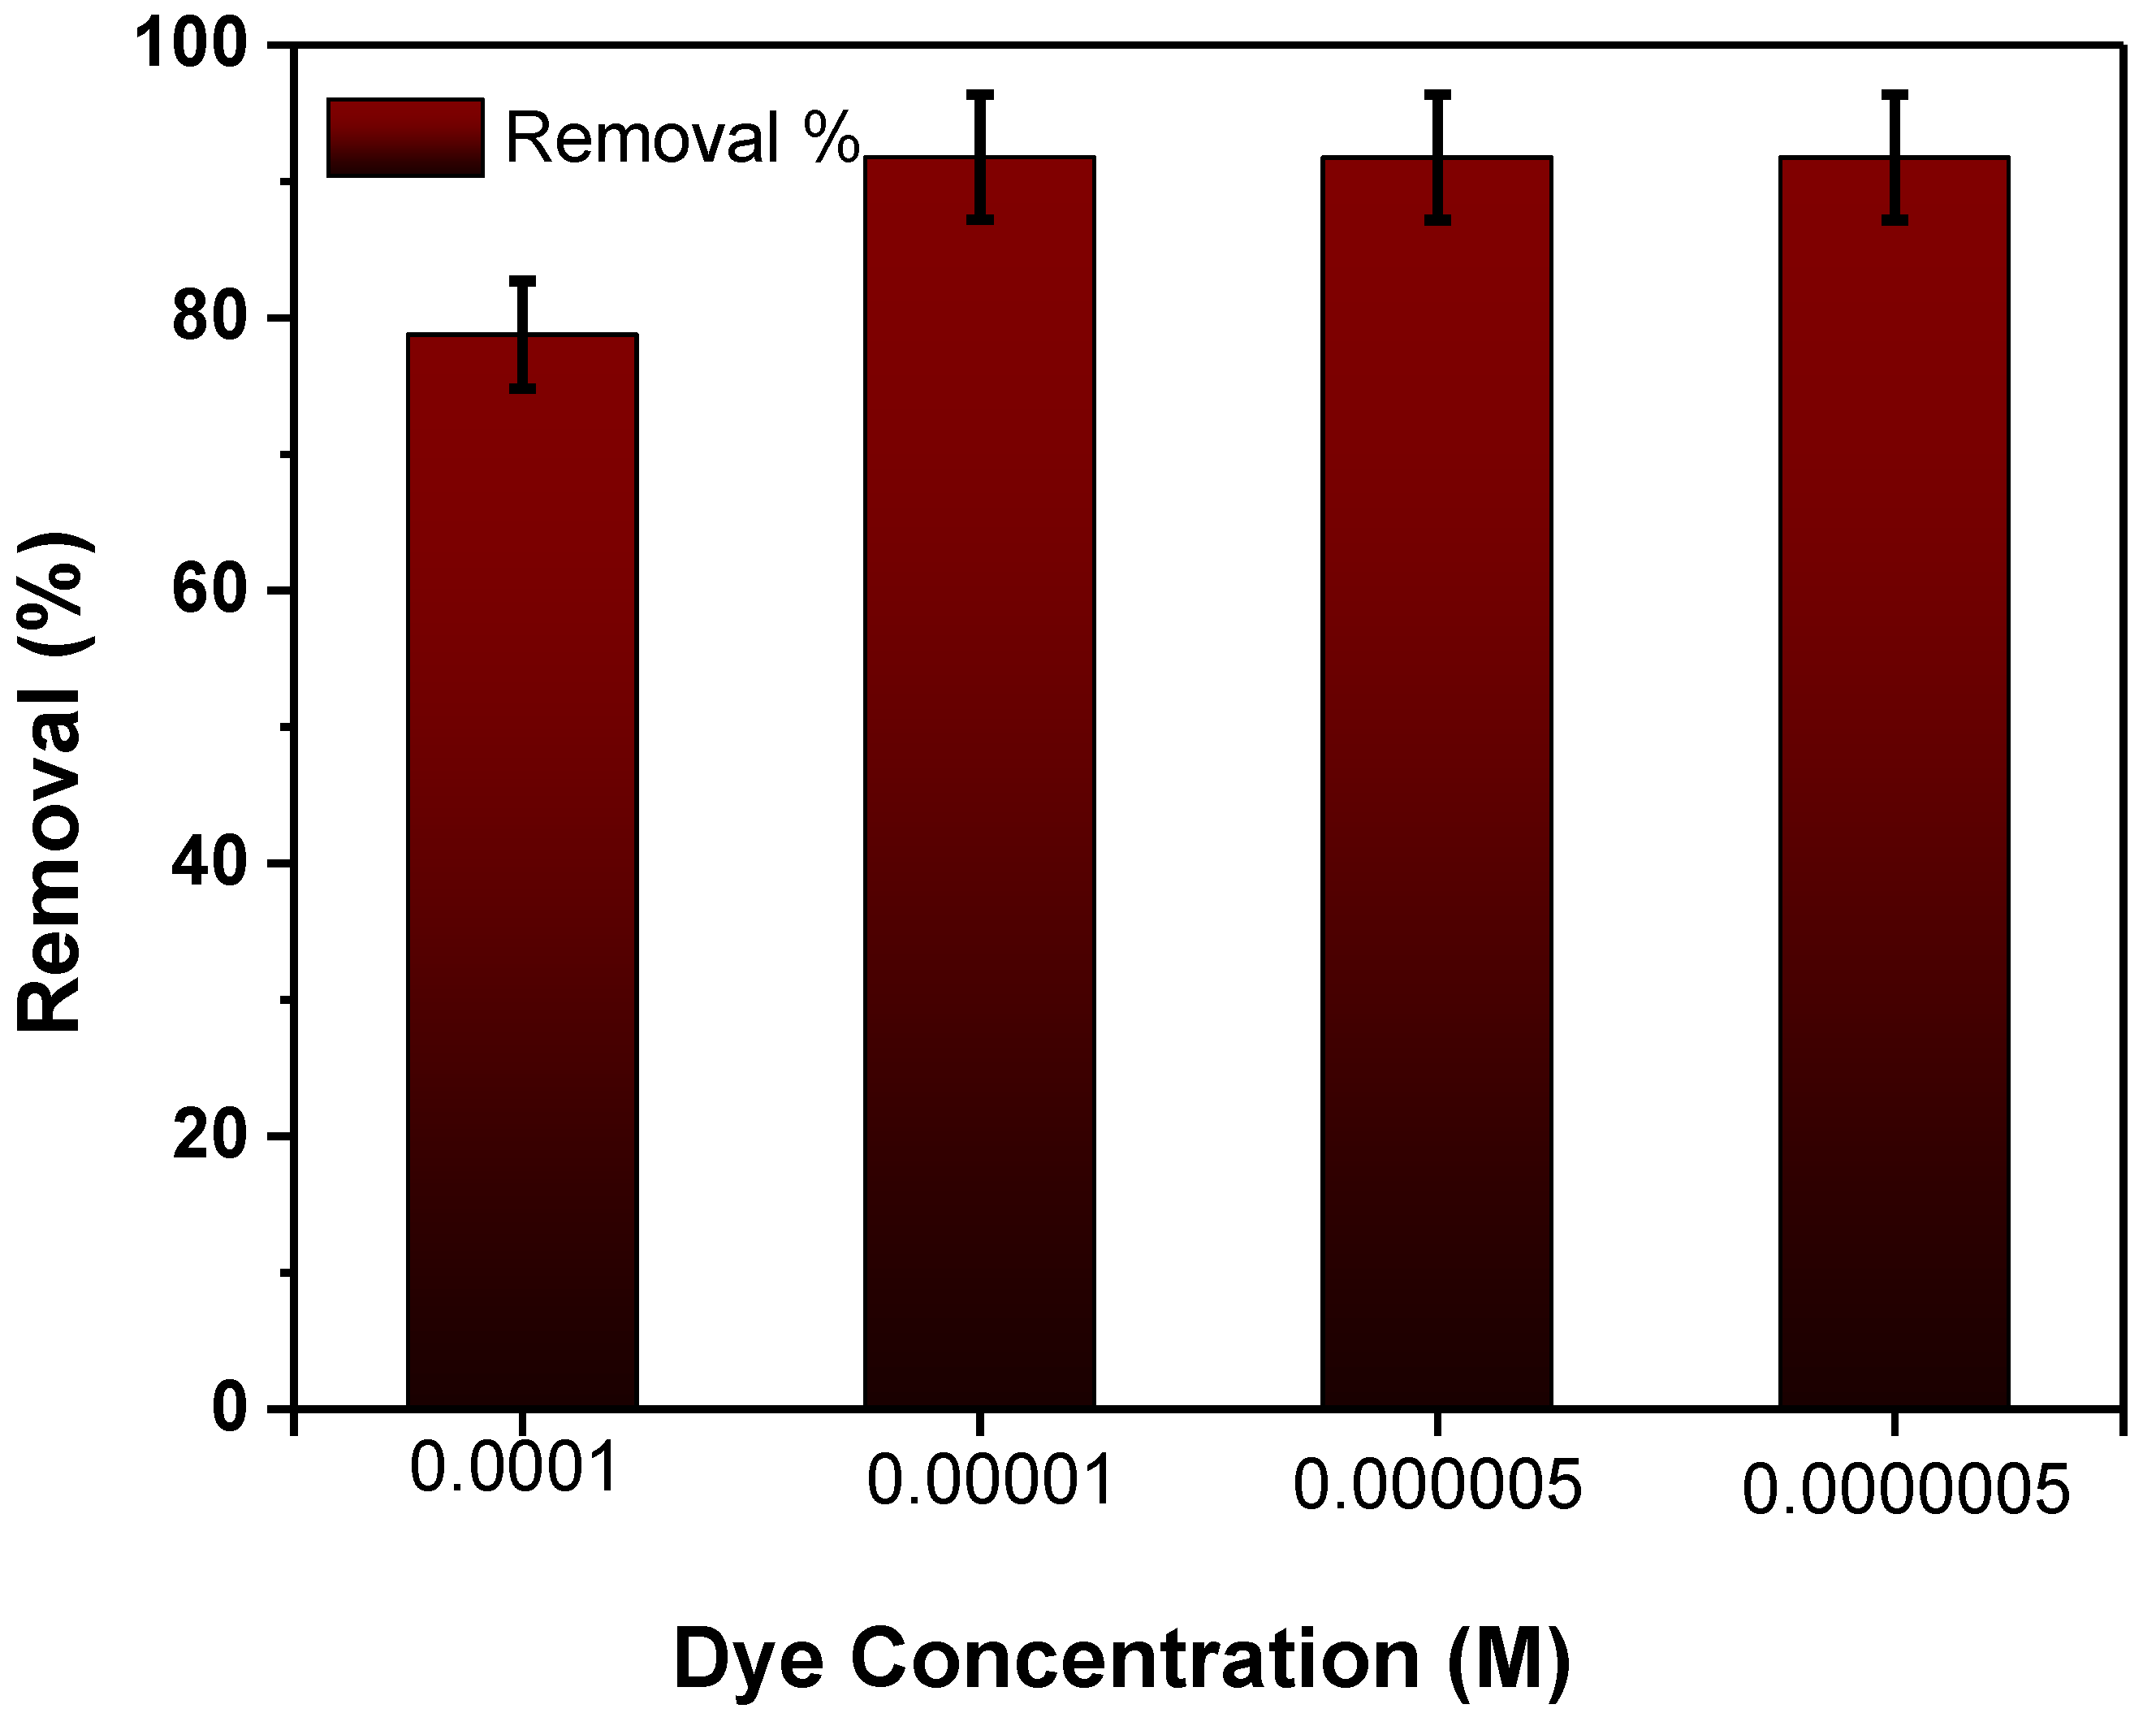
3.2.2. The Impact of the Initial Dye Concentration

According to Figure 6, the adsorption is obviously affected by the original dye dilution. With the original dye dilution from 1 × 10⁻⁴ M to 2 × 10⁻⁵ during the examination time equivalent to 60 min for PTZIDM and at room temperature, the percentage of dye adsorption declines with rise concentration. This could be the result of repelling communications between the adsorbent’s surface and dye’s molecule. All dye concentrations existed in the adsorption positions can interrelate with the cover of PPFP since the proportion and the percentage of accessible binding locations to the original dye is greater at lower concentrations [48]. The adsorption site is saturated at greater initial dye concentrations, preventing dye from migrating to the open cover locations on the surface, hence the adsorbent surface has a relatively lower ratio [48].

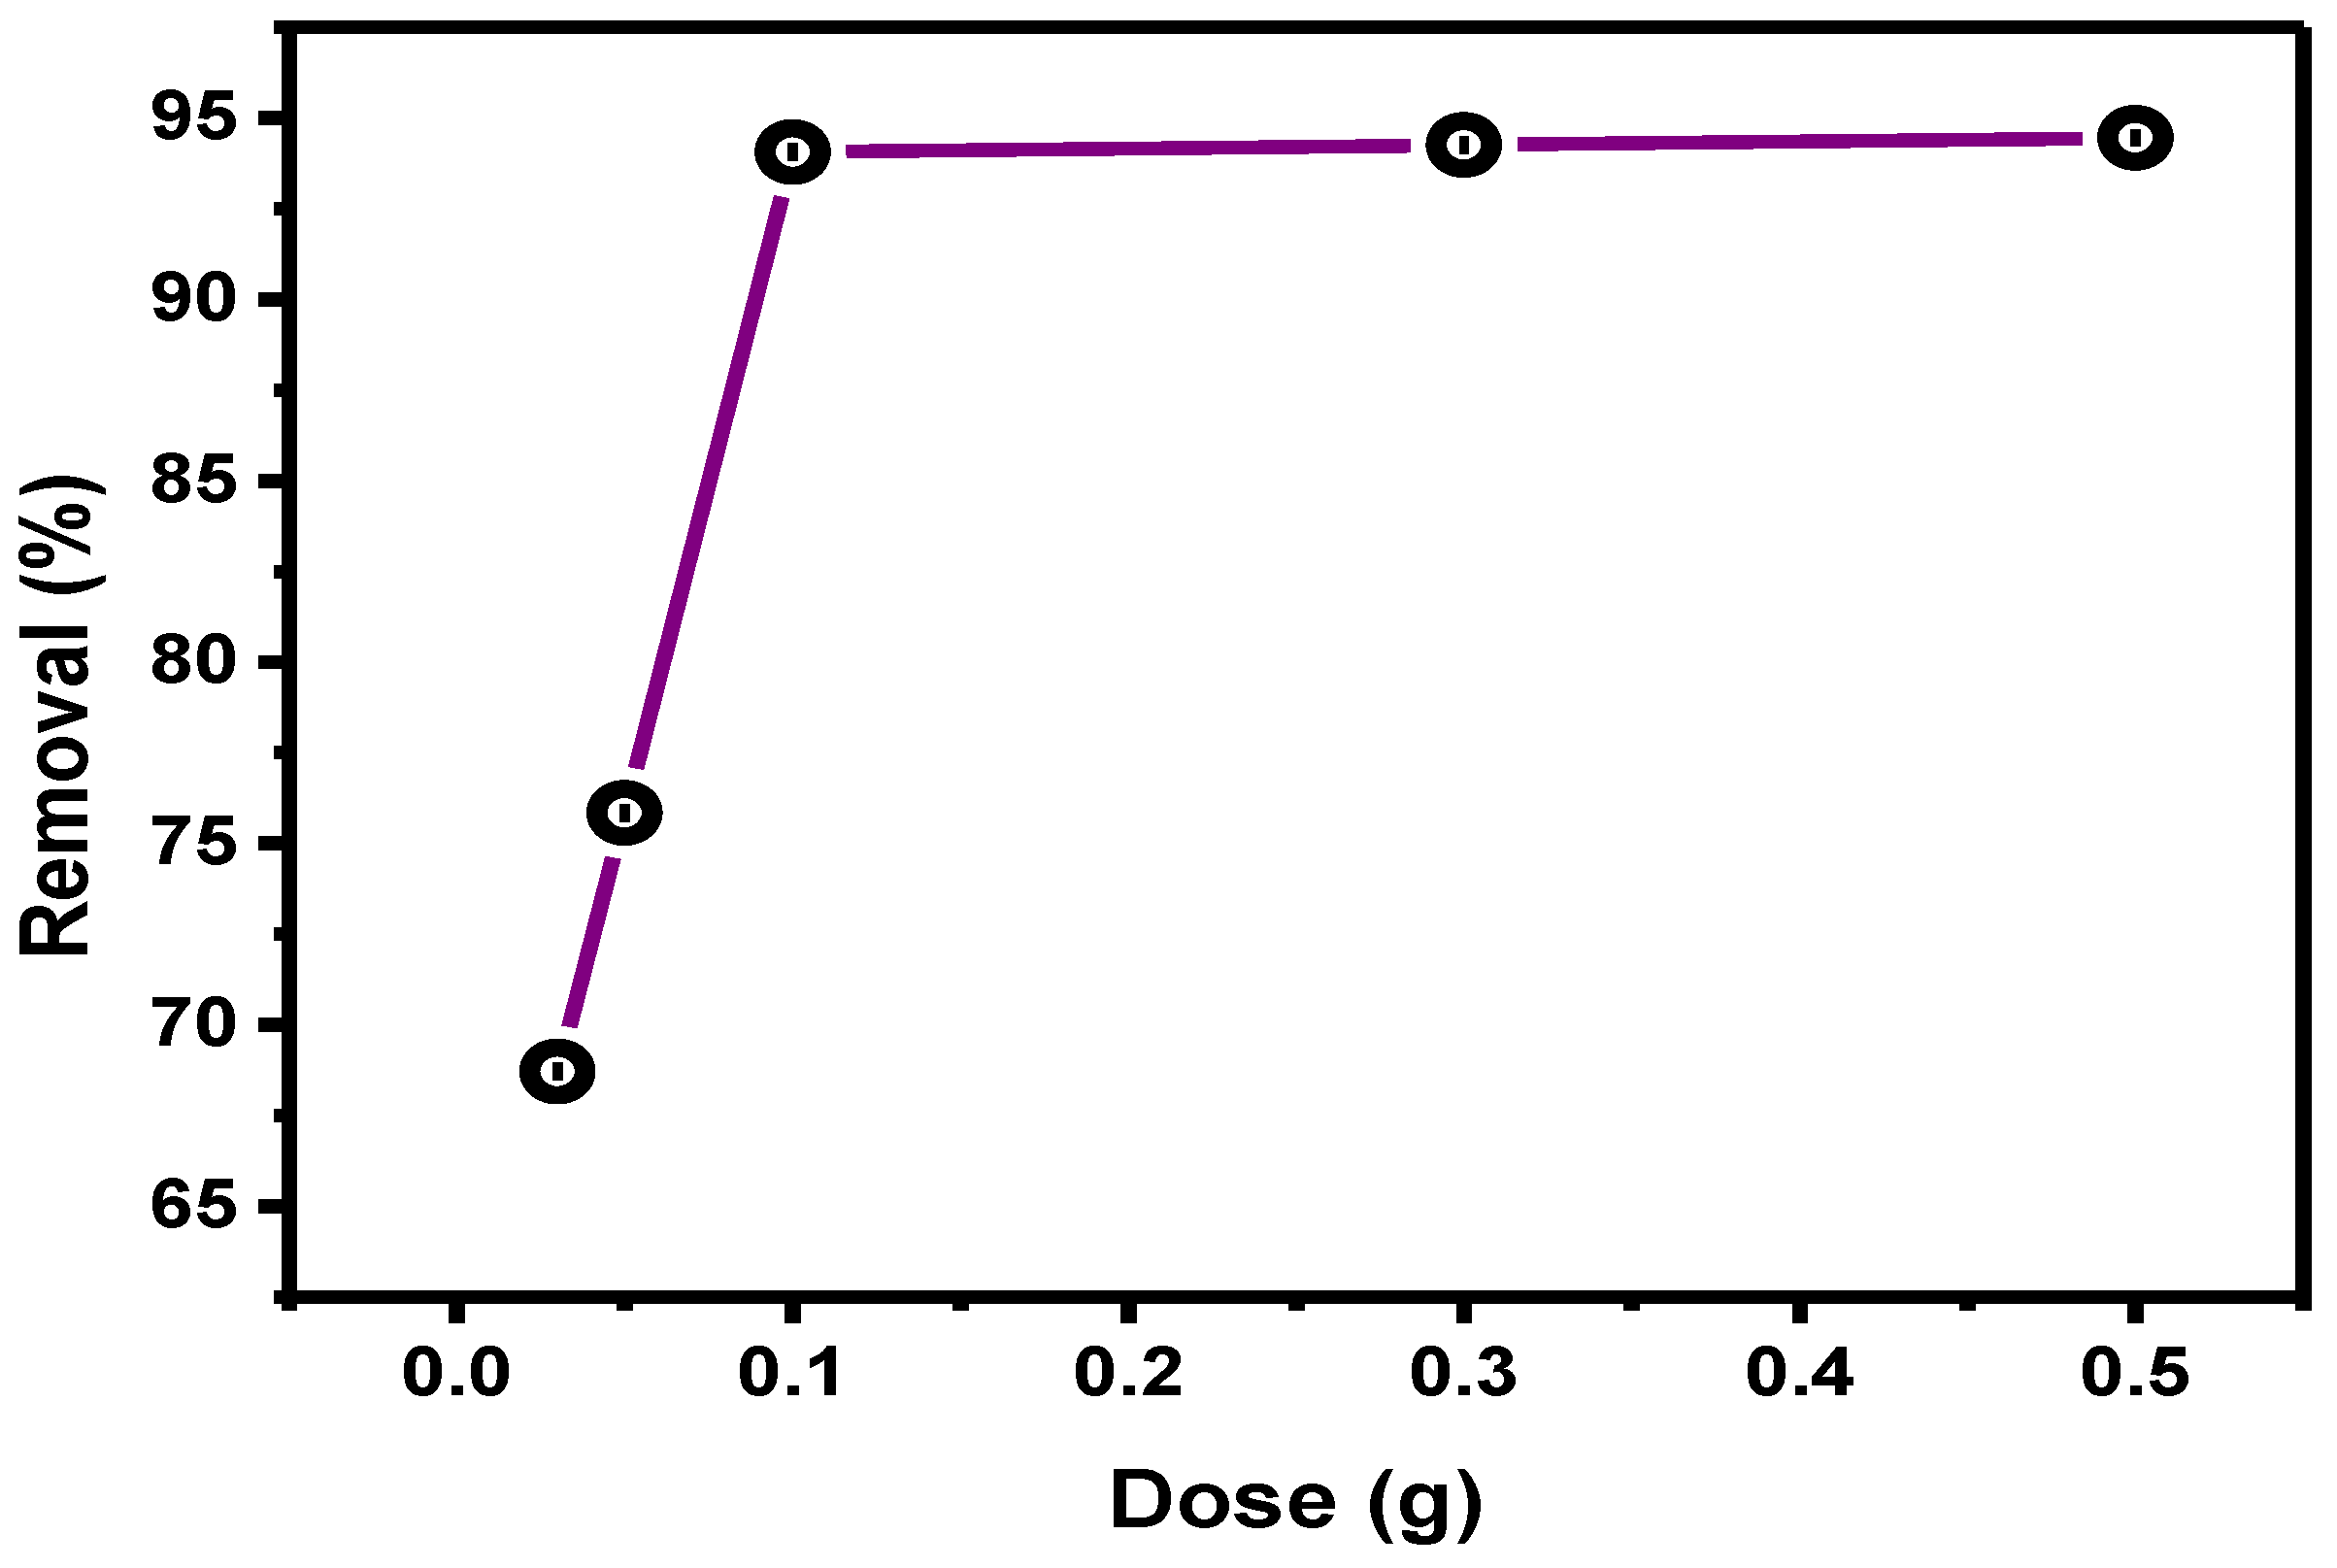
3.2.3. The Impact of the Adsorbent Dose

Its percentage of color removal increases as the adsorbent dose rises, as depicted in Figure 7 below. Due to increased cover area, binding sites, and pore volume, the primary cause of this behavior might be associated with the increased availability of active locations for dye–surface interactions [49]. The PPFP surface aggregation area was accessible for dye adsorption, which lengthens the diffusion channel, which may be another factor [50]. A measure of 0.1 g is the recommended dose for removing 96% of the PTZIDM dye.

3.2.4. The Impact of the Solution Temperature

According to Figure 8 below, the proportion of dye removal decreases as the mixture’s temperature rises. This result suggests that the exothermic process is evident in the dye adsorption process, which predicts that the primary adsorption mechanism of PTZIDM onto PPFP is a chemisorption process when there are weak appealing interactions between the surface of PPFP and PTZIDM molecules [51]. For PTZIDM adsorption, the 96% dye removal occurs at 25 °C. Therefore, the ideal temperature for the adsorption procedure utilizing the produced material is determined to be 25 °C. The degree to which dye molecules diffuse from the adsorbent surface solution bulk over the external border cover and via the adsorbent’s interior pores is often discouraged by a rise in solution temperature. Additionally, ion exchange rates are accelerated, and the dye ion attraction to the PPFP surface is made easier by activating the PPFP adsorbent material at decreased temperatures [51]. While the boundary layer’s surface area around the adsorbent increases with temperature, the mobility of dye molecules decreases as a consequence of the development of new active sites, which action a drop in adsorbate amount allocation resistance at the border level.

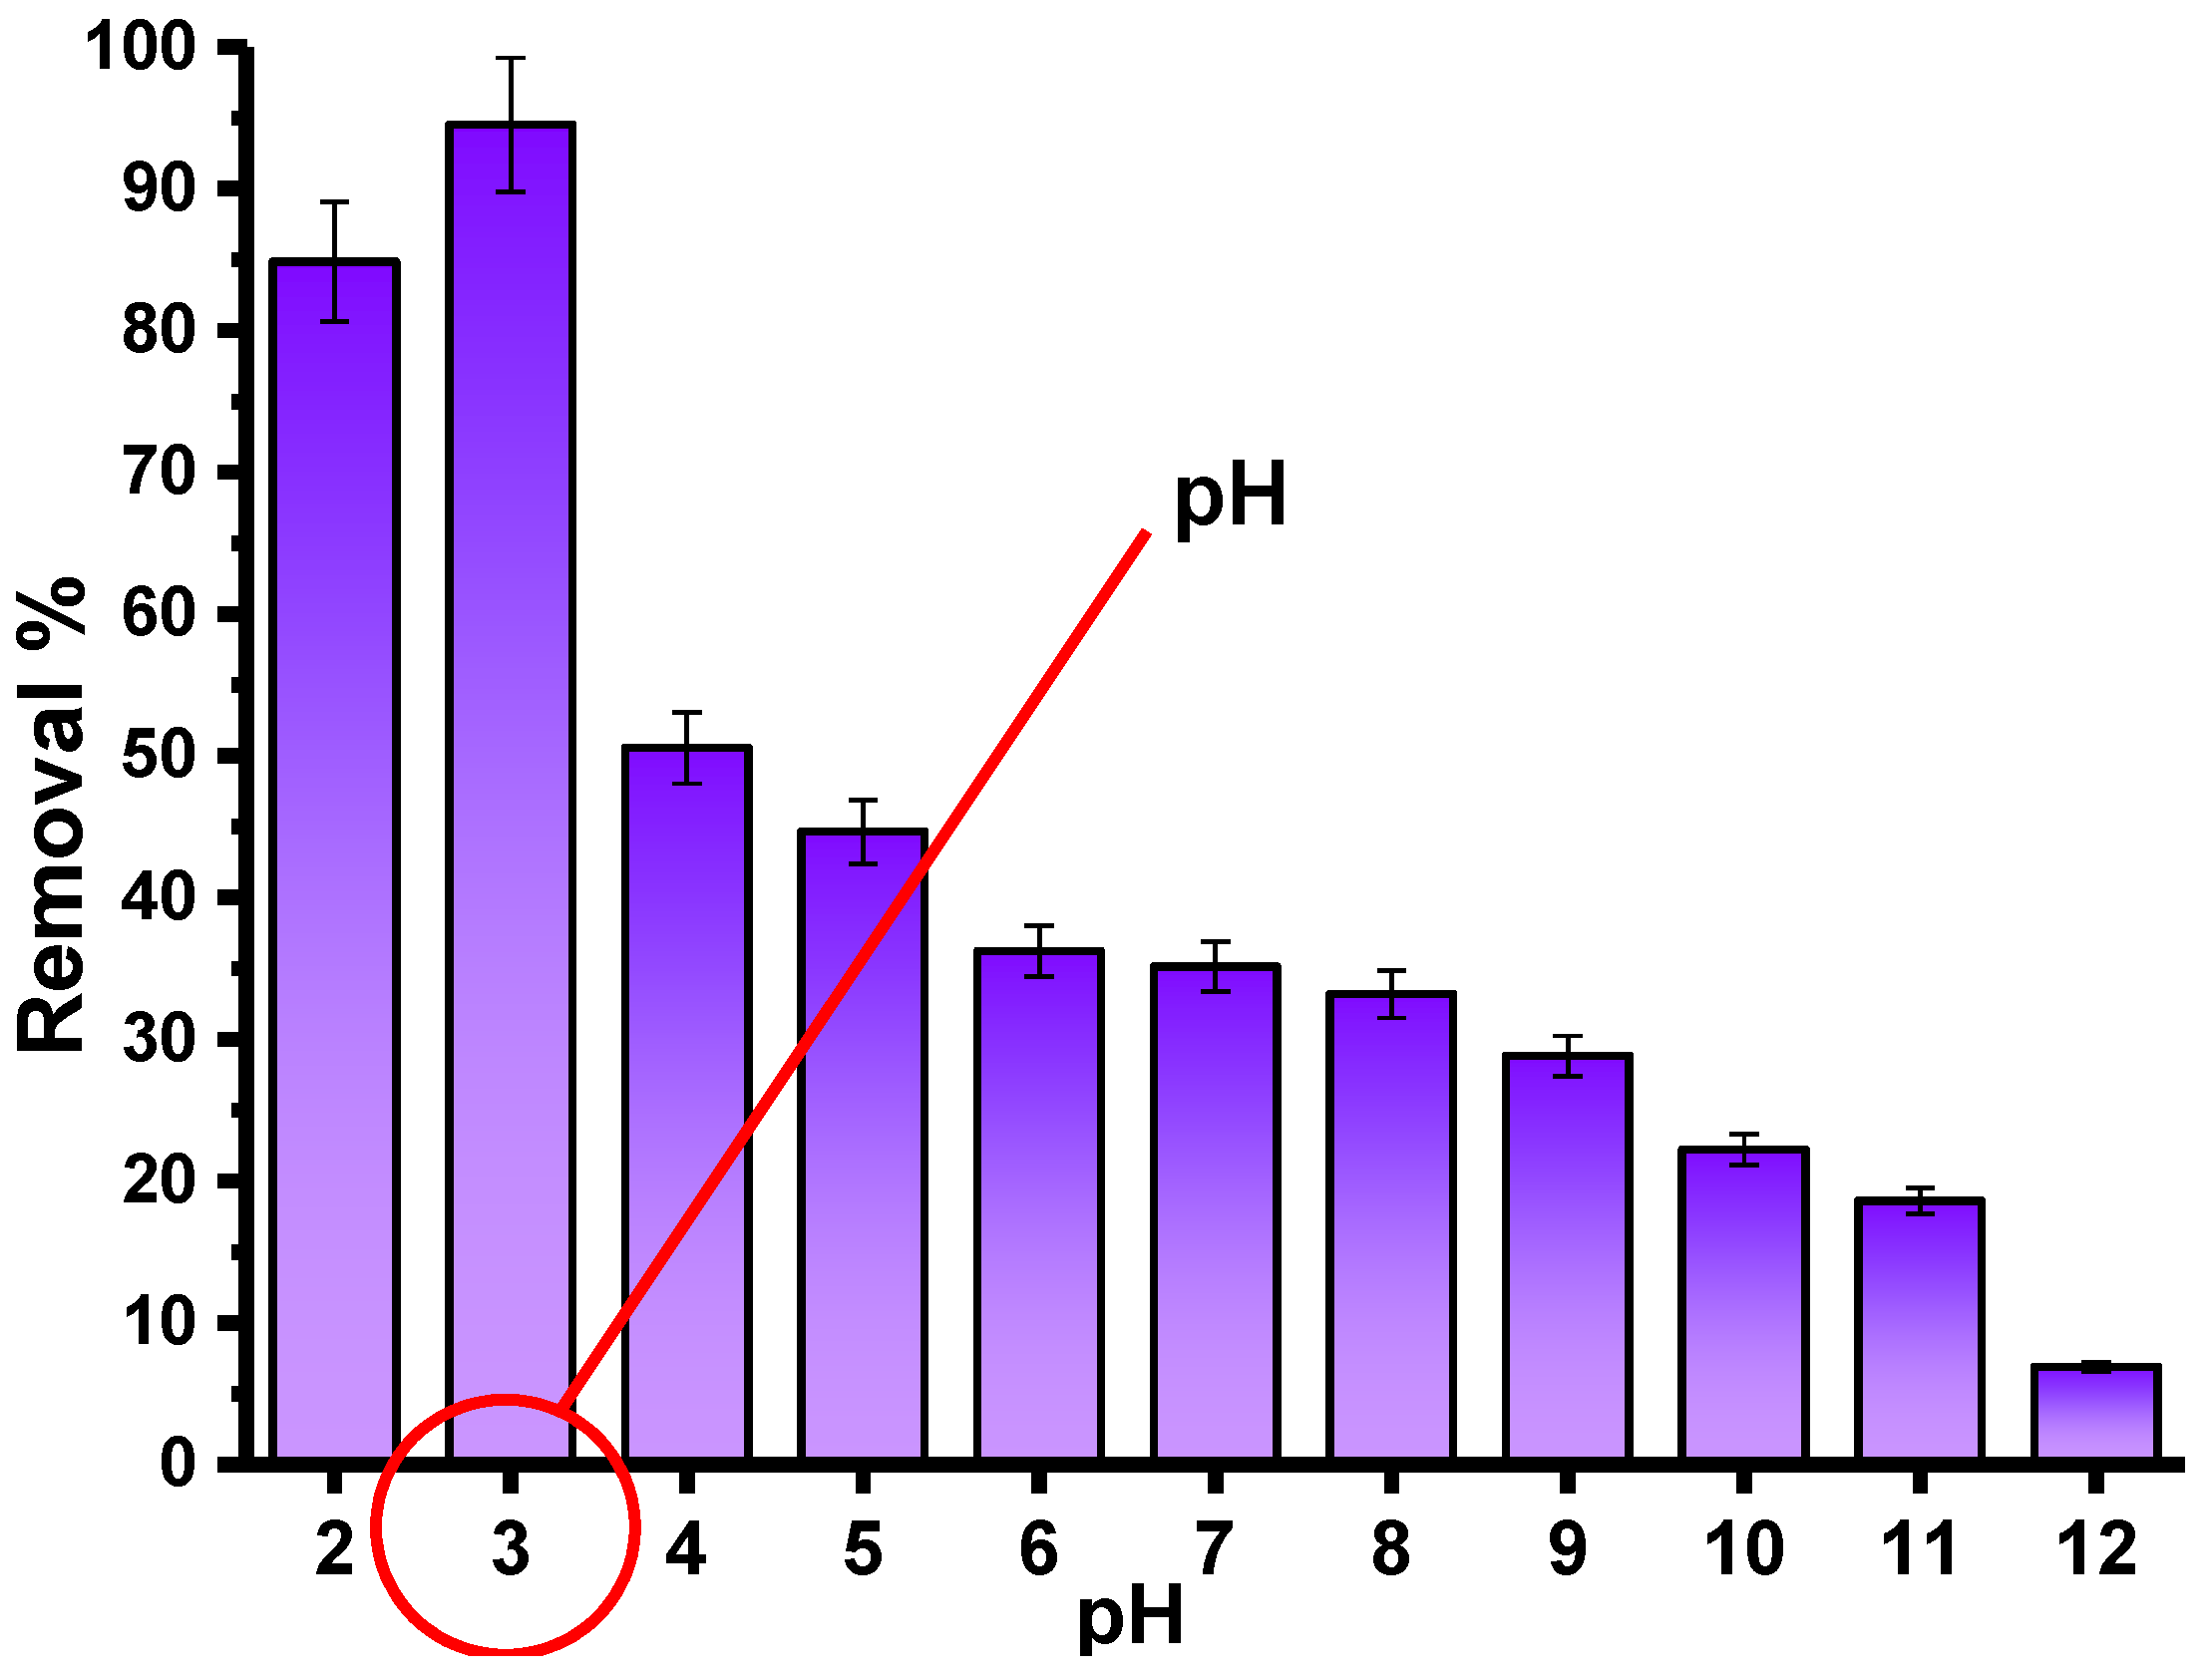
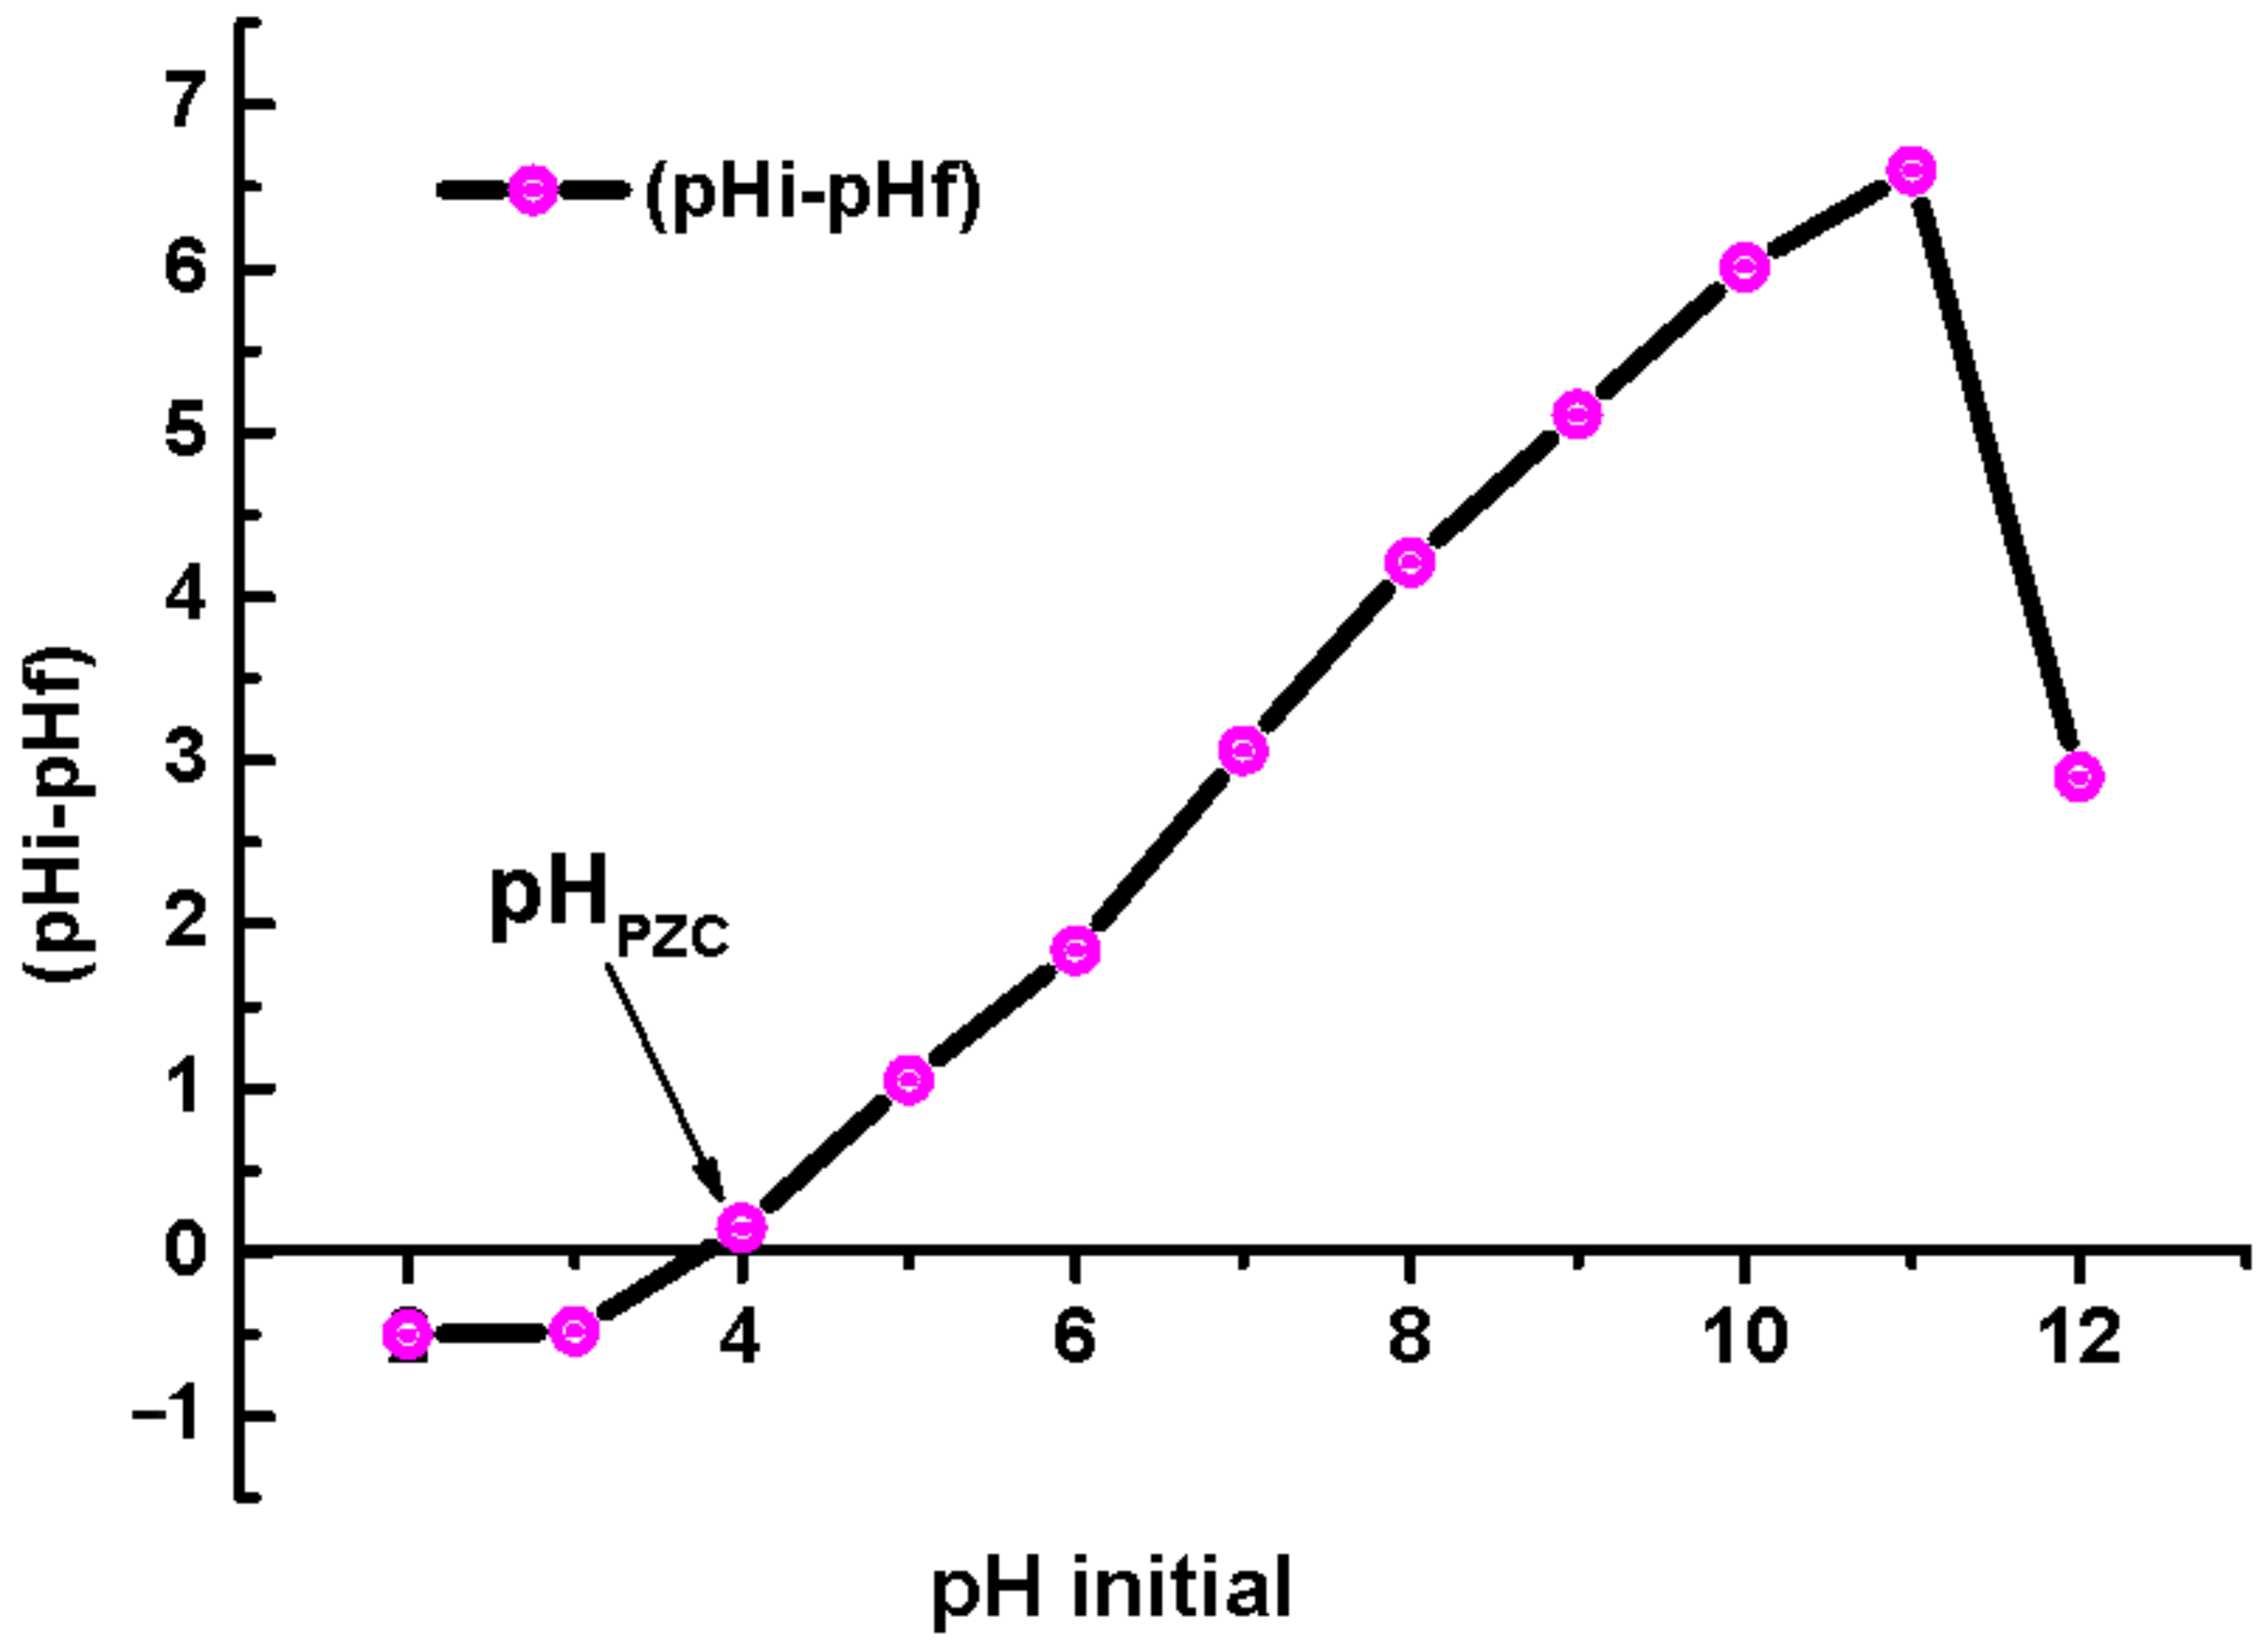
3.2.5. The Impact of pH

One of the most important variables influencing adsorption capacity is the dye solution’s initial pH value since it affects the surface binding sites, the dye’s surface charge and the degree of ionization [52]. The dye ion absorption may be influenced by both the chemistry of the PTZIDM solution and the dynamic sites. PPFP, as an adsorbent, may have a significant amount of active locations. Over a pH from 2 to 12, the impact of solution pH values on dye extraction is examined. The removal rate of PTZIDM increased as the solution pH decreased, with 3 being the ideal pH for PTZIDM adsorption (Figure 9). The platform for better understanding and explanation of the phenomenon can be seen from the fact that donor–acceptor dye turns with a negative charge as it dissolves in water. Therefore, the positively electrified area of prickly pear increases PTZIDM adsorption in acidic conditions [52]. It is also evident that the adsorption of PTZIDM increased when the pH of the solution decreased, which is due to a raised electrostatic magnetism among the negative charge PTZIDM particles and the bioadsorbent surface that is positively charged. Consequently, the elimination of PTZIDM dye is reduced at high pH values. However, as the pH level rises, the charge on the surface shifts to the negative side, decreasing the elimination of PTZIDM. Furthermore, the great proportion elimination of the dye solution at an acidic pH may be explained by interface electrodynamics among the negatively charged PTZIDM dye anions and positively charged adsorbent [52].
In general, the surface of the adsorbent acquires negative or positive charges upon immersion in an aqueous alkaline or acidic medium (Figure 10). As a result, the negatively charged groups present in the dye molecules may be drawn to the adsorbent surface at lower pH, enhancing adsorption capacity, which decreases at higher pH. Because of this, dye removal is less effective at high pH and more effective at low pH [53].

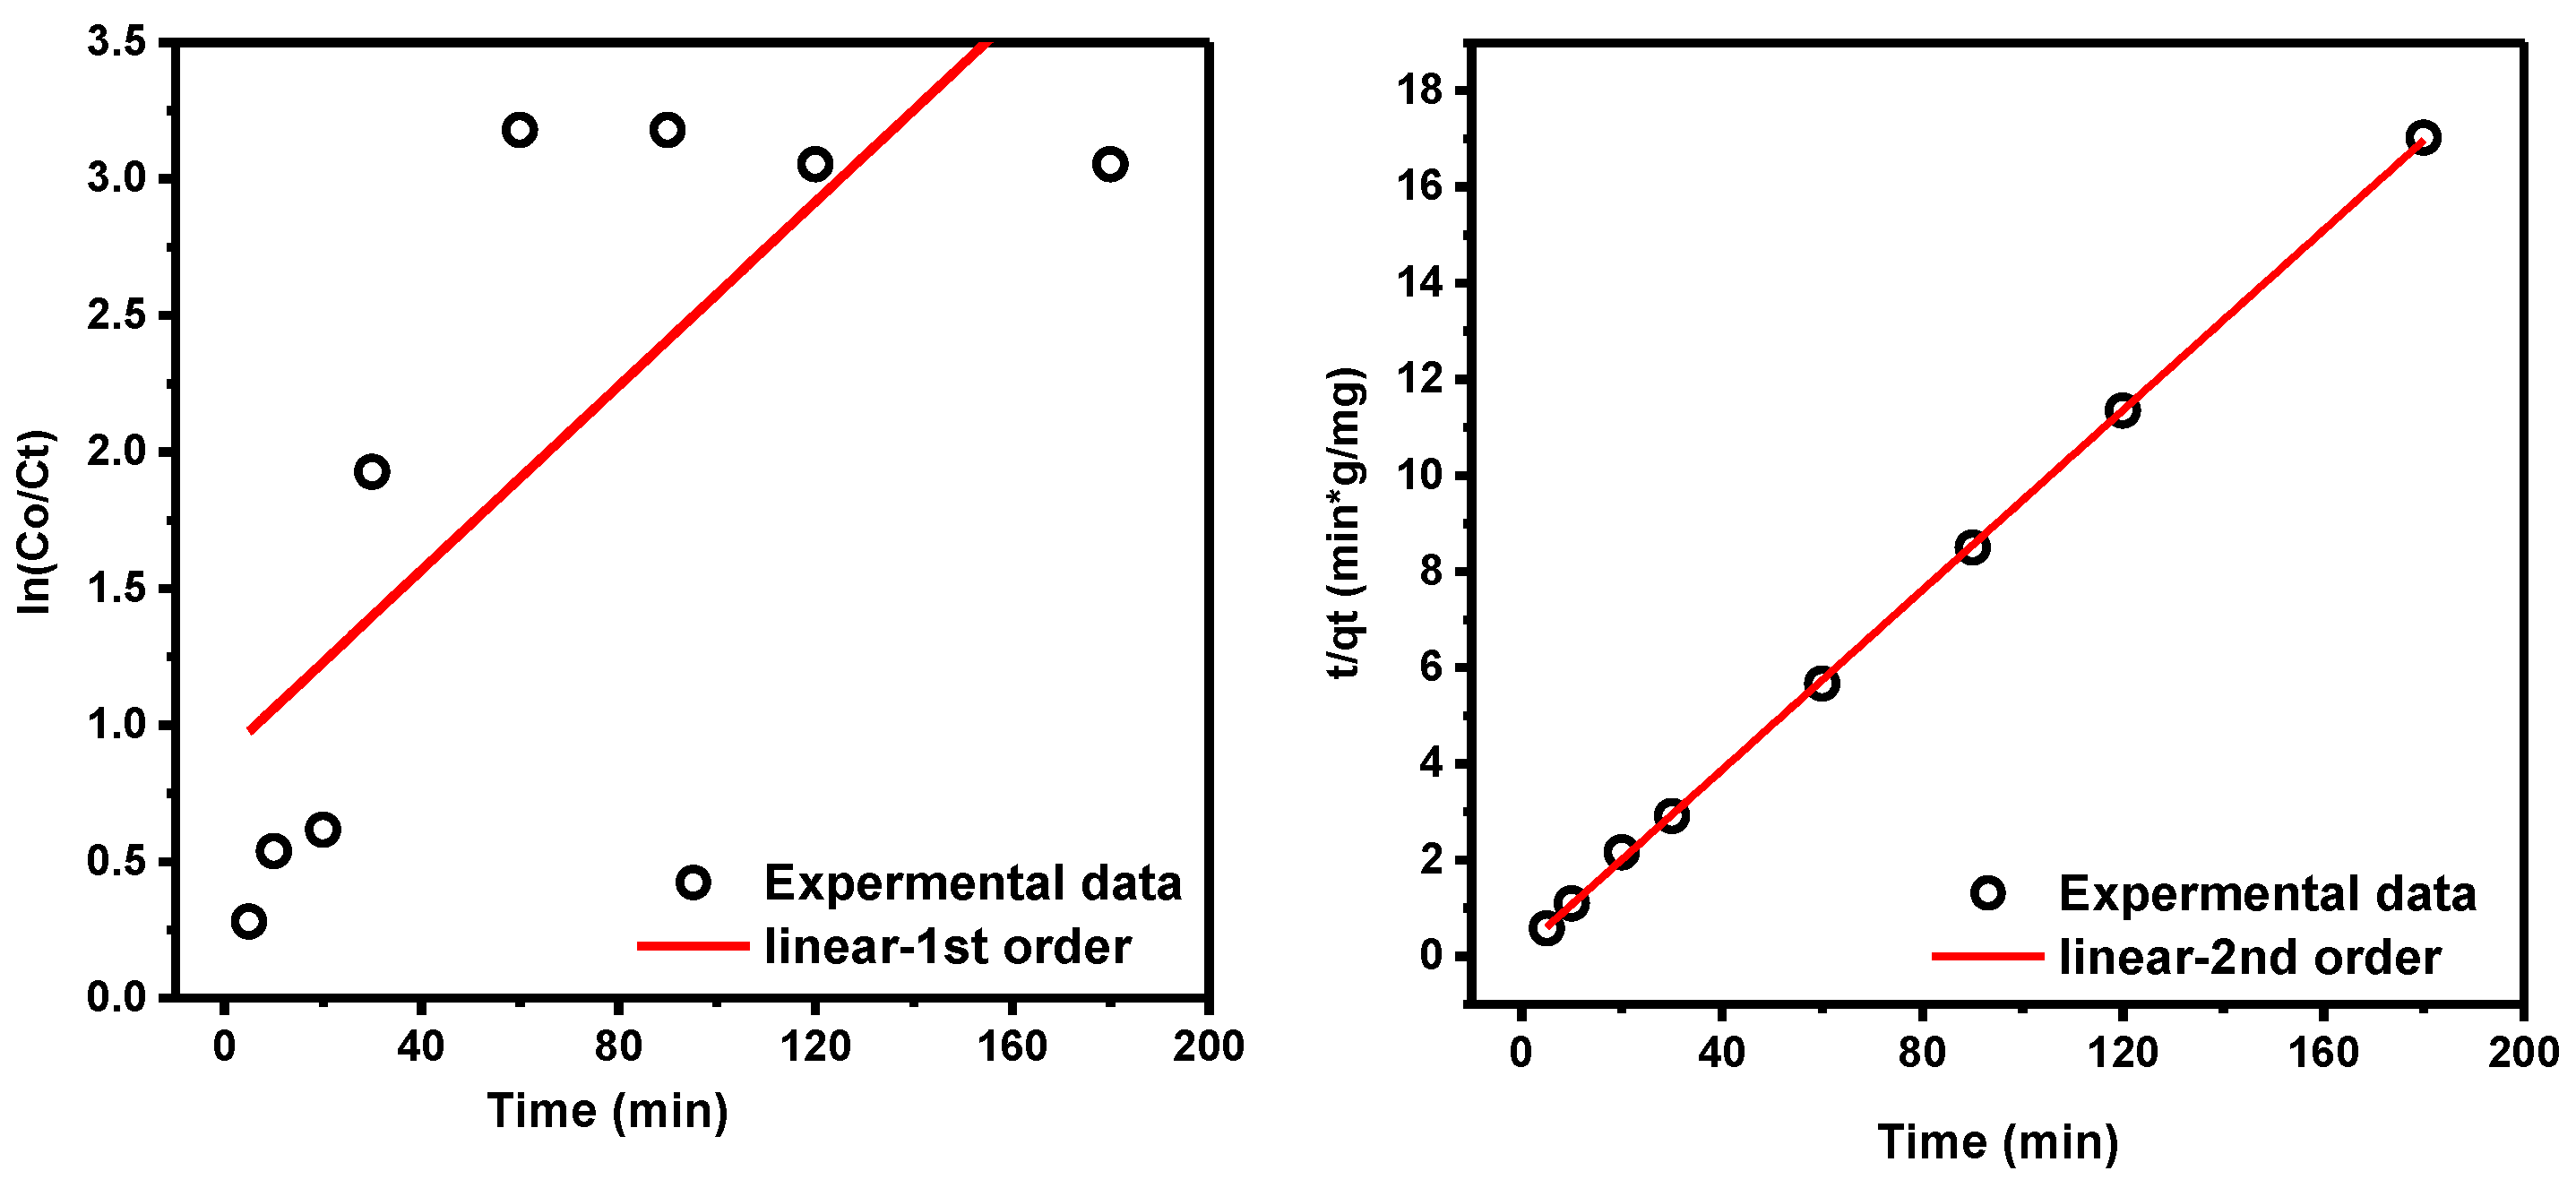
3.3. Adsorption Mechanism and Kinetic Models

The results of applying the two linearized pseudo first and second kinetics models were plotted in Figure 11. The results better fit the pseudo-second-order model than the pseudo-first-order one. The correlation coefficients (R2) of the pseudo-first-order model (R2 = 0.7954) and pseudo-second model (R2 = 0.9999) confirm the suitability of kinetic data with the pseudo-second-order model, in agreement with many of the previous reports in the adsorption of water pollutants [54].
Moreover, all experimental parameters were calculated and listed in Table 3. The presented values exhibited good matching between the practical value (qe = 10.589 mg/g) with the theoretical value (qe = 10.767 mg/g). These values of maximum adsorption capacity correspond to the pseudo second order model, unlike its computed value of pseudo-first-order one (qe = 1.349 mg/g) [55].
The graph plotted by qt against lnt in the Elovich model in Figure 12 (left panel). lnt in the Elovich model gave an index in terms of adsorption nature on the heterogeneous biosorbent surface, whereas the value of R2 was low (0.895), indicating the property of the physisorption mechanism.
On the other hand, the intra-partial diffusion model showed clear fitting with the experimental results of pseudo-second-order kinetics in Figure 12. The experimental data displayed two steps of the adsorption operation. The first was speed, followed by a slow step indicating that the adsorption is more than one step.

3.4. Adsorption Isotherms

The adsorption mechanism at the equilibrium of the organic dye was determined by combining 100 mg of dye with 50 mL of various concentrations of 1 × 10⁻⁴ to5 × 10−7 M for 60 min on the digital shaker. The produced data were incorporated into the following four models: Langmuir, Freundlich, Dubinin–Raduskevich, and Temkin, as shown in Figure 13 and listed in Table S1.
Based on the comped results in Table S1, the RL = 0.790, which is between RL = 0 and RL = 1, meaning monolayer adsorption with uniform energetically of unlimited active sites onto the adsorbent surface. Moreover, the coefficient of correlation was equivalent to (0.992), the experimental outcome of maximum capacity for monolayer coverage was 6.69 mg/g, and the constant of Langmuir isotherm (adsorption energy) was (0.565 L/mg) to prove that adsorption isotherm was fitting to Langmuir model.
According to experimental data of applying the Freundlich isotherm model in Figure 13b, Table 4, the correlation coefficient value (0.929) indicated the unfavorable adsorption with this linear model, while the value of adsorption strength (1/n = 0.619) refers to the normal adsorption. From (n) value, the nature of the adsorption process can be determined. The value obtained was higher than 1 and lower than 10 (1.616), proving that adsorption is the favorite operation.
Furthermore, either one of the most isotherm models applied to determine the adsorption mechanism by the value of free energy per adsorbed molecule, physio- or chemisorption, is the Dubinin–Radushkevich model. From plotting the (logqe) Vs ε 2 in Figure 13c, Table 4, the energy required to remove a molecule from solution to infinity was 0.335 KJ/mol lower than 8 KJ/mol with R2 = 0.694, which means that the mechanism of adsorption follows physiosorption mechanism. Additionally, the theoretical adsorption capacity (qs = 162.963 mg/g) was computed.
From plotting the Temkin isotherm in Figure 13d, the estimated results were AT = 8.851 L/g, while the heat of adsorption was B = 0.236 Kcal/mol, indicating the physical adsorption process with correlation coefficient R2 = 0.994, which is higher than the correlation coefficient of Dubinin–Radushkevich model.
In conclusion, of all reports of the various factors the four models determine, the value of RL was 0 < RL < 1, and the n was 1 < n < 10, meaning the nature of adsorption is favorable. Comparing the R2 of Freundlich and Langmuir isotherm suggests the adsorption is a monolayer. The highest monolayer capacity for organic dye uptake onto PPFP adsorbent was determined to be 162.963 mg/g, with a higher percentage of adsorbed organic dye molecules recorded during rapid adsorption at 1 × 10⁻⁵ M. The adsorption energy (E) acquired from the Dubinin–Radushkevich (D-R) isotherm was 0.335 kJ/mol, indicating that the organic dye was absorbed onto PPFP via physisorption. The highest monolayer adsorption capacity (qmax) obtained for dye uptake onto PPFP was compared to qmax for other adsorbents cited in the literature. PPFP appears to perform better than other adsorbents previously reported.

3.5. The Thermodynamics of Adsorption

The results of thermodynamic parameters, which are determined to adsorb organic dye onto PPFP adsorbent, are listed in Table 5. Enthalpy (ΔH°) for the adsorbate–adsorbent system was negative, suggesting that the adsorption process was exothermic. ΔS° was also negative, indicating that the random nature at the solid–liquid interface reduced during operation adsorption. The decreasing randomness is due to the association between adsorbent and adsorbate. Likewise, the process of adsorption is accompanied by a negative value of the system’s free energy (ΔG°) as it becomes a spontaneous process. However, ΔG° has been increased with rising temperature as an indication of decreasing spontaneity and increasing temperature as further evidence of physical adsorption. On the other hand, the enthalpy value was usually less than 40 KJ/mol, which confirmed the physical nature of adsorption.

Adsorption Performance over Prickly Pear Fruits Peels and Other Bioadsorbents: Literature Comparison

Adsorption tests revealed that the peels of prickly pear fruits effectively eliminated dye and heavy metals from dye solutions. However, the essence of each adsorbent differs and every adsorbent has advantages and disadvantages. Data in which the adsorbent dose, pH, and highest adsorption efficiency are all taken into account were compared. The results were acquired under the most favorable experimental conditions for each work. The adsorbents listed in Table 6 were chemically activated with acids before being physically activated with high temperatures, increasing the cost of the adsorbent.
It is significant to observe that, among the mentioned adsorbent materials, untreated prickly pear fruits peels had the third-highest sorption efficiency; moreover, the first one (activated carbon) is a material with more complex preparation methodologies; thus, greater costs are involved when compared to an acid treatment process. As a result, prickly pear fruit peels may be counted as a cost-effective adsorbent because of their simple fabrication procedure and an efficient environmental prototype for removing dye and other contaminants from wastewater.

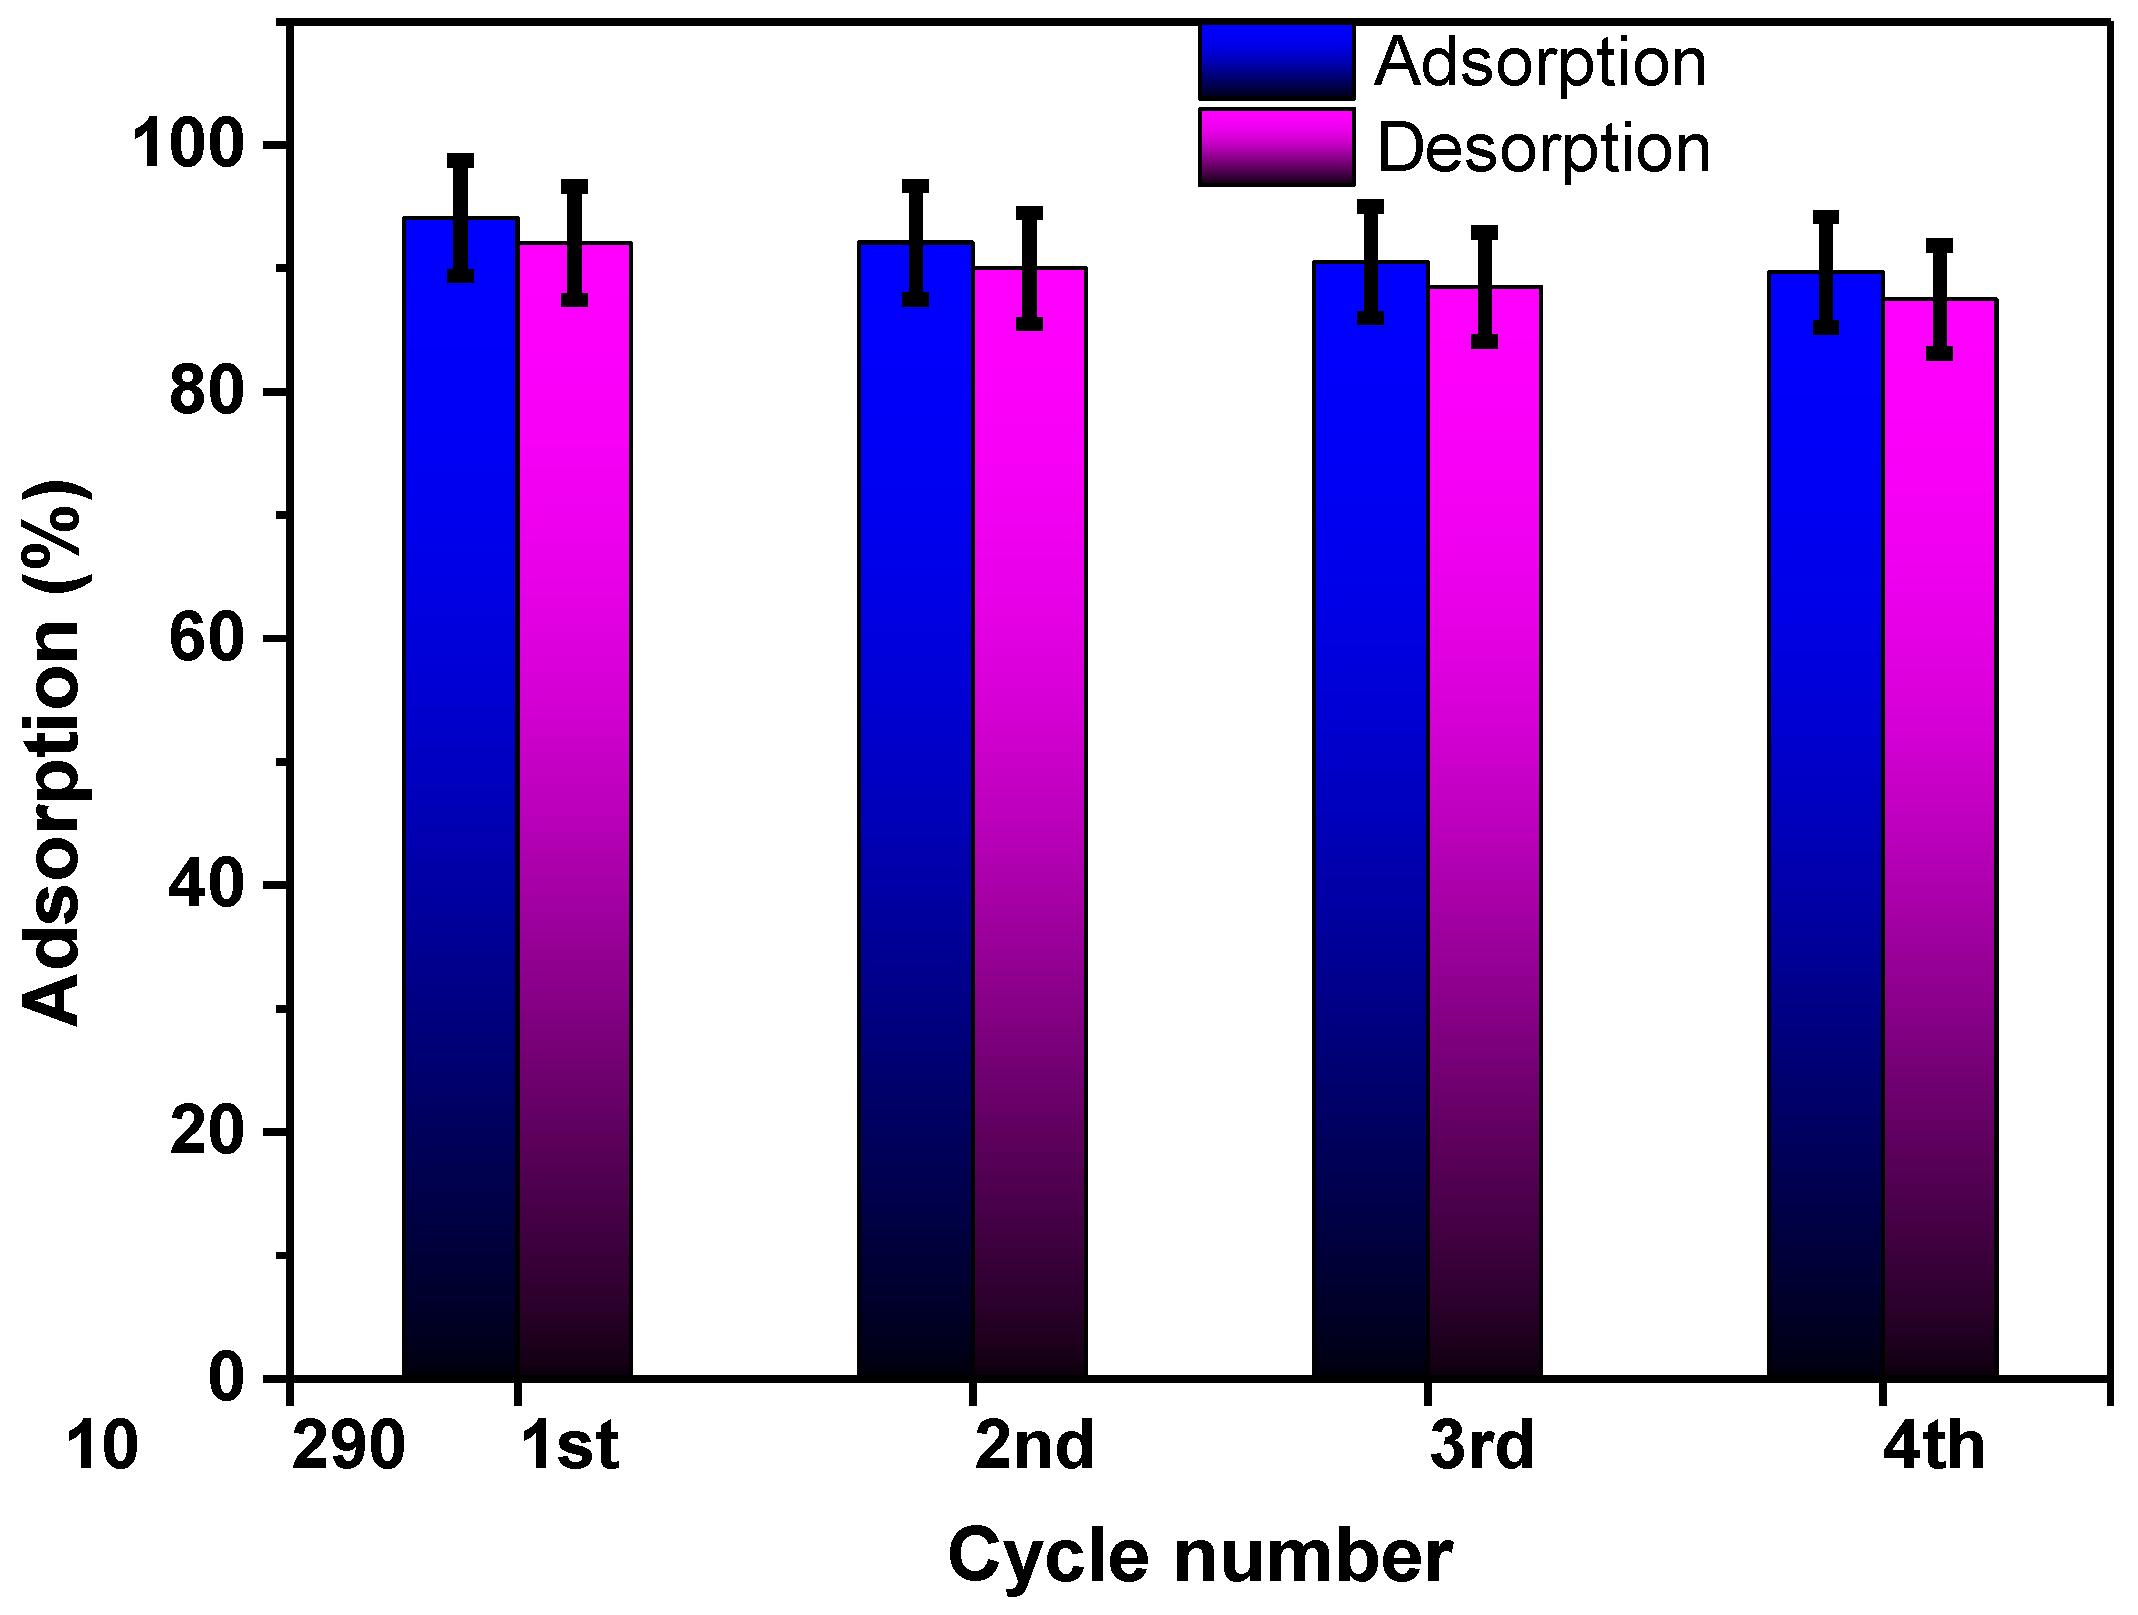
3.6. Regeneration Studies

Making an adsorption process affordable and cost-effective, the adsorbent must have important properties such as the highest adsorption ability and the efficiency to regenerate and reuse various times during the adsorption process. Adsorbents with this capability are considered cost-effective and practical at the pilot scale. As a result, the utilized adsorbent was regenerated with a NaOH solution (0.1 M) and deionized water. After four cycles, the percent removal of a PPP decreased from 94.05% to 89.7%, as shown in Figure 14. There is no considerable reduction in the adsorption execution of prickly pear peel with increasing regeneration cycles because of retrieving available active sites after the renewal process. These results show that prickly pear peel could sustainably remove dye-containing wastewater.

4. Conclusions

This study investigated the utilization of prickly pear peel as an economically feasible low-cost bioadsorbent. The results show that PPFP has a prospective adsorbent for dye elimination from aqueous emulsions because of its comparatively large surface area and many micro-pores. The effectiveness of PTZIDM’s adsorption decreases with rising solution temperature and adsorbent dose while falling with rising starting dye absorption. The quantity of dye adsorbed showed an increase with rising contact duration for all starting dye dilutions. The adsorption processes of PTZIDM also achieved equilibrium in 60 min. Acidic media was preferred for PTZIDM adsorption, with a pH of 3 being ideal. In kinetic investigations, it was discovered that the pseudo-second-order kinetic model offered reasonable suitability for the entire PTZIDM procedure of adsorption. Adsorption kinetics are often governed by several processes, with diffusion methods and tools, with intra-particle diffusion and film diffusion being the most restricting. Moreover, the Langmuir isotherm model flawlessly suits all symmetry data reported at various temperatures. The dye adsorption process is spontaneous and exothermic, and unpredictability increases near the solid or solution interface, according to negative thermodynamic parameters. The findings demonstrated that PPP is a potent and cost-effective agro-waste for eradicating PTZIDM from aqueous solutions.

Supplementary Materials

The following supporting information can be downloaded at: https://www.mdpi.com/article/10.3390/su15064700/s1, Table S1: Linearized form of the different kinetic and isotherm models for initial parameters estimation procedure.

Author Contributions

Conceptualization, F.A.M.A.-Z., B.M.A.-S., and R.M.E.-S.; methodology, F.A.M.A.-Z., B.M.A.-S., and R.M.E.-S.; software, R.M.E.-S.; validation, F.A.M.A.-Z., B.M.A.-S., and R.M.E.-S. formal analysis, F.A.M.A.-Z., B.M.A.-S., and R.M.E.-S.; investigation, F.A.M.A.-Z., B.M.A.-S., and R.M.E.-S.; resources, F.A.M.A.-Z., B.M.A.-S., and R.M.E.-S.; data curation, F.A.M.A.-Z., B.M.A.-S., and R.M.E.-S.; writing—original draft preparation, F.A.M.A.-Z. and B.M.A.-S.; writing—review and editing, F.A.M.A.-Z. and B.M.A.-S.; supervision, F.A.M.A.-Z. and B.M.A.-S.; project administration, B.M.A.-S. All authors have read and agreed to the published version of the manuscript.

Funding

This work was funded through Small Groups Project under grant number RGP.1/21/43.

Institutional Review Board Statement

Not applicable.

Informed Consent Statement

Not applicable.

Data Availability Statement

Not applicable.

Acknowledgments

The authors extend their appreciation to the Deanship of Scientific Research at King Khalid University Saudi Arabia for funding this work through Small Groups Project under grant number RGP.1/21/43.

Conflicts of Interest

The authors declare no conflict of interest.

References

  1. Al-Zahrani, F.A.; El-Shishtawy, R.M.; Ahmed, N.S.; Awwad, N.S.; Hamdy, M.S.; Asiri, A.M. Photocatalytic decolourization of a new water-insoluble organic dye based on phenothiazine by ZnO and TiO2 nanoparticles. Arab. J. Chem. 2020, 13, 3633–3638. [Google Scholar] [CrossRef]
  2. de Farias Silva, C.E.; da Silva Gonçalves, A.H.; de Souza Abud, A.K. Treatment of textile industry effluents using orange waste: A proposal to reduce color and chemical oxygen demand. Water Sci. Technol. 2016, 74, 994–1004. [Google Scholar] [CrossRef] [PubMed]
  3. Al Angari, Y.M.; Ewais, H.A.; El-Shishtawy, R.M. Kinetics and mechanism of the oxidative decolorization of direct violet 31 in the presence of peroxodisulfate-silver (I) as a redox system. Transit. Met. Chem. 2019, 44, 57–64. [Google Scholar] [CrossRef]
  4. El-Zahhar, A.A.; Awwad, N.S. Removal of malachite green dye from aqueous solutions using organically modified hydroxyapatite. J. Environ. Chem. Eng. 2016, 4, 633–638. [Google Scholar] [CrossRef]
  5. Ali, R.M.; Hamad, H.A.; Hussein, M.M.; Malash, G.F. Potential of using green adsorbent of heavy metal removal from aqueous solutions: Adsorption kinetics, isotherm, thermodynamic, mechanism and economic analysis. Ecol. Eng. 2016, 91, 317–332. [Google Scholar] [CrossRef]
  6. Abd Elhafez, S.; Hamad, H.; Zaatout, A.; Malash, G. Management of agricultural waste for removal of heavy metals from aqueous solution: Adsorption behaviors, adsorption mechanisms, environmental protection, and techno-economic analysis. Environ. Sci. Pollut. Res. 2017, 24, 1397–1415. [Google Scholar] [CrossRef]
  7. Foroughi-dahr, M.; Abolghasemi, H.; Esmaieli, M.; Nazari, G.; Rasem, B. Experimental study on the adsorptive behavior of Congo red in cationic surfactant-modified tea waste. Process Saf. Environ. Prot. 2015, 95, 226–236. [Google Scholar] [CrossRef]
  8. Aarfane, A.; Salhi, A.; El Krati, M.; Tahiri, S.; Monkade, M.; Lhadi, E.; Bensitel, M. Kinetic and thermodynamic study of the adsorption of Red195 and Methylene blue dyes on fly ash and bottom ash in aqueous medium. J. Mater. Environ. Sci. 2014, 5, 1927–1939. [Google Scholar]
  9. Khan, A.; Afzal, S.; Mustafa, H.; Qumreen, M. Data article for adsorption of chemically activated fuller’s earth and rice husk for removal of dri-marine reactive red dye. Data Brief 2018, 21, 189–200. [Google Scholar] [CrossRef]
  10. Akhtar, M.F.; Ashraf, M.; Javeed, A.; Anjum, A.A.; Sharif, A.; Saleem, A.; Akhtar, B.; Khan, A.M.; Altaf, I. Toxicity appraisal of untreated dyeing industry wastewater based on chemical characterization and short term bioassays. Bull. Environ. Contam. Toxicol. 2016, 96, 502–507. [Google Scholar] [CrossRef]
  11. Kim, H.-L.; Cho, J.-B.; Park, Y.-J.; Cho, I.-H. Treatment and toxicity reduction of textile dyeing wastewater using the electrocoagulation-electroflotation process. J. Environ. Sci. Health Part A 2016, 51, 661–668. [Google Scholar] [CrossRef]
  12. Sarasa, J.; Roche, M.; Ormad, M.; Gimeno, E.; Puig, A.; Ovelleiro, J. Treatment of a wastewater resulting from dyes manufacturing with ozone and chemical coagulation. Water Res. 1998, 32, 2721–2727. [Google Scholar] [CrossRef]
  13. Wu, J.; Xia, A.; Chen, C.; Feng, L.; Su, X.; Wang, X. Adsorption thermodynamics and dynamics of three typical dyes onto bio-adsorbent spent substrate of Pleurotus eryngii. Int. J. Environ. Res. Public Health 2019, 16, 679. [Google Scholar] [CrossRef] [Green Version]
  14. Dos Santos, R.F.; Ramlow, H.; Dolzan, N.; Machado, R.A.F.; de Aguiar, C.R.L.; Marangoni, C. Influence of different textile fibers on characterization of dyeing wastewater and final effluent. Environ. Monit. Assess. 2018, 190, 693. [Google Scholar] [CrossRef]
  15. Islam, M.S.; McPhedran, K.N.; Messele, S.A.; Liu, Y.; El-Din, M.G. Isotherm and kinetic studies on adsorption of oil sands process-affected water organic compounds using granular activated carbon. Chemosphere 2018, 202, 716–725. [Google Scholar] [CrossRef]
  16. Gouda, A.A.; Al Ghannam, S.M. Impregnated multiwalled carbon nanotubes as efficient sorbent for the solid phase extraction of trace amounts of heavy metal ions in food and water samples. Food Chem. 2016, 202, 409–416. [Google Scholar] [CrossRef]
  17. Abbas, A.; Al-Amer, A.M.; Laoui, T.; Al-Marri, M.J.; Nasser, M.S.; Khraisheh, M.; Atieh, M.A. Heavy metal removal from aqueous solution by advanced carbon nanotubes: Critical review of adsorption applications. Sep. Purif. Technol. 2016, 157, 141–161. [Google Scholar]
  18. Khare, P.; Yadav, A.; Ramkumar, J.; Verma, N. Microchannel-embedded metal–carbon–polymer nanocomposite as a novel support for chitosan for efficient removal of hexavalent chromium from water under dynamic conditions. Chem. Eng. J. 2016, 293, 44–54. [Google Scholar] [CrossRef]
  19. Larous, S.; Meniai, A. Removal of copper (II) from aqueous solution by agricultural by-products-sawdust. Energy Procedia 2012, 18, 915–923. [Google Scholar]
  20. Gurrieri, S.; Miceli, L.; Lanza, C.M.; Tomaselli, F.; Bonomo, R.P.; Rizzarelli, E. Chemical characterization of Sicilian prickly pear (Opuntia ficus indica) and perspectives for the storage of its juice. J. Agric. Food Chem. 2000, 48, 5424–5431. [Google Scholar] [CrossRef]
  21. Pérez-Torrero, E.; Garcia-Tovar, S.E.; Luna-Rodriguez, L.E.; RodríguezGarcia, M.E. Chemical Composition of Prickly Pads from (Opuntia ficus-indica (L.) Miller Related to Maturity Stage and Environment. Int. J. Plant Biol. Res. 2017. [Google Scholar]
  22. Kossori, E.; Lamghari, R.; Villaume, C.; El Boustani, E.; Sauvaire, Y.; Méjean, L. Composition of pulp, skin and seeds of prickly pears fruit (Opuntia ficus indica sp.). Plant Foods Hum. Nutr. 1998, 52, 263–270. [Google Scholar] [CrossRef] [PubMed]
  23. El-Beltagi, H.S.; Mohamed, H.I.; Elmelegy, A.A.; Eldesoky, S.E.; Safwat, G. Phytochemical Screening, Antimicrobial, Antiaxidant, Anticancer Activities and Nutritional Values of Cactus (Opuntia ficus indicia) Pulp and Peel; Parlar Scientific Publications: Freising, Germany, 2019. [Google Scholar]
  24. Elkady, W.M.; Bishr, M.M.; Abdel-Aziz, M.M.; Salama, O.M. Identification and isolation of anti-pneumonia bioactive compounds from Opuntia ficus-indica fruit waste peels. Food Funct. 2020, 11, 5275–5283. [Google Scholar] [CrossRef] [PubMed]
  25. Aruwa, C.E.; Amoo, S.; Kudanga, T. Phenolic compound profile and biological activities of Southern African Opuntia ficus-indica fruit pulp and peels. LWT 2019, 111, 337–344. [Google Scholar] [CrossRef]
  26. Kuti, J.O. Antioxidant compounds from four Opuntia cactus pear fruit varieties. Food Chem. 2004, 85, 527–533. [Google Scholar] [CrossRef]
  27. Al-Juhaimi, F.; Özcan, M.M. Determination of some mineral contents of prickly pear (Opuntia ficus-indica L.) seed flours. Environ. Monit. Assess. 2013, 185, 3659–3663. [Google Scholar] [CrossRef]
  28. Belviranlı, B.; Al-Juhaimi, F.; Özcan, M.M.; Ghafoor, K.; Babiker, E.E.; Alsawmahi, O.N. Effect of location on some physico-chemical properties of prickly pear (Opuntia ficus-indica L.) fruit and seeds. J. Food Process. Preserv. 2019, 43, e13896. [Google Scholar] [CrossRef]
  29. Ouhammou, M.; Lahnine, L.; Mghazli, S.; Hidar, N.; Bouchdoug, M.; Jaouad, A.; Mandi, L.; Mahrouz, M. Valorisation of cellulosic waste basic cactus to prepare activated carbon. J. Saudi Soc. Agric. Sci. 2019, 18, 133–140. [Google Scholar] [CrossRef]
  30. Abdelkarim, S.; Mohammed, H.; Nouredine, B. Sorption of methylene blue dye from aqueous solution using an agricultural waste. Trends Green Chem. 2017, 3, 1–7. [Google Scholar] [CrossRef]
  31. Kumar, R.; Barakat, M. Decolourization of hazardous brilliant green from aqueous solution using binary oxidized cactus fruit peel. Chem. Eng. J. 2013, 226, 377–383. [Google Scholar] [CrossRef]
  32. Peláez-Cid, A.; Velázquez-Ugalde, I.; Herrera-González, A.; García-Serrano, J. Textile dyes removal from aqueous solution using Opuntia ficus-indica fruit waste as adsorbent and its characterization. J. Environ. Manag. 2013, 130, 90–97. [Google Scholar] [CrossRef]
  33. El-Shishtawy, R.M.; Al-Zahrani, F.A.; Al-Amshany, Z.M.; Asiri, A.M. Synthesis of a new fluorescent cyanide chemosensor based on phenothiazine derivative. Sens. Actuators B Chem. 2017, 240, 288–296. [Google Scholar] [CrossRef]
  34. Fatimah, A.M.A.-Z. Synthesis, optical properties and DFT-TDDFT computational study of phenothiazine dye: Donor-acceptor molecules. Pigment. Resin Technol. 2022. ahead-of-print. [Google Scholar]
  35. Seghier, A.; Hadjel, M.; Benderdouche, N. Adsorption study of heavy metal and acid dye on an amphoteric biomaterial using barbary fig skin. Arab. J. Sci. Eng. 2017, 42, 1487–1496. [Google Scholar] [CrossRef]
  36. Fukui, K.; Arimitsu, N.; Kidoguchi, S.; Yamamoto, T.; Yoshida, H. Synthesis of calcium phosphate hydrogel from waste incineration fly ash and bone powder. J. Hazard. Mater. 2009, 163, 391–395. [Google Scholar] [CrossRef]
  37. Ho, Y.-S.; McKay, G. Pseudo-second order model for sorption processes. Process Biochem. 1999, 34, 451–465. [Google Scholar] [CrossRef]
  38. Guerrero-Coronilla, I.; Morales-Barrera, L.; Cristiani-Urbina, E. Kinetic, isotherm and thermodynamic studies of amaranth dye biosorption from aqueous solution onto water hyacinth leaves. J. Environ. Manag. 2015, 152, 99–108. [Google Scholar] [CrossRef]
  39. Weber, W.J., Jr.; Morris, J.C. Kinetics of adsorption on carbon from solution. J. Sanit. Eng. Div. 1963, 89, 31–59. [Google Scholar] [CrossRef]
  40. Langmuir, I. The constitution and fundamental properties of solids and liquids. Part I. Solids. J. Am. Chem. Soc. 1916, 38, 2221–2295. [Google Scholar] [CrossRef] [Green Version]
  41. Sheindorf, C.; Rebhun, M.; Sheintuch, M. A Freundlich-type multicomponent isotherm. J. Colloid Interface Sci. 1981, 79, 136–142. [Google Scholar] [CrossRef]
  42. Dubinin, M. (Ed.) The equation of the characteristic curve of activated charcoal. Dokl. Akad. Nauk. SSSR 1947, 55, 327–329. [Google Scholar]
  43. Temkin, M. Kinetics of ammonia synthesis on promoted iron catalysts. Acta Physiochim. URSS 1940, 12, 327–356. [Google Scholar]
  44. Langmuir, I. The adsorption of gases on plane surfaces of glass, mica and platinum. J. Am. Chem. Soc. 1918, 40, 1361–1403. [Google Scholar] [CrossRef] [Green Version]
  45. El-Shishtawy, R.M.; Asiri, A.M.; Ahmed, N.S.E. Removal of toxic dyestuffs from aqueous solution by amphoteric bioadsorbent. Curr. Anal. Chem. 2021, 17, 957–974. [Google Scholar] [CrossRef]
  46. Hashem, A.; El-Shishtawy, R.M. Preparation and characterization of cationized cellulose for the removal of anionic dyes. Adsorpt. Sci. Technol. 2001, 19, 197–210. [Google Scholar] [CrossRef]
  47. Otálora, M.C.; Wilches-Torres, A.; Lara, C.R.; Cifuentes, G.R.; Gómez Castaño, J.A. Use of Opuntia Ficus-Indica Fruit Peel as a Novel Source of Mucilage with Coagulant Physicochemical/Molecular Characteristics. Polymers 2022, 14, 3832. [Google Scholar] [CrossRef]
  48. González-Hourcade, M.; dos Reis, G.S.; Grimm, A.; Lima, E.C.; Larsson, S.H.; Gentili, F.G. Microalgae biomass as a sustainable precursor to produce nitrogen-doped biochar for efficient removal of emerging pollutants from aqueous media. J. Clean. Prod. 2022, 348, 131280. [Google Scholar] [CrossRef]
  49. Birniwa, A.H.; Abubakar, A.S.; Mahmud, H.N.M.E.; Kutty, S.R.M.; Jagaba, A.H.; Abdullahi, S.S.; Zango, Z.U. Application of agricultural wastes for cationic dyes removal from wastewater. In Textile Wastewater Treatment; Springer: Berlin/Heidelberg, Germany, 2022; pp. 239–274. [Google Scholar]
  50. Moharm, A.E.; El Naeem, G.A.; Soliman, H.M.; Abd-Elhamid, A.I.; El-Bardan, A.A.; Kassem, T.S.; Nayl, A.A.; Bräse, S. Fabrication and characterization of effective biochar bioadsorbent derived from agricultural waste to remove cationic dyes from wastewater. Polymers 2022, 14, 2587. [Google Scholar] [CrossRef]
  51. Khomri, M.; El Messaoudi, M.; El Dbik, A. Organic Dyes adsorption on the almond shell (prunus dulcis) as agricultural solid waste from aqueous solution in single and binary mixture systems. Biointerface Res. Appl. Chem. 2022, 12, 2022–2040. [Google Scholar]
  52. Pan, W.; Xie, H.; Zhou, Y.; Wu, Q.; Zhou, J.; Guo, X. Simultaneous adsorption removal of organic and inorganic phosphorus from discharged circulating cooling water on biochar derived from agricultural waste. J. Clean. Prod. 2022, 383, 135496. [Google Scholar] [CrossRef]
  53. Kuete, I.-H.T.; Tchuifon, R.D.; Bopda, A.; Ngakou, C.S.; Nche, G.N.-A.; Anagho, S.G. Adsorption of Indigo Carmine onto Chemically Activated Carbons Derived from the Cameroonian Agricultural Waste Garcinia cola Nut Shells and Desorption Studies. J. Chem. 2022, 2022, 1236621. [Google Scholar]
  54. Guy, M.; Mathieu, M.; Anastopoulos, I.P.; Martínez, M.G.; Rousseau, F.; Dotto, G.L.; de Oliveira, H.P.; Lima, E.C.; Thyrel, M.; Larsson, S.H.; et al. Process parameters optimization, characterization, and application of KOH-activated Norway spruce bark graphitic biochars for efficient azo dye adsorption. Molecules 2022, 27, 456. [Google Scholar] [CrossRef]
  55. dos Reis, G.S.; Guy, M.; Mathieu, M.; Jebrane, M.; Lima, E.C.; Thyrel, M.; Dotto, G.L.; Larsson, S.H. A comparative study of chemical treatment by MgCl2, ZnSO4, ZnCl2, and KOH on physicochemical properties and acetaminophen adsorption performance of biobased porous materials from tree bark residues. Colloids Surf. A Physicochem. Eng. Asp. 2022, 642, 128626. [Google Scholar] [CrossRef]
  56. Peláez-Cid, A.-A.; Herrera-González, A.-M.; Salazar-Villanueva, M.; Bautista-Hernández, A. Elimination of textile dyes using activated carbons prepared from vegetable residues and their characterization. J. Environ. Manag. 2016, 181, 269–278. [Google Scholar] [CrossRef]
  57. El Maguana, Y.; Elhadiri, N.; Bouchdoug, M.; Benchanaa, M.; Jaouad, A. Activated carbon from prickly pear seed cake: Optimization of preparation conditions using experimental design and its application in dye removal. Int. J. Chem. Eng. 2019, 2019, 8621951. [Google Scholar] [CrossRef]
  58. Sakr, F.; Alahiane, S.; Sennaoui, A.; Dinne, M.; Bakas, I.; Assabbane, A. Removal of cationic dye (Methylene Blue) from aqueous solution by adsorption on two type of biomaterial of South Morocco. Mater. Today Proc. 2020, 22, 93–96. [Google Scholar] [CrossRef]
Figure 1. A graphical representation for the preparation of the adsorbent.
Sustainability 15 04700 g001
Scheme 1. Synthetic procedure for PTZIDM dye.
Sustainability 15 04700 sch001
Figure 2. FTIR spectrum of prickly pear fruits peels (PPFP).
Sustainability 15 04700 g002
Figure 3. SEM image of prickly pear fruits peels surface.
Sustainability 15 04700 g003
Figure 4. XRD of prickly pear fruits peels (PPFP).
Sustainability 15 04700 g004
Figure 5. Time-dependent adsorption of the PTZIDM by the prickly pear fruits peels.
Sustainability 15 04700 g005
Figure 6. Effect of initial dye concentration at 25 °C.
Sustainability 15 04700 g006
Figure 7. Effect of adsorbent dose at 25 °C.
Sustainability 15 04700 g007
Figure 8. Temperature-dependent adsorption capacity of the prickly pear fruits peels for PTZIDM at pH 3.
Sustainability 15 04700 g008
Figure 9. The pH-dependent adsorption of PTZIDM by the prickly pear fruit peels.
Sustainability 15 04700 g009
Figure 10. The zeta potential of prickly pear fruits peels in NaCl solution.
Sustainability 15 04700 g010
Figure 11. Kinetics models, pseudo-first-order (left panel), pseudo-second-order (right panel).
Sustainability 15 04700 g011
Figure 12. Linear Elovich model (left panel), intra-particle diffusion model (right panel).
Sustainability 15 04700 g012
Figure 13. Linear-isotherm models of dye adsorption. Langmuir, Freundlich, Dubinin–Radushkevich (D-R), andTemkin isotherm.
Sustainability 15 04700 g013
Figure 14. Stability of prickly pear fruits peels in adsorption of PTZIDM.
Sustainability 15 04700 g014
Table 1. Surface area and particle size of dried prickly pear fruits peels (PPFP).
Pore size (Å)399.608
Surface area (cm2/g)2.54
Table 2. Peak position (2 theta), crystallite size, and particle size D of prickly pear fruits peels.
CodPeak Position (2 Theta)FWHMCrystallite Size D (nm)D nm (Average)Particle Size (A°)
115.12960.81989.77469.926099.2609
221.70788.69370.9304
330.30350.84059.7920
438.38510.572314.6982
536.07890.555415.0410
640.069028.12790.3006
740.06900.446318.9456
Table 3. Kinetics parameters for pseudo-first-order, pseudo-second-order, Elovich kinetic, and intra-particle diffusion models.
ParametersResults
Modelsqe Exp. (mg/g)10.589
Pseudo-first-orderqe (mg/g)1.349
K1 (min−1)0.066
R20.565
Pseudo-second-orderqe (mg/g)10.7665
K2 (g/mg min)0.053
R20.99969
Elovich modelα (mg/g min)1.501
β (g/mg)93,249.651
R20.895
Intra-particle diffusionKdiff (mg/g min)3.577
C (mg/g)29.108
R20.808
Table 4. The isotherm parameters for Langmuir, Freundlich, DB-R, and Temkin models.
Langmuir IsothermFreundlich Isotherm
Qmax (mg/g)KL (L/mg)RLR21/nnk f (mg/g)R2
5.3010.5650.7900.9920.6191.6160.4140.929
Dubinin–Radushkevich IsothermTemkin Isotherm
qs (mg/g)Kad (mol2/kJ2)E (KJ/mol)R2AT (L/m g)bTB (Kcal/mol)R2
162.9634.4640.3350.9648.8512513.0760.2360.994
Table 5. Thermodynamics parameters for the adsorption of PTZIDM by prickly pear fruits peels at various temperatures.
t (°C)T (K)ln kd∆G (KJ)S (KJ)∆H (KJ)
252981.2111−3.001−0.1552−0.1552
353080.6174−1.581
45318−0.01230.033
55328−0.57181.559
75348−1.63714.737
Table 6. Comparison of prickly pear peel adsorption capacity and other parameters obtained from the different materials reported in the literature.
AdsorbentAdsorption Capacity mg g−1/UsesReference
Prickly (peel) bark of cactus fruitQ: 150, dehydrated in direct sun 40 °C, 0.1 g, 60 min[30]
Prickly pear peel (treated with H2SO4)Q: 167 mg/g for Brilliant Green (at pH 3 and 20 °C, contact time: 240 min, V: 10 mL, adsorbent dose: 0.025 g)[31]
Prickly pear peel activated (NaClO 12%, 323 K)Q: 277.8 mg g−1 for Basic blue 9
Q: 204.1 mg g−1 for Basic violet 3
Q: 435.0 mg g−1 for direct orange 26
Q: −100 mg/g for direct green 1
[32]
Prickly pear peel activated (NaOH 25%, 323 K)Q: 384.6 mg g−1 for Basic blue 9
Q: 1000 mg g−1 for Basic violet 3
Q: −7.75 mg g−1 for direct orange 26
Q: −1.12 mg g−1 for direct green 1
[32]
Cactus fruit peelQ: 151 acid red dye (0.1 g of BFS, concentration of 100 mg/L−1, 2 h)[35]
Prickly pear peel (Activated carbon)Q: 294 mg g−1 for Indigo CarmineQ: 909 mg g−1 for Solophenyl Blue
Q: 416 mg g−1 for Methylene Blue
Q: 312 mg g−1 for Crystal Violet
20 °C, contact time
[56]
Prickly pear seed (Activated Carbon)Q: 260 for methelene blue (Adsorbent dose = 0.2 g L−1; C0 = 100 mg L−1; T = 20 °C; Ph = 7)[57]
(Naturel (NC)
Dried Cactus (DC)
Q: 3.44 mg g−1 for Basic blue 9
Q: 14.4 mg g−1 for Basic blue 9
Co = 10 mg/L, Dose = 0.6 g/L for DC; (and) 2 g/L for NC, room temperature, and 60 min
[58]
PTZIDMQ: 162.963This work
Disclaimer/Publisher’s Note: The statements, opinions and data contained in all publications are solely those of the individual author(s) and contributor(s) and not of MDPI and/or the editor(s). MDPI and/or the editor(s) disclaim responsibility for any injury to people or property resulting from any ideas, methods, instructions or products referred to in the content.

