Article

Effects of Formula Fertilizer and Biochar on Cadmium and Plumbum Absorption in Maize (Zea mays L.)

1
Anhui Province Key Laboratory of Farmland Ecological Conservation and Pollution Prevention, College of Resources and Environment, Anhui Agricultural University, Hefei 230036, China
2
Tongling Yi’an District Agricultural Technology Extension Center, Tongling 244100, China
3
CNSIG Anhui Hongsifang Fertilizer Co., Ltd., Hefei 231602, China
*
Author to whom correspondence should be addressed.
Sustainability 2023, 15(6), 4696; https://doi.org/10.3390/su15064696
Submission received: 6 January 2023 / Revised: 1 March 2023 / Accepted: 1 March 2023 / Published: 7 March 2023
(This article belongs to the Special Issue Remediation of Contaminated Soil and Wastewater Treatment)

Abstract

:
Effective, economical and feasible remediation technology of heavy metal pollution in farmland is an important research concentration in the field of farmland soil remediation. In order to investigate the remediation effects of formula fertilizer and biochar on cadmium (Cd)–plumbum (Pb) contaminated farmland, blank (CK), lime (SH), biochar (SWT), formula fertilizer (FL), and biochar + formula fertilizer (FS) were set up in Cd–Pb contaminated farmland. The results demonstrated the following: (1) Compared with CK, SWT and FS increased the yield by 11.21% and 15.00%, respectively, which was significantly higher than other treatments. (2) The concentrations of Cd and Pb in maize kernels under all treatments were lower than the limited value stipulated by GB 2762-2022 in China. Compared with CK, FS reduced the concentration of Cd and Pb in maize kernels by 24.96% and 31.46%, respectively, which were the most significant. All the treatments can reduce the concentrations of Cd and Pb in maize cob and straw and inhibit the transfer of Cd and Pb from the lower part of the maize field to the overground part. (3) FL, SWT, and FS increased soil pH by 0.17, 0.10, and 0.19 units, respectively. FS can reduce the concentrations of available cadmium (DTPA-Cd) and available lead (DTPA-Pb) significantly, which are 31.05% and 38.57% lower than CK, respectively. (4) Each treatment can reduce the extraction state and reducible state of weak acid Cd and Pb in soil, while increasing the proportion of oxidizable state and residual state. FL and FS significantly increased the percentage of residual Cd and Pb by 18.00% and 24.32%, respectively, and 33.33% and 37.76%, respectively. (5) FL (1.747) and FS (1.679) were relatively higher than CK in input/output. In conclusion, the combined application of biochar and formula fertilizer in Cd/Pb polluted farmland can effectively reduce the concentration of Cd and Pb in maize and has high economic benefits and practicability.

1. Introduction

Heavy metal pollution is one of the most harmful problems to farmland soil [1,2]. Unlike organic pollutants, heavy metals are not degradable and can pose a risk to human health, either directly or indirectly through the food chain [3]. In recent years, the cultivated land area of heavy metal pollution in China’s major grain producing areas has shown an increasing trend [4]. As one of the crops widely planted in China and even the world, maize has the characteristics of large biomass, short growth cycle, and strong grain enrichment ability of heavy metals. When the concentration of heavy metals in farmland soil exceeds the standard, it will not only make the content of heavy metals in crops exceed the standard and harm human health; it will also have adverse effects on crop yield [5]. Soil pH is a key factor to control soil nutrient availability, soil microbial activities, and crop growth and development. Related studies have confirmed that lower soil pH will promote the effectiveness of Cd and Pb in soil and increase the absorption of Cd and Pb in crops. Therefore, it is of great practical significance to ensure food safety and improve the soil environment for the soil control and the absorption and accumulation control of maize Cd and Pb.
In recent years, passivation restoration measures are usually taken to reduce the activity of heavy metals in the soil to achieve the purpose of repairing the contaminated farmland during production. Biochar can fix the active heavy metal ions in soil and sediments through adsorption and is widely used for the improvement and remediation of heavy metal-contaminated soil, with the characteristics of wide source, friendly environment, and low cost. The results of field experiments showed that different types of biochar had a good remediation effect on moderate and mild Cd pollution, and the effective Cd content and crop grain Cd content decreased significantly with the increase of biochar application [6,7,8]. ZHANG et al. [9] prepared Phyllostachys bamboo biochar as an adsorbent under the atmosphere of low oxygen pyrolysis, and the adsorption capacity of Pb2+ was 67.4 mg·g−1. Existing studies have shown that the adsorption mechanism of biochar mainly depends on the type of raw materials and pyrolysis temperature of biochar [10,11].
Fertilization is a necessary measure to ensure the normal growth of crops, high yield, and high quality, and can have a great impact on the effectiveness of heavy metals. The application of nitrogen fertilizer can optimize the application ratio of ammonium nitrogen to nitrate nitrogen, improve the pH value of farmland soil, and reduce the effectiveness of heavy metals. It is a reasonable and economical method to reduce the activity of heavy metals to repair the soil contaminated by heavy metals. It mainly changes the existence form of heavy metals in the soil through the adsorption, precipitation, or co-precipitation of heavy metals so as to reduce their biological effectiveness and mobility. However, the economic cost of soil conditioner in the practical application is relatively high, which is not conducive to the large-scale promotion and application of ordinary farmers. The formula fertilizer used in this study is a kind of fertilizer to repair the function of heavy metals in soil. It is mainly composed of large particle urea, granular ammonium phosphate, potassium sulfate and conditioner and other materials. Formula fertilizer can reduce the activity of heavy metals in soil, reduce the absorption of heavy metals in soil, make the heavy metal content of crops reach the limit standard, achieve the effect of safe production, and have certain economic benefits.
The joint use of various technical means is an important development trend in the safe use of contaminated farmland in recent years. At present, the concept of formula fertilizer has not been put forward in the process of heavy metal remediation in farmland soil, and it lacks in-depth research under field experimental conditions. The effects of combining with other conditioners have not been reported. Therefore, in this study, a Cd–Pb compound contaminated farmland in Tongling city, Anhui Province, China, was selected as the experimental field to carry out field restoration experiments of heavy metals in farmland soil under formula fertilizer and biochar. By comparing maize yield, Cd and Pb concentration of plants, soil DTPA-Cd, soil DTPA-Pb and its chemical morphology change, and soil fertility, it is expected to provide theoretical and practical reference for the safe production of contaminated farmland in Tongling city, China, and even the middle and lower reaches of the Yangtze River.

2. Materials and Methods

2.1. Materials for Test

The maize variety tested was Jinyu 1233, suitable for local cultivation.
Soil conditioning materials include the following: formula fertilizer (the main components are large granular urea, granular ammonium phosphate, potassium sulfate and conditioning agents, N-P2O5-K2O: 20-10-15, Cl-: 0.43%, S: 8.84%, jointly developed by Anhui Agricultural University and China Salt Anhui Hong Sifang Fertilizer Co., Ltd.), biochar (mainly bamboo charcoal, provided by Henan Woda Environmental Protection Materials Co., Ltd.), and lime (purchased from local market).
Other fertilizers include nitrogen, phosphorus, and potassium 45% (15-15-15) compound fertilizer, pure nitrogen concentration (N) 46% urea, and pure potassium concentration (K2O) 60% potassium chloride. As shown in Table 1, the heavy metal concentration of soil conditioning materials in this test all met the limit value stipulated in the Agricultural Industry Standard Organic Fertilizer (NYT 525-2021) (Cd ≤ 3 mg·kg−1, Hg ≤ 2 mg·kg−1, As ≤ 15 mg·kg−1, Pb ≤ 50 mg·kg−1, Cr ≤ 150 mg·kg−1).

2.2. Overview of the Test Area

The experimental field is located in a strictly controlled cultivated land in Yi’an District, Tongling City, Anhui Province. The Cd and Pb concentration of maize grains in this area were 0.09–0.85 mg·kg−1 and 0.11–0.63 mg·kg−1, respectively, after the harvest of the previous season. The concentration of heavy metal Cd and Pb in cultivated soil in this experiment field was 2.37 mg·kg−1 and 83.64 mg·kg−1, respectively. DTPA-Cd and DTPA-Pb concentrations in soil were 0.802 mg·kg−1 and 54.28 mg·kg−1, respectively. The basic physical and chemical properties of soil in the test site were as follows: pH 4.79, organic matter 16.38 mg·kg−1, total nitrogen 1.03 g·kg−1, alkali-hydrolyzed nitrogen 75.37 mg·kg−1, available phosphorus 14.21 mg·kg−1, and available potassium 120.1 mg·kg−1.

2.3. Test Design and Sample Treatment

As shown in Table 2, the experimental design of the blocks adopted random distribution of the block group. There were 5 treatments in total, and each treatment block was set with 3 repetitions. There were 15 treatment blocks in total. Each district covers an area of 20 m2. Protection lines were set up between each district to irrigate clean water and cut off pollution sources.
The experiment lasted from 4 June 2021 to 17 September 2021. The method and amount of fertilization were based on local high-yield cultivation techniques. Seven days before seeding, remediation materials were applied to the plot according to the experimental design. Three days before sowing, the base fertilizer was applied at 600 kg·hm−2. The base fertilizer was 45% (15-15-15) nitrogen, phosphorus, and potassium compound fertilizer. Maize seeds were sun-sown before sowing, and on-demand sowing was conducted on 11 June 2021. The seeds were planted in double rows with 9 holes per row and 1 seed per hole. Field weeding was carried out 1 month after sowing, and field drainage and deworming were carried out in time. After weeding again 3 months later, fertilizer was replenished in time (375 kg·hm−2 nitrogen fertilizer) by sprinkling and paying attention to the combination of water and fertilizer. Sampling will be conducted on 17 September 2021 (about 3 months after the growth cycle) to determine the yield of each plot and collect soil samples and maize plant samples from each test plot.

2.4. Sample Treatment

Samples of maize plants were randomly collected, and 3–5 whole maize plant samples with uniform growth were collected from each plot. After collection, samples of maize plants in each plot were cleaned successively with tap water and deionized water, and then the whole plant was divided into roots, stalks, cores, and seeds to form mixed samples. The plants were defoliated at 105 °C for 30 min and dried at 80 °C to constant weight. The dry weight of each part was weighed and crushed by stainless steel mill. Soil samples were collected on the day of maize sample collection, and the corresponding soil samples (0–20 cm) were collected at the point where maize samples were taken with a wooden shovel to form mixed soil samples. After air drying in a cool place, the 10-mesh screen and 100-mesh screen were used for soil sieving, and the ground soils were reserved in ziplock bags.

2.5. Sample Determination

DTPA-Cd and DTPA-Pb in soil were determined by flame method with Z 700P atomic absorption spectrophotometer in Jena, Germany, according to GB/T 23739-2009 [12] in China. The concentration of heavy metals Cd and Pb in each part of the maize was determined by Z 700P atomic absorption spectrophotometer in Jena, Germany, according to GB 5009.268-2016 [13] in China. The different forms of soil Cd and Pb were determined by the improved three-step continuous extraction method of BCR [14]. The sum of the three extraction states plus the concentration of residual state were compared with the total amount of heavy metals in the national standard soil materials. The recovery rate was 94.1–103.9%, and the analysis results were within the allowable error range. Soil pH was extracted with CO2 removed distilled water (soil–water ratio 1:2.5) and determined by a precision pH meter (TARTER 2100). Other indices such as N, P, and K in soil were determined by the method specified in the Soil Agrochemical Analysis. Soil samples (GBW 07461) and plant samples (GBW 10045) were used for quality control, and the analysis results were within the allowable error range.
Indicators were calculated based on the following equations:
  • BCF = plant concentration (mg·kg−1)/soil concentration of this element (mg·kg−1);
  • TF = plant concentration of this element (mg·kg−1)/another plant concentration of this element (mg·kg−1);
  • Total yield (CNY·hm−2) = rice yield (kg·hm−2) × unit price of rice (CNY·kg−1);
  • ROI = total output revenue obtained/total input cost.

2.6. Analysis Methods

Excel 2016 was used for data collation, SPPS 23.0 was used for variance analysis of test data, and Origin 2017 was used for mapping. Data were expressed as mean ± error, and Duncan’s test was used for significant difference (p < 0.05).

3. Results and analysis

3.1. Effects of Different Treatments on Agronomic Traits of Maize

As can be seen from Table 3, under different treatments, the biomass of kernel, core, straw, and root of maize plant ranged from 153.6–176.7, 27.40–29.62, 44.73–46.64, and 5.252–5.666 g·plant−1, respectively. Compared with CK, different treatments increased the biomass of all parts of maize. The biomass of kernel and root was significantly increased (p < 0.05). The yield of maize was between 9.220 and 10.60 t·hm−2. Compared with CK, different treatments could increase the yield of maize by 6.29–15.00%. SWT and FS had significantly higher yield than other treatments (p < 0.05). The plant height, leaf length, and leaf width of maize at maturity were 212.0–231.4, 71.27–87.33, and 8.100–9.300 cm, respectively, and there was no significant difference among all treatments.

3.2. Effects of Different Treatments on Heavy Metal Absorption, Enrichment and Transport in Maize

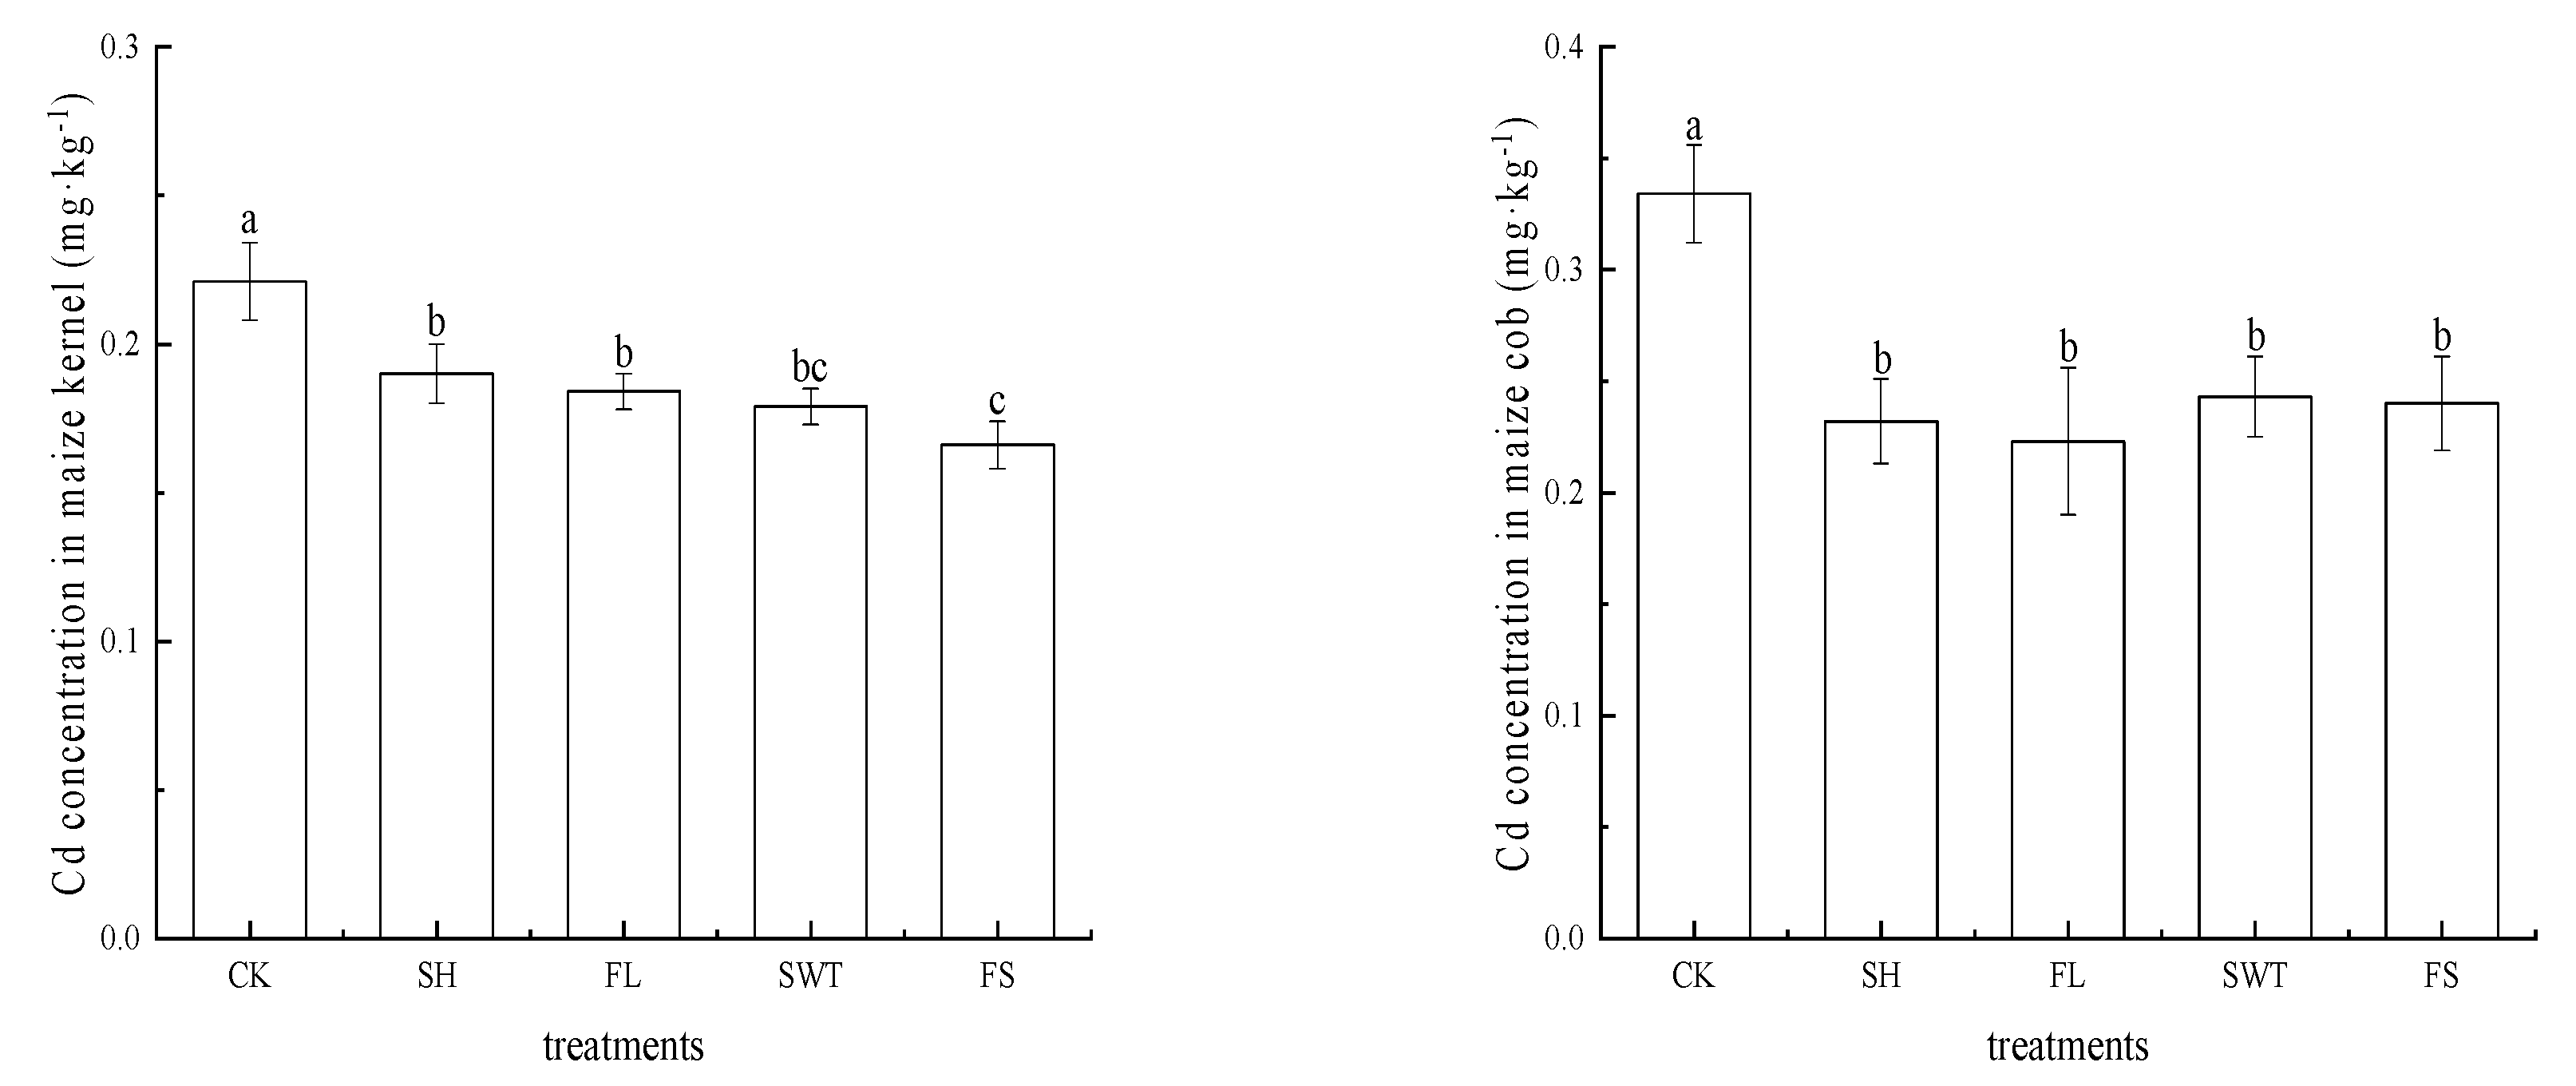
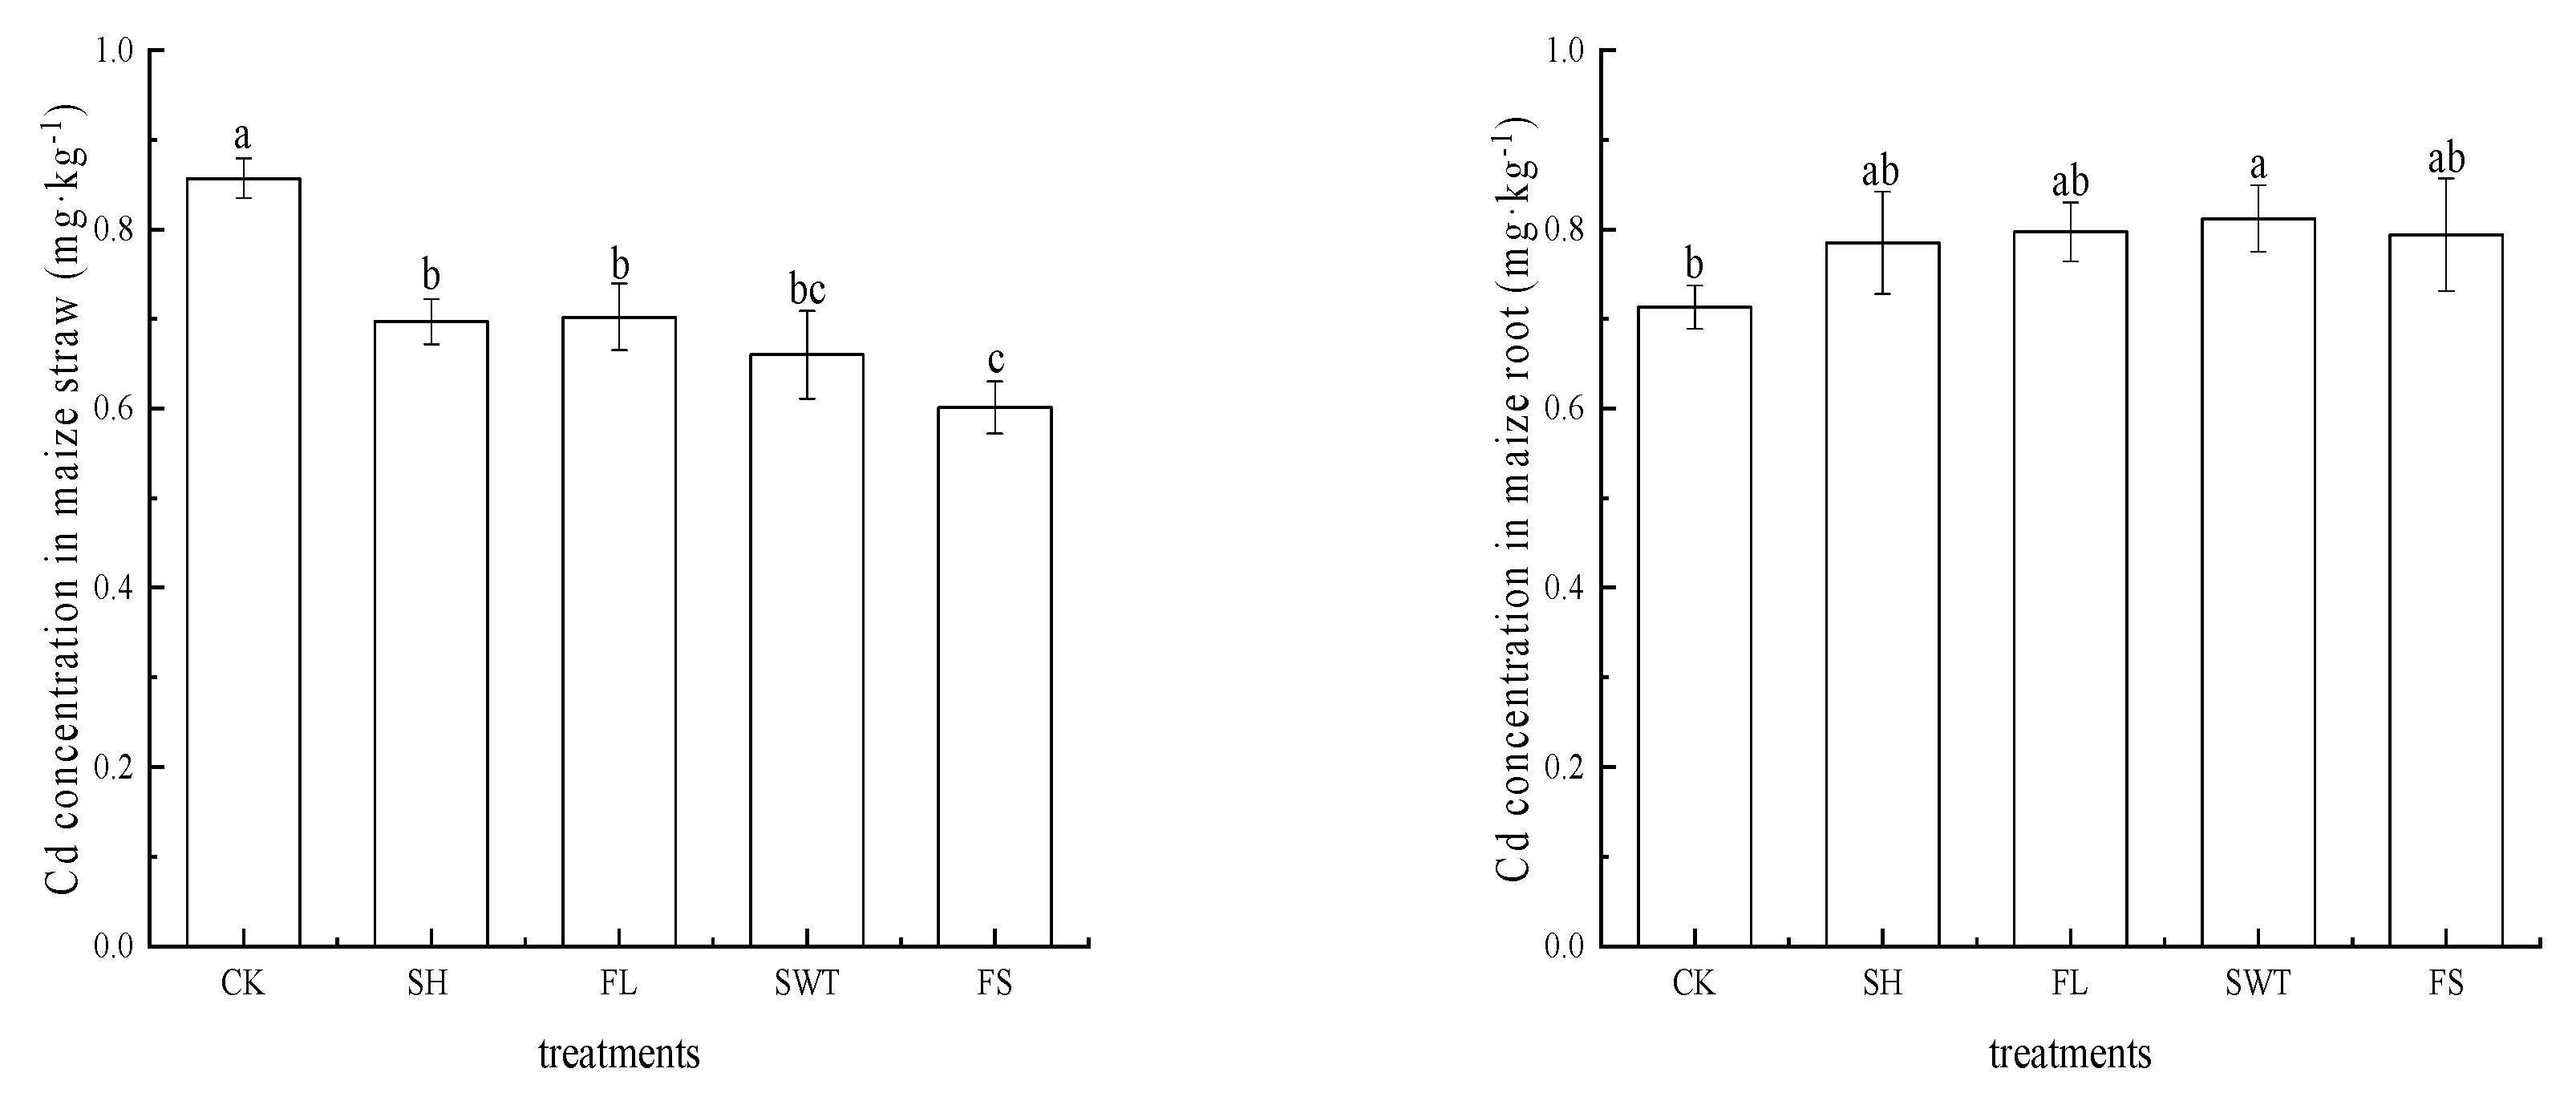
3.2.1. Differences in Heavy Metal Cd Concentration in Different Parts of Maize

As can be seen from Figure 1, Cd concentration of maize kernels under different treatments ranges from 0.166–0.221 mg·kg−1, and all treatments except CK are lower than the limit value stipulated in the GB 2762-2022 [15]. Under FL, SWT, and FS, Cd concentration in maize kernels was 0.184, 0.179, and 0.166 mg·kg−1, respectively. Among them, FS treatment had the most significant effect on reducing Cd content in maize kernels, decreasing 24.96% compared with CK. FL and SWT decreased 16.63% and 18.89% compared with CK, respectively (p < 0.05).
The Cd concentration of maize parts was different under different treatments, and the Cd concentration of maize cob, straw, and root was 0.223–0.334, 0.601–0.857, and 0.713–0.812 mg·kg−1, respectively. Compared with CK, Cd concentrations of maize cob and straw decreased by 33.14% and 18.09% under FL, Cd concentrations of maize cob and straw decreased by 27.16% and 22.95% under SWT, and Cd concentrations of maize cob and straw decreased by 28.05% and 29.84% under FS. The reduction range of FS on maize straw was significantly higher than that of other treatments (p < 0.05), and Cd concentration in maize roots under different treatments was significantly increased compared with CK, with an increase range of 10.10–13.84% (p < 0.05).

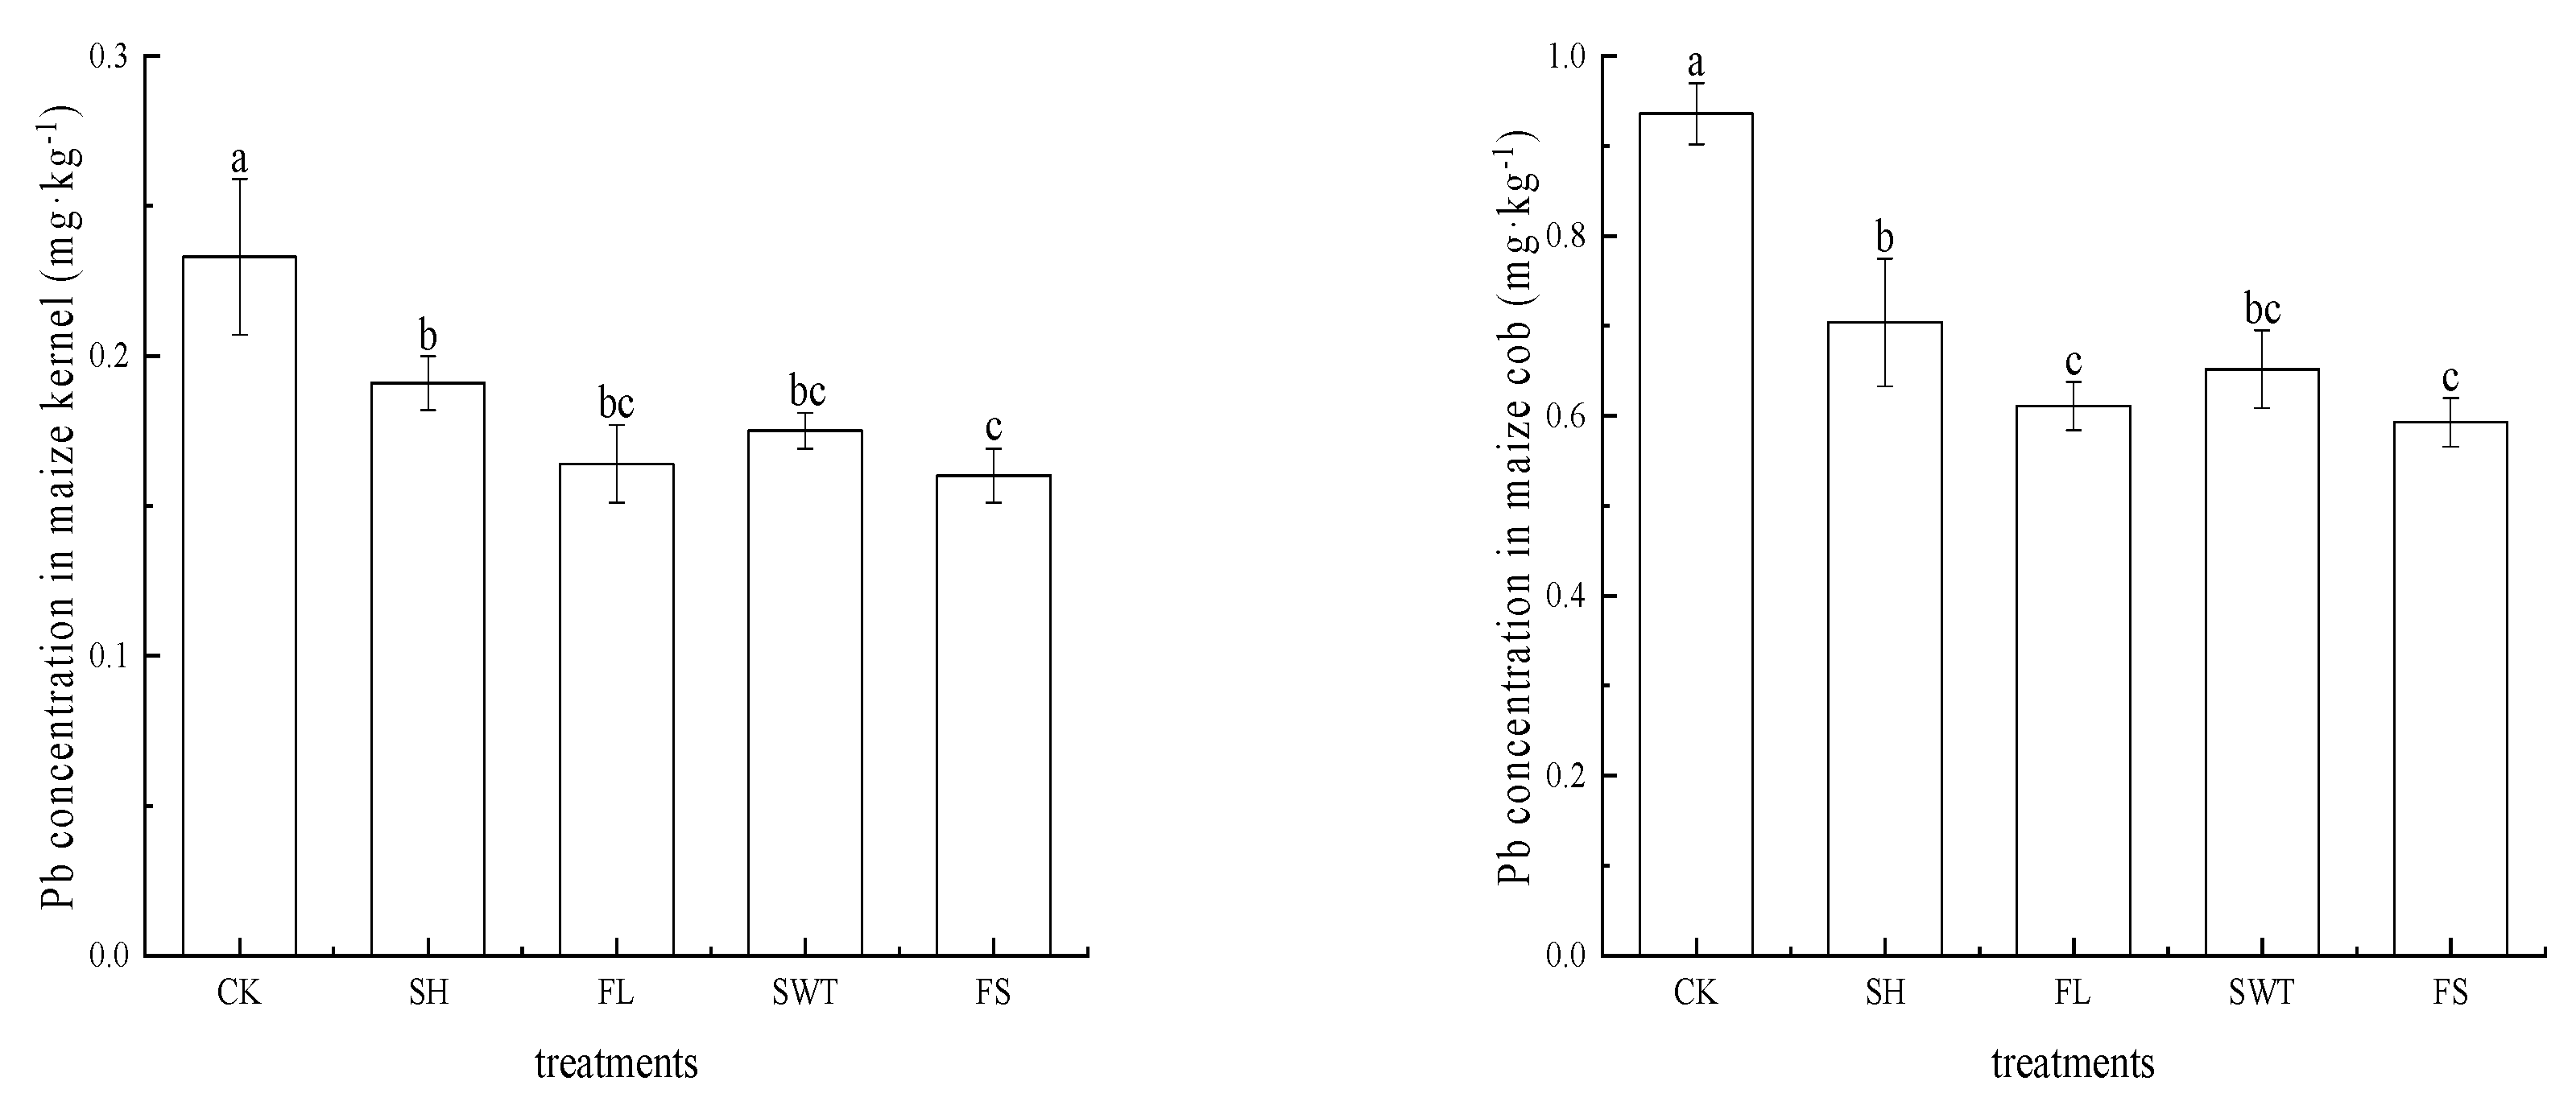
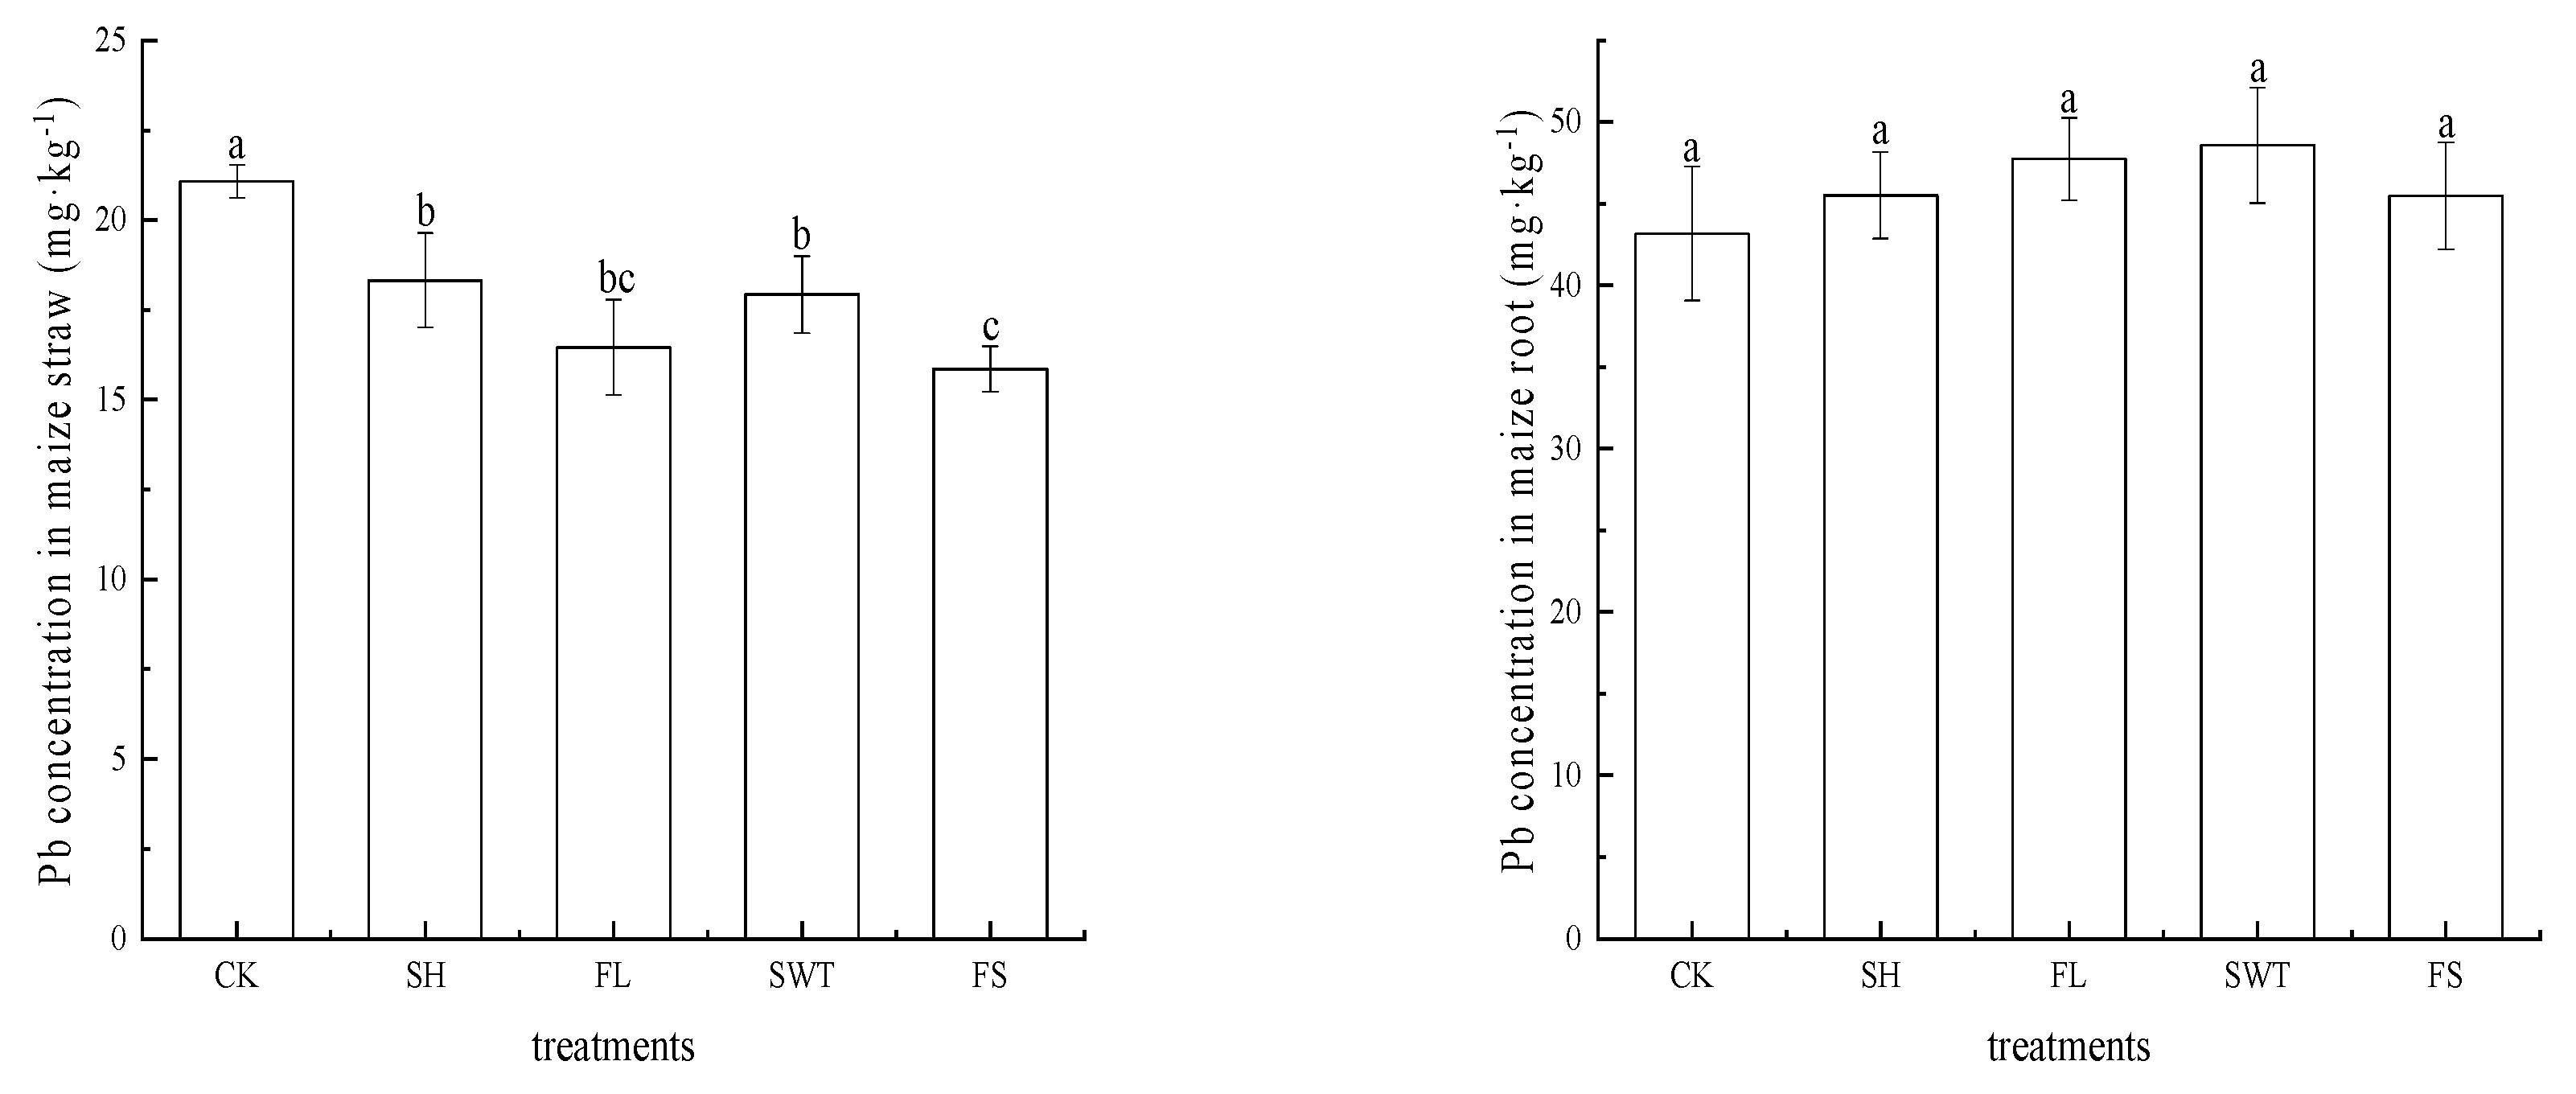
3.2.2. Difference of Heavy Metal Pb Concentration in Different Parts of Maize

As can be seen from Figure 2, the Pb concentration of maize kernels under different treatments ranges from 0.160–0.233 mg·kg−1, and all treatments except CK are lower than the limit value stipulated in the GB 2762-2022 [15]. Under FL, SWT, and FS, Pb concentration in maize kernels was 0.164, 0.175, and 0.160 mg·kg−1, respectively. Among them, FS treatment had the most significant effect on reducing Pb content in maize kernels, decreasing 31.46% compared with CK, and the reduction rate of FL and SWT were 34.73% and 30.32%, respectively (p < 0.05).
The Pb concentrations of maize cob, straw, and root were 0.593–0.936, 15.85–21.07, and 43.15–48.56 mg·kg−1, respectively. Compared with CK, the Pb concentrations of maize cob and straw decreased by 34.73% and 21.94% under FL treatment, 33.32% and 14.95% under SWT, and 36.62% and 24.77% under FS, respectively. The reduction range of FS on maize straw was significantly higher than that of other treatments (p < 0.05), and the increase of Pb concentration in maize root under different treatments was between 10.10% and 13.84% compared with CK, but the difference was not significant (p < 0.05).

3.2.3. Differences of Cd Absorption and Enrichment in Different Parts of Maize

As shown in Table 4, soil Cd concentration under different treatments ranged from 2.269 to 2.354 mg·kg−1, with no significant difference among treatments (p < 0.05). The Cd enrichment coefficients of maize kernel, core, straw, and root ranged from 0.073–0.094, 0.102–0.142, 0.260–0.364 and 0.303–0.350, respectively, and the Cd enrichment coefficients of all parts of maize were less than 1. Compared with CK, the Cd enrichment coefficient of grain was reduced by 11.70–22.34% under different treatments, and the decrease under FS treatment was significantly lower than that of other treatments (p <0.05). The enrichment coefficient of maize cob and straw Cd decreased by 25.14% to 32.39% and 14.91% to 28.71% from CK, respectively. The enrichment coefficient of Cd in maize root increased by 13.53–15.51%, but the difference was not significant (p < 0.05).

3.2.4. Differences of Pb Absorption and Enrichment in Different Parts of Maize

As shown in Table 5, soil Pb concentration under different treatments ranged from 82.92 to 84.69 mg·kg−1, with no significant difference among treatments (p < 0.05). The Pb enrichment coefficients of maize kernel, core, straw, and root were 0.002–0.003, 0.007–0.011, 0.186–0.254, and 0.520–0.579, respectively, and the Pb enrichment coefficients of all parts of maize were less than 1. Compared with CK, there was no significant difference in Pb enrichment coefficient between different treatments (p < 0.05). The enrichment coefficient of maize cob and straw Pb decreased by 24.55–36.36% and 14.79–26.74% compared with CK, respectively, with the most significant decrease in FS treatment (p <0.05). The enrichment coefficient of Cd in maize roots increased by 2.58–11.34% compared with CK, but the difference was not significant (p < 0.05).

3.2.5. Differences of Cd Transport in Different Parts of Maize

As shown in Table 6, under different treatments, the transport coefficient of root-kernel Cd ranged from 0.210–0.310. Compared with CK, all treatments could reduce the transport of Cd concentration in roots to maize kernels by 21.61–32.26%, and FS treatment had the best reduction effect. The transport coefficients of root–straw and straw–core Cd were between 0.755–1.203 and 0.342–0.390, respectively. Compared with CK, the decreases were between 26.34–37.26% and 4.36–12.24%. The transport coefficient of core-kernel Cd was increased by 4.88–25.98% compared with CK, but the difference was not significant (p < 0.05).

3.2.6. Differences of Pb Transport in Different Parts of Maize

As shown in Table 7, the transport coefficient of root-kernel Pb under different treatments ranged from 0.003 to 0.006. Compared with CK, FL treatment could reduce the transport of Pb concentration in roots to maize kernels with a decrease of 29.82–42.11%, and FL treatment had the best reduction effect. The transport coefficients of root–straw and straw–core Pb ranged from 0.346–0.492 and 0.036–0.044, respectively, and decreased by 17.68–29.67% and 13.54–18.06% compared with CK. The transport coefficient of core-kernel Pb was increased by 8.05–10.07% compared with CK, but the difference was not significant (p < 0.05).

3.3. Effects of Different Treatments on the Available State and Chemical Morphology of Cadmium and Plumbum in Soil

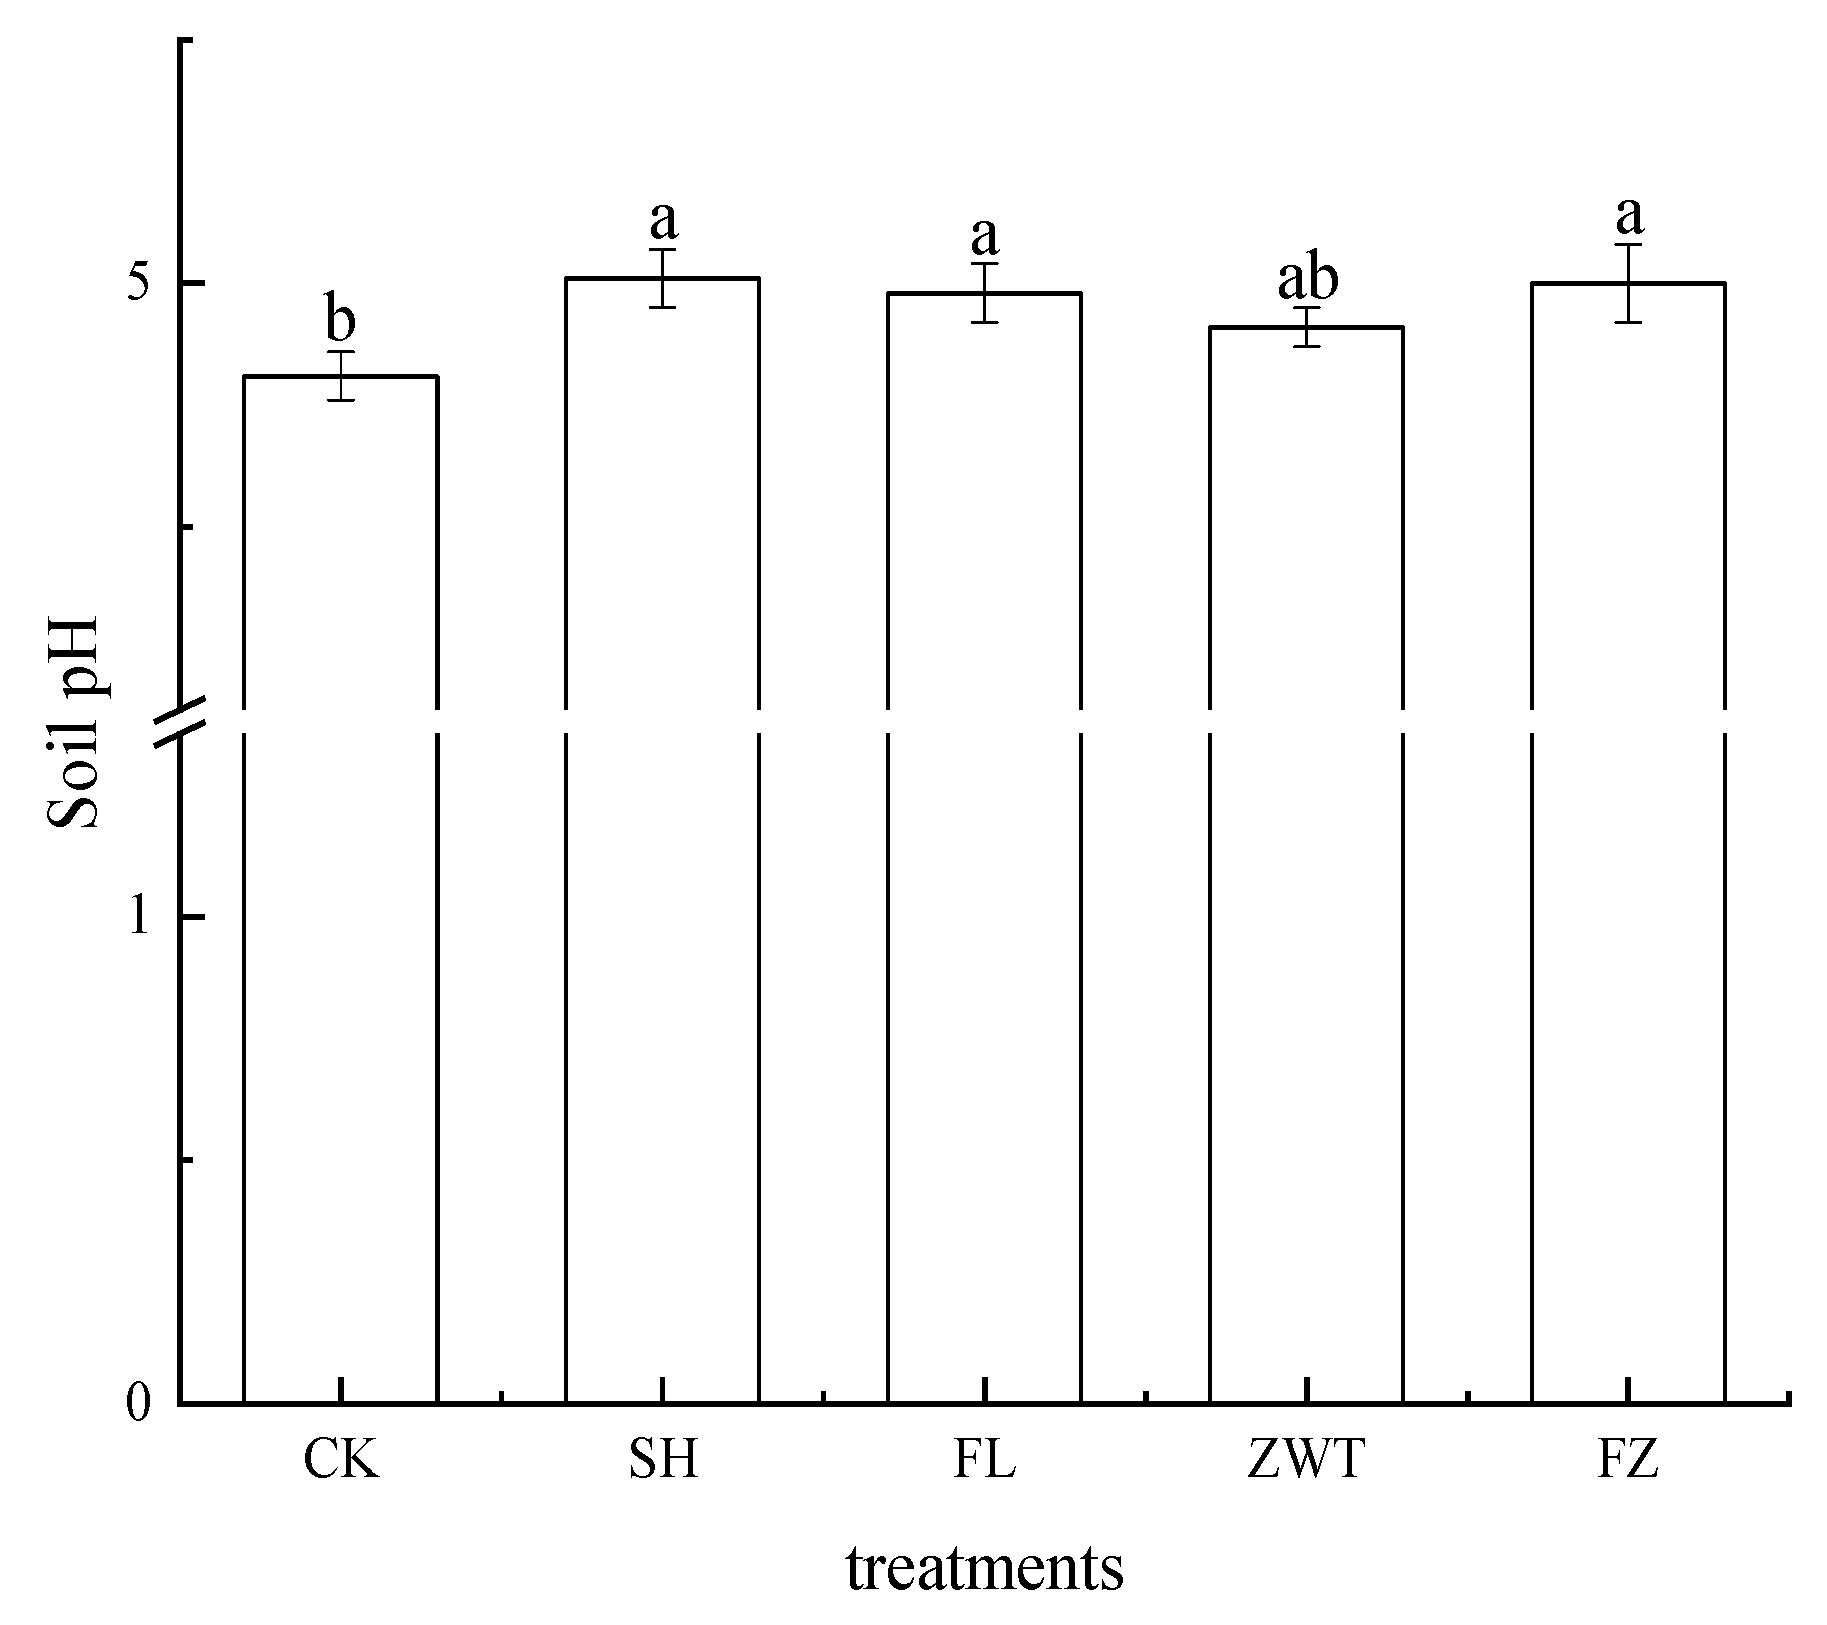
3.3.1. Effects of Different Treatments on Soil pH

According to Figure 3, the soil pH value was between 4.81 and 5.01 under different treatments. Compared with CK, each treatment could significantly improve the soil pH value, and the pH value under FL, SWT, and FS was significantly increased by 0.17, 0.10, and 0.19 units, respectively (p < 0.05).

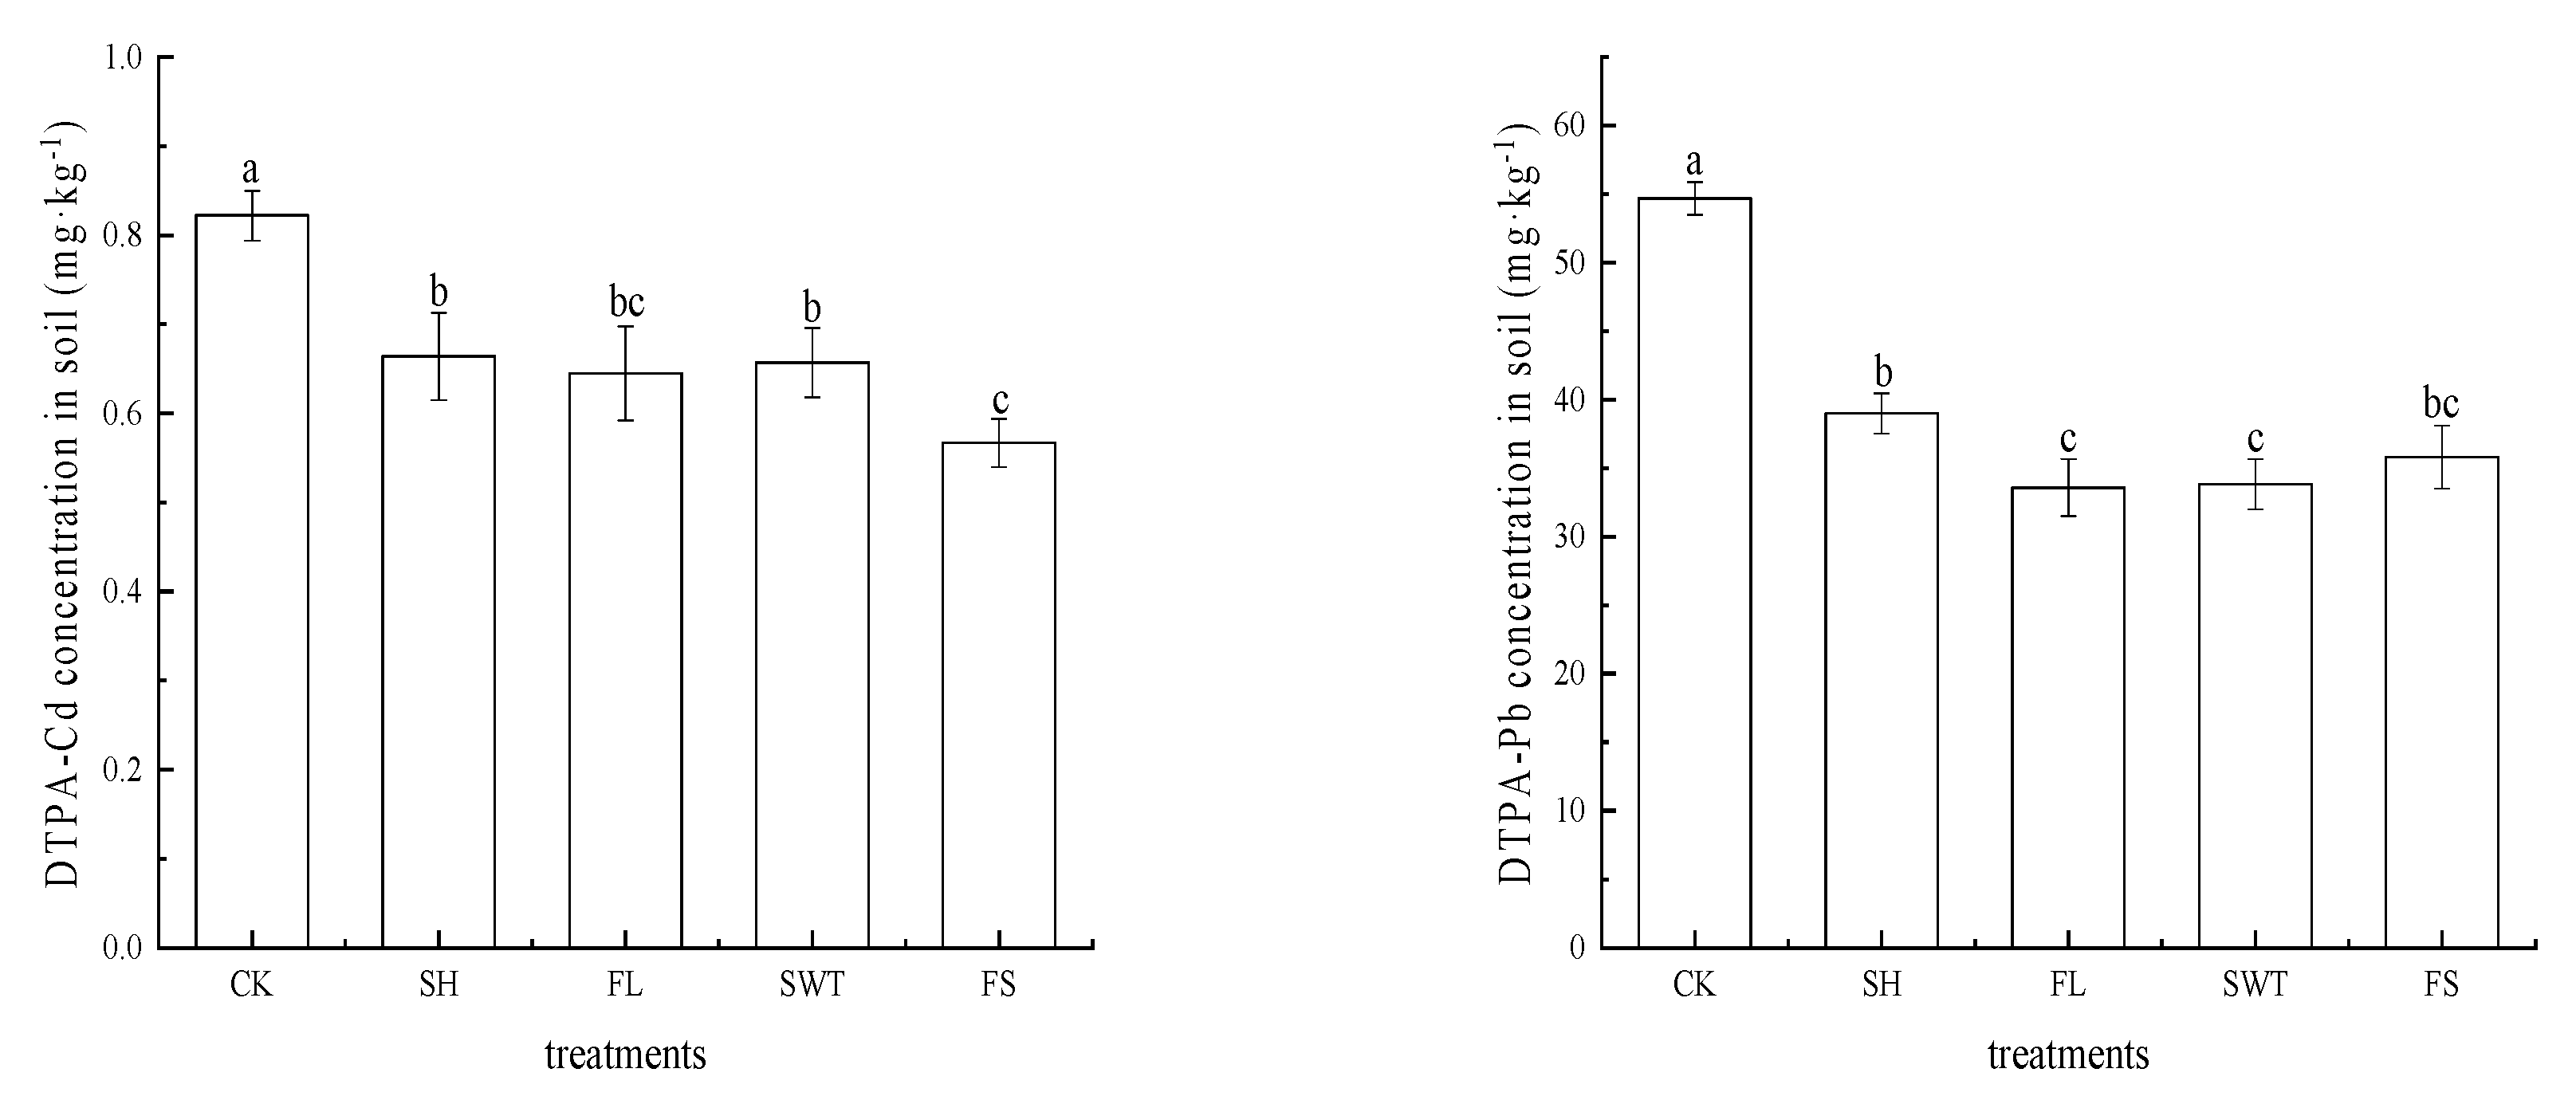
3.3.2. Effects of Different Treatments on the DTPA-Cd and DTPA-Pb in Soil

Figure 4 shows that the soil DTPA-Cd concentration was between 0.567 and 0.822 mg·kg−1 under different treatments. Compared with CK, different treatments could significantly reduce the DTPA-Cd concentration (p < 0.05), ranging from 19.29% to 31.05%. The most significant reduction in soil DTPA-Cd concentration was by FS treatment (p < 0.05). Compared with CK, FL, and SWT declined by 21.52% and 20.14%, respectively. Soil DTPA-Pb concentration ranged between 33.59 and 54.69 mg·kg−1 under different treatments. Compared with CK, different treatments could significantly reduce DTPA-Pb concentration (p < 0.05), with a decrease of 28.68% to 38.57%. The FL and SWT treatments showed the most significant reduction in soil DTPA-Pb concentration (p < 0.05). FS decreased by 34.52% compared to CK.

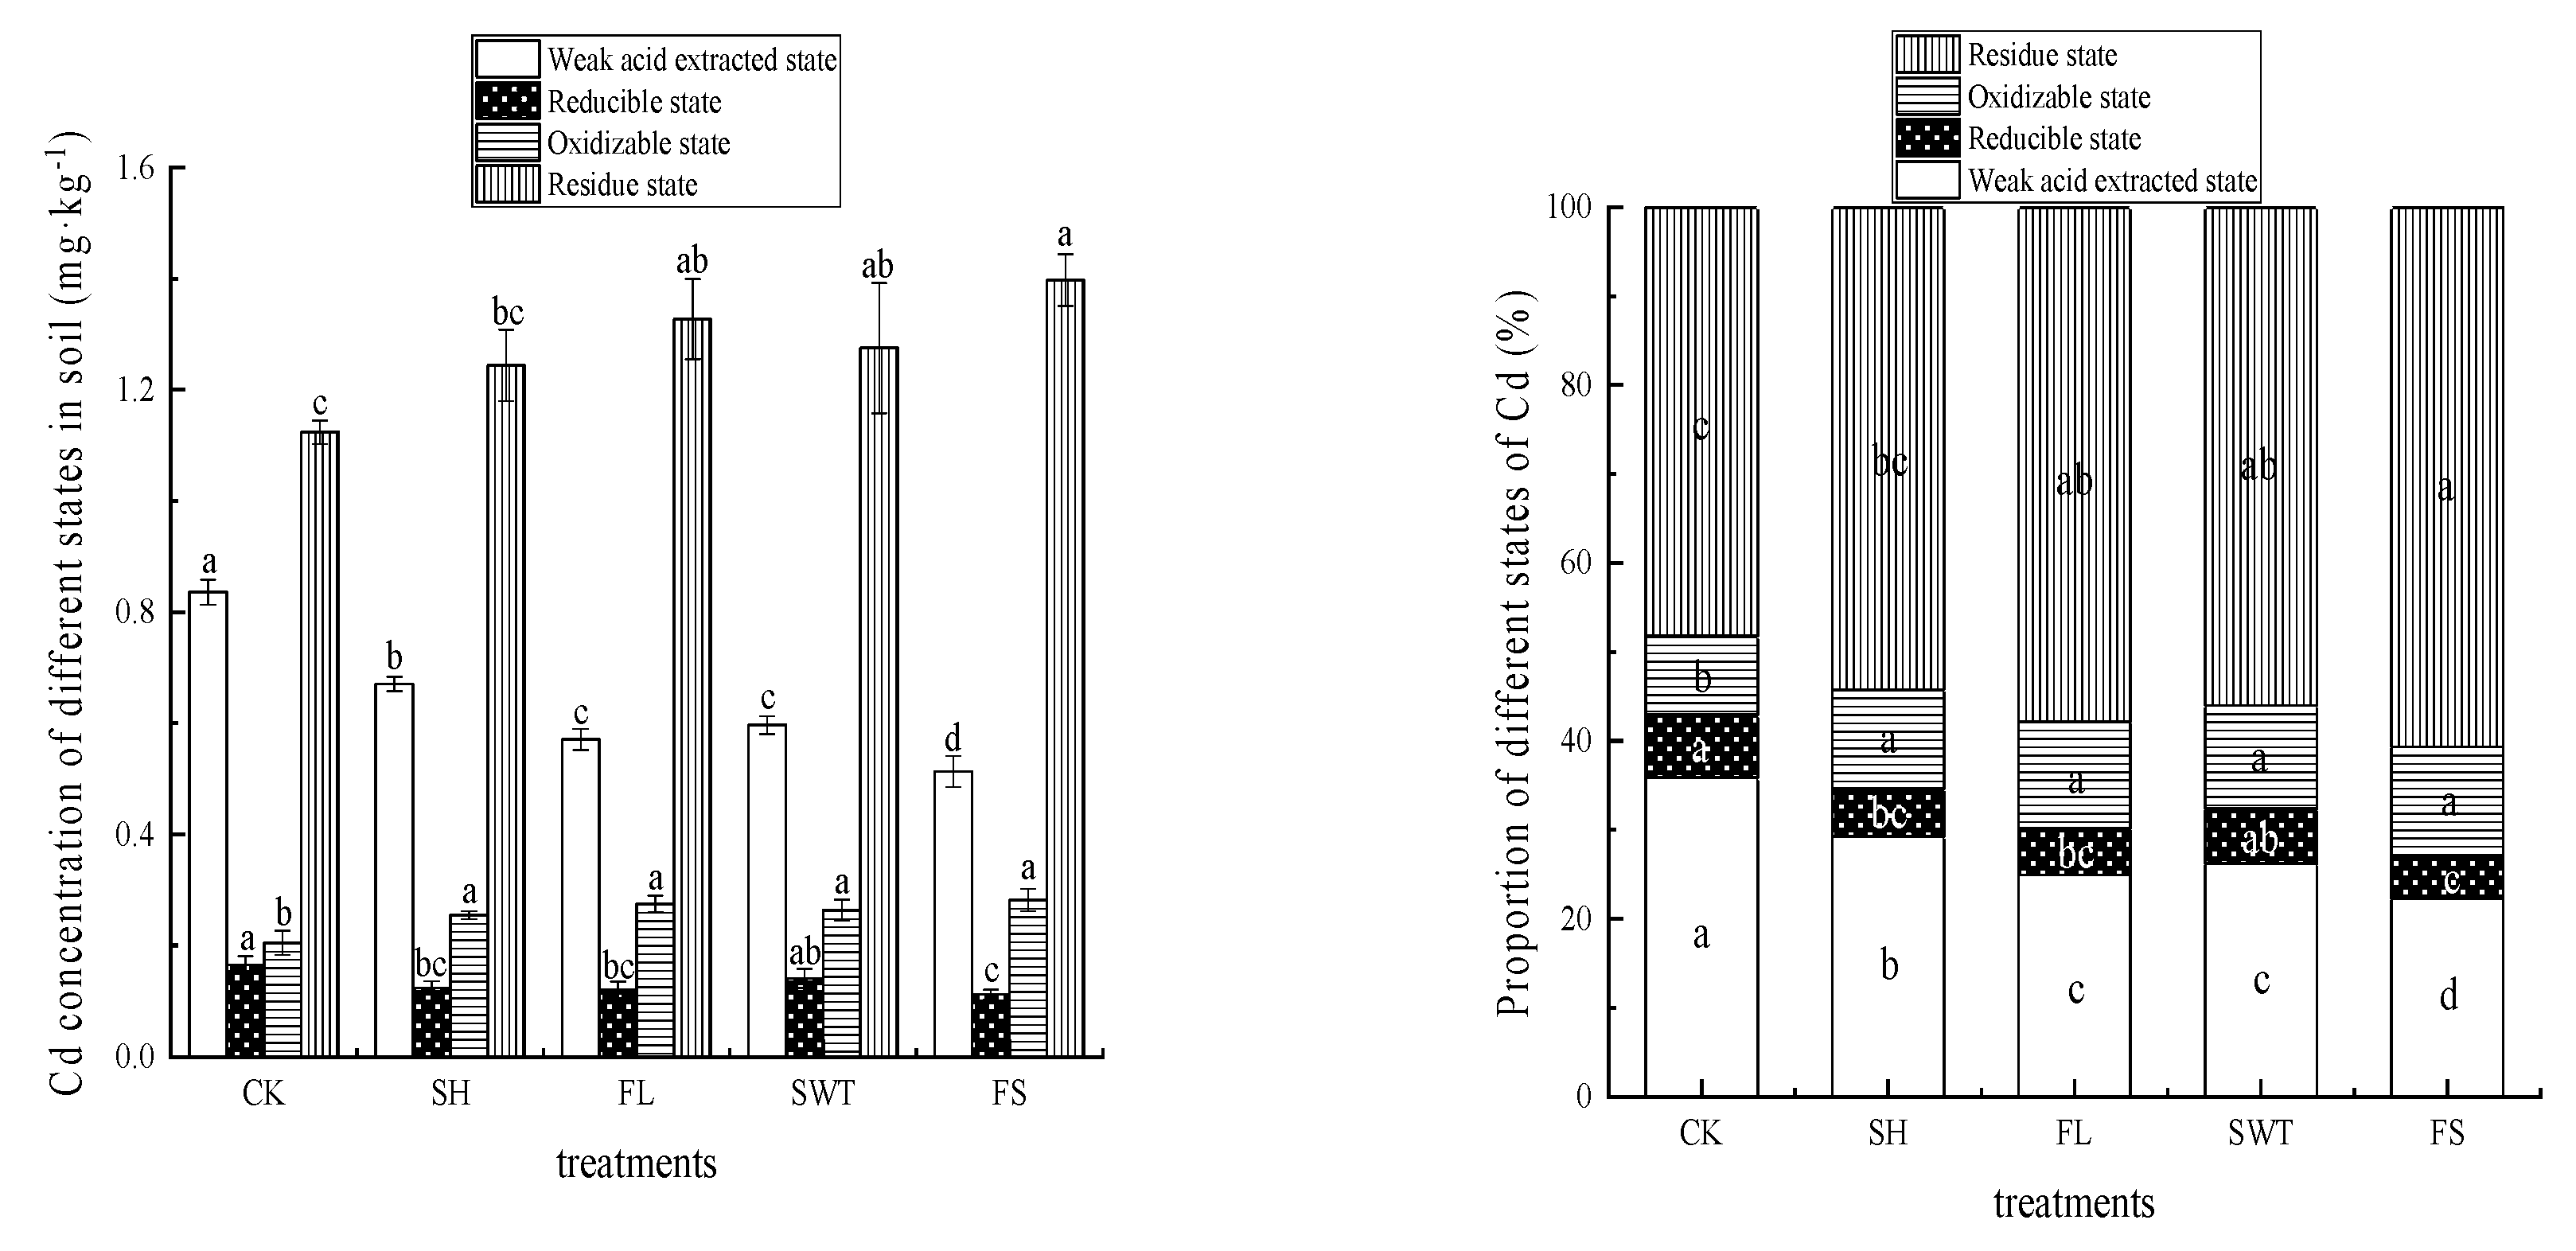
3.3.3. Effects of Different Treatments on the Chemical Morphology of Soil Cd

As can be seen from Figure 5, under different treatments, the concentrations of weak acid extract, reducible, oxidizable, and residual state of Cd in soil were between 0.513–0.836, 0.205–0.282, 0.112–0.165, and 1.124–1.398 mg·kg−1, respectively. Compared with CK, different treatments reduced the concentration of weak acid extraction state and oxidizable state of Cd in soil by 19.67–38.58% and 14.73–31.94%, respectively. FS treatment had the most significant effect on reducing the concentration of weak acid extraction state and reducible state of Cd in soil. FL and SWT treatments reduced the extraction state of weak acid of Cd in soil by 31.71% and 28.53% and reduced the concentration of the reducible state by 27.09% and 14.73%, respectively. Compared with CK, the oxidation state and residue state of soil Cd were improved under different treatments, and the increase ranges were 24.54–37.56% and 10.62–24.32%. FL, SWT, and FS increased Cd oxidation state concentration by 34.29%, 28.63%, and 37.56%, respectively, but there was no significant difference among all treatments (p < 0.05). FL, SWT, and FS increased by 18.00%, 13.40%, and 24.32% compared with CK, respectively (p < 0.05).

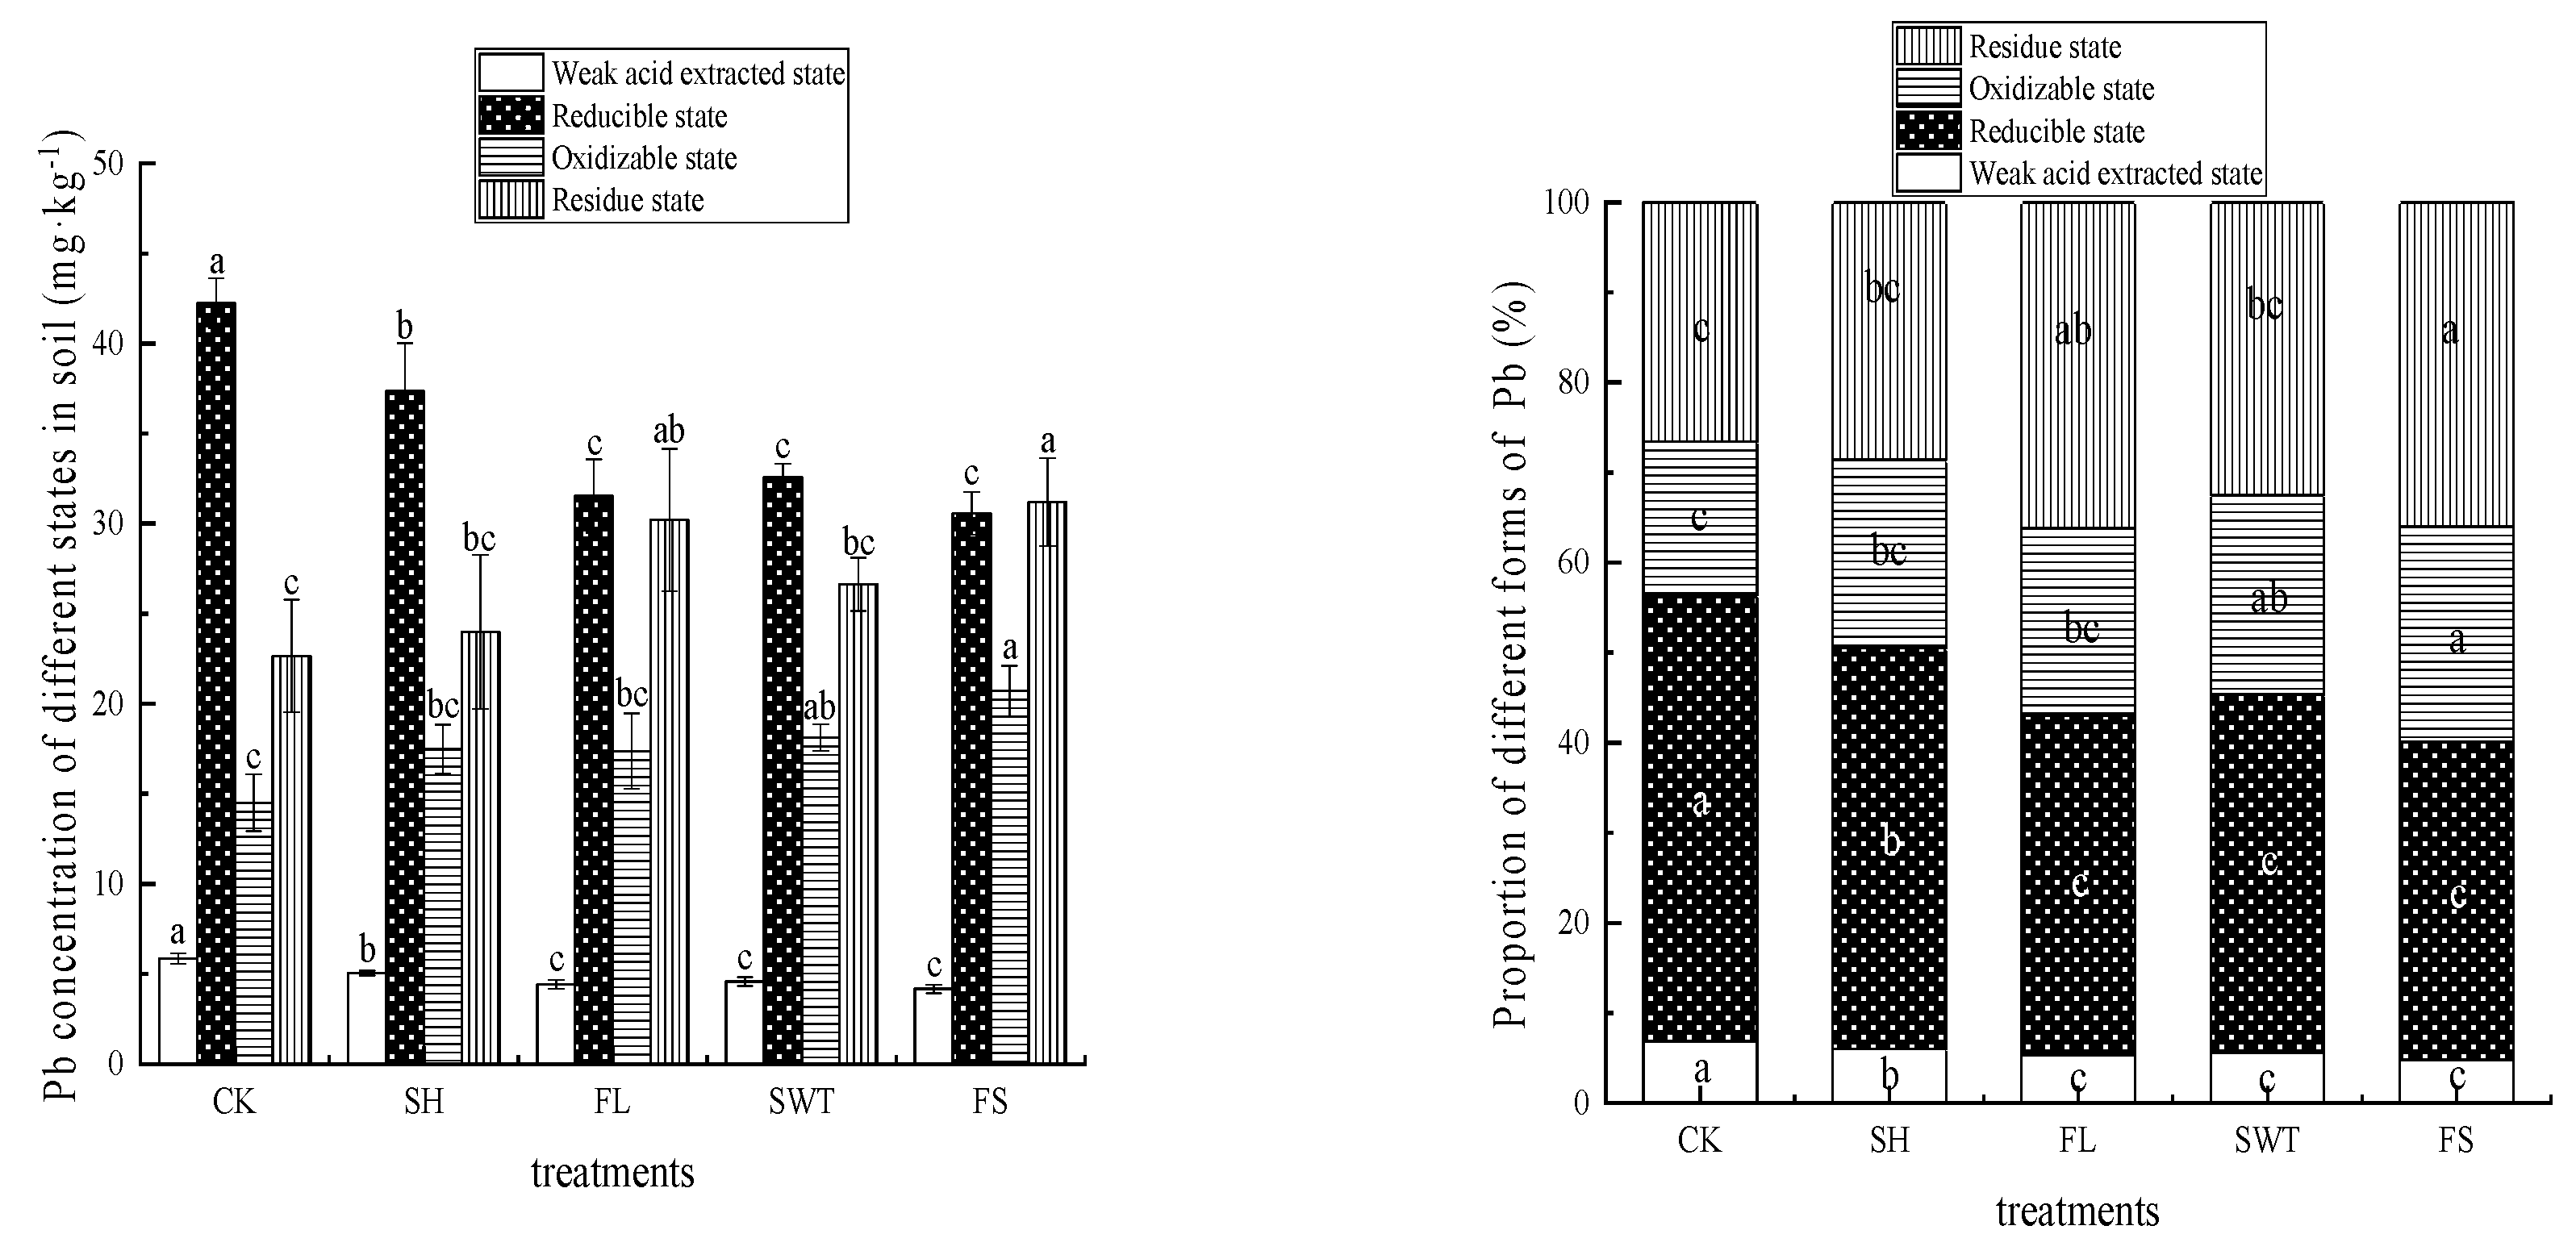
3.3.4. Effects of Different Treatments on Chemical Morphology of Soil Pb

As can be seen from Figure 6, the concentrations of weak acid extract, reducible, oxidizable, and residual state of Pb in soil under different treatments were 4.168–5.854, 30.57–42.24, 14.51–20.72 mg·kg−1, and 22.65–31.20 mg·kg−1, respectively. Compared with CK, different treatments can reduce the concentration of soil Pb weak acid extraction state and oxidizable state, respectively, by 13.60–28.80% and 11.59–27.63%. FS treatment can reduce the concentration of soil Pb weak acid extraction state and reducible state to the lowest quantity. Compared with CK and SH, the difference was significant (p < 0.05). FL and SWT treatments reduced the extraction state of Pb weak acid by 24.31% and 21.75%, respectively, and reduced the concentration of Pb in reduced state by 25.35% and 22.85%, respectively. Compared with CK, the oxidizing state and residual state of soil Pb under different treatments increased by ranges of 19.62–42.80% and 5.92–37.76%, respectively. FL, SWT, and FS increased the concentration of soil Pb oxidized state by 19.62%, 24.97%, and 42.80%, respectively, but there was no significant difference among all treatments (p < 0.05). FL, SWT, and FS significantly increased by 33.33%, 17.59%, and 37.76% compared with CK, respectively (p < 0.05).

3.4. Effects of Different Treatments on Soil Organic Matter and Nitrogen, Phosphorus and Potassium Concentrations

According to Table 8, the soil organic matter concentration was between 16.69 and 22.11 g·kg−1, and the SWT and FS treatments were significantly increased by 32.47% and 22.46%, respectively. The total nitrogen and alkaline nitrogen concentration in each soil increased by 11.39–22.16% and 3.75–13.19% compared with CK, respectively. The concentration of effective phosphorus and quick potassium increased by 22.37–52.43% and 7.74–20.24% compared with CK, respectively.

3.5. Economic Benefit Analysis of Different Treatments

The prices of maize seeds, fertilizers, machinery, and labor involved in this experiment were obtained by combining with the market survey, and the specific prices were subject to the actual market prices. On the basis of other management levels being consistent, the economic benefit pair is shown in Table 9. FL and FS treatments had higher input–output ratios (1.747 and 1.679, respectively), which were significantly higher than CK, SH, and SWT treatments (p < 0.05), and had higher economic benefits.

4. Discussion

4.1. Enrichment, Absorption and Transport of Cd and Pb in Different Parts of Maize by Different Treatments

The absorption and migration of heavy metals by plants are influenced by many factors, such as soil pH, available cadmium, and interaction between ions. The addition of soil conditioner not only affects the available state of heavy metals in soil, but also changes the soil fertility and enzyme activity, so as to affect the absorption, migration, and transformation of heavy metals by plants. VAN et al. [16] showed that the effect of the organic compound application of multiple passivating materials is often better than that of the single application of one material. This study showed that the combined application of formula fertilizer and biochar had a better effect on the reduction of heavy metals Cd and Pb in maize kernels than either applied alone. Heavy metals enter the root cells from the soil solution and are transported to the stem and leaves through the xylem by transporters. When the kernel is grated, Cd in the stem and leaves is transported to the kernel through the phloem. In the filling stage, the metabolism of roots and stalks is vigorous and heavy metals are enriched, which makes the concentration of cadmium in edible parts relatively small. JING et al. [17] also found that biochar could effectively inhibit the absorption and enrichment of Cd in rice. In soils polluted by heavy metals, biochar can increase soil pH value, exchange cations and surface functional groups, and precipitate Cd-P compounds, effectively fixing Cd [18]. Thus, the increase in soil pH caused by biochar explains the reduced toxicity of Cd to plants. Biochar inhibits the absorption of Cd by plants by reducing the availability of Cd in soil [19]. The results showed that different treatments could reduce the heavy metal concentration in maize kernels, and all of them were in line with the limited value specified in GB 2762-2017 [20]. Among them, single application of formula fertilizer and combined application with biochar had the most significant reduction effect, which may be because the formula fertilizer is rich in potassium sulfate, and sulfur is one of the essential elements for plant growth and development. It can form organic compounds with heavy metals to reduce the physiological toxic effects of heavy metals [21]. In this study, the application of formula fertilizer and biochar can reduce the cadmium transport coefficient of root–straw and root–kernel and thus reduce the heavy metal concentration in maize kernels. Although biochar application alone can reduce the heavy metal cadmium concentration in maize kernels, the effect is not obvious compared with other treatments, while the combined application of formula fertilizer and biochar can significantly reduce the heavy metal concentration in maize kernels, which may be because the formula fertilizer contains phosphate components, which can increase the surface negative charge of soil after adsorption. Heavy metal ions are continuously adsorbed around soil particles by electrostatic adsorption, and the availability of heavy metals is reduced by changing the form of heavy metals in the soil–plant system, thus reducing the concentration of heavy metals in maize kernels.

4.2. Effects of Different Treatments on Soil pH and Available Cadmium and Plumbum

Soil pH value has a significant effect on the form of heavy metals. Increasing soil pH can reduce the availability and migration ability of heavy metals in soil because pH affects the dissolution and precipitation balance of heavy metals in soil. Solidification and stabilization materials adjust soil pH or produce anions through their own action, precipitate heavy metal ions, and thus reduce the migration and bioavailability of heavy metals [22,23]. The porosity, large specific surface area, and abundant surface functional groups (-OH, -COOH, C=O, etc.) of biochar grant it a strong adsorption capacity for heavy metals. When biochar is added to the soil contaminated by heavy metals, it can directly adsorb or hold heavy metal ions in the soil, thus reducing the concentration of heavy metal ions in the soil solution. On the other hand, it can reduce the bioavailability of heavy metals by increasing the pH value of the soil. The principle of its action mainly includes improving the physical and chemical properties of the soil, regulating the activity of soil microbial activity, and reducing the biological effectiveness of heavy metals. The study of ZHENG et al. [24] showed that the application of biochar in the field could significantly reduce the concentration of Cd, Zn, and Pb available states. DENG et al. [25] found that biochar surface functional group C=C plays an important role in the adsorption of Cd, and N-C=O is effective in the removal of Pb. Liang et al. [26] pointed out that biochar passivating agents, including adsorption and precipitation, could effectively remove Pb, Zn, and Cd from soil. In this study, after the addition of biochar, the soil pH value increased by 0.1 unit, and DTPA-Cd and DTPA-Pb concentrations decreased by 20.14% and 38.16%, respectively, which is similar to the results of previous studies. Phosphate ions in soil can precipitate metal phosphate with various metal ions, and the resulting metal phosphate has a very low solubility in a large pH range. The bioavailability of heavy metals in soil can be changed through fertilizer regulation, and the absorption of heavy metals in soil by plants can be affected. Phosphoric acid in formula fertilizer can precipitate with heavy metals after dissolution, which can reduce the activity of heavy metals in soil and transform to a residue state. QIU et al. [27] studied the interaction between phosphorus and cadmium at the subcellular level of plants and found that the exogenous addition of phosphorus to cadmium-polluted soil could cause cadmium ions and phosphate to form phosphate–cadmium compounds on the cell wall of cabbage, thus playing a fixing role for cadmium. The study of Wang et al. [28] showed that calcium dihydrogen phosphate reduced the effective concentration of cadmium by 98%. LI et al. [29] found that phosphorus-containing substances have a better stability effect on Pb. The phosphate in calcium–magnesium phosphate fertilizer is complexed and absorbed with free heavy metal ions to form phosphorus and lead precipitation, which can significantly reduce the content of effective Pb in the soil. The combined application of a variety of passivating materials is often better than a single material, and at the same time can reduce the adverse effects caused by the single application of a material. In this study, single application of formula fertilizer and combined application with biochar reduced DTPA-Cd by 21.52% and 31.05%, and DTPA-Pb by 38.57% and 34.52%, respectively.

4.3. Effects of Different Treatments on Chemical Forms of Cadmium and Plumbum in Soil

After chemical reactions such as complexation, adsorption, dissolution, and precipitation in soil, heavy metals can form various occurrence forms with different biological availability. Heavy metals can be easily absorbed and utilized by plants, and their occurrence forms in soil directly affect the bioavailability of heavy metals. Therefore, it is of great significance to analyze the different forms of heavy metals in soil. The exchangeable heavy metals in soil are easy to be directly absorbed by plants, and the reduced and oxidized heavy metals can be converted into exchangeable states under certain conditions, which can be indirectly absorbed by plants. The application of biochar will increase the alkaline functional groups on the soil colloidal surface, and the existence of the alkaline groups will promote the conversion of the effective state of heavy metals to the residual state, resulting in the passivation and reduction of the activity of heavy metals [30,31]. Residual heavy metals are generally composed of primary and secondary silicate, sulfide, and some other stable secondary minerals. When the soil pH value increases, the available silicon concentration increases, S2− reacts with Cd2+ to form Cd-S, and the soil heavy metal ions and silicate ions form new structures and stable properties of silicate precipitation, thus increasing the proportion of residual state [32]. Zhang et al. [33] showed that adding soil conditioner could promote the conversion of acid extractable state and reducible state of cadmium in soil to a residue state, increase the stability of Cd in soil, and thus weaken the conversion ability of Cd in soil to plants. Mohamed et al. [34] found that the application of conditioner significantly reduced the concentration of soluble/exchangeable Cd in soil and increased the concentration of organically bound and inorganic precipitated Cd in soil. Zhu et al. [35] showed that most of the biological effectiveness of Pb in soil was from the reducing state Pb, and passivation could react with soil Pb via physical and chemical precipitation, complexation, and adsorption, which changed the chemical form of Pb in soil from high to low activity. In this study, both the single application of formula fertilizer and the combined application of biochar and formula fertilizer could reduce the concentration ratio of the weak acid extraction state and reducible state of heavy metals in soil, increase the proportion of the oxidized state of heavy metals in soil, and significantly increase the proportion of the residual state in soil. At the same time, Yin et al. [36] believed that organic matter could promote the adsorption of Cd in soil, thus reducing the availability of Cd. In this study, the application of formula fertilizer and biochar increased the concentration of organic matter in the soil. This may be because biochar with carbon and microporous structural characteristics can adsorb soil organic molecules and promote the polymerization of small organic molecules into organic matter through surface catalytic activity [37]. The application of formula fertilizer can directly supplement a large quantity of active organic substances and rich and balanced nutritional elements to the soil, improve the concentration of soil organic matter, and promote the growth and development of crops [38]. This study also found that the addition of formula fertilizer and biochar changed the soil physicochemical traits and the effectiveness of soil heavy metals, promoting the crop growth and increasing the yield.

5. Conclusions

Different treatments than CK can increase maize yield, and FS had the best effect. Each treatment can reduce the concentration of Cd and Pb in maize kernels, below the limit value stipulated by GB 2762-2017 [20] in China, and FS had the best effect. FL, SWT, and FS can reduce the concentration of DTPA-Cd and DTPA-Pb while increasing soil pH, transform the weak acid extraction and reducing state of heavy metals Cd and Pb in soil to the residue state, and also increase the concentration of organic matter and nitrogen, phosphorus, and potassium in soil. The treatments with high input and output are FL and FS.

Author Contributions

Methodology, J.H.; Software, C.C.; Investigation, Z.H.; Data curation, Y.C.; Writing—original draft, Z.M.; Writing—review & editing, R.T.; Visualization, H.H.; Project administration, Y.M. All authors have read and agreed to the published version of the manuscript.

Funding

National Key R&D Program Project “Technology Demonstration of Cadmium Arsenic Pollution Prevention and Ecological Security in Urban Rural Areas” (No.2018YFD0800203); Anhui Provincial Science and Technology Major Research Project “Development and Application of Efficient Nanoremediation Materials for Heavy Metal Pollution in Farmland” (No.17030701053).

Institutional Review Board Statement

Not applicable.

Informed Consent Statement

Informed consent was obtained from all subjects involved in the study.

Data Availability Statement

The data presented in this study are available on request from the corresponding author.

Conflicts of Interest

The authors declare no conflict of interest.

References

  1. Seneviratne, M.; Rajakaruna, N.; Rizwan, M.; Madawala, H.M.S.P.; Ok, Y.S.; Vithanage, M. Heavy metal-induced oxidative stress on seed germination and seedling development: A critical review. Environ. Geochem. Health 2020, 41, 1813–1831. [Google Scholar] [CrossRef]
  2. Arshad, M.; Naqvi, N.; Gul, I.; Yaqoob, K.; Bilal, M.; Kallerhoff, J. Lead plumbum phytoextraction by Pelargonium hortorum: Comparative assessment of EDTA and DIPA for Pb mobility and toxicity. Sci. Total Environ. 2020, 748, 141496. [Google Scholar] [CrossRef] [PubMed]
  3. Fu, F.; Wang, Q. Removal of heavy metal ions from wastewaters: A review. J. Environ. Manag. 2011, 92, 407–418. [Google Scholar] [CrossRef] [PubMed]
  4. Niu, L.; Yang, F.; Xu, C.; Yang, H.; Liu, W. Status of metal accumulation in farmland soils across China: From distribution to risk assessment. Environ. Pollut. 2013, 176, 55–62. [Google Scholar] [CrossRef] [PubMed]
  5. Ali, I.; Ali, R.; Alothman, Z.A.; Ali, J.; Habila, M.A. Assessment of toxic metals in wheat crops grown on selected soils, rigated by diferent water sources. Arab. J. Chem. 2012, 9, 1555–1562. [Google Scholar]
  6. Kamran, M.; Malik, Z.; Parveen, A.; Zong, Y.; Abbasi, G.H.; Rafiq, M.T.; Shaaban, M.; Mustafa, A.; Bashir, S.; Rafay, M.; et al. Biochar alleviates Cd phytotoxicity by minimizing bioavailability and oxidative stress in pak choi (Brassica chinensis L.) cultivated in Cd-polluted soil. J. Environ. Manag. 2019, 250, 109500. [Google Scholar] [CrossRef] [PubMed]
  7. Park, J.H.; Ok, Y.S.; Kim, S.H.; Cho, J.S.; Heo, J.S.; Delaune, R.D.; Seo, D.C. Competitive adsorption of heavy metals onto sesame straw biochar in aqueous solutions. Chemosphere 2016, 142, 77–83. [Google Scholar] [CrossRef]
  8. Wang, R.Z.; Huang, D.L.; Liu, Y.G.; Zhang, C.; Lai, C.; Wang, X.; Zeng, G.-M.; Zhang, Q.; Gong, X.; Xu, P. Synergistic removal of copper and tetracycline from aqueous solution by steam-activated bamboo-derived biochar. J. Hazard. Mater. 2020, 384, 121470. [Google Scholar] [CrossRef] [PubMed]
  9. Zhang, C.; Shan, B.; Tang, W.; Zhu, Y. Comparison of cadmium and plumbum sorption by Phyllostachys pubescensbiochar produced under a low-oxygen pyrolysis atmosphere. Bioresour. Technol. 2017, 238, 352–360. [Google Scholar] [CrossRef]
  10. Gao, L.Y.; Deng, J.H.; Huang, G.F.; Li, K.; Cai, K.Z.; Liu, Y.; Huang, F. Relative distribution of Cd2+adsorption mechanisms on biochars derived from rice straw and sewage sludge. Bioresour. Technol. 2019, 272, 114–122. [Google Scholar] [CrossRef]
  11. Wang, R.Z.; Huang, D.L.; Liu, Y.G.; Zhang, C.; Lai, C.; Zeng, G.M.; Cheng, M.; Gong, X.; Wan, J.; Luo, H. Investigating the adsorption behavior and the relative distribution of Cd2+sorption mechanisms on biochars by different feedstock. Bioresour. Technol. 2018, 261, 265–271. [Google Scholar] [CrossRef]
  12. GB/T 23739-2009; Soil Quality—Analysis of Available Lead and Cadmium Contents in Soils—Atomic Absorption Spectrometry. General Administration of Quality Supervision, Inspection and Quarantine of the People’s Republic of China, Standardization Administration of China: Beijing, China, 2019.
  13. GB 5009.268-2016; National Food Safety Standard—Determination of Calcium, Iron, Zinc, Sodium, Potassium, Magnesium, Copper and Manganese in Foods for Infants and Young Children, Milk and Milk Products. National Health and Family Planning Commission of the PRC, State Food and Drug Administration: Beijing, China, 2016.
  14. Pueyo, M.; Mateu, J.; Rigol, A.; Vidal, M.; López-Sánchez, J.F.; Rauret, G. Use of the modified BCR three-step sequential extraction procedure for the study of trace element dynamics in contaminated soils. Environ. Pollut. 2008, 152, 330–341. [Google Scholar] [CrossRef]
  15. GB 2762-2022; National Food Safety Standard Maximum Levels of Contaminants in Foods. State Administration for Market Regulation, National Health Commission: Beijing, China, 2022.
  16. Van Herwijnen, R.; Hutchings, T.R.; Al-Tabbaa, A.; Moffat, A.J.; Johns, M.L.; Ouki, S.K. Remediation of metal contaminated soil with mineral-amended composts. Environ. Pollut. 2007, 150, 347–354. [Google Scholar] [CrossRef]
  17. Jing, F.; Chen, C.; Chen, X.; Liu, W.; Wen, X.; Hu, S.; Yang, Z.; Guo, B.; Xu, Y.; Yu, Q. Effects of wheat straw derived biochar on cadmium availability in a paddy soil and its accumulationin rice. Environ. Pollut. 2020, 257, 113592. [Google Scholar] [CrossRef] [PubMed]
  18. Park, J.H.; Wang, J.J.; Kim, S.H.; Kang, S.W.; Jeong, C.Y.; Jeon, J.R.; Park Cho, J.-S.; Delaune, R.D.; Seo, D.-C. Cadmium adsorption characteristics of biochars derived using various pine tree residues and pyrolysis temperatures. J. Colloid Interface Sci. 2019, 553, 298–307. [Google Scholar] [CrossRef] [PubMed]
  19. Zhang, J.Y.; Zhou, H.; Gu, J.F.; Huang, F.; Yang, W.J.; Wang, S.L.; Yuan, T.Y.; Liao, B.H. Effects of nano-Fe3O4-modified biochar on iron plaque formation and Cd accumulation in rice(Oryza sativa L.). Environ. Pollut. 2020, 260, 113970. [Google Scholar] [CrossRef] [PubMed]
  20. GB 2762-2017; National Food Safety Standard Maximum Levels of Contaminants in Foods. State Administration for Market Regulation, National Health Commission: Beijing, China, 2017.
  21. Chao, D.Y.; Baraniecka, P.; Danku, J.; Koprivova, A.; Lahner, B.; Luo, H.; Yakubova, E.; Dilkes, B.; Kopriva, S.; Salt, D.E. Variation in Sulfur and Selenium Accumulation Is Controlled by Naturally Occurring Isoforms of the Key Sulfur Assimilation Enzyme ADENOSINE 5’-PHOSPHOSULFATE REDUCTASE2 across the Arabidopsis Species Range. Plant Physiol. 2014, 166, 1593–1608. [Google Scholar] [CrossRef] [PubMed] [Green Version]
  22. Chen, S.; Xu, M.; Ma, Y.; Yang, J. Evaluation of different phosphate amendments on availability of metals in contaminated soil. Ecotoxicol. Environ. Saf. 2007, 67, 278–285. [Google Scholar] [CrossRef]
  23. Gray, C.W.; Dunham, S.J.; Dennis, P.G.; Zhao, F.J.; McGrath, S.P. Field evaluation of in situ remediation of a heavy metal contaminated soil using lime and redmud. Environ. Pollut. 2006, 142, 530–539. [Google Scholar] [CrossRef]
  24. Zheng, R.; Chen, Z.; Cai, C.; Tie, B.; Liu, X.; Reid, B.J.; Huang, Q.; Lei, M.; Sun, G.; Baltrėnaitė, E. Mitigating heavy metal accumulation into rice(Oryza sativa L.)using biochar amendment: A field experiment in Hunan, China. Environ. Sci. Pollut. Res. 2015, 22, 11097–11108. [Google Scholar] [CrossRef]
  25. Deng, J.; Liu, Y.; Liu, S.; Zeng, G.; Tan, X.; Huang, B.; Tang, X.; Wang, S.; Hua, Q.; Yan, Z. Competitive adsorption of Pb (II), Cd (II) and Cu (II) onto chitosan-pyromellitic dianhydride modified biochar. J. Colloid Interface Sci. 2017, 506, 355–364. [Google Scholar] [CrossRef] [PubMed]
  26. Liang, Y.; Cao, X.; Zhao, L.; Arellano, E. Biochar-and phosphate-induced immobilization of heavy metals in contaminated soil and water: Implication on simultaneous remediation of contaminated soil and groundwater. Environ. Sci. Pollut. Res. 2014, 21, 4665–4674. [Google Scholar] [CrossRef] [PubMed]
  27. Qiu, Q.; Wang, Y.; Yang, Z.; Yuan, J. Effects of phosphorus supplied in soil on subcellular distribution and chemical forms of cadmium in two Chinese flowering cabbage (Brassica parachinensis L.) cultivars differing in cadmium accumulation. Food Chem. Toxicol. Int. J. Publ. Br. Ind. Biol. Res. Assoc. 2011, 49, 2260–2267. [Google Scholar] [CrossRef] [PubMed]
  28. Wang, Y.M.; Chen, T.C.; Yeh, K.J.; Shue, M.F. Stabilizatio of an elevated heavy metal contaminated site. J. Hazard. Mater. 2001, 88, 63–74. [Google Scholar] [CrossRef] [PubMed]
  29. Li, L.; Xing, W.; Xiang, G.Q.; Yang, L.; Zhang, H.; Zhang, J. Immobilization of Pb and Cd in a lead smelting polluted soil with different amendments. Acta Sci. Circumst. 2012, 32, 1717–1724. [Google Scholar]
  30. Yuan, Z.W.; Wang, L.; Lan, T.; Ji, Y.; Zhao, H.Z. Water quality assessment and source identification of water pollution in the Banchengzi reservoir, Beijing, China. Desalination Water Treat. 2016, 57, 29240–29253. [Google Scholar] [CrossRef]
  31. Xu, Z.; Yu, G.; Zhang, X.; Ge, J.; He, N.; Wang, Q.; Wang, D. The variations in soil microbial communities, enzyme activities and their relationships with soil organic matter decomposition along the northern slope of Changbai mountain. Appl. Soil Ecol. 2015, 86, 19–29. [Google Scholar] [CrossRef]
  32. Nenmann, D.; Nieden, U.Z. Silicon and heavy metal tolerance of higher plants. Phytochemistry 2001, 56, 685–692. [Google Scholar] [CrossRef]
  33. Zhang, S.; Deng, Y.; Fu, S.; Xu, M.; Zhu, P.; Liang, Y.; Yin, H.; Jiang, H.; Bai, L.; Liu, X.; et al. Reduction mechanism of Cd accumulation in rice grain by Chinese milk vetch residue: Insight into microbial community. Ecotoxicol. Environ. Saf. 2020, 202, 110908. [Google Scholar] [CrossRef]
  34. Mohamed, I.; Ahamadou, B.; Li, M.; Gong, C.; Cai, P.; Liang, W.; Huang, Q. Fractionation of copper and cadmium and their binding with soil organic matter in a contaminated soil amended with organic materials. J. Soils Sediments 2010, 10, 973–982. [Google Scholar] [CrossRef]
  35. Zhu, Y.G.; Chen, S.B.; Yang, J.C. Effects of soil amendments on lead uptake by two vegetable crops from a lead-contaminated soil from Anhui, China. Environ. Int. 2004, 30, 351–356. [Google Scholar] [CrossRef] [PubMed]
  36. Yin, B.; Zhou, L.; Yin, B.; Chen, L. Effects of organic amendments on rice (Oryza sativa L.) growth and uptake of heavy metals in contaminated soil. J. Soils Sediments 2016, 16, 537–546. [Google Scholar] [CrossRef]
  37. Song, Z.W.; Zhu, P.; Gao, H.J.; Peng, C.; Deng, A.X.; Zheng, C.Y.; Mannaf, M.A.; Islam, M.N.; Zhang, W.J. Effects of long-term fertilization on soil organic carbon content and aggregate composition under continuous maize cropping in Northeast China. J. Agric. Sci. 2015, 153, 236–244. [Google Scholar] [CrossRef]
  38. Liang, B.; Lehmann, J.; Sohi, S.P.; Thies, J.E.; O’Neill, B.; Trujillo, L.; Gaunt, J.; Solomon, D.; Grossman, J.; Neves, E.G.; et al. Black carbon affects the cycling of non-black carbon in soil. Org. Geochem. 2010, 41, 206–213. [Google Scholar] [CrossRef]
Figure 1. Effect of different treatments on Cd concentration in maize (mg·kg−1). Note: Different small letters above the same column indicate significant difference between treatments (p < 0.05).
Sustainability 15 04696 g001aSustainability 15 04696 g001b
Figure 2. Effect of different treatments on Pb concentration in maize (mg·kg−1). Note: Different small letters above the same column indicate significant difference between treatments (p < 0.05).
Sustainability 15 04696 g002aSustainability 15 04696 g002b
Figure 3. Effects of different treatments on soil pH. Note: Different small letters above the same column indicate significant difference between treatments (p < 0.05).
Sustainability 15 04696 g003
Figure 4. Effects of different treatments on soil DTPA-Cd and Pb. Note: Different small letters above the same column indicate significant difference between treatments (p < 0.05).
Sustainability 15 04696 g004
Figure 5. Effects of different treatments on chemical forms of Cd in soil. Note: Different small letters above the same column indicate significant difference between treatments (p < 0.05).
Sustainability 15 04696 g005
Figure 6. Effects of different treatments on chemical forms of Pb in soil. Note: Different small letters above the same column indicate significant difference between treatments (p < 0.05).
Sustainability 15 04696 g006
Table 1. Heavy metal concentration of soil conditioning materials (mg·kg−1).
Material TypeCdHgAsPbCr
Compound fertilizer0.180.0111.716.815.0
Formula fertilizer0.050.018.6917.711.2
Biochar0.370.102.9541.313.1
Lime0.520.0218.137.214.7
Table 2. Field plot test treatment and material consumption.
TreatmentRemediation MaterialRates (t·hm−2)Remarks
CK--Conventional fertilization
SHLime2.25Conventional fertilization
FLFormula fertilizer0.45No base fertilizer
SWTBiochar0.30Base fertilizer reduced by 10%
FSFormula fertilizer + Biochar0.45 + 0.03No base fertilizer
Note: The application rate of N, P, and K in each treatment was consistent with the application rate of topdressing.
Table 3. Effects of different treatments on maize biomass, yield and physiological indices.
TreatmentsBiomass (g·Plant−1)Yield
(t·hm−2)
Plant Height
(cm)
Leaf Length
(cm)
Leaf Width
(cm)
RootStrawCoreKernel
CK5.252 ±
0.226 b
44.73 ±
1.882 a
27.40 ±
0.812 a
153.6 ±
4.057 b
9.220 ±
0.245 b
231.4 ±
20.18 a
71.27 ±
5.908 a
8.933 ±
0.379 a
SH5.516 ±
0.164 ab
45.28 ±
3.055 a
29.54 ±
1.827 a
163.3 ±
7.581 ab
9.800 ±
0.456 ab
212.0 ±
17.66 a
80.33 ±
13.34 a
9.300 ±
0.900 a
FL5.666 ±
0.233 a
46.10 ±
3.436 a
29.62 ±
2.047 a
165.6 ±
4.302 ab
9.940 ±
0.261 ab
215.1 ±
12.42 a
80.23 ±
15.58 a
8.733 ±
0.808 a
SWT5.519 ±
0.053 ab
46.64 ±
2.536 a
28.71 ±
1.471 a
170.8 ±
7.946 a
10.25 ±
0.479a
225.3 ±
15.93 a
87.33 ±
15.58 a
9.167 ±
0.874 a
FS5.563 ±
0.079 ab
46.00 ±
3.540 a
29.01 ±
1.159 a
176.7 ±
10.42 a
10.60 ±
0.623 a
217.4 ±
17.78 a
81.00 ±
14.28 a
8.100 ±
0.436a
Note: Different lowercase letters in the same column indicate significant differences among treatments (p < 0.05).
Table 4. Effects of different treatments on Cd concentration in soil and Cd enrichment in maize.
TreatmentsSoil Cd (mg·kg−1)BCF Maize Cd
KernelCobStrawRoot
CK2.354 ± 0.082 a0.094 ± 0.008 a0.142 ± 0.015 a0.364 ± 0.017 a0.303 ± 0.001 a
SH2.286 ± 0.095 a0.083 ± 0.005 b0.102 ± 0.010 b0.289 ± 0.030 bc0.344 ± 0.040 a
FL2.321 ± 0.096 a0.080 ± 0.002 bc0.096 ± 0.012 b0.260 ± 0.023 c0.344 ± 0.026 a
SWT2.327 ± 0.106 a0.077 ± 0.002 bc0.105 ± 0.012 b0.300 ± 0.021 bc0.349 ± 0.008 a
FS2.269 ± 0.111 a0.073 ± 0.004 c0.106 ± 0.012 b0.310 ± 0.025 b0.350 ± 0.026 a
Note: Different lowercase letters in the same column indicate significant differences among treatments (p < 0.05).
Table 5. Effects of different treatments on Pb concentration in soil and Pb enrichment in maize.
TreatmentsSoil Pb (mg·kg−1)BCF Maize Pb
KernelCobStrawRoot
CK82.92 ± 2.118 a0.003 ± 0.000 a0.011 ± 0.000 a0.254 ± 0.011 a0.520 ± 0.049 a
SH84.69 ± 2.548 a0.002 ± 0.000 a0.008 ± 0.001 b0.217 ± 0.020 b0.538 ± 0.034 a
FL83.16 ± 2.524 a0.002 ± 0.000 a0.007 ± 0.000 c0.198 ± 0.013 bc0.575 ± 0.048 a
SWT83.81 ± 2.283 a0.002 ± 0.000 a0.008 ± 0.001 b0.214 ± 0.008 b0.579 ± 0.040 a
FS85.16 ± 1.525 a0.002 ± 0.000 a0.007 ± 0.000 c0.186 ± 0.011 c0.534 ± 0.036 a
Note: Different lowercase letters in the same column indicate significant differences among treatments (p < 0.05).
Table 6. Effects of different treatments on Cd transport in maize plants.
TreatmentsTF Maize Cd
Kernel-CoreCore-StrawStraw-RootKernel-Root
CK0.662 ± 0.037 a0.390 ± 0.025 a1.203 ± 0.056 a0.310 ± 0.026 a
SH0.825 ± 0.111 a0.354 ± 0.054 a0.842 ± 0.048 bc0.243 ± 0.023 b
FL0.834 ± 0.115 a0.373 ± 0.058 a0.755 ± 0.010 c0.231 ± 0.018 b
SWT0.739 ± 0.065 a0.349 ± 0.014 a0.860 ± 0.067 b0.221 ± 0.009 b
FS0.694 ± 0.089 a0.342 ± 0.012 a0.886 ± 0.049 b0.210 ± 0.024 b
Note: Different lowercase letters in the same column indicate significant differences among treatments (p < 0.05).
Table 7. Effects of different treatments on Pb transport in maize plants.
TreatmentsTF Maize Pb
Kernel–CobCob–Straw Straw–RootKernel–Root
CK0.248 ± 0.019 a0.044 ± 0.002 a0.492 ± 0.059 a0.006 ± 0.001 a
SH0.273 ± 0.040 a0.038 ± 0.004 ab0.405 ± 0.051 ab0.004 ± 0.000 b
FL0.268 ± 0.009 a0.037 ± 0.003 b0.346 ± 0.043 b0.003 ± 0.001 b
SWT0.269 ± 0.013 a0.036 ± 0.003 b0.370 ± 0.033 b0.004 ± 0.001 b
FS0.269 ± 0.017 a0.038 ± 0.003 b0.350 ± 0.032 b0.004 ± 0.001 b
Note: Different lowercase letters in the same column indicate significant differences among treatments (p < 0.05).
Table 8. Effects of different treatments on soil pH, OM and N, P, and K concentrations.
TreatmentsOrganic Matter (g·kg−1)Total N
(g·kg−1)
Alkali-
Hydrolyzed N
(mg·kg−1/)
Available P
(mg·kg−1)
Available K
(mg·kg−1)
CK16.69 ± 1.826 c1.053 ± 0.035 c76.90 ± 1.779 c14.11 ± 1.546 c122.7 ± 6.048 c
SH17.87 ± 1.100 bc1.173 ± 0.032 b79.78 ± 2.235 c17.77 ± 1.222 b132.2 ± 0.577 b
FL18.74 ± 0.817 bc1.203 ± 0.035 b81.20 ± 3.490 bc17.27 ± 0.887 b140.5 ± 2.291 a
SWT20.44 ± 0.580 ab1.240 ± 0.026 ab85.49 ± 2.870 ab19.93 ± 1.658 ab147.5 ± 3.279 a
FS22.11 ± 2.320 a1.287 ± 0.021 a87.04 ± 1.375 a21.51 ± 1.201 a144.0 ± 1.803 a
Note: Different lowercase letters in the same column indicate significant differences among treatments (p < 0.05).
Table 9. Economic benefit analysis of different treatments.
TreatmentsInput (CNY·hm−2)Total Input
(CNY·hm−2)
Total Output
(CNY·hm−2)
Input-Output
Ratio
ConditionerFertilizerOther
CK01215950010,7155877 ± 438 d0.548 ± 0.041 c
SH22501215950012,96516,426 ± 1364 b1.267 ± 0.106 b
FL13500950010,85018,961 ± 774 ab1.747 ± 0.072 a
SWT10,2001094950020,7949956 ± 1430 c0.479 ± 0.069 c
FS23700950011,87019,933 ± 1876 a1.679 ± 0.158 a
Note: Different lowercase letters in the same column indicate significant differences among treatments (p < 0.05). The unit price of rice is 3.0 CNY·kg−1. If Cd exceeds the standard, the unit price of rice is calculated as 60%. Other costs: including seeds, pesticides, machinery, labor, etc.
Disclaimer/Publisher’s Note: The statements, opinions and data contained in all publications are solely those of the individual author(s) and contributor(s) and not of MDPI and/or the editor(s). MDPI and/or the editor(s) disclaim responsibility for any injury to people or property resulting from any ideas, methods, instructions or products referred to in the content.

