
Low Carbon Management of China’s Hotel Tourism through Carbon Emission Trading

School of Tourism, Dalian University, Dalian 116622, China
Sustainability 2023, 15(5), 4622; https://doi.org/10.3390/su15054622
Submission received: 6 January 2023
/
Revised: 28 February 2023
/
Accepted: 1 March 2023
/
Published: 5 March 2023
(This article belongs to the Special Issue Agricultural and Natural Ecosystems Restoration after Disturbances)
Abstract
:In recent years, with the continuous improvement in the economic conditions of our people, people pay more and more attention to the spiritual aspect of consumption. Therefore, tourism has developed by leaps and bounds, and the tourism economy has become an important form of economic growth in China. However, as the global climate continues to deteriorate, people have begun to seek a sustainable development path, and the concept of low carbon tourism has been put forward, which requires hotels to make certain changes in their management mode in order to adapt to the concept of low carbon tourism in the new era. Since carbon trading is an important means for the promotion of carbon dioxide emission reduction, this paper explores the emission reduction effect and transmission mechanism of the carbon trading pilot through a spatial double difference model based on the study of spatial characteristics. The experiment shows that carbon trading not only effectively promotes local CO2 emission reduction, but also has a certain spillover effect on the surrounding areas. In addition, carbon trading can promote the economic growth of the pilot areas and the neighboring regions, and drive CO2 emission reduction at the same time. The paper concludes with an analysis of how to strengthen policy and behavioral guidance, improve government regulatory mechanisms, reduce environmental pollution in hotel tourism, and ensure that the model of hotel management meets the needs of the industry from the perspective of low carbon tourism under the situation of information symmetry and asymmetry.
1. Introduction
With continuous advancement in globalization, China’s tourism market has been given unprecedented development opportunities, and in order to minimize the damage brought to the ecological environment by the development of the tourism industry, China has put forward the development concept of low carbon tourism based on the concept of low carbon environmental protection, and the low carbon tourism concept is intended to achieve the organic combination of low carbon environmental protection and the tourism industry. The majority of tourists are direct consumers of tourism, so they first need to take practical action to practice low carbon tourism and consciously choose low carbon travel methods and low carbon lifestyle products, in order to minimize the pollution and damage caused to the environment [1,2].
In the past half century, the issue of carbon dioxide emissions, which has emerged along with industrial development and the progress of human civilization, has become a focus of attention and a common challenge for all countries [3,4]. With the goal of carbon neutrality, the Chinese government has made a series of efforts to promote energy saving and emission reduction, among which the active development of the carbon trading market is an important element [5,6,7]. The carbon trading market overcomes the shortcomings of a command-based policy to promote emission reduction and aims to achieve high quality emission reduction through market forces at a lower cost of governance [8]. Guided by the theory of “clear property rights for efficient resource allocation”, the basic idea of the carbon trading market is to control the total amount of emissions and commercialize emission rights based on the law [9], i.e., to set carbon emission allowances for enterprises participating in the carbon trading market, and to generate carbon emission costs through the trading of allowances in the carbon trading market. In this way, enterprises are incentivized to reduce carbon emissions and consumption. According to the successful experiences of EU-ETS, WCI, and RGGI, the construction of the carbon trading market needs to go through a long process of adjustment and improvement, and the initial stage of construction should be considered as a buffer phase, which allows regulators to have sufficient time and evidence to obtain accurate data and lay a solid foundation for better carbon trading institutional arrangements. China’s carbon trading pilot can be regarded as a buffer period for the construction of the national carbon trading market, and the carbon trading pilot has accumulated a lot of experience for the opening of the national carbon trading market [10]. At the initial stage of the national carbon market, the scientific assessment of the emission reduction effect and emission reduction path of the carbon trading pilot can provide empirical reference for the full-scale opening and subsequent development of China’s carbon trading market. At the same time, the spatial spillover effect of carbon emission reduction should be considered in the assessment process, which not only can make the assessment results of the emission reduction effect more accurate, but more importantly, can help to understand the spatial interaction of carbon emission reduction, and provide a basis for decision making to improve the carbon emission reduction effect of the carbon market on the national scale.
The emission reduction effect of China’s carbon trading pilot has long received extensive attention from scholars and generated a wealth of research results. Among the relevant studies, modeling simulation and the multiplicative difference method are the two most widely used research methods [11]. A reasonable simulation model can simulate the emission reduction mechanism in reality and has good policy guidance significance. However, due to the strong parameter assumptions that simulation models rely on, which are not easily satisfied in reality, and the subjective nature of parameter settings, the results of carbon trading pilot emission reduction based on simulation models vary greatly.
The study of [12] found that the carbon trading pilot hotels could hardly reduce carbon emissions due to the low trading price, and further suggested that the increase in carbon price could promote a reduction in CO2 emissions more effectively, but the economic cost should be noted. The study of [13] concludes that carbon trading not only promotes a reduction in carbon intensity, but also an increase in industrial output by using data envelopment analysis (DEA). In [14], a multi-agent model was used to find that although carbon trading pilot sites can reduce CO2 emissions, they have not yet decoupled emissions from the economy. The study of [15] found that carbon trading reduced the average cost of emission reduction in Hubei and Guangdong provinces, and significantly reduced CO2 emissions. The study of [16] concluded that although carbon trading in Hubei led to a decrease in carbon dioxide emissions in Hubei, there was an economic cost to reduce emissions. Carbon trading can be likened to a natural quasi-natural experiment and the multiplicative difference model, by its own characteristics, and can better identify the effects of policies and interventions provided that the assumptions are satisfied. Some scholars have used a double difference-in-differences (DIDs) model or propensity score matching–difference-in-differences model (PSM-DID) using provincial panel data for each province in China. The DID approach identifies the effects of carbon trading pilots [17], and agrees that carbon trading leads to a significant reduction in carbon emissions in the pilot areas. A study by [18] used the control method to examine the emission reduction effects of seven carbon trading pilots in China, and also found that carbon trading significantly reduced carbon emissions in the pilot areas. Combined with the hotel carbon emission accounting aspect of construction engineering, the study of [19] made an in-depth analysis of the low carbon development of hotel management and engineering solutions from both management and engineering perspectives, using low carbon economic theory as a guide, and proposed to closely integrate engineering practices with low carbon management to promote the low carbon development of hotels. Ref. [20] conducted a study on the carbon emission efficiency of hotels, and proposed to use the data envelopment analysis method to calculate the carbon emission efficiency of 28 hotels based on carbon emission indicators (with floor area, number of employees, and number of rooms as input indicators, and annual coal, electricity, and water consumption of hotels as output indicators), and the analysis concluded that the scale efficiency is the best. Although the above studies are useful in exploring the effects of carbon trading, there are still two shortcomings: (1) The sample sizes are small. The studies have used provincial panel data to conduct empirical analysis, and the sample size is limited. Insufficient sample size means stronger model assumptions, and when the assumptions are not satisfied, the regression results may not reflect the reality, especially when using PSM-DID, which may result in pseudo-regression. (2) Most articles do not consider spatial correlation. On the other hand, the spatial difference-in-differences model (SDIDs) can explore the spatial interaction of emission reduction characteristics and emission reduction transmission paths of carbon trading, but the ordinary double difference model cannot achieve this function. Therefore, ignoring the spatial correlation may miss the relevant findings on the spatial spillover effect of CO2 emissions. In the existing literature of the author, only study [21] considered the spatial correlation of CO2 emissions in each province, but the data of each province often have the problem of variable surface elements, and reducing the spatial scale is an effective way to reduce the influence of variable surface elements. For these reasons, this paper uses hotel data from 1999–2022 to estimate the emission reduction effect of carbon trading pilot projects through SDID and to investigate the transmission path of carbon trading pilot projects.
The innovations of this paper are: (1) using hotel data and CO2 emission data to expand the sample size and improve the accuracy of model identification, so that the estimation results are more convincing; (2) using the SDID method to explore the carbon dioxide emission reduction effect of carbon trading and the transmission path of emission reduction, eliminating the problem of spatial endogeneity, and exploring the spatial characteristics of emission reduction and the transmission mechanism of the carbon trading market.
2. Related Work
Tourism is a low-consumption, environmentally friendly form of entertainment that has long been welcomed by people, but with the continuous improvement in social infrastructure construction and the continuous improvement in residents’ spending power, people often choose the “ideal” way to travel, resulting in the invisible emission of a large amount of carbon dioxide when traveling, and the phenomenon of littering everywhere. The phenomenon of littering is also becoming more and more common. Although the traditional tourism industry is less polluting and more economically profitable than industrial manufacturing, this does not mean that the ecological pollution caused by tourism can be ignored. According to relevant data, the carbon emissions caused by the tourism industry alone account for 5% of the total annual carbon emissions, and the concept of low carbon tourism has been proposed to provide new ideas for the realization of green tourism, whereby the entire tourism industry chain will transform and create the realization of low carbon tourism, whilst developing the tourism industry at the same time to ensure effective protection of the ecological environment.
On the one hand, low carbon development has become the dominant trend of the world economic development at present, and the low carbon transition is the key to the transformation of economic development from high carbon emissions to low carbon emissions [22]. Research on the low carbon transition has firstly been carried out by domestic and foreign scholars based on the industrial perspective whereby among which foreign studies have mainly focused on the formulation and achievement of carbon emission targets. For example, the study of [23] found that the optimal carbon emission reduction target was not set in the current target setting process when participating in the industry carbon performance ladder target setting process in the Netherlands. In fact, in addition to studies related to carbon emission targets, issues related to carbon locking have also started to receive academic attention, and foreign scholars have found that infrastructure that directly emits greenhouse gases is the cause of the formation of carbon locking problems [24], while domestic scholars’ studies have focused on aspects related to factors that influence carbon emission changes [25]. In addition, other scholars have examined the impact of industrial structure changes on China’s carbon emissions in recent years based on different dimensions [26], and have also analyzed the carbon emission reduction potential of each industry, some possible implied carbon emission pathways, and their industry shares [27]. At the same time, scholars have also started to pay attention to the low carbon transition at the enterprise level but, in general, there are still relatively few studies in this area. Using content analysis conducted by the 2010 annual reports and CSR reports of the top 100 A-share listed companies on the SSE, the study of [28] found that large companies operating in industries with higher levels of CO2 emissions also tend to have higher levels of GHG disclosure; Omune et al. [29] found from an informal institutional perspective that ethnic culture has a positive contribution to corporate decarbonization motivation.
On the other hand, with the landing and implementation of China’s carbon trading pilot market, related studies have started to be enriched gradually. The current research on the carbon emission trading market is roughly promoted from the following two aspects: The first aspect is the emission reduction effect of the carbon emission trading pilot market and the effectiveness of its policies. Some scholars believe that the carbon emission trading policy has not realized the carbon emission reduction effect [30] and that the operation of the carbon market has had a negative impact on the economy [31]; however, most scholars still affirm the policy effect of carbon emission trading [32]. In addition to testing the emission reduction effect of the carbon trading policy, scholars have also studied the spillover effect of the policy, and found that the implementation of a local carbon trading policy helps to form a demonstration effect in neighboring areas, thus promoting carbon emission reduction in neighboring areas [33]. Second, the implementation effect of the carbon trading pilot market is explored from the microscopic perspective of enterprises. It is found that the implementation of the carbon trading pilot market helps to improve the financial performance of enterprises [34], and the improvement of financial performance further increases the innovation investment level of enterprises, in which the company age plays a positive moderating role [35]; the higher innovation investment level is also conducive to low carbon technology innovation [36], enterprise technology innovation [37], and green innovation [38] in the pilot region. In addition, other scholars have examined the impact of the carbon trading pilot market on enterprise investment efficiency and found that carbon emission trading can effectively enhance the investment efficiency of enterprises, and its path of action is to positively affect investment efficiency by alleviating the financing constraints of enterprises, reducing their policy burden and promoting enterprise technological innovation [39]. Li et al. [40] found that the carbon trading market has improved the short-term value of enterprises, but the current carbon trading mechanism still has more free allowances than demand, and the price of allowances is too low, which does not have a significant impact on the long-term value of enterprises. Of course, there are also scholars who have examined the impact of the carbon trading pilot market from the perspective of the total factor productivity of enterprises, but they have not yet reached a more consistent conclusion on this [41].
However, there are some shortcomings in the existing literature: First, the literature on low carbon transition is mostly focused on the macro level (industry or region), but there are relatively few studies on low carbon transition at the enterprise level. Second, the measurement of low carbon transition at the enterprise level is mostly characterized by total factor productivity or green total factor productivity, and few studies have directly constructed a comprehensive index system to measure the low carbon transition of enterprises. As a result, two hypotheses are proposed in this paper. H1: The carbon trading pilot market will significantly promote the low carbon transition of enterprises. H2: The carbon trading pilot market will force the low carbon transformation of enterprises through a reduction in their financial performance.
Based on this, this paper explores the impact of the carbon trading pilot market on the low carbon transformation of enterprises from a micro perspective, specifically in hotels, to meet the needs of customers for accommodation, catering, and entertainment on the basis of protecting the ecological environment, so that a harmonious, sustainable, developmental relationship can be formed between the development of hotels, the needs of customers, and environmental protection, and the concept of joint development of economic benefits, social benefits, and ecological protection can be formed [42]. Sustainable development is the theoretical basis for thinking about the low carbon development of hotels, and it is also the development goal of low carbon hotels. Hotel management, staff, and customers should establish the concepts of energy saving, carbon reduction, and green development, and take these to be their social responsibility, and should effectively implement the three low measures in design and construction and operation and management, introduce new technologies and facilities, and innovate in terms of sustainable development, so as to realize the sustainable development of low carbon hotels.
3. Methodology
3.1. Incentive Mechanism for the Low Carbon Development of the Hotel Industry
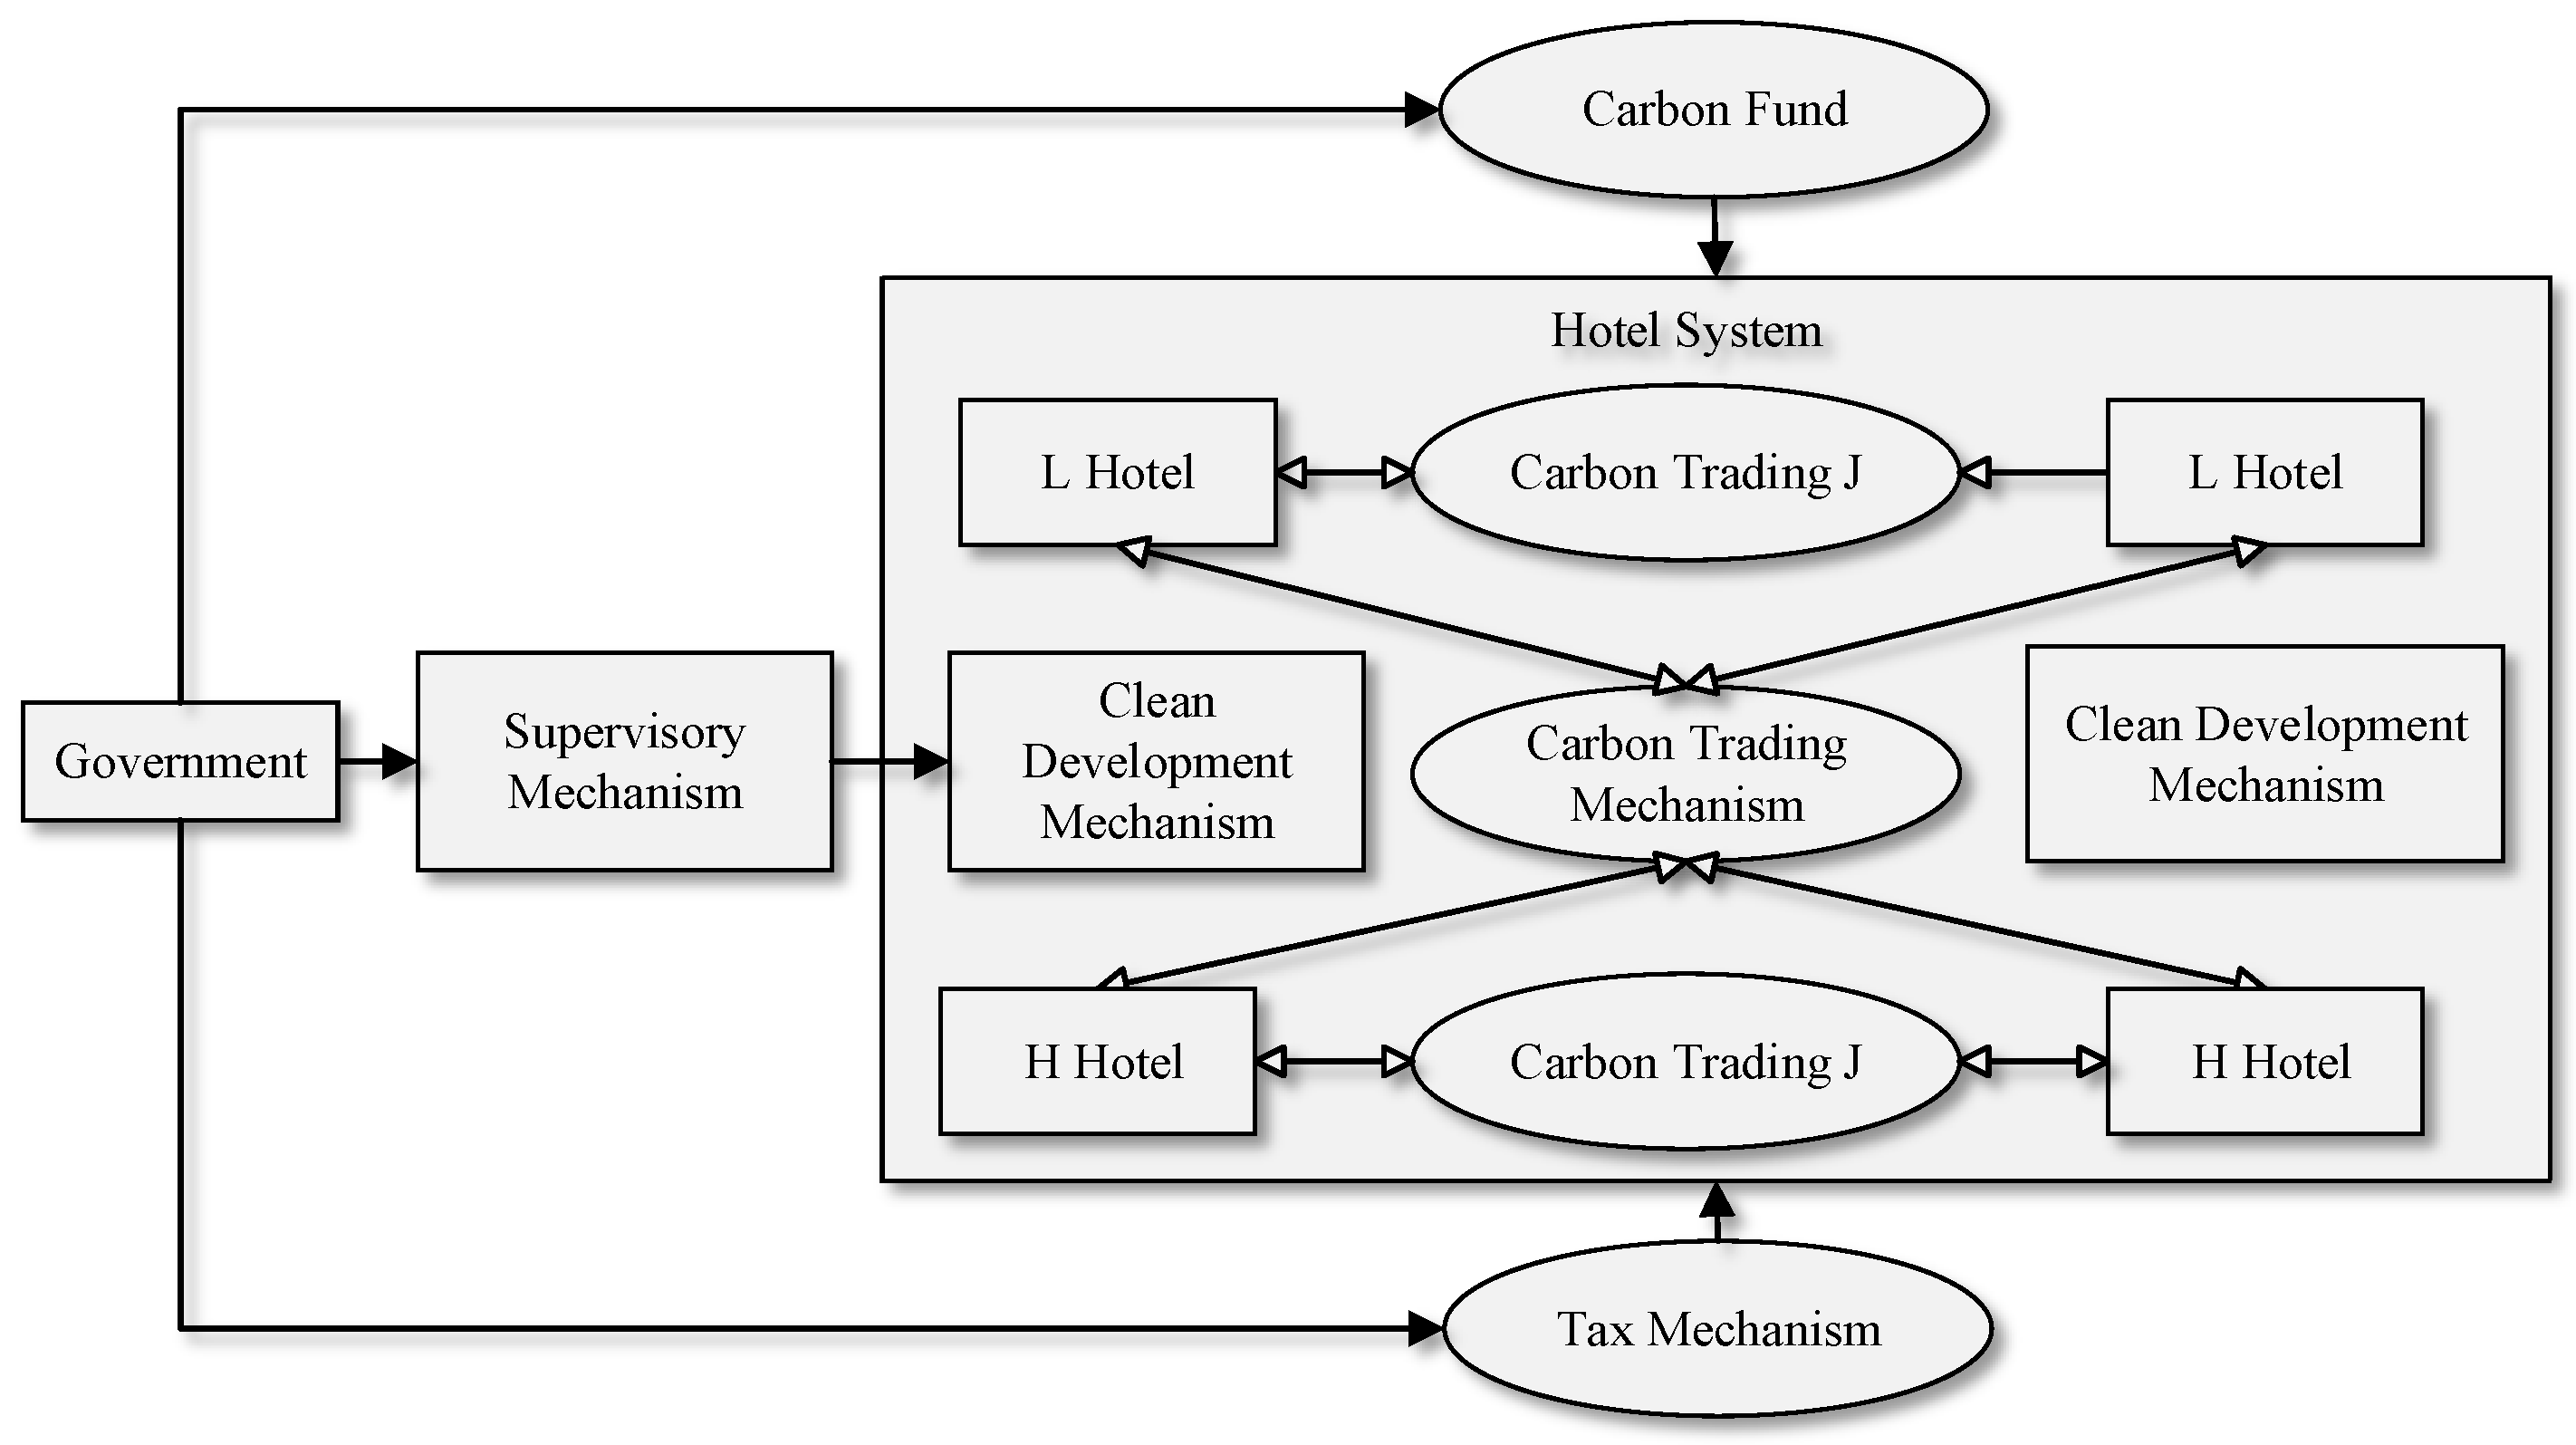
The incentive mechanism for the low carbon development of the hotel industry in practice is the government’s formulation of a series of relevant low carbon policies. By making use of financial and taxation mechanisms and market mechanisms, hotels are guided to take the low carbon path actively. Figure 1 shows the incentive mechanism for the decarbonization development of the hotel industry.
The low carbon development of hotels requires low carbon renovation, low carbon equipment, and a lot of capital. If we want to motivate hotels to go low-carbon, in addition to mandatory policies, the government needs to support hotels financially by granting low carbon subsidies. First, a fund should be set up to support the low carbon development of hotels. According to the scale and development status of the hotel, the maximum amount of low carbon subsidies should be set, and a certain percentage of low carbon renovation funds should be given to the audited low carbon renovation projects. Secondly, a taxation system should be established with clear rewards and punishments, and the dual role of taxation should be strengthened. Under the guidance of the principal agent theory, a : emission reduction standard and an appropriate reward and punishment factor B are set according to the scale, efficiency, and development status of hotels, and hotels that exceed the target are rewarded with a corresponding low-carbon fund. Hotels that complete the specified carbon emission reduction tasks are exempted from carbon tax; if they fail to complete the tasks, they are levied a carbon tax. At the same time, a heavy tax is levied on non-energy-saving projects and high pollution projects of hotels. These levied taxes must be fully invested in a special fund for low-carbon hotels, or returned to consumers of low-carbon hotels in the form of subsidies, in order to reduce information asymmetry and make incentives more effective. To reduce information asymmetry and make the incentive mechanism more effective, we should also accelerate the establishment of a green “GDP” evaluation system and strengthen the supervision of hotels in the process of incentivizing the development of low carbon hotels. See Figure 2.
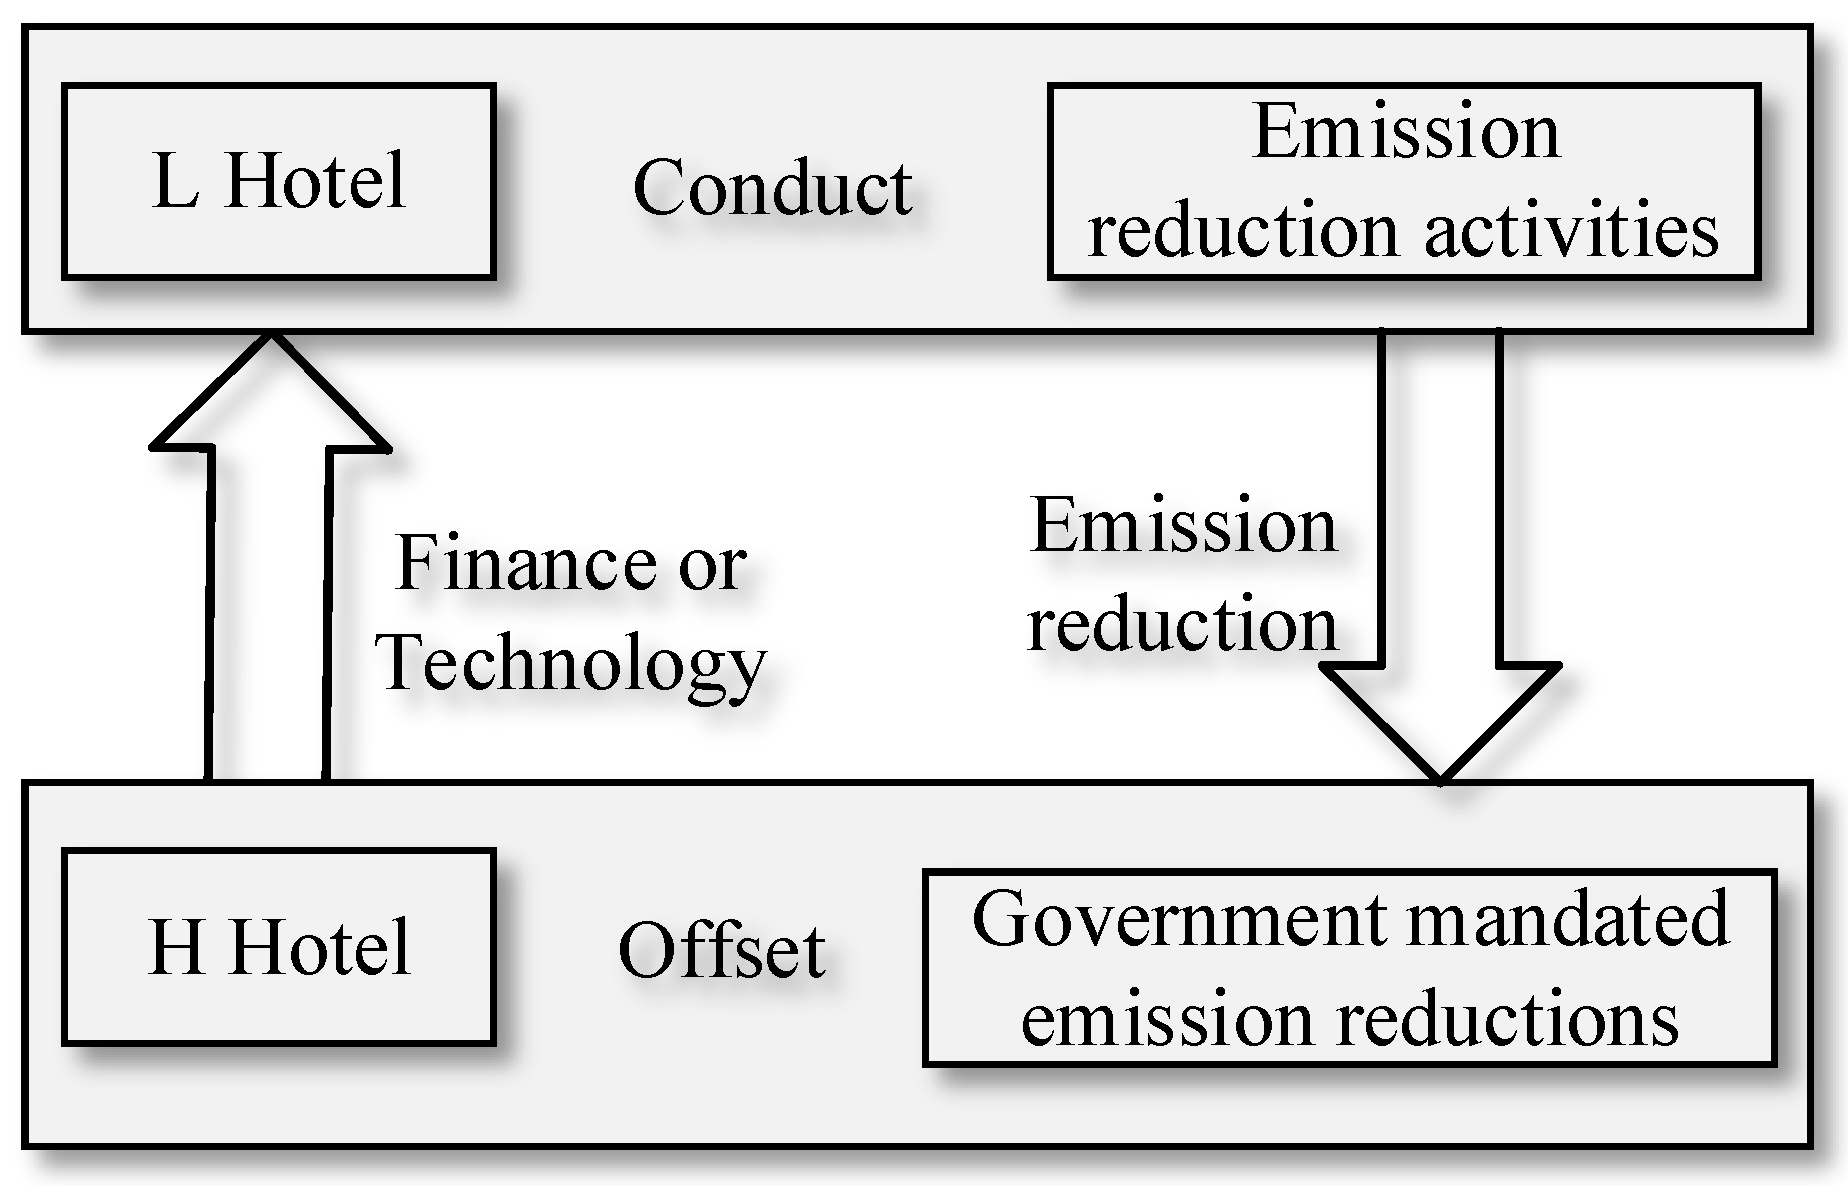
As different hotels differ in terms of building scale, hospitality capacity, and low carbon and energy-saving development levels, their ability to meet the government’s carbon emission reduction mandate may also vary to some extent. Therefore, the government can borrow the operation principle of the CDM to carry out a clean development mechanism for hotels. First, the hotels were divided into two categories: H hotels are the more economically efficient and developed hotels; L hotels are the less economically efficient and less developed hotels, and the emission reduction task of H hotels is higher than that of L hotels. Secondly, the carbon emission reduction task of Hotel H is higher than that of Hotel L. The carbon emission reduction task of Hotel H was allocated to the hotel according to its economic income. Allow Hotel H to provide financial or technical support for Hotel L to carry out low carbon projects, and use the emission reduction amount from these projects to offset their own emission reduction tasks. The so-called carbon trading involves treating carbon emission rights and emission reduction credits as scarce resources and using the market mechanism to solve the problem of reducing GHG emissions represented by , which means that emission rights can be traded as a commodity. With the introduction of carbon trading and its prevalence in the international market, carbon trading mechanisms have emerged as a system to regulate the carbon trading market. A carbon trading platform was established specifically for hotels, allowing hotels that have exceeded their emission reduction targets to trade their excess emission reductions to hotels that have not completed their reduction targets. The market mechanism of carbon trading can not only achieve a reasonable allocation of carbon emissions in hotels, but also make use of the competitive market mechanism. The market mechanism of carbon trading not only achieves a reasonable allocation of carbon emission credits for hotels, but also motivates hotels to actively carry out carbon reduction activities by using the market’s competitive price mechanism and interest drive. Through carbon trading, the hotels themselves can achieve the win–win effect of maximizing profits and reducing emissions.
3.2. DID Model
This chapter focuses on the relationship between carbon emission trading policy and green total factor productivity and the possible mechanisms of their effects. Whether the implementation of carbon emission trading policy improves the level of green total factor productivity or has a negative effect needs to be analyzed using empirical tests. At the same time, the transmission mechanism behind the policy is also worth studying. Whether the implementation of the policy acts directly on green productivity through impact costs or indirectly through mediating factors such as foreign investment and technological progress also needs to be further tested via empirical analysis.
- (1)
- Model construction
The DID model is an econometric method for estimating causal effects and has been widely used in recent years to assess policy effects. The basic idea of the model is to divide the entire sample data into two groups, one group affected by the policy, called the treatment group or experimental group, and one group not affected by the policy, called the control group. An individual indicator to be examined is selected and differenced twice, i.e., the difference between the experimental group differential and the control group differential, to obtain the net effect of policy implementation.
Since 2012, first-tier cities such as North Guangzhou and Shenzhen, as well as Tianjin, Hubei, and Chongqing, have opened carbon trading markets as pilot regions. Therefore, this paper treats the pilot regions as the treatment group and the non-pilot regions as the control group. Taking 2012 as the time point, the time series of 2006–2018 was divided into two periods of either policy implementation or not. By constructing a DID (double difference) model, the implementation effect of the policy was tested.
In this paper, the double difference model was constructed as follows.
where subscripts and denote the hotel number and year, respectively; is the explanatory variable; represents the region dummy variable, which is 1 if sample is selected as a carbon trading pilot hotel in year and is 0 otherwise (among the seven major carbon trading pilot sites, Shenzhen, Shanghai, Beijing, Guangdong, and Tianjin were officially launched in 2013; Hubei and Chongqing were officially launched in 2014); represents the year dummy variable (Shenzhen, Shanghai, Beijing, Guangdong, and Tianjin were officially launched in 2013; Hubei and Chongqing were officially launched in 2014); is a control variable; and represent individual and time-fixed effects, respectively; is a random disturbance term; are coefficients to be estimated; and is a constant term.
where represents whether hotel opens a carbon trading pilot in year . If yes, it takes 1, and vice versa, it takes 0.
- (2)
- Selection and description of relevant variables
In this paper, GTFP was used as the explanatory variable and carbon emission trading policy was used as the core explanatory variable. The level of economic development, population density, degree of government intervention, and education level were used as relevant control variables, and the relevant data were obtained from the China Statistical Yearbook.
(1) Level of economic development (GDP). Regions with a high level of economic development also have a higher degree of environmental protection, which affects the level of green total factor productivity [43]. Regions with good economic development also generally have a more rational and stable industrial structure, and pay more attention to investment in green development. In contrast, economically underdeveloped regions may place more emphasis on pure economic performance, and their economic growth is based more on damage to the environment and may invest less in pollution control. In this paper, the deflated regional GDP is used to measure this indicator.
(2) Population density (POP). This variable indicates the density of a population within a region and reflects the extent of urban outward sprawl [44]. An increase in population inevitably increases the use of energy and thus inhibits green total factor productivity. However, it can effectively promote the use of resources and increase green total factor productivity within a reasonable range. In this paper, the ratio of total population at the end of the year to the area of the region was used as a measure of population density.
(3) Government intervention (GOI). As a policy maker and provider of public goods, the government has considerable influence on economic development and environmental protection. Proper government intervention can maintain the market order and regulate the productive behavior of economic agents. Excessive intervention, on the other hand, is not conducive to fair competition in the market and reduces production efficiency. In this paper, drawing on the method of study [45], the ratio of government expenditure to regional GDP is used to reflect the magnitude of government intervention.
(4) Education level (ED). High-level and high-quality human resources are more skillful in the use of technology, which makes the production process more orderly and efficient, thus raising the level of green total factor productivity. These high levels of human capital, in turn, tend to be highly educated. Therefore, this paper used the ratio of education expenditure to GDP to reflect the level of education.
3.3. SDID Model
The spatial analysis is related to Waldo Tobler’s first law of geography: “All phenomena on a geographic unit are related, and the closer they are to each other, the closer the relationship”. The classical linear least squares estimation assumes that the explanatory variables are not correlated with the random disturbance term; so, when using provinces, prefectures, or counties as a sample, the assumption of independence between regions is implicit. However, if regions do not satisfy the assumption of mutual independence, spatial correlation is left out of the random disturbance term, causing endogeneity problems. The study shows that there is a strong spatial correlation of CO2 emissions and the resulting estimates may not satisfy the consistency assumption. In order to solve the above problem, we established a neighboring spatial weight matrix.
In the matrix , if hotel and hotel have a common point (), then the two hotels are considered to be adjacent; at this time, . If there is no common point, then ; when . The basic form of SDID is as follows. The spatial lag model (SAR) is as follows.
Spatial error model (SEM):
where denotes the spatial lag term of the dependent variable; denotes the spatial lag term of the error term; and represents the spatial coefficient. In the above model, SEM only affects the form of the random disturbance term, so it mainly solves the problem of estimation validity. SEM can only estimate the direct effect of the intervention, but not the indirect effect of the intervention, i.e., the spatial spillover effect, which is the coefficient in this model. The SAR model gives spatial weights to the dependent variable, which mainly solves the problem of estimation unbiasedness. The model setting determines that SAR can estimate both direct and indirect effects. However, and are not meaningful in the SAR model and do not represent the direct and indirect effects, which need to be further calculated to separate the direct and indirect effects. The total effect of the intervention is the sum of the direct and indirect effects.
4. Experiments
4.1. Selection of Variables
Emissions (E): Due to the increase in emission costs, companies may reduce CO2 emissions through technological innovation or production adjustments. However, some studies have also found positive economic benefits from carbon trading, and economic growth is often accompanied by CO2 emissions. Emissions as the dependent variable, and the results of this paper, measure the CO2 reduction effect of carbon trading. In this paper, the core problem addressed by the double difference model is the identification of the D coefficient, which is based on the premise of common trends. Therefore, we need to control the variables that lead to the difference in CO2 emission trends between regions, except for carbon trading. The control variables were selected as follows: (1) Gross regional product (G): Gross regional product measures the degree of regional development and has a significant impact on carbon emissions. (2) Primary industry value added as a share of GDP (): A high share of primary industry indicates that the region is well developed in agriculture while industry and services lag behind, which in turn means that the region has relatively low CO2 emissions. (3) Tertiary industry value added as a share of GDP (): regions with a high share of tertiary industry may be in the stage of changing from an industry-led economy to a service-based economy, and the replacement of industry by service industry will reduce regional CO2 emissions. With economic development and hotelization, the transportation industry in the tertiary industry has become the fastest-growing industry in terms of carbon emissions, and a high proportion of tertiary industry may also mean that the transportation industry has developed, thus increasing regional CO2. (4) Gross industrial output value (I): Industrial production is the main source of CO2 emissions in China, and the industrial output value includes not only the value added of industrial products but also the value of intermediate products, so this variable can explain the regional industrial production process of CO2 emissions. (5) Science and technology expenditure (): Technological progress is the first productive force, and regions with high R&D expenditure may have increased CO2 emissions due to technological progress driving productivity development, or decreased CO2 emissions due to improved production efficiency and energy use efficiency. (6) Total number of employees in research (): Talent is the core driver of technological progress. The higher the number of research employees, the more companies tend to develop and introduce new technologies, which in turn affects the CO2 emissions of their production processes. (7) Total population at the end of the year (P): On the one hand, population growth increases energy consumption, which leads to an increase in CO2 emissions; on the other hand, population growth can promote technological innovation and a low carbon shift in hotel energy, which reduces CO2 emissions.
4.2. Data and Descriptive Statistics
In this paper, the carbon emission data of hotels were obtained by processing the carbon emission data at the county level in China. The control variables were obtained from the China Hotel Statistical Yearbook according to province and hotel statistics. Due to the lack of data from Tibet, Xinjiang, Qinghai, Hainan, Yunnan, and other prefectures, this paper used the balanced panel data of 285 hotels from 1999 to 2022, with a total of 5415 observations. The descriptive statistics of the variables are shown in Table 1.
4.3. Statistical Tests
The spatial dependence test, also known as the spatial autocorrelation test, is designed to verify the existence of spatial autocorrelation by looking at the results of spatial statistics, so as to determine whether spatial econometric models need to be used. In order to enhance the validity of the results and reduce the problem of heteroskedasticity, all regressions in this paper are logarithmic for the dependent and control variables. Table 2 shows the global Moran index for the error term, the Lagrange multiplier test for the error term, and the Lagrange multiplier test for the lagged term, and all three statistics reject the original hypothesis of no spatial correlation at the 1% level of significance. Thus, it is necessary to use a spatial econometric model to analyze the emission reduction effect of carbon trading pilot projects.
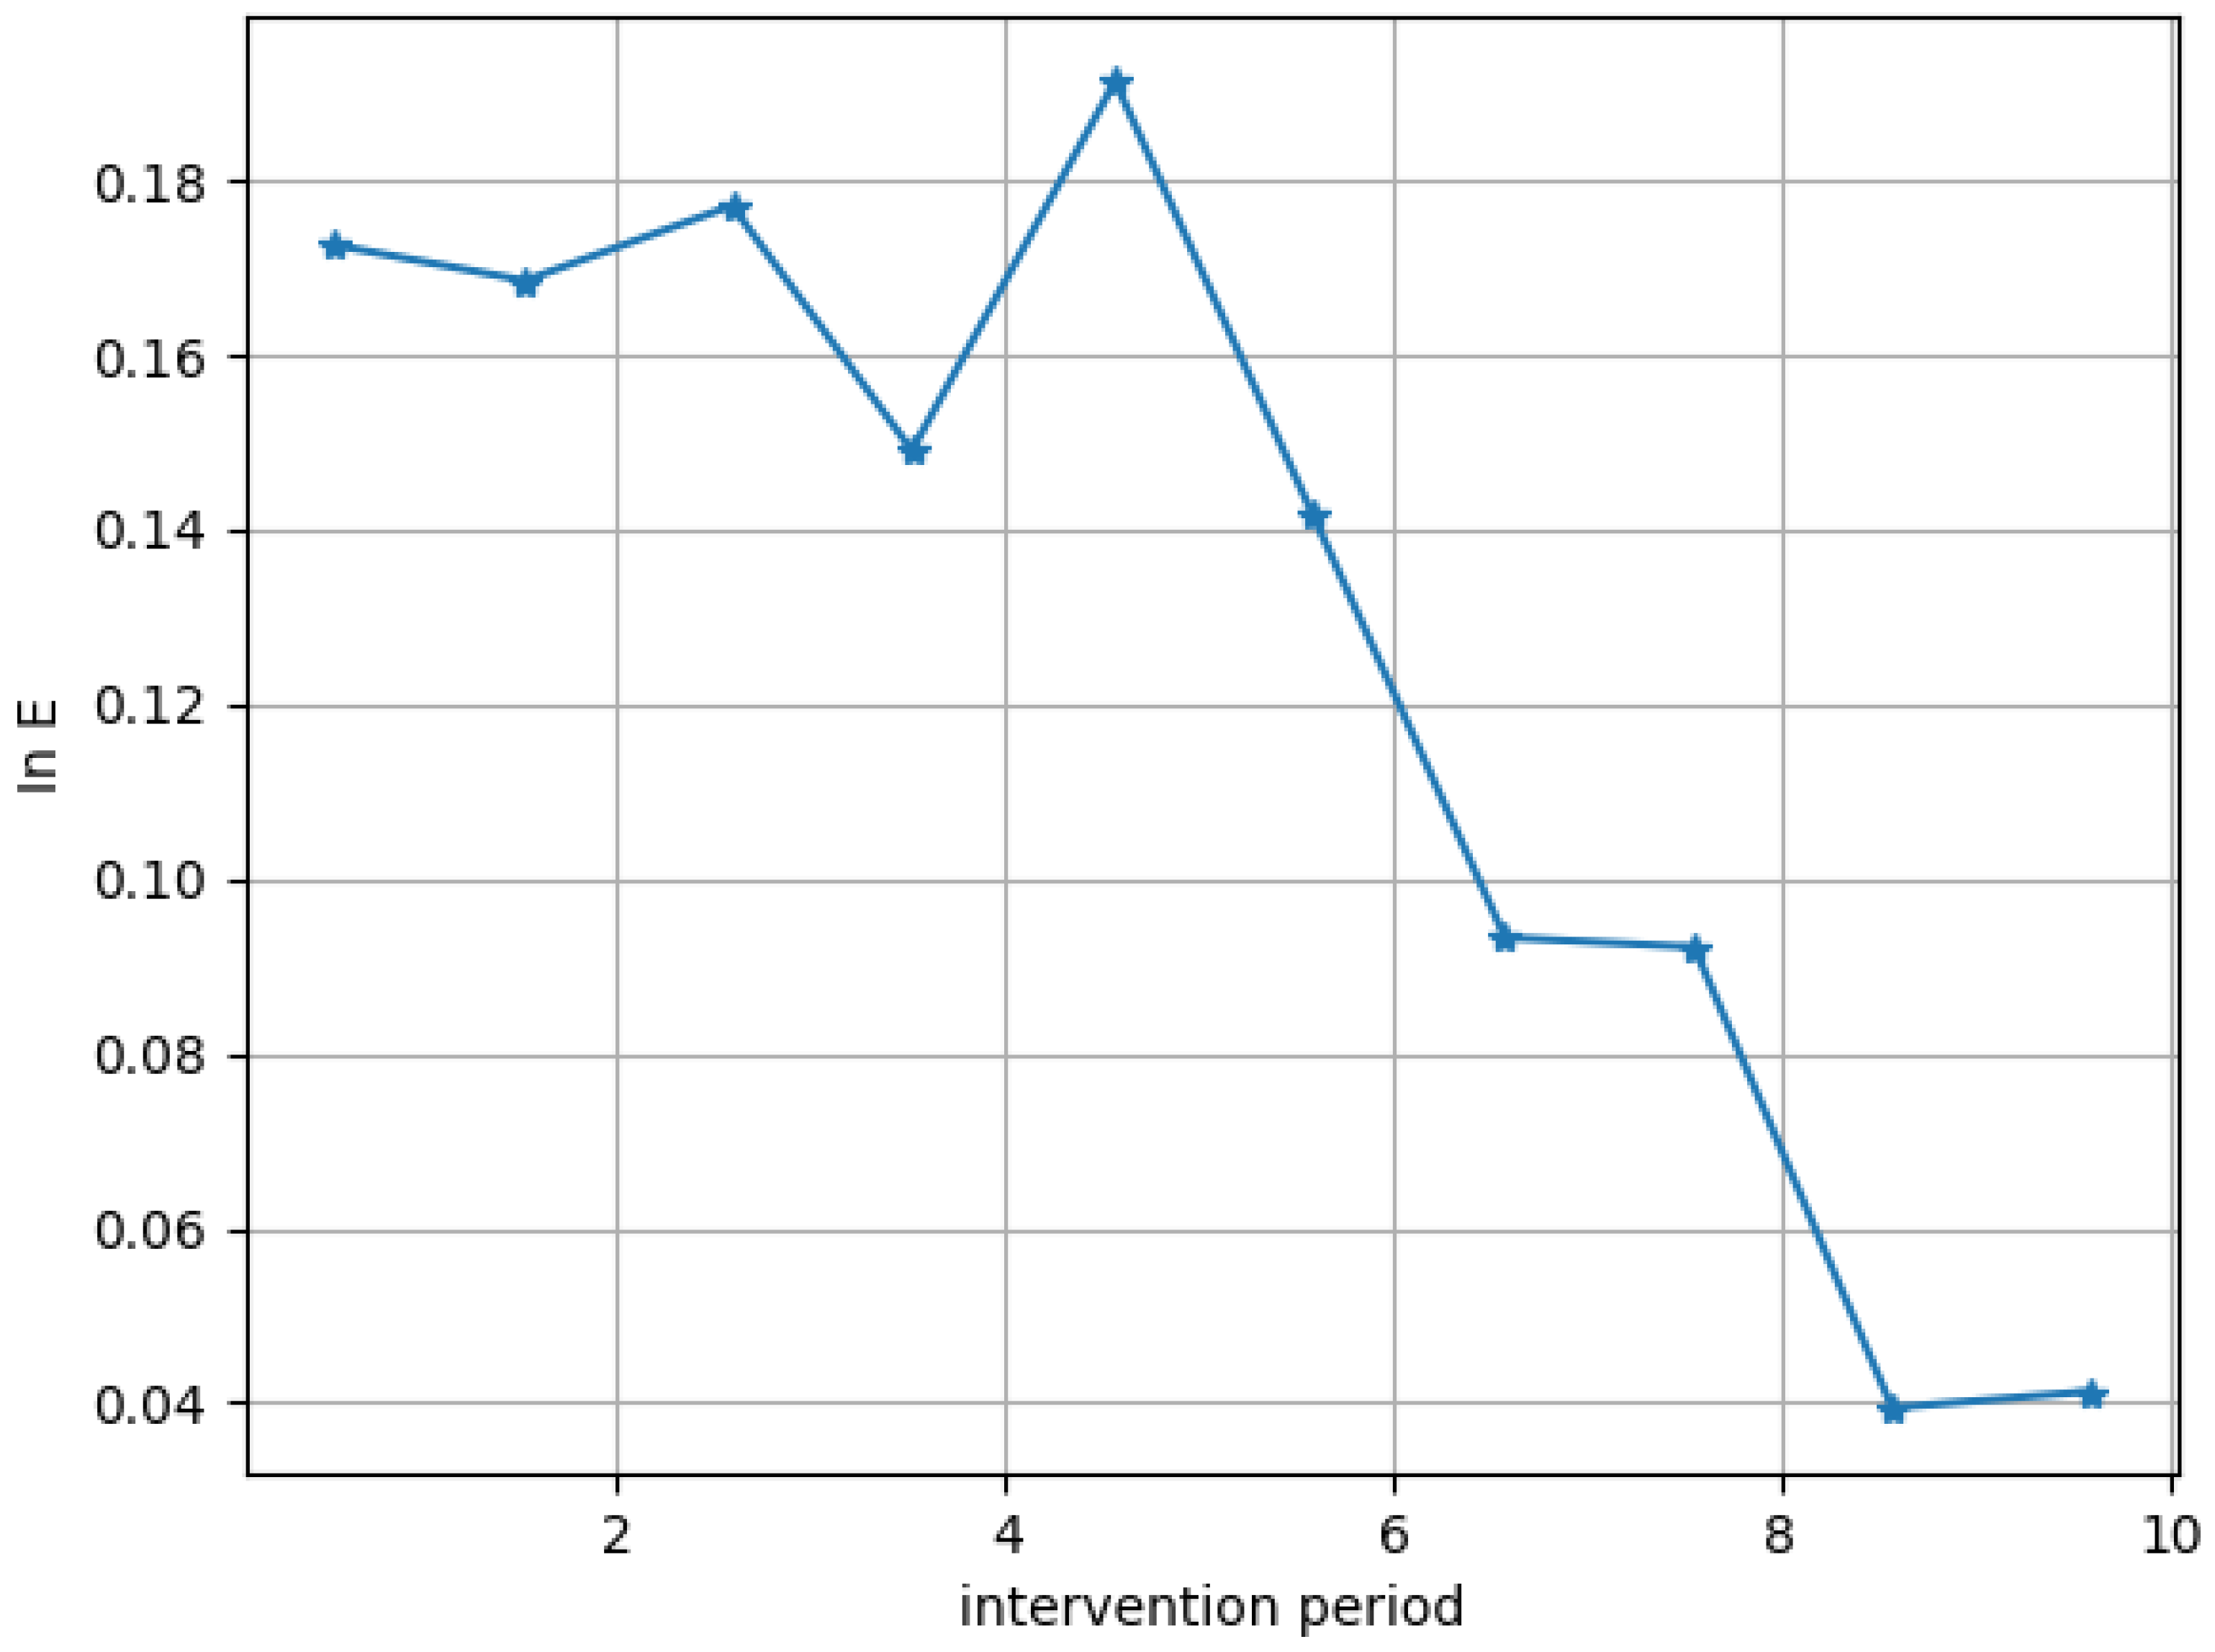
Parallel trend tests are counterfactual tests that ensure that the control and experimental groups share a common trend prior to the intervention. A common trend between the control group and the experimental group before the intervention is a necessary condition to ensure that the results of the exogenous and quasi-natural experiments are reliable. In this paper, the effect of the carbon trading pilot on carbon dioxide emissions is spread over the intervention periods, and the difference in carbon emissions between the experimental and control groups is observed in the six pre-intervention and three post-intervention periods. As shown in Figure 1, the difference in carbon emissions between the experimental group and the control group in the first six periods before the intervention is not significant, indicating that the hypothesis of parallel trends is satisfied before the intervention. Since the second period of the pre-intervention period, the experimental group started to show a slight downward trend in carbon dioxide emissions, which was due to the announcement of the carbon trading pilot list by the National Development and Reform Commission in 2011. Although the major carbon trading pilots have been listed for business since 2013, the possibility of market players adjusting their production patterns in advance in response to the policy direction cannot be ruled out. In the experimental group, carbon emissions decreased significantly compared with the control group during and three periods after the intervention, indicating that the carbon trading mechanism has a sustainable emission reduction effect. See Figure 3.
4.4. Emission Reduction Effect and Spatial Spillover Effect of Carbon Trading
In this paper, we used the SDID model to empirically study the effect of carbon trading rights on carbon dioxide emission reduction in China. As shown in Table 3, Model A1 uses the ordinary multi-period DID model; Model A2 uses the SEM model; and Model A3 uses the SAR model. Model A1 shows that the direct effect of the ETS (emission trading scheme) is −0.105, which is similar to the results of some empirical studies. The direct effect of the SEM model and SAR model is −0.064 and −0.093, respectively, which indicates that the direct effect of carbon trading is overestimated by ignoring the spatial dependence of carbon emissions. The SAR model also calculates the effect of surrounding areas on carbon emission reduction in the pilot area, and the indirect effect of ETS is −0.011 in model A3.
4.5. Transmission Paths of Carbon-Trading-Driven CO2 Emission Reduction
To further investigate the transmission mechanism and spatial characteristics of carbon trading pilot emission reduction, this paper uses the SAR model as the benchmark regression model to investigate the transmission mechanism. In the study of carbon trading policies, economic growth, industrial restructuring, and technological progress are considered to be important factors influencing carbon emissions. In this paper, the economic growth is represented by the regional GDP (G), the industrial scale is represented by the total industrial output value (I), and the technology level is represented by the science and technology expenditure () and the number of people employed in the research and technology services (). The impact of carbon trading on the above factors was first analyzed to determine the channels of emission reduction. The estimated results are shown in Table 4.
4.6. Robustness Tests
The estimated coefficients of the spatial econometric model are sensitive to the spatial weight matrix; so, the wrong spatial weight matrix may lead to endogeneity problems. To ensure the accuracy of the estimation results, the first-order distance inverse weight matrix and the second-order distance inverse weight matrix were used to verify the stability of the spatial model. The calculation results are shown in Table 5.
Table 5. Model D1 uses the first-order distance weight matrix and model D2 uses the second-order distance weight matrix. The results show that changing the form of the weight matrix has less influence on the estimation results, and the endogeneity problem caused by the spatial weight matrix is preliminarily excluded.
5. Discussion
With the development of the times, the once-crude economic development method is no longer in line with the current green development concept. While achieving economic development, China is paying more and more attention to the protection of the environment, trying to achieve a win–win situation for both economic development and environmental protection. In view of this, this paper examines the impact of carbon emission trading policy on green total factor productivity to provide data and theoretical support for the better realization of green development and the improvement in related policies. In this paper, capital, labor, and energy consumption were used as inputs, regional GDP was used as the expected output, industrial waste emissions were used as the non-expected output, and the GML index method was applied to measure the green total factor productivity of each province in China. The level of green development in China was analyzed from different perspectives. The relationship between carbon emission trading policy and green total factor productivity was analyzed empirically by constructing a DID model. After this, the transmission mechanism behind the effect of policy on green total factor productivity was further analyzed empirically using the mediating effect model. First, despite the disturbances from external factors (e.g., financial crises and changes in the economic development situation), the level of green TFP in China shows a steady increase. The level of green TFP varies among different regions, and the relatively developed regions in the east have higher green TFP levels compared with those in the central and western regions. Second, this paper empirically examined the relationship between carbon emission trading and green total factor productivity levels by constructing a DID model. The findings show that carbon emission trading, a market incentive-based regulatory policy, has a significant impact on China’s green total factor productivity and is catalytic. Third, the transmission mechanism of carbon emission trading policy that may act on green total factor productivity was explored via relevant theoretical analysis. According to the relevant theories, a series of mediating variables were introduced and the mediating effect model was applied to conduct an empirical test. The test results show that the carbon emission trading policy mainly enhances the level of green total factor productivity by stimulating productive agents to engage in technological innovation.
6. Conclusions
Since the 18th Party Congress, China’s green development level has entered the fast lane. The Party and the State attach great importance to environmental protection, and the related green development concept is deeply rooted in people’s hearts. In this paper, by exploring the emission reduction effect and the path of emission reduction effect of the carbon trading pilot in hotel tourism decarbonization in the context of the Internet, this paper considered the spatial dependence of CO2 emission and constructed a spatial double difference model based on the double difference model and spatial econometrics. The experiment shows that carbon trading has a spillover effect on CO2 emission reduction, that is, it promotes CO2 emission reduction in local and surrounding areas; it can promote CO2 emission reduction by promoting economic growth in pilot areas and surrounding areas; it has a better CO2 emission reduction effect and spillover effect in areas with larger industrial scale; and it can promote CO2 emission reduction by increasing the number of R&D personnel and decarbonizing the R&D investment in the pilot area and neighboring areas. The conclusions drawn from this paper can provide some policy suggestions for realizing the green development of hotel tourism and protecting the environment, and can provide data and theoretical support for the further construction of China’s carbon trading market.
Funding
This research received no external funding.
Institutional Review Board Statement
Not applicable.
Informed Consent Statement
Not applicable.
Data Availability Statement
The experimental data used to support the findings of this study are available from the corresponding author upon request.
Conflicts of Interest
The authors declare that they have no conflict of interest regarding this work.
References
- Umar, T. Greenhouse Gas (GHG) Emissions From Municipal Solid Waste (MSW) in Oman. Int. J. Soc. Ecol. Sustain. Dev. (IJSESD) 2022, 13, 1–26. [Google Scholar] [CrossRef]
- Umar, T. Frameworks for reducing greenhouse gas (GHG) emissions from municipal solid waste in Oman. Manag. Environ. Qual. Int. J. 2020, 31, 945–960. [Google Scholar] [CrossRef]
- Zhang, J.; Zhang, Y. Assessing the low-carbon tourism in the tourism-based urban destinations. J. Clean. Prod. 2020, 276, 124303. [Google Scholar] [CrossRef]
- Shih, H.Y.; Yao, Y.S. Indicators of low-carbon management in the leisure industry: Research using examples in Taiwan and China. Sustainability 2020, 12, 4326. [Google Scholar] [CrossRef]
- Li, J.; Mao, P.; Liu, H.; Wei, J.; Li, H.; Yuan, J. Key factors influencing low-carbon behaviors of staff in star-rated hotels—An empirical study of eastern China. Int. J. Environ. Res. Public Health 2020, 17, 8222. [Google Scholar] [CrossRef]
- Lee, T.H.; Jan, F.H. The low-carbon tourism experience: A multidimensional scale development. J. Hosp. Tour. Res. 2019, 43, 890–918. [Google Scholar] [CrossRef]
- Xie, X.; Zhang, W.; Pan, X.; Xie, L.; Shao, F.; Zhao, W.; An, J. CANet: Context aware network with dual-stream pyramid for medical image segmentation. Biomed. Signal Process. Control 2023, 81, 104437. [Google Scholar] [CrossRef]
- Wang, W.; Qiao, J.; Cheng, J.; Sun, Y.; He, W. Research on the impact of economic development of tourism industry based on low carbon mode. Int. J. Low-Carbon Technol. 2019, 14, 241–246. [Google Scholar] [CrossRef]
- Sung, P.L.; Hsiao, T.Y.; Huang, L.; Morrison, A.M. The influence of green trust on travel agency intentions to promote low-carbon tours for the purpose of sustainable development. Corp. Soc. Responsib. Environ. Manag. 2021, 28, 1185–1199. [Google Scholar] [CrossRef]
- Mishra, A.R.; Chandel, A.; Saeidi, P. Low-carbon tourism strategy evaluation and selection using interval-valued intuitionistic fuzzy additive ratio assessment approach based on similarity measures. Environ. Dev. Sustain. 2022, 24, 7236–7282. [Google Scholar] [CrossRef]
- Pongthanaisawan, J.; Wangjiraniran, W.; Chuenwong, K.; Pimonsree, L. Scenario planning for low carbon tourism city: A case study of NAN. Energy Procedia 2018, 152, 715–724. [Google Scholar] [CrossRef]
- Lee, S.H.; Wu, S.C.; Li, A. Low-carbon tourism of small islands responding to climate change. World Leis. J. 2018, 60, 235–245. [Google Scholar] [CrossRef]
- Yang, X.; Zhao, C.; Xu, H.; Liu, K.; Zha, J. Changing the industrial structure of tourism to achieve a low-carbon economy in China: An industrial linkage perspective. J. Hosp. Tour. Manag. 2021, 48, 374–389. [Google Scholar] [CrossRef]
- Long-Fei, C. Green certification, e-commerce, and low-carbon economy for international tourist hotels. Environ. Sci. Pollut. Res. Int. 2019, 26, 17965–17973. [Google Scholar]
- Pan, X.; Lin, H.; Han, C.; Feng, Z.; Wang, Y.; Lin, J.; Qiu, B.; Yan, L.; Li, B.; Xu, Z.; et al. Computerized tumor-infiltrating lymphocytes density score predicts survival of patients with resectable lung adenocarcinoma. iScience 2022, 25, 105605. [Google Scholar] [CrossRef]
- Wang, Q.; Mao, Z.; Xian, L.; Liang, Z. A study on the coupling coordination between tourism and the low-carbon city. Asia Pac. J. Tour. Res. 2019, 24, 550–562. [Google Scholar] [CrossRef]
- Chen, Z.; Chen, Q.Y. Energy use efficiency of Chinese enterprises: Heterogeneity, influencing factors and policy implications. China Ind. Econ. 2019, 48, 78–95. [Google Scholar]
- Ma, D.; Hu, J.; Yao, F. Big data empowering low-carbon smart tourism study on low-carbon tourism O2O supply chain considering consumer behaviors and corporate altruistic preferences. Comput. Ind. Eng. 2021, 153, 107061. [Google Scholar] [CrossRef]
- Xie, X.; Pan, X.; Shao, F.; Zhang, W.; An, J. Mci-net: Multi-scale context integrated network for liver ct image segmentation. Comput. Electr. Eng. 2022, 101, 108085. [Google Scholar] [CrossRef]
- Deng, F.; Fang, Y.; Xu, L.; Li, Z. Tourism, transportation and low-carbon city system coupling coordination degree: A case study in Chongqing Municipality, China. Int. J. Environ. Res. Public Health 2020, 17, 792. [Google Scholar] [CrossRef] [Green Version]
- Raffaelli, R.; Franch, M.; Menapace, L.; Cerroni, S. Are tourists willing to pay for decarbonizing tourism? Two applications of indirect questioning in discrete choice experiments. J. Environ. Plan. Manag. 2022, 65, 1240–1260. [Google Scholar] [CrossRef]
- Hsiao, T.Y. A study of the effects of co-branding between low-carbon islands and recreational activities. Curr. Issues Tour. 2018, 21, 529–546. [Google Scholar] [CrossRef]
- Li, Y.; Zhang, L. Ecological efficiency management of tourism scenic spots based on carbon footprint analysis. Int. J. Low-Carbon Technol. 2020, 15, 550–554. [Google Scholar] [CrossRef]
- Chang, S.H.; Hernández-Díaz, R.J.; Lo, W.S. The impact of low-carbon service operations on responsible tourist behavior: The psychological processes of sustainable cultural tourism. Sustainability 2020, 12, 4943. [Google Scholar] [CrossRef]
- Babakhani, N.; Lee, A.; Dolnicar, S. Carbon labels on restaurant menus: Do people pay attention to them? J. Sustain. Tour. 2020, 28, 51–68. [Google Scholar] [CrossRef] [Green Version]
- Khan, S.A.R.; Godil, D.I.; Yu, Z.; Abbas, F.; Shamim, M.A. Adoption of renewable energy sources, low-carbon initiatives, and advanced logistical infrastructure—An step toward integrated global progress. Sustain. Dev. 2022, 30, 275–288. [Google Scholar] [CrossRef]
- Buijtendijk, H.; Blom, J.; Vermeer, J.; van der Duim, R. Eco-innovation for sustainable tourism transitions as a process of collaborative co-production: The case of a carbon management calculator for the Dutch travel industry. J. Sustain. Tour. 2018, 26, 1222–1240. [Google Scholar] [CrossRef]
- Zhang, J.; Zhang, Y. Examining the energy literacy of tourism peasant households in rural tourism destinations. Asia Pac. J. Tour. Res. 2020, 25, 441–456. [Google Scholar] [CrossRef]
- Omune, B.; Kambona, O.; Wadongo, B.; Wekesa, A. Environmental management practices implemented by the hotel sector in Kenya. World Leis. J. 2021, 63, 98–108. [Google Scholar] [CrossRef]
- He, Y.; Huang, P.; Xu, H. Simulation of a dynamical ecotourism system with low carbon activity: A case from western China. J. Environ. Manag. 2018, 206, 1243–1252. [Google Scholar] [CrossRef]
- Liu, Q.; Browne, A.L.; Iossifova, D. A socio-material approach to resource consumption and environmental sustainability of tourist accommodations in a Chinese hot spring town. Sustain. Prod. Consum. 2022, 30, 424–437. [Google Scholar] [CrossRef]
- Han, M.; Liu, W.; Yang, M. Analysis of carbon risk transmission in energy-intensive industries in China under low carbon transition: Based on the implicit carbon linkage network perspective. Geogr. Res. 2022, 41, 79–91. [Google Scholar]
- Li, D.; Huang, H.; Zhang, L. Can the intensity of carbon trading regulation promote firms’ innovation investment?—The joint moderating effect of -CEO age and firm age. J. Cent. South Univ. 2021, 27, 17–31. [Google Scholar]
- Wang, W.; Wang, D.; Lu, N. A study on the mechanism of carbon emission trading for low-carbon technology innovation in China. China Popul. Resour. Environ. 2020, 30, 41–48. [Google Scholar]
- Xie, X.; Zhang, W.; Wang, H.; Li, L.; Feng, Z.; Wang, Z.; Pan, X. Dynamic adaptive residual network for liver CT image segmentation. Comput. Electr. Eng. 2021, 91, 107024. [Google Scholar] [CrossRef]
- Song, D.; Zhu, W.; Wang, B. Micro empirical evidence of carbon trading pilot covered enterprises in China: Carbon emissions trading, allowance allocation methods and corporate green innovation. China Popul. Resour. Environ. 2021, 31, 37–47. [Google Scholar]
- Zhang, T.; Wu, M.X.; Zhou, L.H. Does carbon emissions trading promote corporate investment efficiency?—A quasi-experiment based on a carbon emission trading pilot. Zhejiang Soc. Sci. 2022, 39–47, 157–158. [Google Scholar]
- Liao, Z.; Zhu, X.; Shi, J. Case study on initial allocation of Shanghai carbon emission trading based on Shapley value. J. Clean. Prod. 2015, 103, 338–344. [Google Scholar] [CrossRef]
- Wang, H.; Liu, H. Foreign direct investment, environmental regulation, and environmental pollution: An empirical study based on threshold effects for different Chinese regions. Environ. Sci. Pollut. Res. 2019, 26, 5394–5409. [Google Scholar] [CrossRef]
- Xie, X.; Pan, X.; Zhang, W.; An, J. A context hierarchical integrated network for medical image segmentation. Comput. Electr. Eng. 2022, 101, 108029. [Google Scholar] [CrossRef]
- Quan, L.; Zhang, M.; Zhao, F. A study on industrial green total factor productivity and its influencing factors in China—Based on global SBM directional distance function and SYS-GMM model. Ecol. Econ. 2019, 35, 39–46. [Google Scholar]
- Cheng, Z.; Li, X. Do raising environmental costs promote industrial green growth? A Quasi-natural experiment based on the policy of raising standard sewage charges. J. Clean. Prod. 2022, 343, 131004. [Google Scholar] [CrossRef]
- Liu, Y.; Tian, Y.; Luo, Y. Industrial structure upgrading, energy efficiency and green total factor productivity. Financ. Econ. Theory Pract. 2018, 39, 118–126. [Google Scholar]
- Xu, X.; Zhang, Z.; Chang, Z.; Lei, Z. Analysis of total factor productivity estimation and economic growth momentum by industry in China. World Econ. 2020, 43, 25–48. [Google Scholar]
- Bian, C.; Qin, Z.; Zhang, J.; Sun, M.; Gu, M.; Chen, K. Analysis of Adverse Pregnancy Outcomes of Pregnant Women with Syphilis and Maternal-Infant Serological Association in Changzhou, China, 2015–2019. Stem Cells Int. 2022, 2022, 12, 9673850. [Google Scholar] [CrossRef] [PubMed]
Figure 1.
Incentive operation mechanism for the decarbonization of the hospitality industry.

Figure 2.
Hotel CDM.

Figure 3.
Results of parallel trend test ().


Table 1.
Descriptive statistics of variables.
| Variable | Unit | Mean Value | Standard Deviation |
|---|---|---|---|
| million tons | 2188.19 | 2184.45 | |
| 0.02 | 0.16 | ||
| CNY billion | 1290.91 | 2225.77 | |
| % | 14.85 | 9.96 | |
| % | 38.75 | 12.94 | |
| CNY billion | 2165.47 | 3687.77 | |
| CNY billion | 33.06 | 60.63 | |
| people | 9787.83 | 33,036.25 | |
| million people | 434.82 | 376.52 |
Table 2.
Spatial autocorrelation test.
| Year | Global Moran Index of the Error Term | Lagrange Multiplier Test for the Error Term | Lagrangian Multiplier Test for the Lag Term |
|---|---|---|---|
| 2022 | 6.73 *** | 38.98 *** | 20.97 *** |
| 2021 | 6.71 *** | 37.78 *** | 20.86 *** |
| 2020 | 6.67 *** | 37.52 *** | 20.32 *** |
| 2019 | 6.62 *** | 37.13 *** | 20.21 *** |
| 2018 | 6.53 *** | 37.01 *** | 19.99 *** |
| 2017 | 6.45 *** | 36.97 *** | 19.97 *** |
| 2016 | 6.18 *** | 32.78 *** | 13.86 *** |
| 2015 | 6.14 *** | 32.52 *** | 14.32 *** |
| 2014 | 5.85 *** | 29.13 *** | 19.27 *** |
| 2013 | 5.56 *** | 26.53 *** | 10.98 *** |
| 2012 | 5.77 *** | 29.41 *** | 13.87 *** |
| 2011 | 5.95 *** | 31.59 *** | 13.38 *** |
| 2010 | 5.76 *** | 29.18 *** | 11.42 *** |
*** denote the rejection of the original hypothesis at 1% significance levels.
Table 3.
Baseline regression results.
| Dependent Variables | |||
|---|---|---|---|
| ETS direct effects | −0.106 *** (0.03) | −0.065 *** (0.025) | −0.092 *** (0.023) |
| ETS indirect effects | −0.011 *** (0.003) | ||
| ETS total effect | −0.104 *** (0.024) | ||
| Control variables | Yes | Yes | Yes |
| Time-fixed effects | Yes | Yes | Yes |
| City-fixed effects | Yes | Yes | Yes |
| 0.327 *** (0.022) | 0.111 *** (0.016) | ||
| 0.055 *** (0.001) | 0.057 *** (0.001) | ||
| Observed values | 5414 | 5414 | 5414 |
| 0.770 | 0.546 | 0.545 |
Note: The clustering robust standard errors are in parentheses; *** denote the rejection of the original hypothesis at 1% significance levels.
Table 4.
Impact of carbon trading on other factors.
| Dependent Variables | ||||
|---|---|---|---|---|
| ETS direct effects | −0.106 *** (0.033) | −0.011 *** (0.073) | −0.111 *** (0.075) | 0.198 *** (0.0368) |
| ETS indirect effects | 0.065 *** (0.022) | −0.037 *** (0.223) | −0.398 *** (0.274) | 0.025 *** (0.006) |
| ETS total effect | 0.173 *** (0.0554) | −0.052 *** (0.295) | −0.508 *** (0.352) | 0.222 *** (0.042) |
| Control variables | Yes | Yes | Yes | Yes |
| Time-fixed effects | Yes | Yes | Yes | Yes |
| City-fixed effects | Yes | Yes | Yes | Yes |
| 0.405 *** (0.008) | 0.806 *** (0.008) | 0.829 *** (0.006) | 0.111 *** (0.008) | |
| 0.124 *** (0.003) | 0.362 *** (0.006) | 0.396 *** (0.009) | 0.155 *** (0.002) | |
| Observed values | 5414 | 5414 | 5414 | 5414 |
| 0.875 | 0.677 | 0.545 | 0.569 |
Note: The clustering robust standard errors are in parentheses; *** denote the rejection of the original hypothesis at 1% significance levels. Model B1–B4 represents the effects of carbon trading on regional gross domestic product (), gross industrial product above the scale (), science and technology expenditure (), and the number of employees in research and integrated technical services (), respectively.
Table 5.
Spatial weight matrix test.
| Dependent Variables | ||
|---|---|---|
| ETS direct effects | −0.095 *** (0.023) | −0.101 *** (0.021) |
| ETS indirect effects | −0.012 *** (0.002) | −0.017 *** (0.003) |
| ETS total effect | −0.106 *** (0.024) | −0.115 *** (0.025) |
| Control variables | Yes | Yes |
| Time-fixed effects | Yes | Yes |
| City-fixed effects | Yes | Yes |
| 0.106 *** (0.015) | 0.118 *** (0.025) | |
| 0.055 *** (0.001) | 0.056 *** (0.001) | |
| Observed values | 5414 | 5414 |
| 0.544 | 0.543 |
Note: The clustering robust standard errors are in parentheses; *** denote the rejection of the original hypothesis at 10%, 5%, and 1% significance levels.
Disclaimer/Publisher’s Note: The statements, opinions and data contained in all publications are solely those of the individual author(s) and contributor(s) and not of MDPI and/or the editor(s). MDPI and/or the editor(s) disclaim responsibility for any injury to people or property resulting from any ideas, methods, instructions or products referred to in the content. |
© 2023 by the author. Licensee MDPI, Basel, Switzerland. This article is an open access article distributed under the terms and conditions of the Creative Commons Attribution (CC BY) license (https://creativecommons.org/licenses/by/4.0/).
Share and Cite
MDPI and ACS Style
Wang, L. Low Carbon Management of China’s Hotel Tourism through Carbon Emission Trading. Sustainability 2023, 15, 4622. https://doi.org/10.3390/su15054622
AMA Style
Wang L. Low Carbon Management of China’s Hotel Tourism through Carbon Emission Trading. Sustainability. 2023; 15(5):4622. https://doi.org/10.3390/su15054622
Chicago/Turabian StyleWang, Lei. 2023. "Low Carbon Management of China’s Hotel Tourism through Carbon Emission Trading" Sustainability 15, no. 5: 4622. https://doi.org/10.3390/su15054622
Note that from the first issue of 2016, this journal uses article numbers instead of page numbers. See further details here.