Article

Spatiotemporal Evolution of the Coupling Coordination Relationship of “Population–Environment” Development in the Xi’an Metropolitan Area

1
College of Architecture, Xi’an University of Architecture and Technology, Xi’an 710055, China
2
State Key Laboratory of Green Building in Western China, Xi’an 710055, China
3
School of Architecture and Urban Planning, Suzhou University of Science and Technology, Suzhou 215009, China
*
Author to whom correspondence should be addressed.
Sustainability 2023, 15(5), 4533; https://doi.org/10.3390/su15054533
Submission received: 15 November 2022 / Revised: 20 February 2023 / Accepted: 24 February 2023 / Published: 3 March 2023
(This article belongs to the Special Issue The Interactions between Urban Populations and Their Environments)

Abstract

:
In China, the metropolitan area is an important spatial carrier to promote high-quality urbanization as well as the coordinated development of large, medium, and small cities and regions. The environment is an important factor affecting the quality of life among urban populations, and anthropogenic activity significantly impacts the natural and built environments. Considering the Xi’an metropolitan area as a case study, we selected three subsystems across three cross-sections in 2000, 2010, and 2020: population agglomeration, natural ecological development, and urban environmental development. We used the entropy weight method, coupling the coordination model and correlation analysis to analyze the spatiotemporal patterns, coupling coordination relationship, and related development factors of the “population–environment” system. The results showed that the development of the “population–environment” system in Xi’an exhibits stratification and differentiation between the center, core, and periphery circles. The coupling coordination level of “population–environment” is slowly improving, while most districts and counties have been on the verge of incoordination. Furthermore, the coupling coordination relationship of each district and county could be further classified into five types. Accordingly, this paper discusses corresponding and differentiated strategies to promote the healthy and sustainable development of regional populations and the environment for districts and counties.

1. Introduction

The metropolitan area is an important vehicle for the spatial distribution of China’s urban population. In 2019, the National Development and Reform Commission of China (NDRC) issued the “Guidance on Fostering the Development of Modernized Metropolitan Areas,” emphasizing that the construction of modernized metropolitan areas is crucial for promoting high quality urbanization in China. The agglomeration of population from the regional hinterland to the core cities is an important process in the development of metropolitan areas. Changes also occur to the metropolitan area environment during this process. It is widely believed that population agglomeration will have a negative impact on the environment [1], such as the encroachment of natural space by large amounts of construction land and pollution by waste emission from urban production and living [2], as well as the urban heat island effect [3,4]. However, it has also become recognized that agglomeration promotes socio-economic development as well as the improvement of the urban built environment, enabling people to receive higher economic incomes and enjoy better public services. Simultaneously, studies have also shown that agglomeration generates scale effects which are beneficial to the environment to a certain degree [5]. Population agglomeration plays a significant role in the healthy and sustainable development of the urban environment.
Scholars have carried out rich research on the “population–environment” interaction relationship in rapidly urbanizing areas. Some scholars have studied the pressure on the natural ecological environment caused by rapid urbanization [6]. The classic Vigor-Organization-Resilience (VOR) framework was employed to devise the ecosystem health index (EHI) of the Kolkata megacity [7]. Based on the Spatial Durbin model, the influencing mechanisms of urban expansion on ecological environment quality have been studied, and it was proposed that land use sprawl had the greatest impact [8]. An inverted “U” relationship between urban population size and haze pollution was proposed by using the Kuznets curve analysis framework [9]. Some researchers have studied the population–environment system relationship from multiple perspectives, such as: the urban population agglomeration and ecological efficiency [10], the coupled coordination between urbanization and eco-environment [11], the sustainable development of population agglomeration and pollution emission [12], the coupling coordinated relationship between new-type urbanization and eco-environment [13], the coupling relationship between population modernization and eco-environment [14], the asymmetric nexus between urban agglomerations and environmental pollution [15], etc. These studies mostly focused on urban agglomerations, major river basins, metropolitan areas, etc., and carried out the evolution process on the time axis, as well as the analysis of influencing factors and driving mechanisms. They were based on system theory, sustainable development theory, ecological modernization theory, urban society-ecosystem (USEs) theory [16], etc. The research designed mostly adopted the method of establishing an evaluation system, selecting indicators, calculating their weights, and quantifying the development level of subsystems [17,18,19]. In the evaluation of the development level of natural ecosystems, the research methods also used the pressure–state–response (PSR) model [20], DEA model, super slack-based measure (super-SBM) model [21], the remote sensing ecological environment model index (RSEEI) model [22], etc. In the correlation analysis, the coupling coordination degree model (CCDM) [23], quantile-on-quantile regression quantile, etc., were adopted. In the study of coupling relationship, spatial network characteristics were included in the spatial network characteristics, and local coupling and tele coupling were studied [24]. In terms of influencing factor analysis methods, geographic detector method, Spearman correlation analysis, system dynamics model, and the back propagation artificial neural network (BPANN) [25] were applied. In terms of research data, it has changed from focusing on statistical data to including multiple types of data such as remote sensing data and meteorological data.
To summarize the existing research, there are some gaps. Existing studies mainly focused on the pressure effect of urban population on the environment, while the constraint effect of the environment on urban population was limited. Additionally, in the research, the natural environment and the built environment were mostly taken as a whole. However, there are different roles between the urban population and the natural and built environment. Therefore, coordinating the relationship between “population–natural environment–built environment” is the weak link of current studies. In addition, few scholars have used districts and counties as a research scale to study the “population–environment” coordination relationship in the development of metropolitan areas. The development of districts and counties within metropolitan areas varies greatly. Based on the overall study of metropolitan areas, it is valuable to carry out district- and county-scale studies for more accurate assessment of the development of metropolitan areas. Therefore, the coupling and coordination relationship between urban population and environment in metropolitan areas needs to be studied in depth. Xi’an Metropolitan is one of the seven national metropolitan areas approved by the NDRC, and is the only one in Northwest China. Since the implementation of the “Western Development” strategy by the central government in 2000, Xi’an has entered a stage of accelerated development, with increases in the agglomeration scale of its main urban area and strength of its economic ties with neighboring cities and counties. In 2006, the Shaanxi Provincial Government officially issued the “Shaanxi Provincial Urban System Plan,” in which the “Xi’an Metropolitan Area” was clearly defined from the perspective of government planning for the first time. The development of the Xi’an metropolitan area has been promoted from a top-down approach. In 2009, the State Council approved the implementation of the “Guanzhong–Tianshui Economic Zone Development Plan,” which had proposed, at the national strategic level, to build Xi’an metropolis as the core of the economic zone, which has a leading and radiating role in the western and northern inland areas. In 2018, the NDRC issued “The Development Plan for the Urban Agglomeration of the Guanzhong Plain,” which proposed to build a modern Greater Xi’an Metropolitan Area with international influence that drives the northwest and serves the country’s “Belt and Road” construction. In the process of continuous development of the Xi’an metropolitan area, problems have arisen, such as excessive population concentration in the center, unreasonable urban scale structure, unbalanced development of infrastructure and public service facilities, deterioration of air environment quality, and ecological damage in the northern foothills of the Qinling Mountains and the north bank of the Wei River [26]. Therefore, it is worth exploring the coupling and coordination relationship of the “population–environment” in the Xi’an metropolitan area. This study used the Xi’an metropolitan area as a case study and integrated it into a unified analysis and evaluation framework from the three aspects of population agglomeration, natural ecological environment, and urban built environment. We conducted spatial statistical analysis on historical cross-sectional data from 2000, 2010, and 2020, and explored the spatiotemporal evolution of the development of the three systems and their coupling coordination relationships. We also further identified the key factors responsible for coupling coordination of the “population–environment” system in different periods by using correlation analysis. The aim of this study was to provide a reference framework for analyzing the coordinated development patterns of population agglomeration and the urban environment at the district-scale and county-scale, and also to provide recommendations for promoting the coordinated development of the “population–environment” system in the Xi’an metropolitan area.

2. Materials and Methods

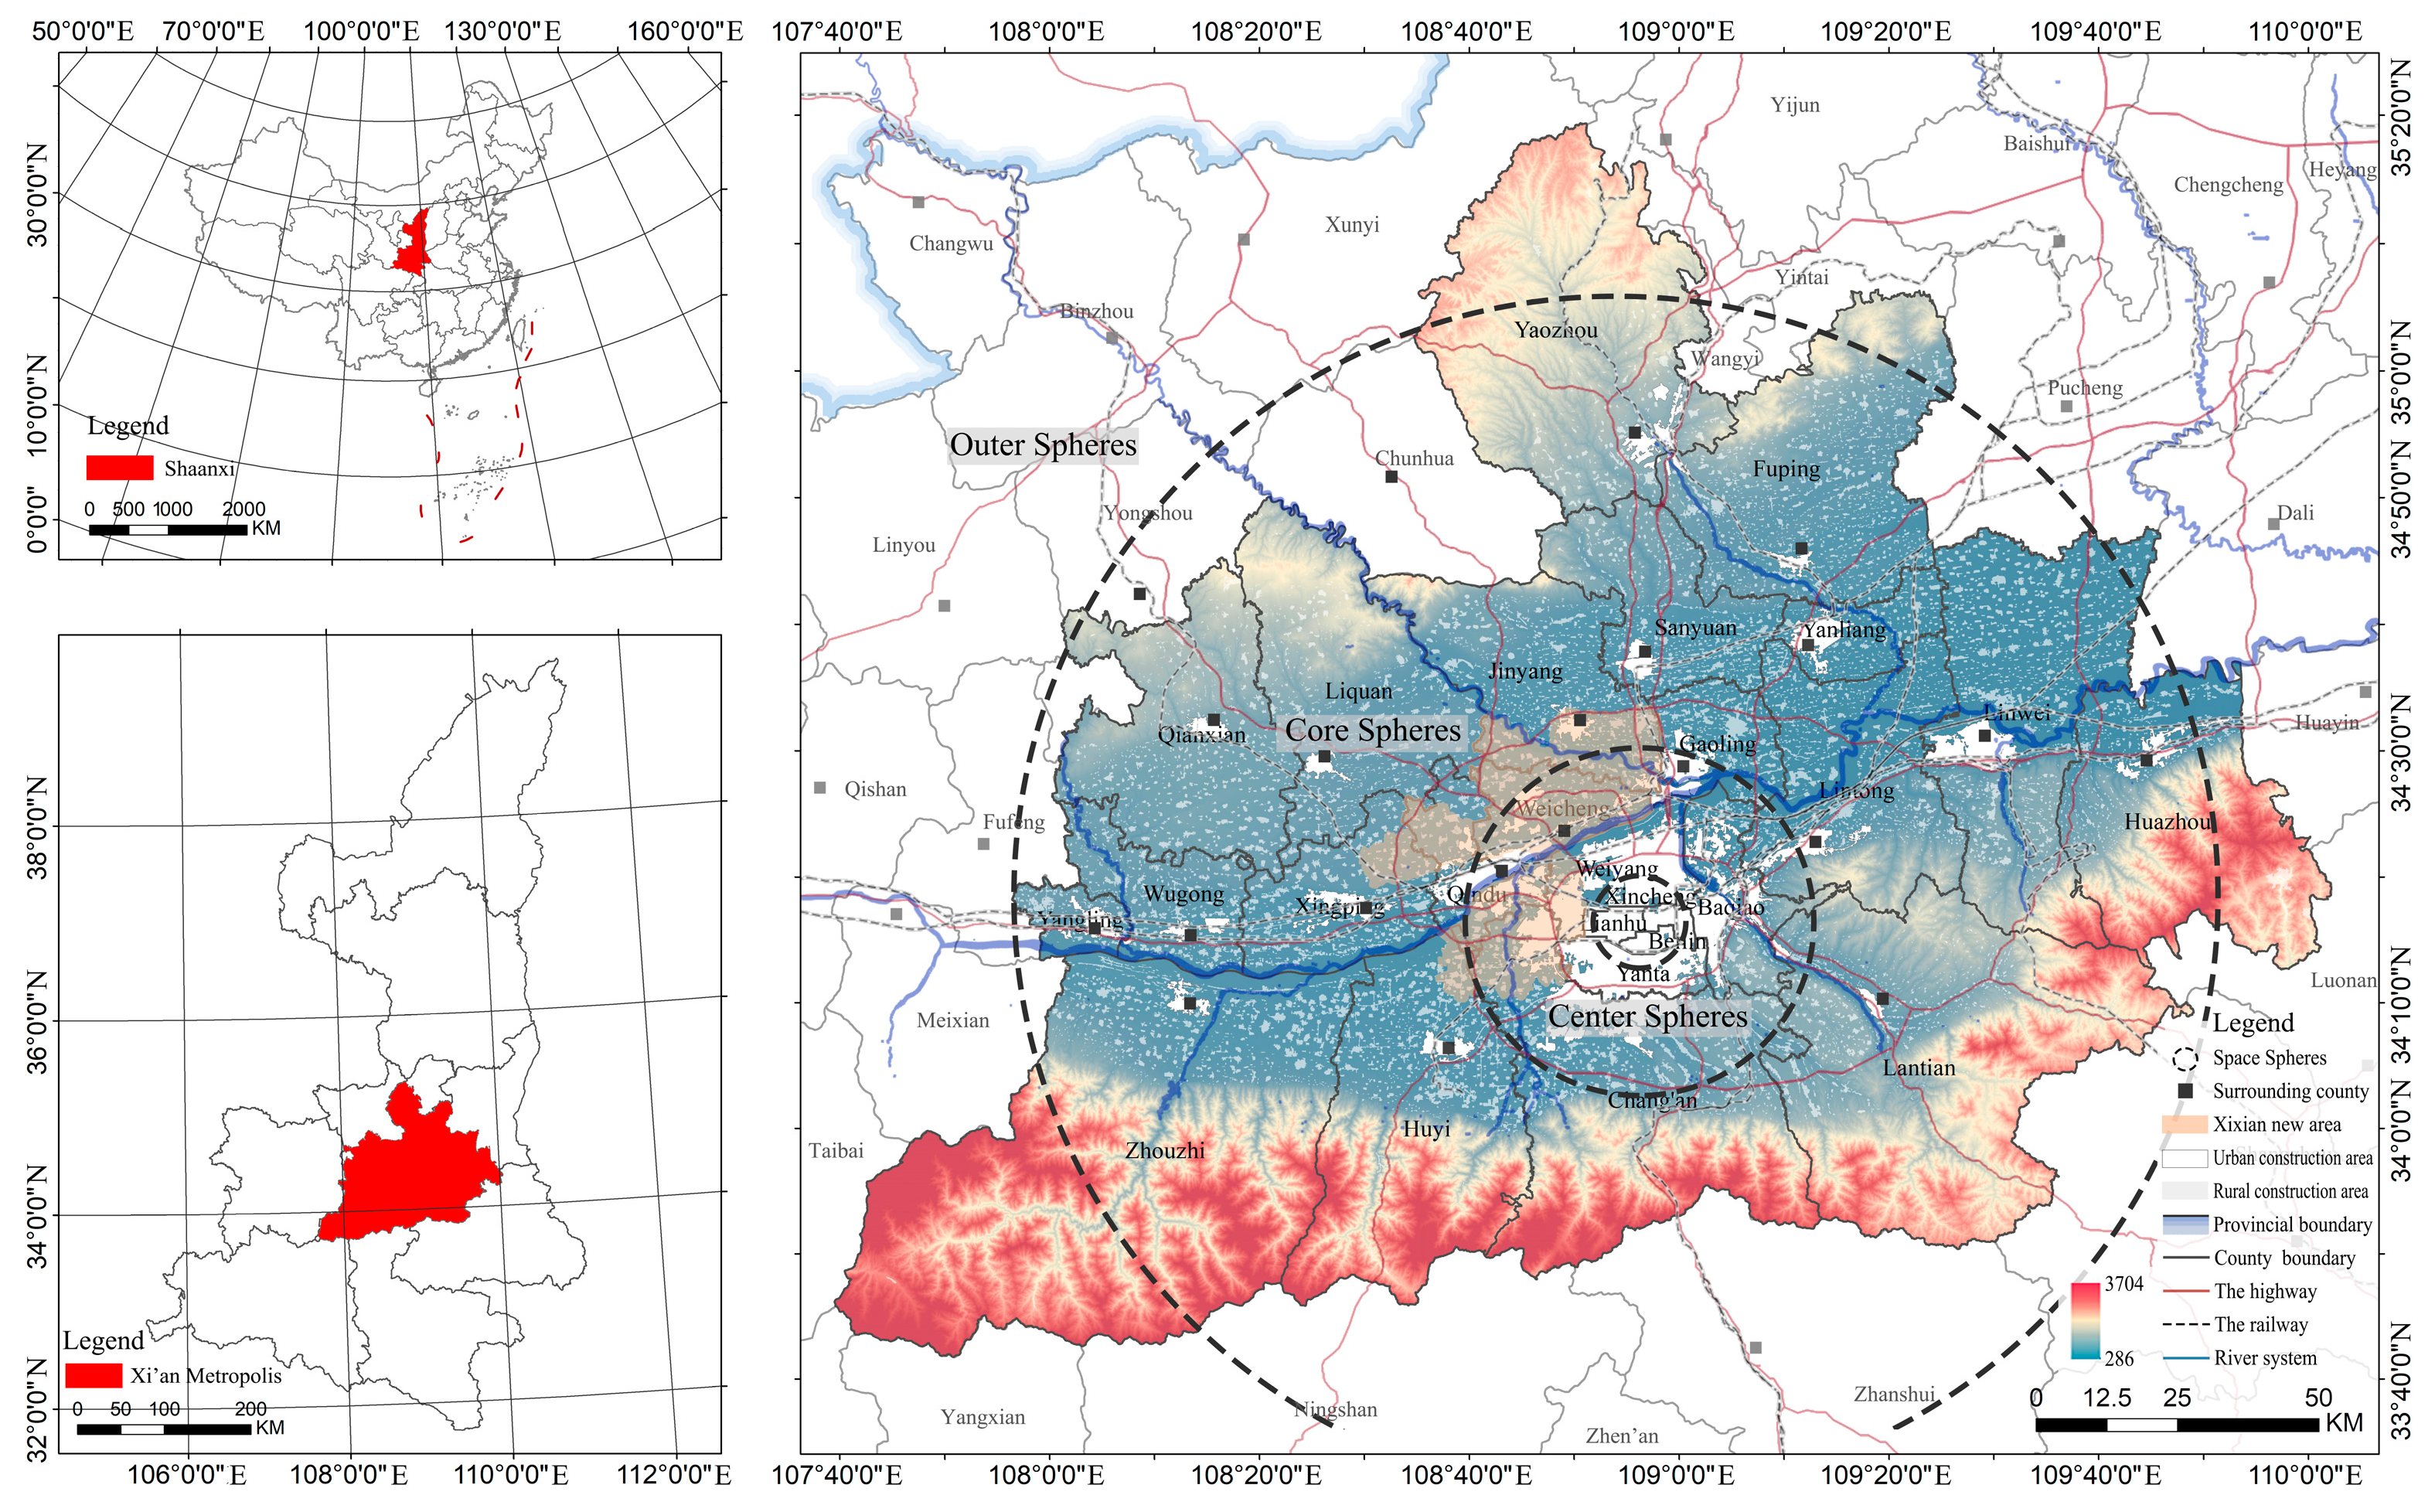
2.1. Research Region

Located in China’s Guanzhong Plain, with the Loess Plateau to the North and the northern foot of the Qinling Mountains to the South, the Xi’an metropolitan area is the most important comprehensive development center in Northwest China. It mainly includes the whole area of Xi’an City (including Xi’an New District), some counties (districts) of Xianyang City, Tongchuan City, and Weinan City, and the Yangling Agricultural High-tech Industry Demonstration Zone (see Figure 1). Based on the characteristics of the circled spatial structure of the metropolitan area, the Xi’an metropolitan area can be divided into the central circle, core area, and peripheral circle. The central circle covers three districts of Xi’an, including the Xincheng District, Beilin District, and Lianhu District. The core area covers seven districts in the main urban area and suburbs of Xi’an, Xianyang, and Weinan, including the Weiyang District, Yanta District, Baqiao District, Qindu District, Weicheng District, Gaoling District, and Chang’an District. The peripheral circle with a radius of approximately 120 km covers 15 districts and counties in the main urban area and suburbs of Xi’an, Weinan, and Tongchuan, with a total area of 2.06 km2 (Figure 1), including the Yanliang District, Lintong District, Huyi District, Lantian County, Zhouzhi County, Yaozhou District, Yangling District, Sanyuan County, Jingyang County, Qianxian County, Liquan County, Wugong County, Xingping County, Linwei District, Huazhou District, and Fuping County. As of the end of 2020, the Xi’an metropolitan area had a resident population of 18.02 million and a regional gross domestic product (GDP) of approximately 1.3 trillion RMB.

2.2. Data Sources and Preprocessing

The data consisted of three parts: temporal cross-sectional data of demographic and socio-economic statistics, remote sensing image data, and vector data of the study area for the individual years of 2000, 2010, and 2020. The demographic and socio-economic statistics were obtained from the official statistical yearbooks of Xi’an City (2001/2011/2021), Xianyang City (2001/2011/2021), Weinan City (2001/2011/2021), Tongchuan City (2001/2011/2021), and China County (2001/2011/2021), as well as local statistical bulletins. The temporal cross-sectional data of the remote sensing images for each of the three years (2000, 2010, and 2020) were obtained from the website of the Global Land Cover Data at a 30 m spatial resolution, and the meteorological raster data were obtained from the Climatic Research Unit Timeseries (CRU TS) official website. The surface temperature and aerosol image data were obtained from the Moderate Resolution Imaging Spectroradiometer Level 1B (MODIS 1LB) data of the National Aeronautics and Space Administration (NASA) Earth Data website. More specifics are shown in Table 1.
Linear interpolation was used in the case of missing individual indicators in the statistical data. The remote sensing land class images of the three temporal cross-sections were processed by projection, reclassification, cropping, and zoning statistics, etc., to obtain the distribution of farmland ecological patches on construction land in each region for each year. The meteorological data were subjected to waveband screening and interpolation analysis to obtain the climate change indicators of each region. Radiation correction, angular data correction, cloud detection, and other processes, were performed on MODIS 1LB raw data for inverting the surface temperature and annual aerosol optical depth (AOD) of days with the worst air quality in each region.
Due to differences in the dimensionality and magnitude of each selected indicator, the data values used were largely the per capita values, ground averages, and percentage ratios, while the min–max normalization method was used to normalize the input items for the indicator matrix without dimension. To eliminate the effect of zero or negative data values, an overall panning of the data was performed as follows:
r ij = { r ij Min ( r ij ) Max ( r ij ) Min ( r ij ) + A   when   r ij   was   a   positive   indicator Max ( r ij ) r ij Max ( r ij ) Min ( r ij ) + A   when   r ij   was   a   negative   indicator
where, r ij represents the j-th indicator of the i-th regional object in that year, r ij represents the standardized data processing result of r ij , Max(rij) and Min(rij) are the maximum and minimum values of the j-th indicator in all the regions in each year, respectively, and the A value is the panning magnitude. To preserve the differences and uncertainty of data among the original data effectively, this study considered the value of A to be 0.001.

2.3. Research Methods

2.3.1. Evaluation Index of “Population–Environment” Development

We constructed a comprehensive index system to explore the coupling coordination relationship between population agglomeration and environmental development in the Xi’an metropolitan area. The indicators were selected mainly based on the following three criteria: (1) having full leverage on existing studies, (2) incorporating core elements affecting the metropolitan environment, (3) and considering the availability of data. Compared with the existing research, in order to fully reflect the interaction between population and environment in the development of metropolitan areas, this process constructed the coupling system from three aspects: the population agglomeration, the natural ecological environment, and the built environment.
The evaluation indicators for the level of population agglomeration were selected from the two aspects of urbanization of the population and urban–rural differences. The higher the urbanization level and urban disposable income, the higher the degree of population agglomeration, and the stronger the agglomeration dynamics; these were used as positive indicators. The larger the construction land area per capita, the less intensive the spatial development, and the larger the resident population density and urban–rural disposable income ratio, therefore, the more prominent the imbalance between interregional development and urban and rural development [27]; all of these were used as negative indicators.
The evaluation indicators for the level of development of the natural ecological environment were selected from the two aspects of ecological development potential and changes in environment climate. The afforestation area in the current year and fractional vegetation cover reflected the ecological service potential of natural space [28]. In addition, considering the ecological service function of farmland, especially that of paddy fields [29], we also included the two indicators of the proportion of farmland patch area and the effective irrigation area of farmland for evaluating ecological development potential. The Xi’an metropolitan area is located in a warm–temperate semi-humid continental monsoon climate zone, where annual precipitation and potential transpiration contribute to the development of the natural environment. In the context of global warming and the haze problem accompanying the rapid development of China, the annual maximum temperature and the AOD of days with the worst day of air quality [30,31] were included as negative indicators.
The evaluation indicators for the level of development of the social built environment were selected from the two aspects of the facility service level and the economic growth level. The service level of educational facilities, medical facilities, and parks and green areas are commonly used indicators for measuring the facility service level [32,33]. Combining the development trend in “secondary schools and high schools moving into towns and cities” in each district and county of the Xi’an metropolitan area, the distribution density of secondary education schools was selected as the service level indicator of education facilities. Considering the economic growth level, we selected four commonly used indicators: GDP per capita, the proportion of secondary and tertiary industries in GDP, total retail sales of social consumption, and urban disposable income [34]. Among them, the higher share of the secondary industry in GDP represented a larger proportion of space in the built environment used as industrial production and higher potential pollution pressure, and it was used as a negative indicator.
The final “population–environment” development index system comprised 21 secondary indicators, which are listed in Table 2 in the next section.

2.3.2. Evaluation of “Population–Environment” Development Index

To determine the weight of each indicator in the “population–environment” development index, this study uses the entropy weight method, which incorporates useful information in the data to reflect the weightage of attributes; in case of differences in the factors represented by a certain index, more useful information can be provided. Index weights by the entropy method have been widely used in related studies in various disciplines [35,36]. The relevant studies [37,38] used the entropy weight method to assign indicator weights in the coupling analysis of metropolitan area environment coordination. The results are listed in Table 2, and the detailed steps for calculating the weights of each indicator are as follows:
  • The evaluation indicator matrix is constructed based on the j-th population and environment index factor for the i-th regional object:
R = [ r 11 r j 1 r i 1 r i j ]
2.
The index value proportion of the i-th regional object to the j-th index is calculated as follows:
P i j = r i j i = 1 n r i j ,   i = 1 , 2 , 3 , , n
3.
The entropy value of the j-th index is calculated as follows:
E j = k i = 1 n P i j × l n P i j ,   i = 1 , 2 , 3 , , n
where k = 1/lnm, and n is used to evaluate the number of regional objects 0 ≤   E j ≤ 1;
4.
After determining the entropy values, the various weights impacting the index are calculated as follows:
W j = 1 E j j = 1 n ( 1 E j )   , j = 1 , 2 , 3 , , n
where W j represents the weight of the j-th index, 0 ≤   W j   ≤ 1, and the sum of the W j values of the various indices equal to 1.
Table 2. Indicator system and weights of “population–environment” development.
Coupling SystemTier 1 IndicatorsTier 2 IndicatorsUnitDirectivityTier 2 Weighting (%)
Population agglomerationLevel of urbanization of the populationUrbanization rate x 1 %+4.61
Resident population density x 2 Per capita km20.78
Per capita construction land area x 3 Per capita m21.60
Urban–rural disparity levelUrban disposable income x 4 Yuan+1.88
Urban–rural disposable income ratio x 5 2.70
Natural environmentEcological development potentialAfforestation area in the current year a 1 Mu+11.46
Fractional vegetation cover (FVC) a 2 +8.91
Effective irrigated area of farmland a 3 10,000 Mu+6.88
Proportion of farmland patch area a 4 %+2.15
Changes in climate conditionsAnnual rainfall a 5 mm+1.80
Potential transpiration a 6 mm/d+1.49
Annual maximum temperature a 7 Degree Celsius3.31
Aerosol Optical Depth (AOD)of days with the worst air quality a 8 3.69
Built environmentFacility service levelPer capita forest park green area b 1 Per capita m2+13.97
Distribution density of secondary education schools b 2 Unit/km2+13.42
Number of hospital beds per 10,000 persons b 3 Unit/10,000 persons+4.05
Number of medical institutions per 10,000 persons b 4 Unit/10,000 persons+4.63
Economic growth levelPer capita GDP b 5 Yuan+4.48
Growth rate of total retail sales of social consumption b 6 %+3.96
Proportion of secondary industry in total GDP b 7 %2.02
Proportion of tertiary industry in total GDP b 8 %+2.22

2.3.3. Coupling Coordination Degree Model

The coupling coordination degree model is one of the two main methods used to study the interaction efficiency and coordination level of two or more systems. The coupling degree model of “population–environment” development in this study is composed of two parts: the coupling degree and coupling coordination degree models. The calculation steps are as follows:
  • The “population–environment” system comprehensive development evaluation index of each district and county in the metropolitan area is calculated as follows:
F ( x ) = j = 1 n W j x i j   , j = 1 , 2 , 3 , , n
G ( a ) = j = 1 n W j a i j   , j = 1 , 2 , 3 , , n
H ( b ) = j = 1 n W j b i j   , j = 1 , 2 , 3 , , n
T = α F ( x ) + β G ( a ) + γ H ( b )  
where F(x) is the comprehensive development level of the population agglomeration system, G(a) is the comprehensive development level of the natural environment, and H(b) is the comprehensive development level of built environment. x i j , a i j , and b i j represent the standardized indices of the F, G, and H systems of certain regional objects. α, β, and γ are the contribution of population agglomeration, the natural ecological environment, and the built environment, respectively. α, β, γ > 0 and α + β + γ = 1. T is the comprehensive development evaluation index of a certain regional object.
2.
The coupling value of the “population–environment” system of each district and county in the metropolitan area is calculated as follows:
C = { F ( x ) × G ( a ) × H ( b ) [ F ( x ) + G ( a ) + H ( b ) 3 ] 3 } 1 3
The values for coupling degree C ranges from 0 to 1, and the closer C is to 1 the greater the coupling degree of the various systems. The closer C is to 0 the lower the coupling degree of the various systems. The division of the coupling state was based on Xiong et al. [39] (as shown in Table 3).
3.
The coupling coordination value of the “population–environment” system of each district and county in the metropolitan area is calculated as follows:
D = C × T 3
where D is the coupling coordination degree, C is the coupling degree, and T is the comprehensive evaluation index of a regional object. With reference to the study of Song et al. [40], we divided the level of coupling coordination into 10 types (as shown in Table 4).

3. Results

3.1. Analysis of Evaluation Index Weights in the “Population–Environment” System

In the systematic evaluation of the degree of population agglomeration, the urbanization rate (4.61%) and urban–rural disposable income ratio (2.70%) were the two indicators with relatively higher weighting. This shows that the urbanization of the Xi’an metropolitan area was still rapidly developing, and that there were huge differences in the urbanization level and growth rate among the districts and counties in the metropolitan area; the structural problem of urban–rural dualistic development in the metropolitan area remained prominent.
In the evaluation of natural ecological environment development, the afforestation area in the current year (11.46%), fractional vegetation cover (8.91%), and effective irrigated agricultural land area (6.88%) were the three indicators with relatively higher weighting. This may reflect that there were huge changes in the quantity and spatial distribution of the natural ecological environment in the metropolitan area over the past 20 years, and, in addition, it may also reflect differences in the degree of improvement in agricultural irrigation conditions among the various districts and counties.
In the evaluation of the development of the built environment in towns and cities, the per capita forest green area (13.97%) and distribution density of secondary education schools (13.42%) were the two indicators with relatively higher weighting, which may spatially and temporally reflect that there were relatively large differences in the distribution of per capita park green land and educational facilities among districts and counties.

3.2. Spatiotemporal Patterns of the “Population–Environment” System

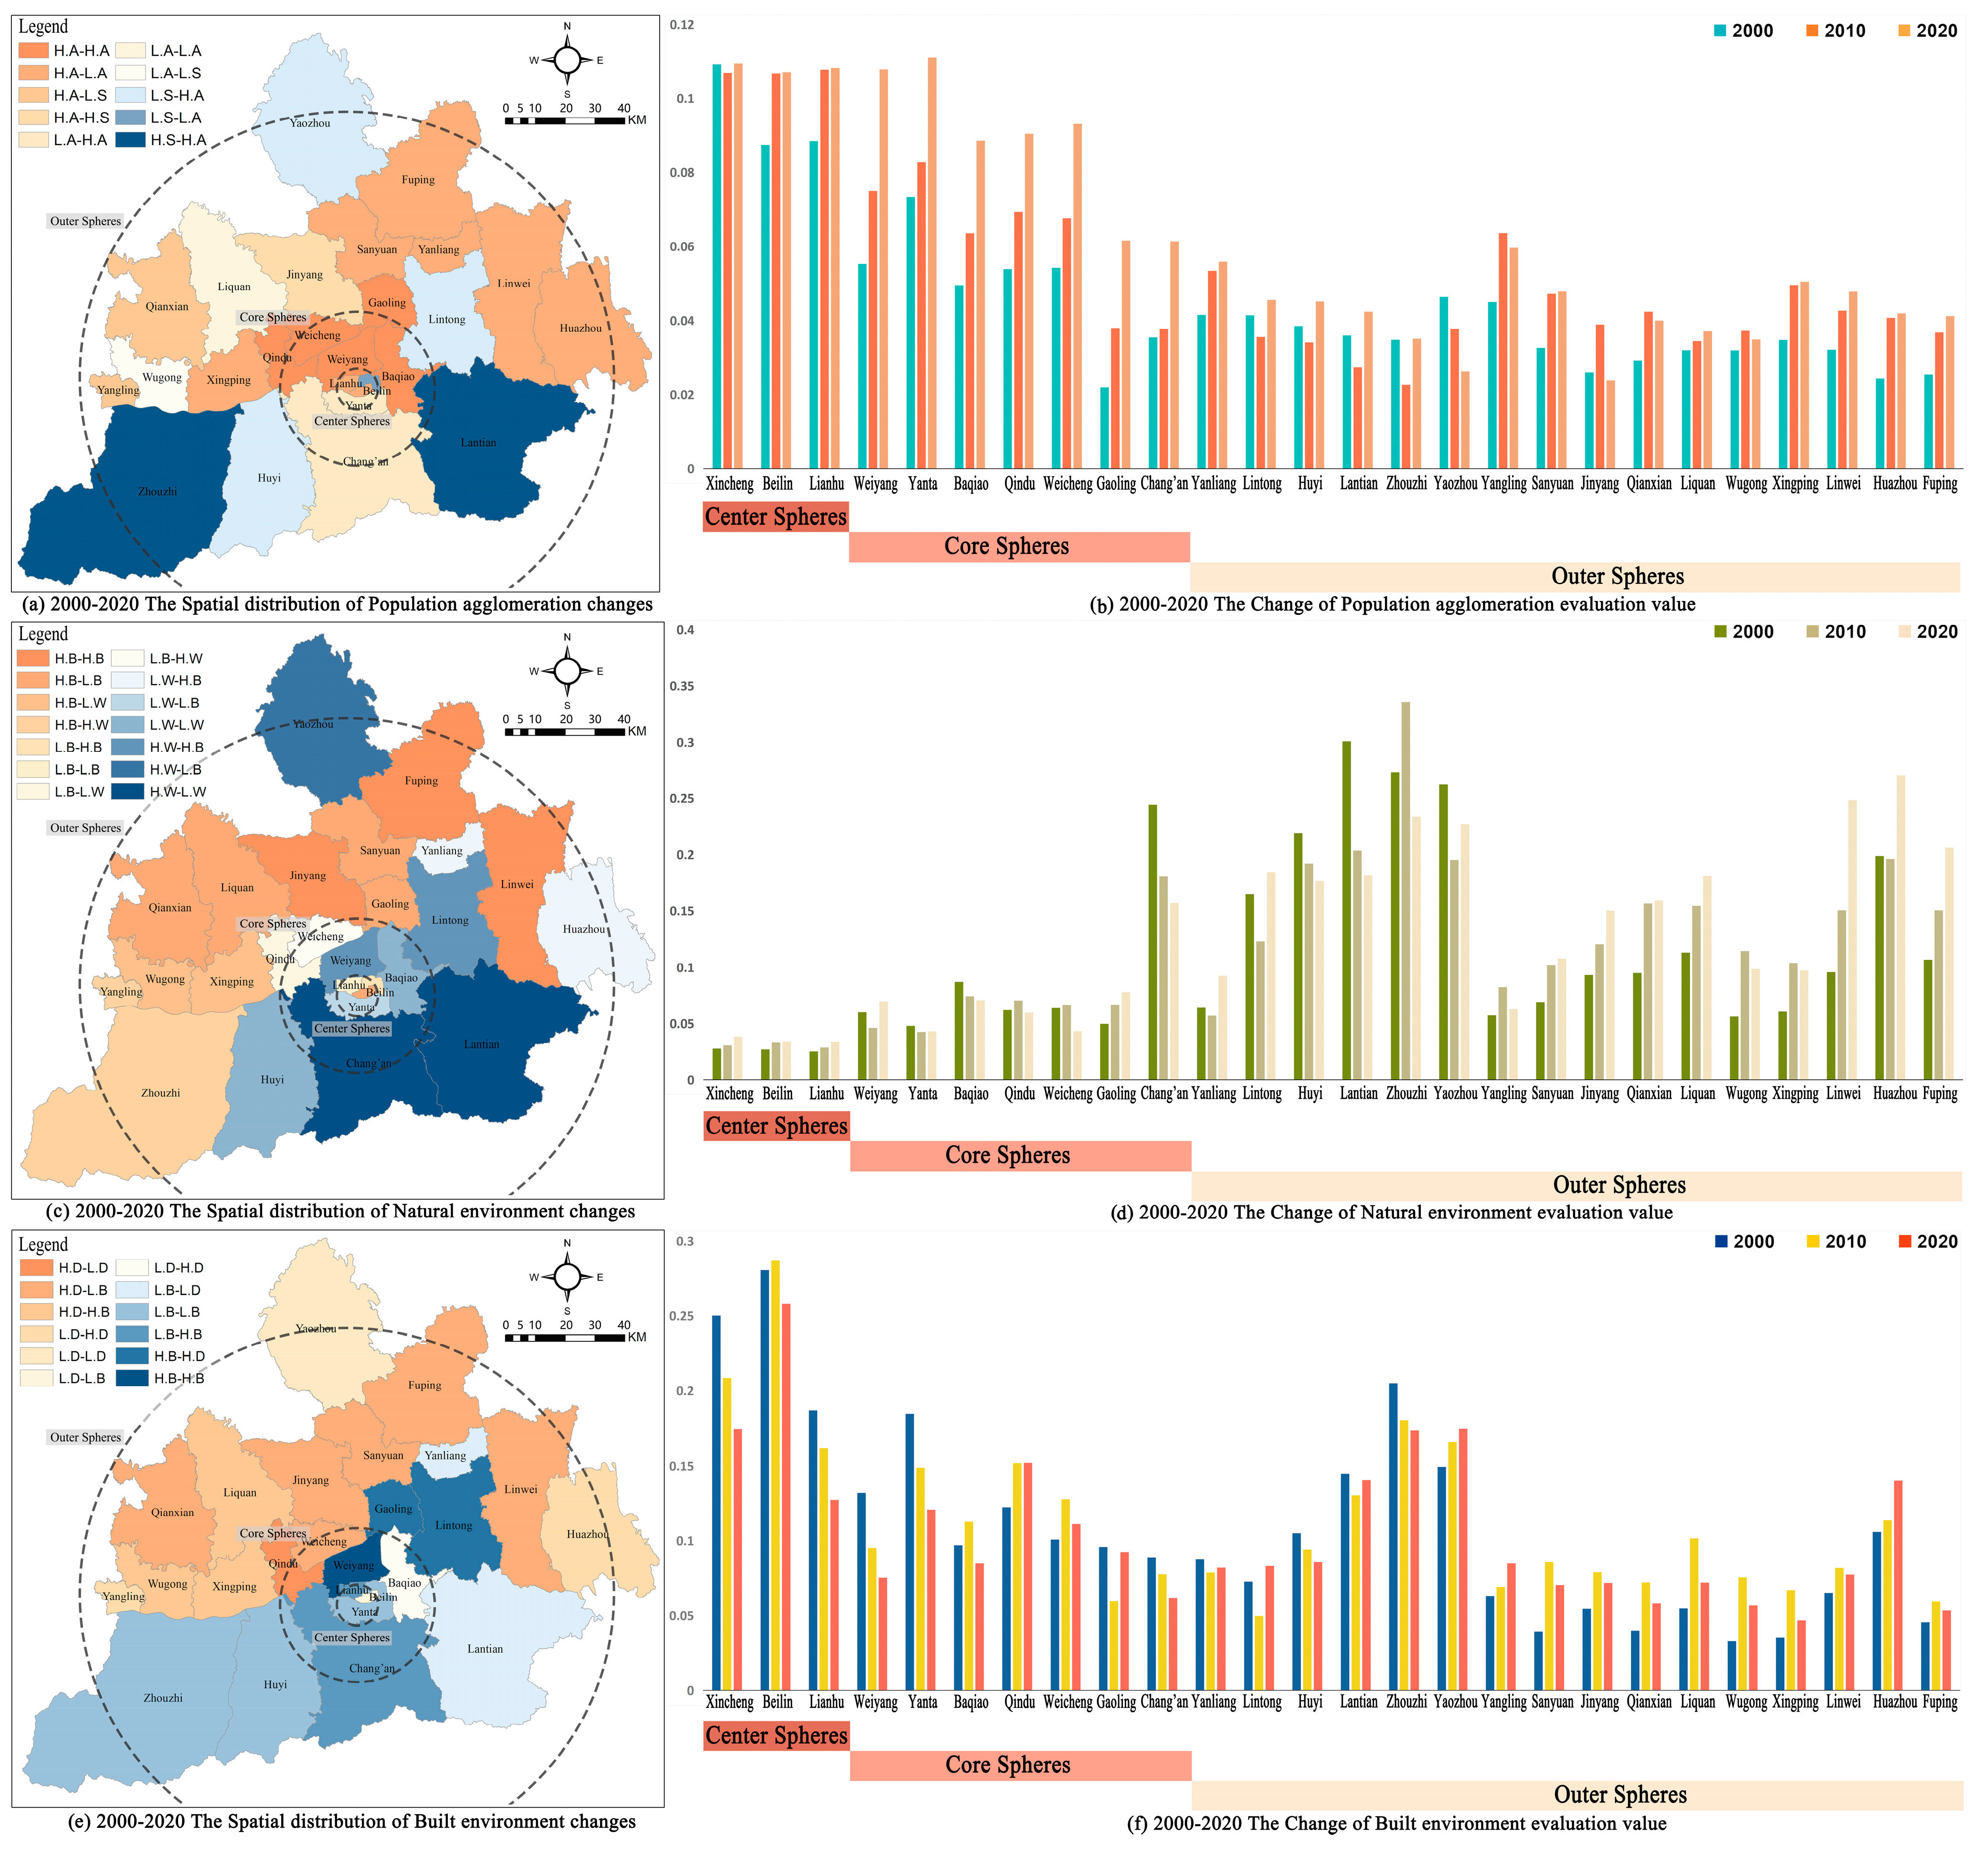
3.2.1. Spatiotemporal Patterns of Population Agglomeration

In describing the process of change in the degree of population agglomeration, we used “agglomeration” (A) and “loss” (S) to describe the process of population change, and “large” (H) and “small” (L) for the magnitude of population change (see Figure 2a,b). Among the districts and counties in the Xi’an metropolitan area, except for Yaozhou District and Jingyang County in the north, population agglomeration showed an overall growth trend. The three districts in the central circle, including Xincheng District, Beilin District, and Lianhu District, have always maintained the highest level of agglomeration in the metropolitan area, coupled with stable development. Weiyang District in the northern part, and Baqiao District in the eastern part of the core circle each showed a continuous and significant agglomeration (HA), whereas Yanta and Chang’an districts in the southern part showed an increase from small agglomeration (LA) to significant agglomeration (HA). By 2020, the agglomeration levels of Weiyang and Yanta districts were already equal to or slightly higher than those of the districts in the central circle. Among the counties in the peripheral circle of the metropolitan area, seven districts and counties including Xingping County, Fuping County, and Huazhou District, which are distributed along “The Longhai Railway and Lianhuo Expressway traffic corridor” on the east–west and “The Xiyan Expressway and Baumao Expressway corridor” on the north–south, had a better population agglomeration trend than other counties, showing a change from large agglomeration (HA) to small agglomeration (LA), and maintained a moderate agglomeration level in the metropolitan area. The four counties on the northwest side near the northern Wei plateau, including Jingyang and Qianxian, showed a shift from agglomeration to loss. Three districts and counties in the south, including Zhouzhi County near the northern foot of the Qinling Plateau and Lintong District in the east near Lishan Mountain, showed a shift from loss to significant agglomeration (HA).

3.2.2. Spatiotemporal Patterns of Natural Ecological Environment Changes

In describing the change process in the level of the natural ecological environment, we used “better” (B) and “worse” (W) to describe the process of changes in the environment, and “large” (H) and “small” (L) to describe the magnitude of changes in the natural environment (see Figure 2c,d). Overall, the spatial distribution of the natural ecological environment development index of each district and county in the Xi’an metropolitan area was significantly different. The development index of each district in the central circle was generally low, but remained in a slightly better (LB) optimized state. The development index of each district in the core circle (except Chang’an District) was slightly higher than that of the central circle, whereas the development index of the Chang’an District was significantly higher than that of other districts and counties. Among them, Weiyang and Yanta districts showed a change from worse to better, Qindu and Weicheng districts showed a change from better to worse, whereas Baqiao and Chang’an districts on the southeast side showed a continuous small deterioration (LW). The development indices of the districts and counties in the outer circle remained at a moderate level within the metropolitan circle. The districts and counties in the northwest, north, and northeast showed a positive status of continuous improvement, whereas Yangling District, Wugong County, and Xingping County in the west changed from substantial improvement (HB) to a substantial or small deterioration in an overall relatively low development index situation. Zhouzhi County and Wanyi District in the south, which are near the Qinling Mountains, had a high development index level, but showed a continuous negative substantial or small development turning to bad.

3.2.3. Spatiotemporal Patterns of Urban Built Environment Changes

In describing the change process in the level of the urban built environment, we used “development” (D) and “regression” (B) to describe the change process in the urban environment, and “large” (H) and “small” (L) to describe the magnitude of change in the urban environment (see Figure 2e,f). The magnitude in the differences between districts and counties in the urban built environment development index of the Xi’an metropolitan area was smaller than that of the previous two systems. The development index of each district in the central circle was higher, but showed a small regressive (LB) development process. The development index of each district in the core circle was at the intermediate level, showing small fluctuating changes in different trends. Among the districts and counties in the peripheral circle, those at the northern foots of the Qinling and Huashan mountains had high built environment development indices, whereas most districts and counties along the Wei River and the northern bank had relatively low development indices. The development indices of Yaozhou, Huazhou, and Yangling districts continued to improve, whereas those of the Qianxian, Liquan, and Fuping counties in the northwest and north showed a shift from development to regression. Lintong and Yanliang districts in the northeast fluctuated between small development and regression, whereas Lantian and Zhouzhi counties in the south, which are close to the Qinling Mountains, had a high level of development but showed small regression (LB).

3.3. Spatiotemporal Patterns and Coupling Relationship in the “Population–Environment” System

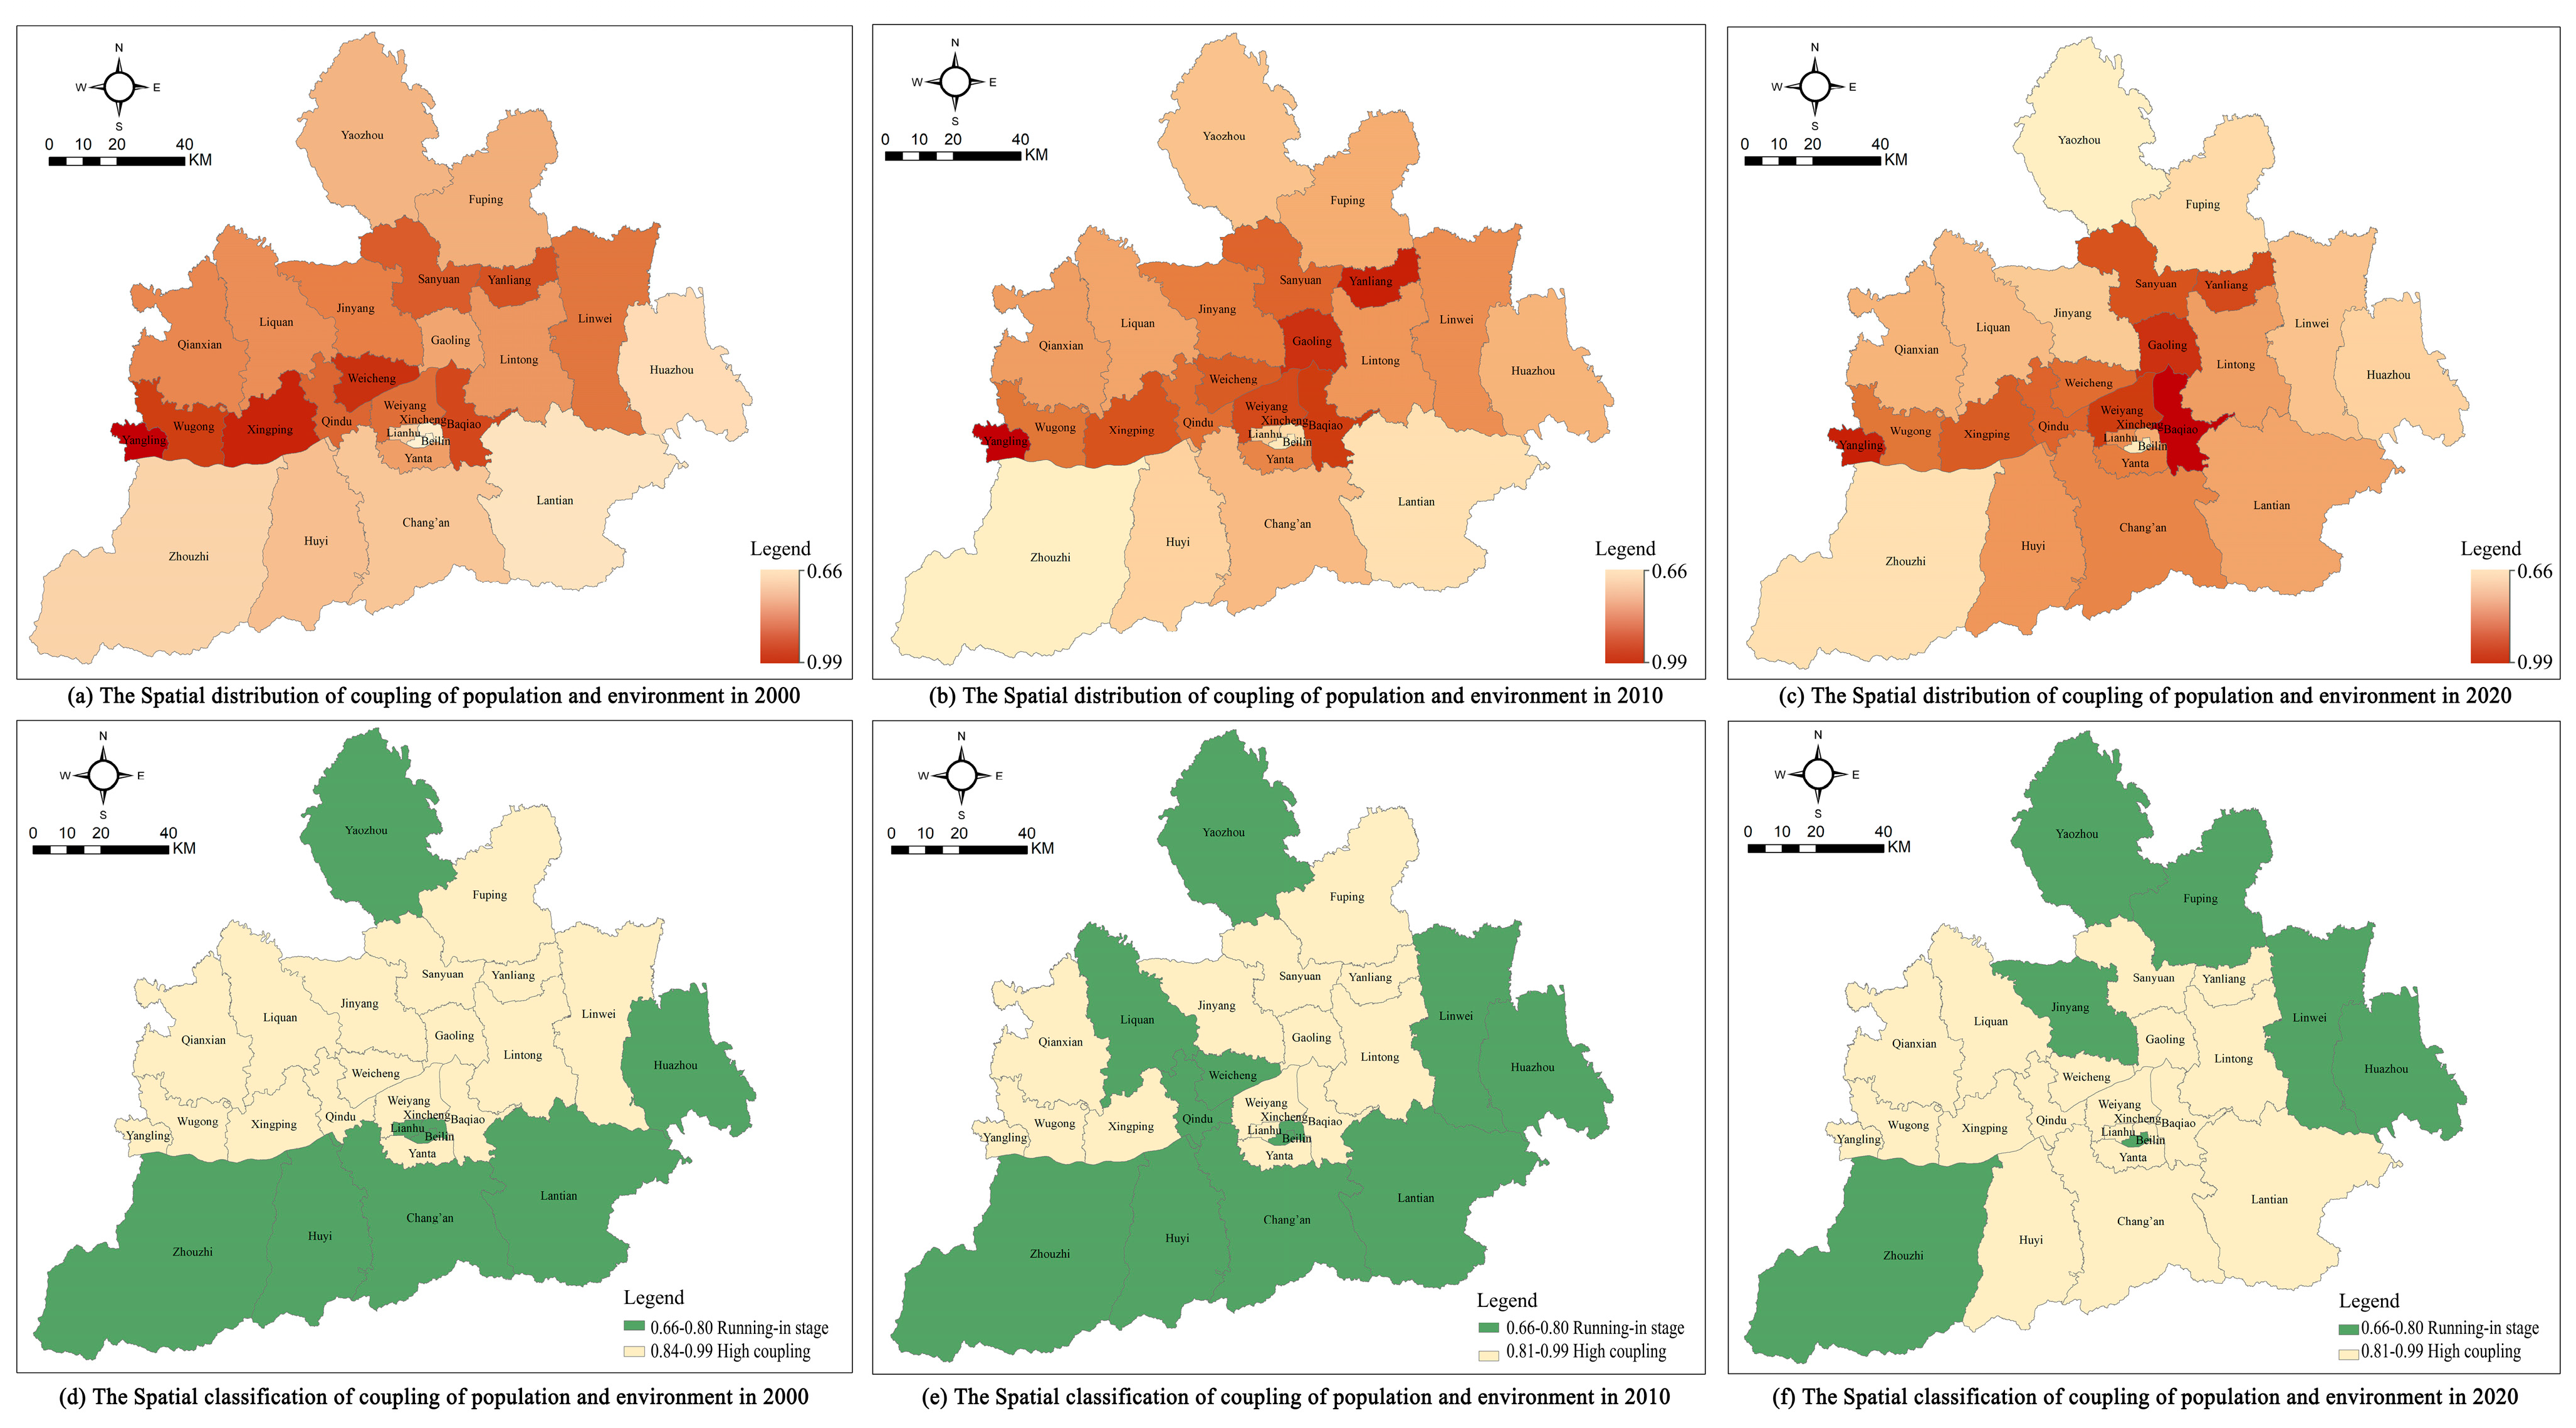
3.3.1. Coupling Degree

In the temporal cross-sections for 2000, 2010, and 2020, the C values, the coupling degrees of the “population–environment” of all districts and counties in the Xi’an metropolitan area, remained above 0.6; moreover, the degree of coupling was distributed into two stages: “friction” and “high level coupling”. Small changes had occurred in each of the three temporal cross-sections, thus exhibiting the development state of “friction in the central circle–high level coupling in the core circle–fluctuation in the peripheral circle” (Figure 3). Specifically, in 2000, the “population–environment” system of all districts in the central circle of the Xi’an metropolitan area was in a state of friction, in which where the main urban districts in the core circle and the northern districts and counties in the peripheral circle were at a high level of coupling, whereas the northern mountainous areas and districts and counties near the Qinling Mountains were in a state of friction. In 2010, the coupling degree of all districts and counties in the metropolitan area increased as a whole, and the three districts and counties in the peripheral circle showed a continuous state of friction. In 2020, the coupling degree of some districts and counties in the northern and eastern parts of the peripheral circle of the metropolitan area had decreased into a state of friction.

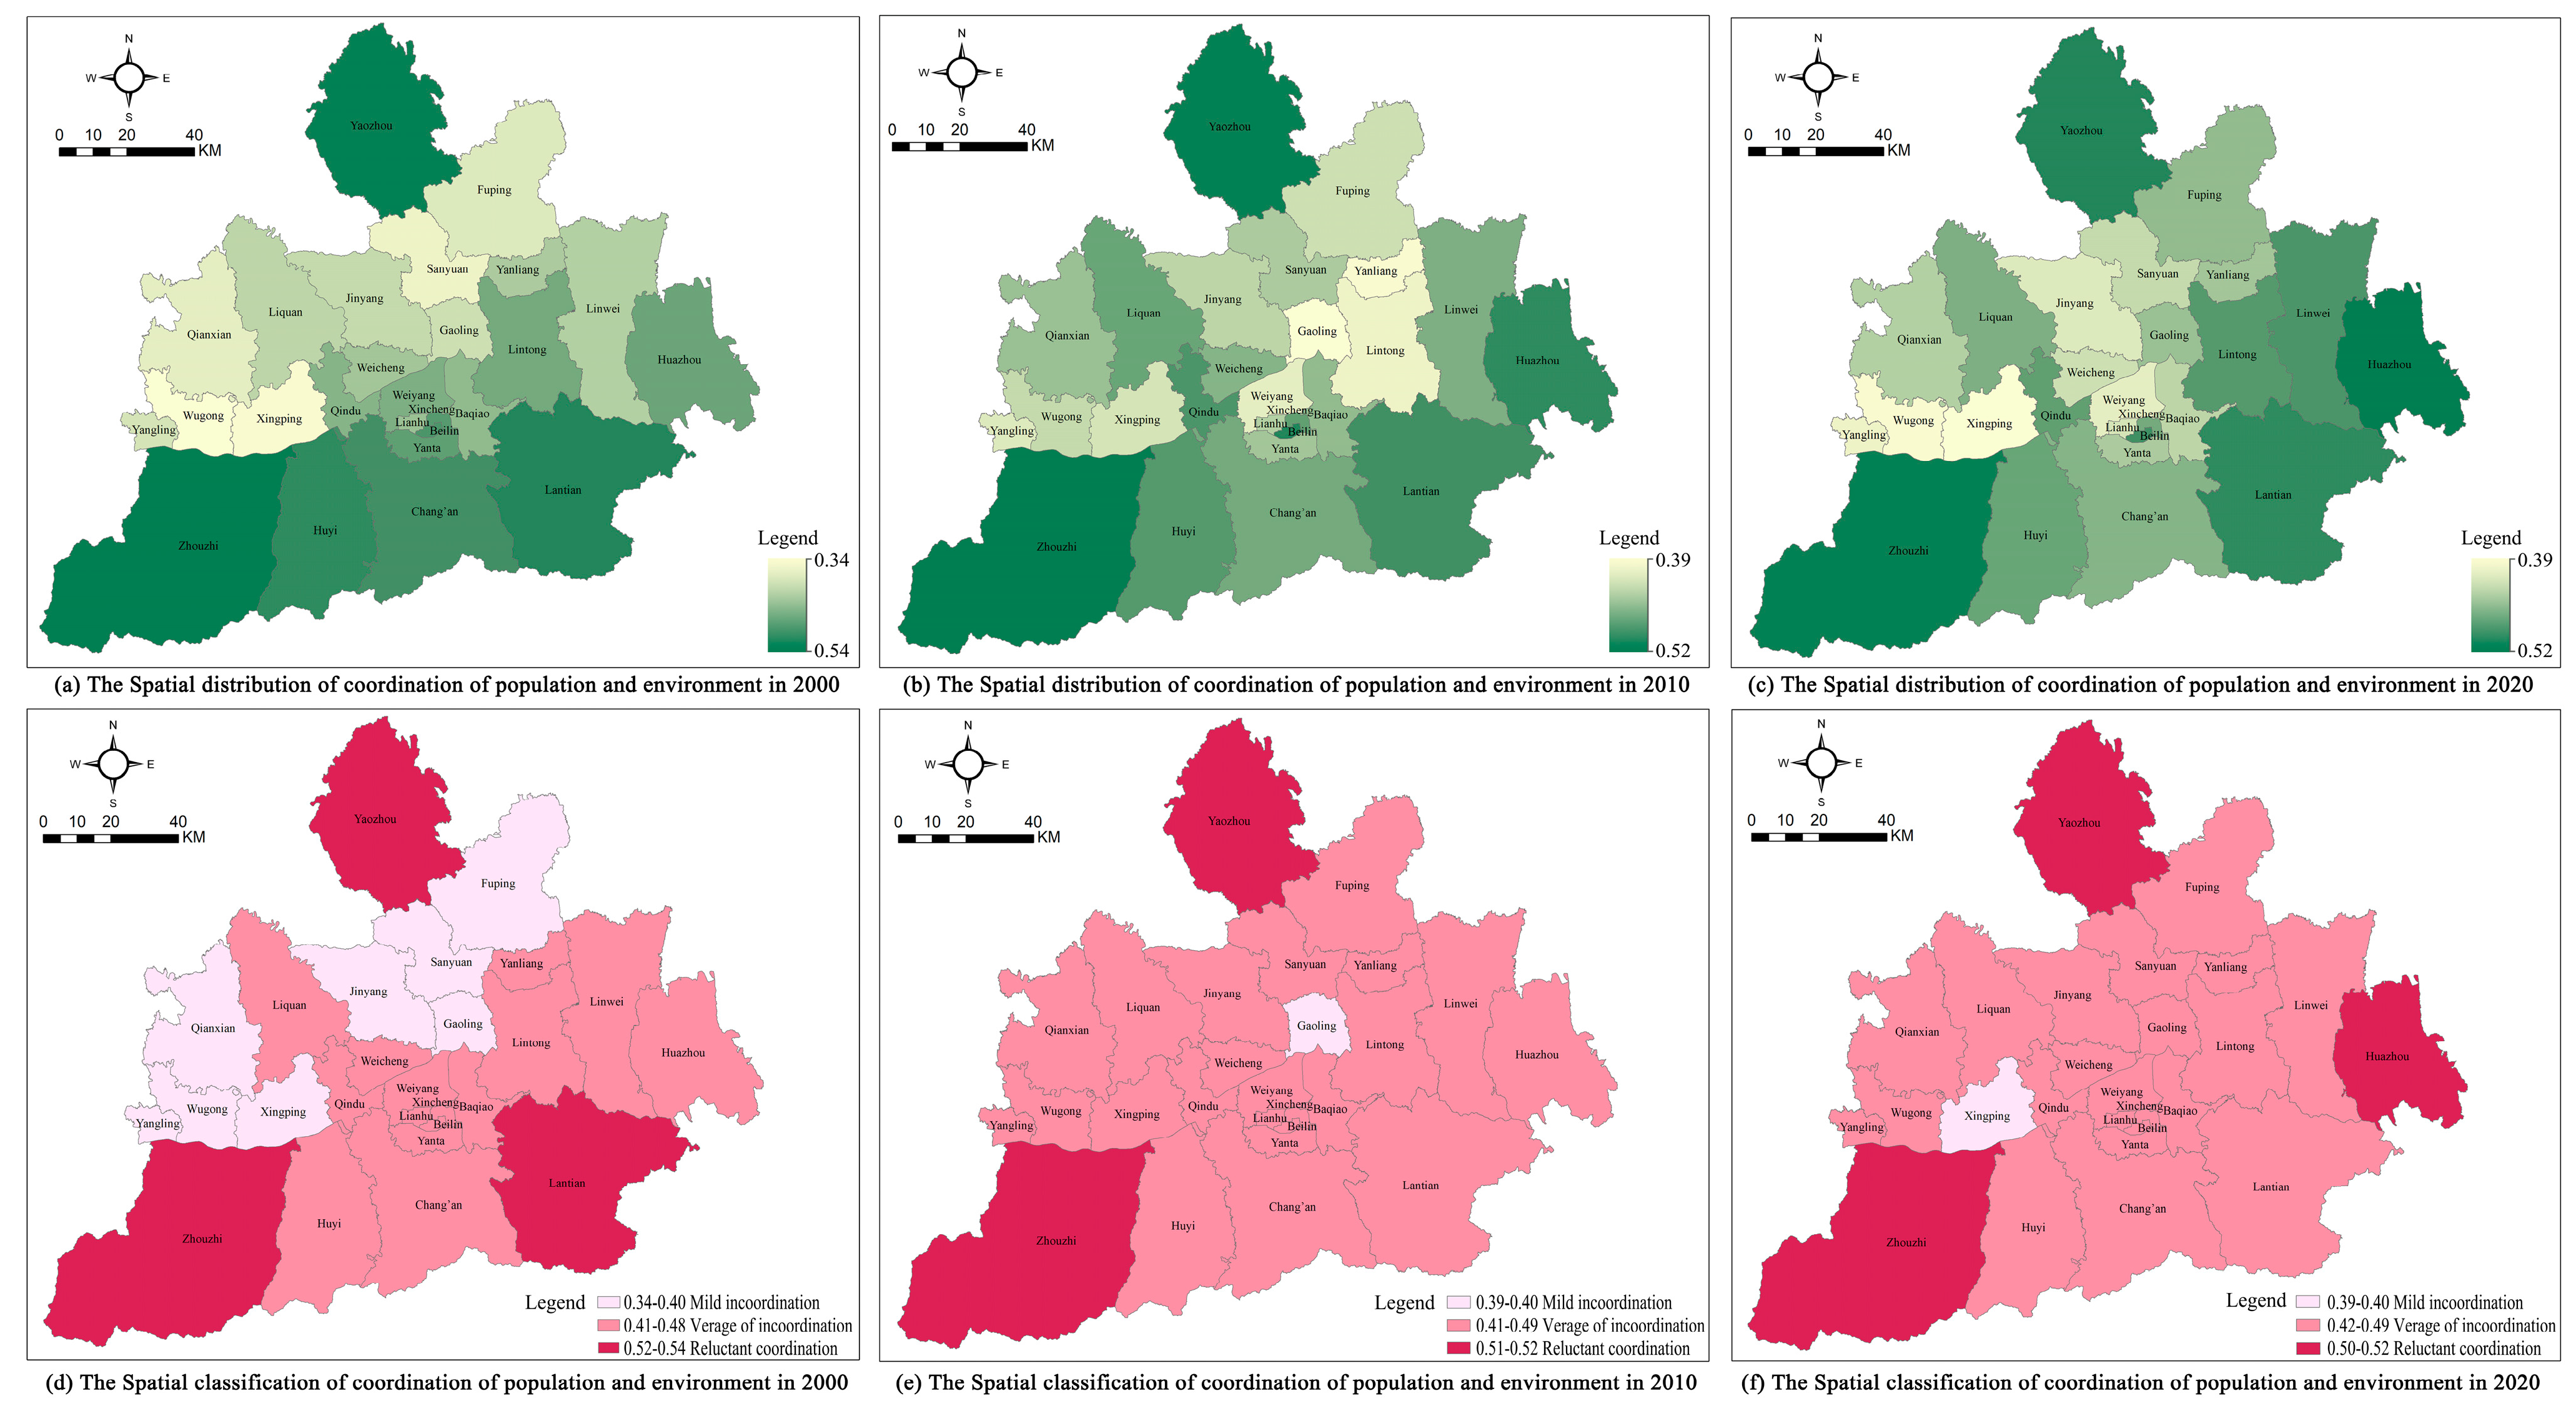
3.3.2. Coupling Coordination Degree

In the temporal cross-sections for 2000, 2010 and 2020, the D-values of coordination in the “population–environment” among the districts and counties in the Xi’an metropolitan area remained between 0.34 and 0.54. The degree of coordination was at the stages of mild incoordination, verge of incoordination, and reluctant coordination, with small differences in the degree of coupling coordination among districts and counties. In terms of the development process (Figure 4), the results indicated a transition from the verge of incoordination to reluctant coordination.
In 2000, districts and counties with relatively high levels of coordination were concentrated in the central, core, and southern parts of the peripheral circle, whereas districts and counties with relatively low levels of coordination were concentrated in the northwest of the peripheral circle. In 2010, the spatial distribution of the degree of coordination among districts and counties in the metropolitan area was relatively dispersed, with small-scale districts and counties with relatively high levels of coordination clustering in the southern part of the peripheral circle of the metropolitan area, and small-scale districts and counties with relatively low levels of coordination clustering in the core circle and the northeast of the peripheral circle. The spatial distribution in 2020 was similar to that in 2010, in which the districts and counties with relatively low levels of coordination were clustered in the core and northwest of the peripheral circle, and with increasing numbers.

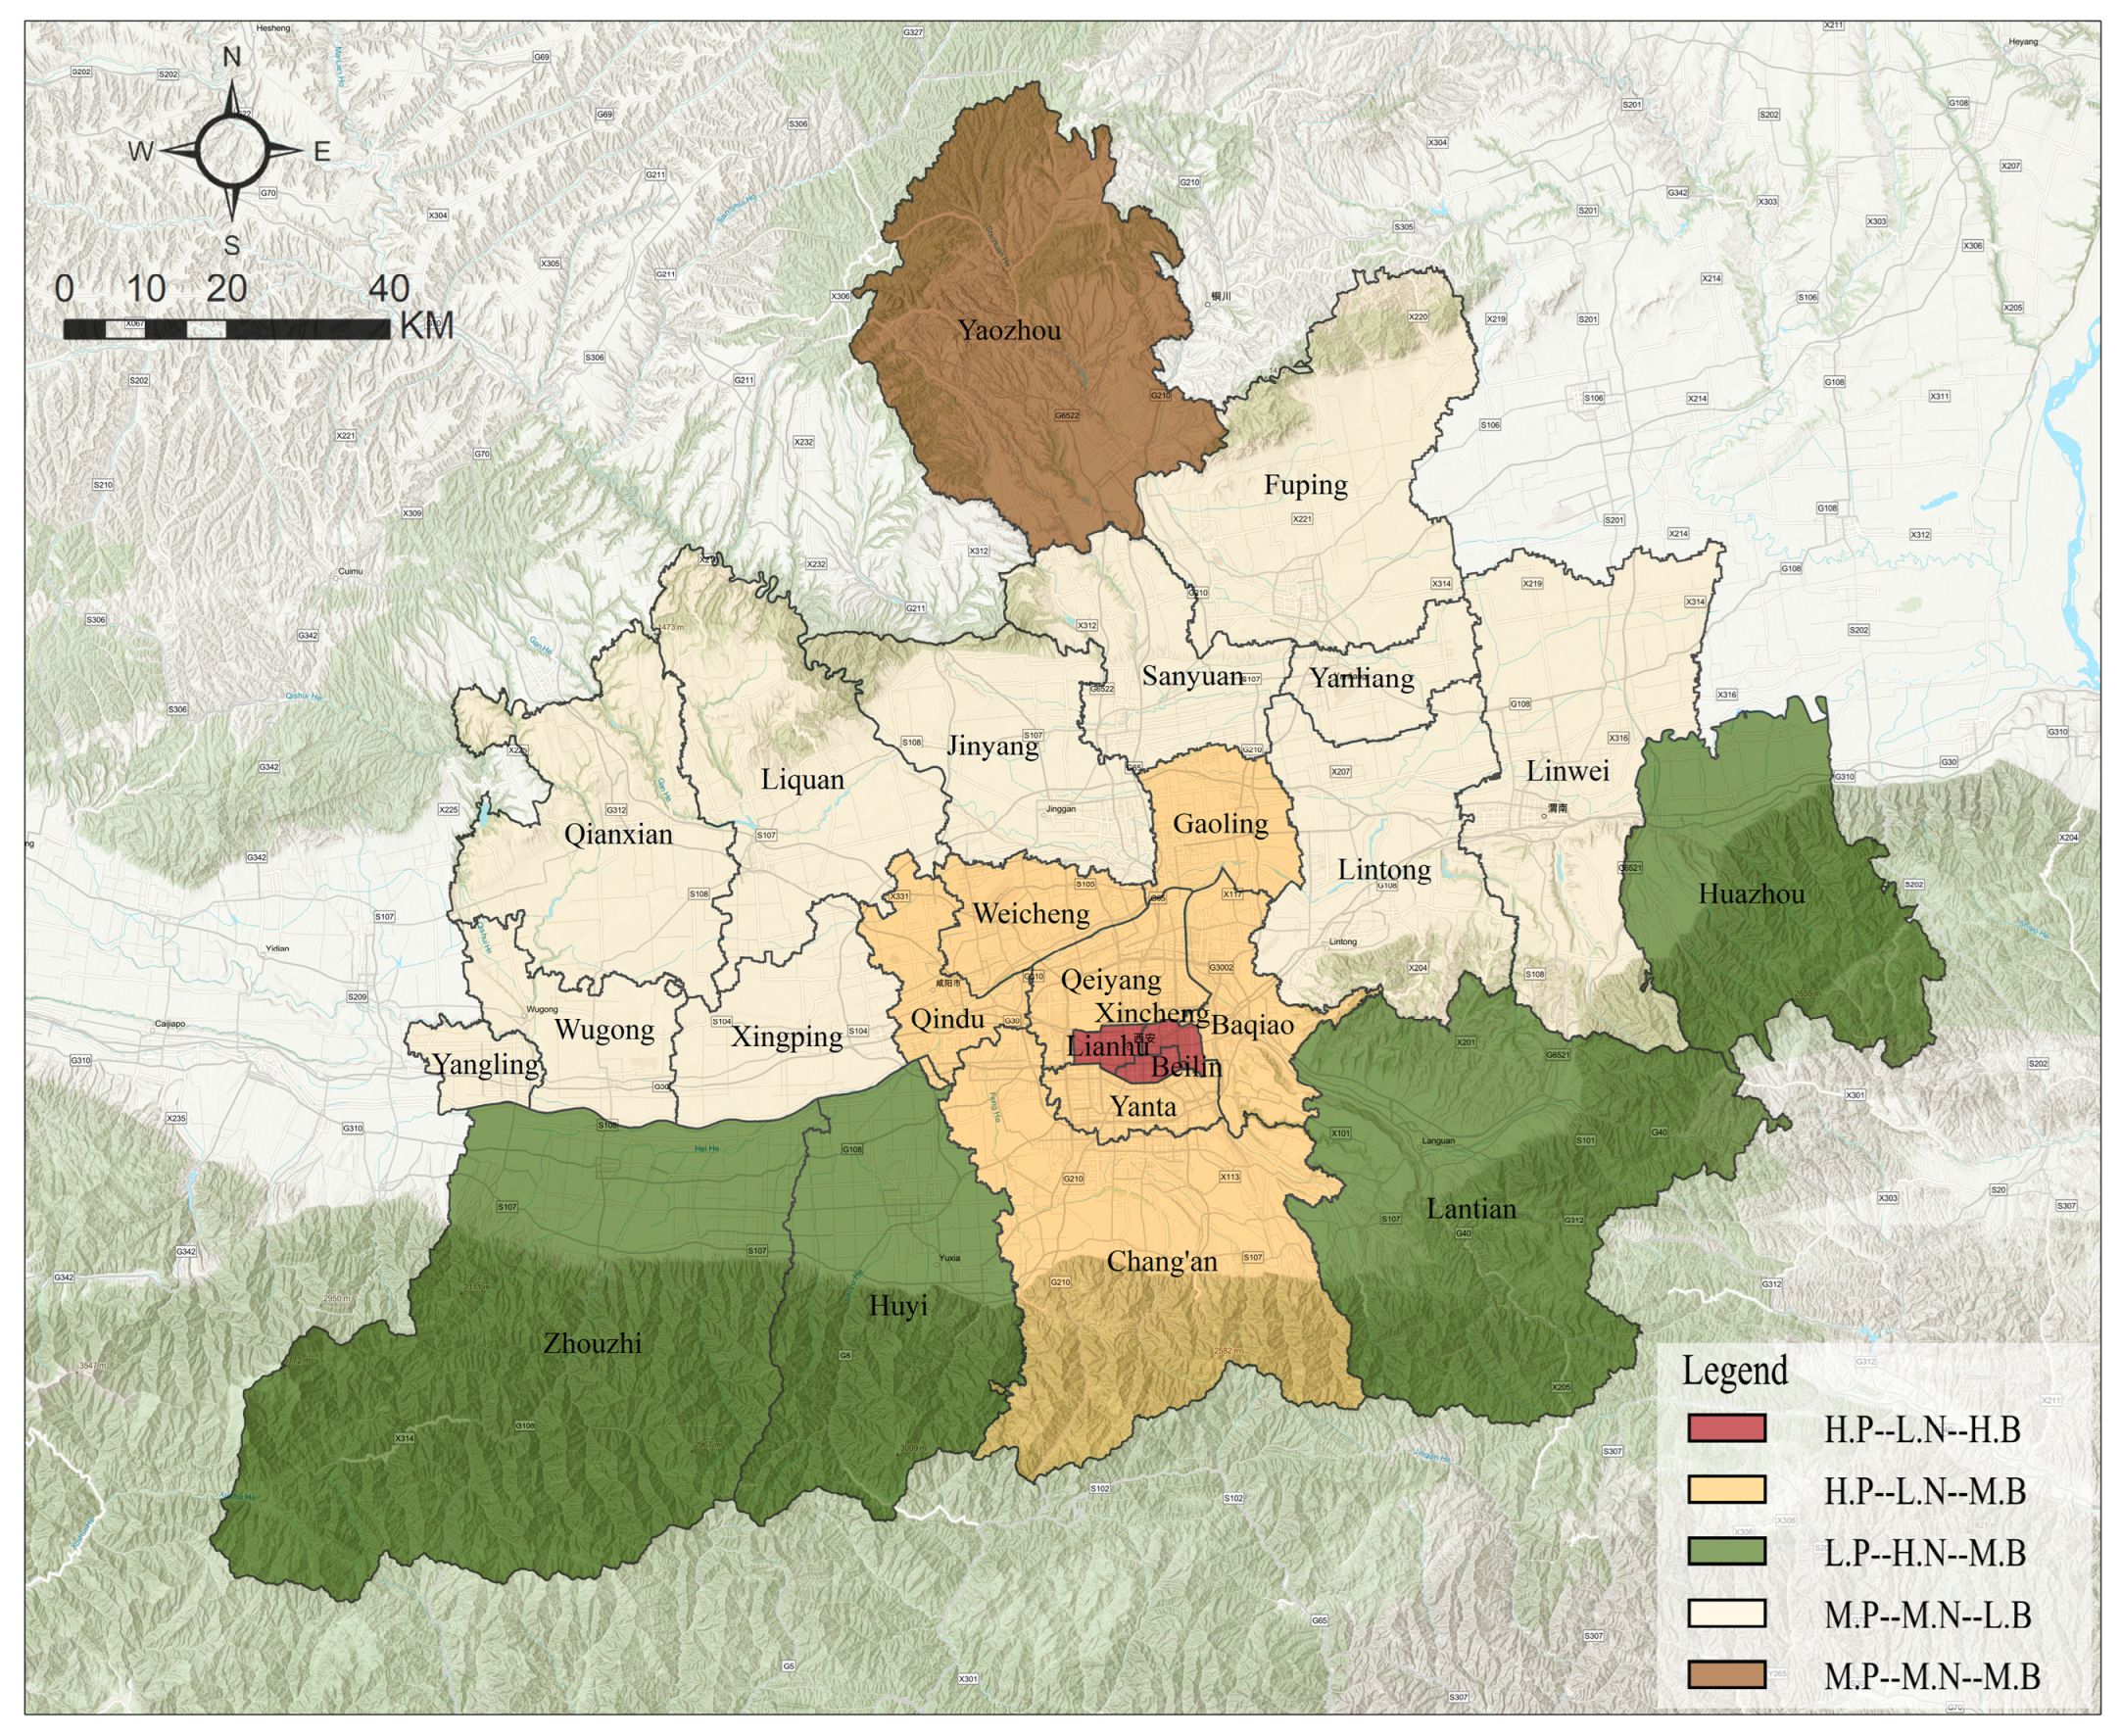
3.3.3. Five Types of “Population–Environment” Coupling Coordination Relationship

Considering the characteristics of the spatiotemporal patterns of the “population–environment” in the metropolitan area, the types of “population–environment” coupling coordination in metropolitan areas could be classified into the following five categories (Figure 5):
  • Relationship at the verge of incoordination in the central circle of “high population agglomeration–low natural ecology–high built-up level”
The central circle covered the historic city and old city of Xi’an, which had been built up for the longest time in the metropolitan area, and which had high service levels of various facilities and a highly urbanized population. Thus, it could only further absorb and accommodate a limited population, and it lacked various types of green open spaces due to its over-pursuit of the economic output of land and subsequent neglect of the construction of green open spaces during the process of historical construction and development. Simultaneously, the level of service facilities had slightly decreased under the construction control process of population and service function decentralization.
2.
Relationship at the verge of incoordination in the core circle of “high population agglomeration–low natural ecology–medium built-up level”
The core circle is the area in which various development zones and industrial parks at all levels in the metropolitan area have been concentrated in the past two decades, creating a large number of jobs and a rapid increase in agglomeration of the urban population. The former suburban areas have gradually developed into concentrated urban construction areas, and a large amount of agricultural and ecological space was transformed into construction space. However, under the influence of new development concepts such as “park city” and “garden city”, relative emphasis was placed on the construction of large urban parks with ecological effects, and the green space ratio index in the land development of various functions was relatively strictly controlled. Thus, the green open spaces and greenery coverage level of the city have been improved to a certain extent compared with the old city in the central circle. However, during the construction of new districts, most of the educational facilities were built by developers who had obtained land development rights on behalf of the government, which were then handed over to the latter upon completion. Thus, problems of educational facilities lagging behind as residential buildings were being developed first had occurred in each district to varying degrees, and the service level of facilities was lower than that of districts in the central circle.
3.
Relationship at the verge of incoordination in the peripheral circle of “medium population agglomeration–low natural ecology–low built-up level”
Districts and counties including Fuping, Yanliang, Sanyuan, Jingyang, Liquan, and Wugong, in the west and north of the peripheral circle of the metropolitan area had a medium degree of population agglomeration and slowing population growth. This was mainly due to the weak industrial growth in recent years and a growing development gap with the core circle districts of the metropolitan area; in addition, the migration of their hinterland population showed a transition to the core circle. In terms of the natural ecological environment, this area had once faced serious problems of overzealous rock blasting and quarrying due to its rich limestone resources. After 2010, the Xi’an municipal government implemented a series of ecological restoration projects, which effectively protected and improved the natural ecological environment of the area. Simultaneously, with the implementation of a series of policies to support the modernization of agriculture, the irrigation conditions for agricultural production in these districts and counties have been improving, and the proportion of irrigated land has also been increasing. However, against the backdrop of sluggish economic growth, counties have also made limited financial investment in public facility construction, lagging far behind than that of district-level administrative units, and the development of various urban service facilities had also been relatively slow. In recent years, under the developmental changes of student loss and lack of quality teaching resources, most districts and counties have closed down junior high and high schools in the villages and towns in order to consolidate and focus their resources on school operation, and the distribution density of secondary schools has, accordingly, decreased.
4.
Relationship of reluctant incoordination in the peripheral circle of “low population agglomeration–high natural ecology–medium built-up level”
This included the districts and counties at the northern foot of the Qinling Mountains in the peripheral circle of the metropolitan area. Under the pressure of ecological protection, this region lagged behind during its early development. In recent years, under the rapid development of suburban ecotourism in the metropolitan area, the level of urban population agglomeration has improved, and the service level of the built environment is better compared to other counties. However, the rapid development of tourism real estate together with the reverse urbanization of the high-income population in the central and core circles of the metropolitan area has negatively affected the natural ecological environment of the region to a certain extent.
5.
Relationship of reluctant incoordination in the peripheral circle of “medium population agglomeration–medium natural ecology–medium built-up level”
This included the Yaozhou district in the northern part of the metropolitan area. The Yaozhou district used to be the production base for coal and cement in Tongchuan, but it faced the dilemma of resource depletion after 2000, coupled with the continual degradation of the environment due to petrochemical production, thus further aggravating the population loss in the region. In 2010, the Shaanxi provincial government issued the “Various Opinions on Promoting Sustainable Development of Resource-based Cities in Tongchuan”, and proposed to promote the development of circular economy industries, conduct environmental governance, ecological restoration, etc. In recent years, the region has, basically, completed its transformation and development and has achieved good social and economic benefits.

3.4. Analysis of Factors Affecting Coupling Coordination in the “Population–Environment” System

Correlation analysis was conducted on the evaluation factors and the coupling coordination of each “population–environment” system in the Xi’an metropolitan area for 2000, 2010, and 2020 (Table 5). In addition, significant positive and negative correlation factors were obtained for different years (Table 6).
For 2000, the significant positive correlation factors were sorted according to the correlation coefficient as follows: growth rate of total retail sales of social consumption > urban disposable income > number of medical institutions per 10,000 persons > effective irrigated area of farmland > proportion of tertiary industry in total. Among them, three items belong to the built environment subsystem, two items belong to the natural environment subsystem, and one item belongs to the population aggregation subsystem. The significant negative correlation factors were sorted according to the correlation coefficients as follows: annual maximum temperature > proportion of farmland patch area > urban–rural disposable income ratio > per capita construction land area. Among them, two items belong to the natural environment subsystem and two items belong to the population aggregation subsystem.
For 2010, the significant positive correlation factors were sorted according to the correlation coefficient as follows: fractional vegetation cover (FVC) > per capita forest park green area > afforestation area in the current year. Among them, two items belong to the natural environment subsystem and one item belongs to the built environment subsystem. The significant negative correlation factors were sorted according to the correlation coefficients as follows: proportion of farmland patch area > annual maximum temperature > AOD of days with the worst air quality. All of them belong to the natural ecological environment subsystem.
For 2020, the significant positive correlation factors were sorted according to the correlation coefficient as follows: FVC > afforestation area in the current year > per capita forest park green area. The significant negative correlation factors were sorted according to the correlation coefficients as follows: growth rate of total retail sales of social consumption > distribution density of secondary education schools > proportion of farmland patch area > urban disposable income > resident population density. Among them, two items belong to the built environment subsystem, two items belong to the population aggregation subsystem, and one belongs to the natural environment subsystem.
A comparison of the significant correlation factors of the three temporal cross-sections shows the following findings. For 2000, the coupling and coordination degree of the “population–environment” system was relatively high in districts and counties with high economic development level and good facilities and services, while the coupling and coordination degree of “population–environment” system in districts and counties with agricultural production spaces accounting for the main body and large urban–rural development gap was relatively low.
For 2010, the types of significant positive correlated factors were consistent, and the weight of these factors in the evaluation system was relatively high. This shows that the improvement of the natural ecological environment had a positive impact on the coupling coordination. Following 2010, the government conducted ecological restoration projects such as transforming the “drought belt of Weibei” to a “green belt” project, as well as water quality treatment of the Shaanxi section of the Weihe River and protection and management of the Xi’an river and lake system. The implementation of these projects has considerably improved the natural ecological system in the metropolitan area and has contributed to the improvement of the coupling coordination of the “population–environment” system. In 2010, there was a significant negative correlation between the aerosol optical depth on days with the worst air quality and the coupling coordination level. The pollution emissions generated by population and industrial agglomeration from the previous development stage gradually exceeded the dissipation capacity of the natural ecological environment, causing the influence of climatic conditions on the degree of system coupling coordination to become prominent. In 2013, the Xi’an municipal government initiated a series of control projects on “pollution control and haze reduction.” In 2017, the Shaanxi provincial government moved beyond the administrative scope of Xi’an to include the neighboring cities of Weinan, Baoji, and Tongchuan in the joint haze control. In recent years, under measures such as “optimizing the industrial structure and promoting green industrial development, adjusting the energy structure and building a clean and low-carbon energy system, and adjusting transportation structure and developing a green transportation system”, the air quality in the metropolitan area has continued to improve.
For 2020, the type of factor with a significant positive correlation remained consistent with that of 2010, with only the correlation coefficient changing. This shows that the improvement of the natural ecological environment has exerted a continuous positive impact on the coupling and coordination degree of the “population–environment” system. However, the types of factors with a significant negative correlation changed greatly, mainly the built environment and population agglomeration subsystem factors. Combining the two, the districts and counties in the metropolitan area presented two types of systematic contradictions. One was the core circle represented by the Weiyang and Baqiao districts, whereby the population has continued to agglomerate, but the built environment has not grown at the same pace. The other was the northwest of the peripheral circle represented by Wugong and Jingyang counties, whereby there was a population loss and a relative lag in the development of the built environment.

4. Discussion

The development of the Xi’an metropolitan area has experienced the polarization stage, entered the diffusion stage, and remains in the process of cultivating a modernized metropolitan area. During this process, the population agglomeration level, natural ecological environment, and urban built environment of the metropolitan area, have been developed at different levels. People have already started to realize the importance of proactively improving the natural ecological environment and paying attention to the development of the urban built environment for the sustainable high-quality development of metropolitan areas.
From a historical point of view, the central circle of the metropolitan area was developed on the basis of the site of different historical periods. For a long time, these regions have continued to function as social, economic, and cultural centers in the region. After 2000, the metropolitan area entered a diffusion phase. During this period, the core circle rapidly urbanized, with a large amount of land being converted from farmland to cities. In the construction of these new areas, there are prominent problems such as lagging public service facilities and unbalanced development of employment and housing. However, due to the restrictions of some large-scale historical sites, natural rivers, and other elements, these areas retain more natural open space to a certain extent in the process of rapid construction. The outer circle area north of the Wei River has convenient external transportation links, few environmental constraints, and flat terrain easy to construction. Industrial companies are rapidly gathering here. Most of these industrial enterprises belong to petrochemical, iron, and steel types with high pollutant emission levels. As a result, it puts great pressure on the natural environment of the region. At the same time, these large enterprises lack the drive for the development of upstream and downstream small and medium-sized enterprises, although the effect on local employment is not significant. The southern part of the metropolitan area, located at the northern foot of the Qinling Mountains, is limited by the development of the protection of the Qinling Mountains, and cannot realize the development of urbanization through industrialization. After 2010, under the impetus of reverse urbanization, more development opportunities were obtained.
In this historical development background, combined with the five coupling and coordination relationships revealed in the study, we are prompted to consider the future differentiated development paths of different regions in the metropolitan area according to different resource endowments and development basic conditions. For the central circle, it is necessary to further ease the population congestion, vacate inefficient industries, activate urban renewal, increase green open spaces, and develop tertiary industries with cultural tourism and science and technology innovation as the core. For the core circle, it is necessary to strengthen the supply of various public service facilities, build efficient and concentrated urban spaces, and aggressively develop country parks and suburban urban agriculture. For the peripheral circle, the northern region would need to further strengthen the development of the manufacturing, aviation, and air transport industries, etc., to enhance the agglomeration absorption capacity of the hinterland population, whereby also focusing on constructing a high-quality urban environment, promoting the construction of modern agricultural infrastructure, and promoting the full transformation of the agricultural population under the premise of ensuring the safety of agricultural production. The southern region, with its good natural ecological conditions, would need to improve the development level of leisure tourism, parent–child wellness, and other industries, and provide more development rights to the rural areas, activate rural space to undertake the development of new industries, and build small regional towns and cities orientated towards low-carbon, green, and resilience.
This study is based on geographical units at the district and county scale, which can more accurately evaluate the changes of the coupling and coordination relationship of the “population–environment” system in the process of metropolitan development. However, this study has several limitations, and additional work is needed to improve further research. Due to the research strength and difficulty of data acquisition, this study can be further improved in terms of evaluation system indicators. In the future, relevant evaluation indicators can be included in the aspects of population health, well-being, and environmental sustainability. The “population–environment” system of metropolitan areas is complex in nature. In the analysis of factors affecting its coupling and coordination relationship, the causal relationship can be studied in more detail from the perspective of complex systems. Furthermore, combined with the five types obtained, research on the development and utilization of different types of land space resources, spatial models, and resource carrying capacity measurement can be carried out.

5. Conclusions

Based on the cross-sectional data of 26 districts and counties in the Xi’an metropolitan area in 2000, 2010, and 2020, this study constructed a system for evaluating the development level of the “population–environment” system, calculated the index weights by the entropy weight method, and further obtained the development indices of the “population agglomeration, natural ecological environment, and urban built-up environment.” The coupling coordination of the “population–environment” system of each district and county in the metropolitan area was analyzed using the coupling coordination degree model in the two dimensions of time and space, and we drew the following conclusions:
(1) During 2000, 2010 and 2020, the urbanization level, ratio of urban and rural disposable incomes, afforestation area in the current year, fractional vegetation cover, effective irrigation area of farmland, per capita forest green area, and density of secondary education schools varied greatly across time and space among districts and counties in the Xi’an metropolitan area, and they were factors with relatively high weights in the evaluation of the “population–environment” system development.
(2) The development of each system “population agglomeration–natural ecological environment–urban built environment” in the Xi’an metropolitan area presented a state of stratification and differentiation of the central, core, and peripheral circles. In terms of population agglomeration, the agglomeration degrees of the central and core circles were considerably better than that of the peripheral circles, whereas the districts and counties in the peripheral circles along the transportation corridor showed a continuous increase in population agglomeration. In terms of natural ecological environment development, the development of the central and core circles was relatively low, whereas counties along the northern Weibei Plateau in the peripheral circle had an intermediate level of development, which continued to improve. Districts and counties near the northern foot of the Qinling Mountains showed a degree of continuous deterioration on the basis of a good development foundation. In terms of urban built environment development, the central circle had a high level of development, the core circle had a medium but gradually decreasing level of development, whereas the development of the southeast of the peripheral circle was generally better than that of the northwest. However, most southeastern districts and counties showed a certain degree of regression in the development of the built environment, and only a few curves in the east have a small degree of improvement.
(3) There was strong coupling between the “population–environment” systems in each district and county in the Xi’an metropolitan area, and the overall coupling coordination degree was slowly increasing. The differences between the coupling degree and the coupling coordination degree indicated that there was a non-benign mechanism of mutual interaction between the “population–environment” systems in the metropolitan area. Furthermore, the coupling coordination relationship of the “population–environment” system in the metropolitan area could be classified into five types: (i) the “high population agglomeration–low natural ecology–high built-up level” relationship on the verge of incoordination in the central circle; (ii) the “high population agglomeration–low natural ecology–medium built-up level” relationship on the verge of incoordination in the core circle; (iii) the “medium population agglomeration–medium natural ecology–low built-up level” relationship on the verge of incoordination in the peripheral circle; (iv) the “low population agglomeration–high natural ecology–medium built-up level” relationship of reluctant coordination in the peripheral circle; and (v) the “medium population agglomeration–medium natural ecology–medium built-up level” relationship of reluctant coordination in the peripheral circle.
(4) The correlation between the evaluation factors of the “population–environment” and coupling coordination in the Xi’an metropolitan area varied at different stages of development. In general, in 2000, the level of economic growth and urban–rural disparity had played a prominent role in the coupling coordination of the system, whereas the negative role of climate and environmental quality was prominent in 2010. Meanwhile, ecological development potential had continued to play a positive role on the coupling coordination of the system. In 2020, the level of facility services and economic growth level had played a significant role on the coupling coordination of the system.

Author Contributions

Conceptualization, Y.W. and Y.M.; methodology, W.Q. and Y.W.; software, H.L.; validation, W.Q. and Y.W.; formal analysis, Y.W.; investigation, W.Q. and H.L.; resources, H.L.; data curation, W.Q.; writing—original draft preparation, H.L.; writing—review and editing, W.Q.; visualization, H.L.; supervision, Y.M.; project administration, Y.W.; funding acquisition, W.Q. All authors have read and agreed to the published version of the manuscript.

Funding

This research was funded by the National Key R&D Program of China (Grant No. 2022YFC3802801) and the Collaborative Innovation Project of the Shaanxi Provincial Department of Education (Grant No. 20JY038).

Institutional Review Board Statement

Not applicable.

Informed Consent Statement

Not applicable.

Data Availability Statement

Not applicable.

Conflicts of Interest

The authors declare no conflict of interest.

References

  1. Zhao, X.; Liu, J.; Bu, Y. Quantitative analysis of spatial heterogeneity and driving forces of the thermal environment in urban built-up areas: A case study in Xi’an, China. Sustainability 2021, 13, 1870. [Google Scholar] [CrossRef]
  2. Zhang, D.; Zhou, C.; He, B. Spatial and temporal heterogeneity of urban land area and Pm2.5 concentration in China. Urban Clim. 2022, 45, 101268. [Google Scholar] [CrossRef]
  3. Yang, J.; Wang, Y.; Xiao, X.; Jin, C.; Xia, J.C.; Li, X. Spatial differentiation of urban wind and thermal environment in different grid sizes. Urban Clim. 2019, 28, 100458. [Google Scholar] [CrossRef]
  4. Heaviside, C.; Macintyre, H.; Vardoulakis, S. The Urban Heat Island: Implications for Health in a Changing Environment. Curr. Environ. Health Rep. 2017, 4, 296–305. [Google Scholar] [CrossRef]
  5. Dai, P.; Lin, Y. Should There Be Industrial Agglomeration in Sustainable Cities? A Perspective Based on Haze Pollution. Sustainability 2021, 13, 6609. [Google Scholar] [CrossRef]
  6. Bowden, J.J.; Treier, U.A.; Pressey, R.L. Drivers of Human Stress on the Environment in the Twenty-First Century. Annu. Rev. Environ. Resour. 2017, 42, 189–213. [Google Scholar] [CrossRef]
  7. Das, M.; Das, A.; Mandal, A. Research note: Ecosystem Health (EH) assessment of a rapidly urbanizing metropolitan city region of eastern India—A study on Kolkata Metropolitan Area. Landsc. Urban Plan. 2020, 204, 103–193. [Google Scholar] [CrossRef]
  8. Chen, D.; Lu, X.; Hu, W.; Zhang, C.; Lin, Y. How urban sprawl influences eco-environmental quality: Empirical research in China by using the Spatial Durbin model. Ecol. Indic. 2021, 131, 108–113. [Google Scholar] [CrossRef]
  9. Wang, Z.; Yang, J.; Jiang, J. Urban sprawl and haze pollution: Based on raster data of haze PM2.5 concentrations in 283 cities in Mainland China. Front. Environ. Sci. 2022, 10, 929558. [Google Scholar] [CrossRef]
  10. Xu, Z.; Yin, Y.Y. Regional development quality of Yangtze River Delta: From the perspective of urban population agglomeration and ecological efficiency coordination. Sustainability 2021, 13, 12818. [Google Scholar] [CrossRef]
  11. Wan, J.; Zhang, L.; Yan, J.; Wang, X.; Wang, T. Spatial–temporal characteristics and influencing factors of coupled coordination between urbanization and eco-environment: A case study of 13 urban agglomerations in China. Sustainability 2020, 12, 8821. [Google Scholar] [CrossRef]
  12. Hao, H.H. Social sustainable development of population agglomeration and pollution emission in Urban China: A case study of Beijing and Shanghai. Asian J. Chem. 2014, 26, 3361–3365. [Google Scholar] [CrossRef]
  13. Dong, L.; Shang, J.; Ali, R.; Rehman, R.U. The coupling coordinated relationship between new-type urbanization, eco-environment and its driving mechanism: A case of GuanZhong, China. Front. Environ. Sci. 2021, 9, 638891. [Google Scholar] [CrossRef]
  14. Li, M.; Mao, C. Spatial-temporal variance of coupling relationship between population modernization and eco-environment in Beijing-Tianjin-Hebei. Sustainability 2019, 11, 991. [Google Scholar] [CrossRef] [Green Version]
  15. Hashmi, S.H.; Fan, H.; Fareed, Z.; Shahzad, F. Asymmetric nexus between urban agglomerations and environmental pollution in top ten urban agglomerated countries using quantile methods. Environ. Sci. Pollut. Res. Int. 2021, 28, 13404–13424. [Google Scholar] [CrossRef]
  16. Wu, X.; Zhang, Y.; Wang, L. Coupling relationship between regional urban development and eco-environment: Inspiration from the old industrial base in Northeast China. Ecol. Indic. 2022, 142, 109259. [Google Scholar] [CrossRef]
  17. He, J.; Wang, S.; Liu, Y.; Ma, H.; Liu, Q. Examining the relationship between urbanization and the eco-environment using a coupling analysis: Case study of Shanghai, China. Ecol. Indic. 2017, 77, 185–193. [Google Scholar] [CrossRef]
  18. Li, Y.; Li, Y.; Zhou, Y.; Shi, Y.; Zhu, X. Investigation of a coupling model of coordination between urbanization and the environment. J. Environ. Manag. 2012, 98, 127–133. [Google Scholar] [CrossRef]
  19. Cui, X.; Fang, C.; Liu, H.; Liu, X. Assessing sustainability of urbanization by a coordinated development index for an Urbanization-Resources-Environment complex system: A case study of Jing-Jin-Ji region, China. Ecol. Indic. 2019, 91, 383–391. [Google Scholar] [CrossRef]
  20. Zhang, B.; Yin, J.; Jiang, H.; Qiu, Y. Spatial–temporal pattern evolution and influencing factors of coupled coordination between carbon emission and economic development along the Pearl River Basin in China. Sci. Pollut. Res. 2023, 30, 6875–6890. [Google Scholar] [CrossRef]
  21. Yao, J.; Xu, P.; Huang, Z. Impact of urbanization on ecological efficiency in China: An empirical analysis based on provincial panel data. Ecol. Indic. 2021, 129, 107827. [Google Scholar] [CrossRef]
  22. Li, W.; An, M.; Wu, H.; An, H.; Huang, J.; Khanal, R. The local coupling and telecoupling of urbanization and ecological environment quality based on multisource remote sensing data. J. Environ. Manag. 2023, 327, 116921. [Google Scholar] [CrossRef] [PubMed]
  23. Chu, N.; Zhang, P.; Wu, X. Spatiotemporal evolution characteristics of urbanization and its coupling coordination degree in Russia—Perspectives from the population, economy, society, and eco-environment. Environ. Sci. Pollut. Res. 2022, 29, 61334–61351. [Google Scholar] [CrossRef] [PubMed]
  24. Zeng, W.; Chen, X.; Wu, Q.; Dong, H. Spatiotemporal heterogeneity and influencing factors on urbanization and eco-environment coupling mechanism in China. Environ. Sci. Pollut. Res. Int. 2023, 30, 1979–1996. [Google Scholar] [CrossRef] [PubMed]
  25. Luo, D.; Liang, L.; Wang, Z.; Chen, L.; Zhang, F. Exploration of coupling effects in the Economy-Society-Environment system in urban areas: Case study of the Yangtze River Delta Urban Agglomeration. Ecol. Indic. 2021, 128, 107858. [Google Scholar] [CrossRef]
  26. Zou, C.; Zhu, J.; Lou, K.; Yang, L. Coupling coordination and spatiotemporal heterogeneity between urbanization and ecological environment in Shaanxi Province, China. Ecol. Indic. 2022, 14, 109152. [Google Scholar] [CrossRef]
  27. Li, Y.; Hou, X.; Li, W. Impact of Bi-directional Population Migration on County-Level Urbanization and Its Spatial Gradien. Econ. Geogr. 2021, 41, 91–101. [Google Scholar] [CrossRef]
  28. Sandhu, H.; Wratten, S.D. Ecosystem services in farmland and cities. In Ecosystem Services in Agricultural and Urban Landscapes, 1st ed.; Wratten, S., Sandhu, H., Eds.; John Wiley & Sons, Ltd.: Chicheste, UK, 2013; Volume 1, pp. 1–15. [Google Scholar]
  29. Li, F.; Yin, C. Assessment of the functions and ecological services values of green manure in paddy fields in South China. Chin. J. Eco-Agric. 2019, 27, 327–336. [Google Scholar] [CrossRef]
  30. Zou, B.; Xu, S.; Sternberg, T.; Fang, X. Effect of land use and cover change on air quality in urban sprawl. Sustainability 2016, 8, 677. [Google Scholar] [CrossRef] [Green Version]
  31. Mokoena, K.K.; Ethan, C.J.; Yu, Y.; Shale, K. Ambient air pollution and respiratory mortality in Xi’an, China: A time-series analysis. Respir. Res. 2019, 20, 139. [Google Scholar] [CrossRef]
  32. Liu, N.; Liu, C.Z.; Xia, Y.F.; Da, B. Examining the coordination between urbanization and eco-environment using coupling and spatial analyses: A case study in China. Ecol. Indic. 2018, 93, 1163–1175. [Google Scholar] [CrossRef]
  33. Fu, S.; Zhuo, H.; Song, H.; Wang, J.; Ren, L. Examination of a coupling coordination relationship between urbanization and the eco-environment: A case study in Qingdao, China. Environ. Sci. Pollut. Res. 2022, 27, 23981–23993. [Google Scholar] [CrossRef]
  34. Zhao, Y.; Wang, S.; Zhou, C. Understanding the relation between urbanization and the eco-environment in China’s Yangtze River Delta using an improved EKC model and coupling analysis. Sci. Total Environ. 2016, 571, 862–875. [Google Scholar] [CrossRef]
  35. Lu, C.; Li, S.; Liu, J.; Xu, K. Coupling Coordination and Dynamic Response Analysis of New-Type Urbanization, Urban Infrastructure and Urban Environment-A Case Study of the Jiaodong Economic Circle. Int. J. Environ. Res. Public Health 2022, 19, 14909. [Google Scholar] [CrossRef]
  36. Zou, Z.H.; Yun, Y.; Sun, J.N. Entropy method for determination of weight of evaluating indicators in fuzzy synthetic evaluation for water quality assessment. J. Environ. Sci. (China) 2006, 18, 1020–1023. [Google Scholar] [CrossRef]
  37. Han, R.L.; Tong, L.J.; Tong, W.M.; Yu, J.H. Coordinated evolvement of dynamic coupling between economic and environmental systems in Shenyang Metropolitan Area. Yingyong Shengtai Xuebao 2011, 22, 2673–2680. (In Chinese) [Google Scholar]
  38. Zhu, Y.; He, G.; Zhang, G.; Bao, K.; Yang, C.; Wang, X. Research on coupling coordination and spatial differentiation of new-type urbanization and ecological environment in Wanjiang demonstration area. GeoJournal 2022, 87, 1511–1523. [Google Scholar] [CrossRef]
  39. Xiong, J.X.; Chen, D.L.; Peng, B.F.; Deng, S.T.; Xie, X.M. Spatio-temporal difference of coupling coordinative degree of ecological carrying capacity in the Dongting lake region. Geography 2014, 34, 1108–1116. [Google Scholar]
  40. Song, M.; Hu, C.A. A Coupling relationship between the eco-environment carrying capacity and new-type urbanization: A case study of the Wuhan metropolitan area in China. Sustainability 2018, 10, 4671. [Google Scholar] [CrossRef] [Green Version]
Figure 1. Overview of the Xi’an metropolitan area location.
Sustainability 15 04533 g001
Figure 2. Spatial distribution and magnitude of changes in population agglomeration, the natural ecological environment, and the built environment.
Sustainability 15 04533 g002
Figure 3. Spatial distribution of the coupling degree in the “population–environment” in 2000, 2010, and 2020.
Sustainability 15 04533 g003
Figure 4. Spatial distribution of the coupling coordination degree in the “population–environment” in 2000, 2010, and 2020.
Sustainability 15 04533 g004
Figure 5. The distribution of five types of “population–environment” coupling coordination relationship in the Xi’an metropolitan area.
Sustainability 15 04533 g005
Table 1. Research data sources.
Data CategoryData Acquisition PlatformThe Set of Data SourcesData Description
Socio-economic statisticshttps://www.yearbookchina.com“Xi’an City Statistical Yearbook” (2001/2011/2021)It is released by government statistics and comprehensively, systematically, and continuously records annual population, economy, society, and other indicators.
“Xianyang City Statistical Yearbook” (2001/2011/2021)
Weinan City Statistical Yearbook” (2001/2011/2021)
“Tongchuan City Statistical Yearbook” (2001/2011/2021)
Official website of each district and county government in Xi’an metropolitan areaLocal statistical bulletins (2001/2011/2021)
Remote sensing image datahttp://www.globallandcover.com/Global land cover data30 m spatial resolution
http://www.gscloud.cn/Landsat 8 OLI_TIRS satellite digital product11 band and image files
https://crudata.uea.ac.uk/cru/data/hrg/, accessed on 30 December 2021.CRU TS It covers data such as day-night temperature difference, frost day, transpiration, temperature, etc., at 0.5° resolution.
https://lasweb.modaps.eosdis.nasa.gov/
https://search.asf.alaska.edu/
MODIS environmental observation dataIt covers atmosphere, ocean, vegetation, crust, and other aspects of spatial data. and collects MODIS 1LB standard data.
Elevation data12.5 m spatial resolution
Vector datahttps://lbs.amap.com/POI dataCrawl the spatial distribution points of facilities of the specified category of the specified area.
https://www.webmap.cn/Geospatial data of China1:250,000 geographic information data year 2015, a total of 816 pictures. The content includes nine datasets, including water systems, residential areas and facilities, realms and political districts, and geographical names.
Table 3. Judgment for the coupling state.
Judgment ConditionsCoupling State
(0, 0.3]Low-level coupling
(0.3, 0.5]Antagonistic coupling
(0.5, 0.8]Learning stage
(0.8, 1.0]High-level coupling
Table 4. Judgment for the coupling coordination level.
Value Interval of Coupling Coordination Degree DCoupling Coordination LevelValue Interval of Coupling Coordination Degree DCoupling Coordination Level
(0, 0.1]Extreme incoordination(0.5, 0.6]Reluctant coordination
(0.1, 0.2]Severe incoordination(0.6, 0.7]Elementary coordination
(0.2, 0.3]Moderate incoordination(0.7, 0.8]Intermediate coordination
(0.3, 0.4]Mild incoordination(0.8, 0.9]Good coordination
(0.4, 0.5]Verge of incoordination(0.9, 1.0]Excellent coordination
Table 5. Correlation test of factors influencing the coupling coordination of the “population–environment” system in the Xi’an metropolitan area.
D Value in Yearx1x2x3x4X5a1a2a3a4a5a6
20000.203−0.177−0.459 *0.465 *−0.557 **0.3760.3210.398 *−0.651 **0.1240.007
20100.004−0.342−0.231−0.2560.1480.390 *0.463 *−0.054−0.601 **0.125−0.167
2020−0.290−0.424 *0.148−0.425 *−0.1910.582 **0.610 **0.024−0.428 *0.2350.316
D Value in Yeara7a8b1b2b3b4b5b6b7b8
2000−0.662 **−0.2120.0890.521 **−0.0290.389 *0.304−0.1820.422 *0.199
2010−0.464 *−0.390 *0.017−0.264−0.1920.1280.430 *−0.320−0.1550.123
2020−0.235−0.354−0.155−0.615 **−0.3730.2490.534 **−0.467 *0.1400.147
**. Significantly correlated at the 0.01 level (bilateral); *. Significantly correlated at the 0.05 level (bilateral).
Table 6. Analysis of factors influencing the coupling coordination of the “population–environment” system in the Xi’an metropolitan area in 2000, 2010, and 2020.
Correlation200020102020
Significant positive correlationGrowth rate of total retail sales of social consumption
(r = 0.52, p = 0.006 < 0.01)
Fractional vegetation cover
(r = 0.46, p = 0.017 < 0.05)
Fractional vegetation cover (r = 0.61, p = 0.001 < 0.01)
Per capita urban disposable income
(r = 0.47, p = 0.017 < 0.05)
Per capita forest park green area
(r = 0.43, p = 0.028 < 0.05)
Afforestation area in the current year (r = 0.58, p = 0.002 < 0.01)
Number of medical institutions per 10,000 persons
(r = 0.42, p = 0.032 < 0.05)
Afforestation area in the current year (r = 0.39, p = 0.049 < 0.05)Per capita forest park green area
(r = 0.53, p = 0.005 < 0.01)
Effective irrigated area of farmland
(r = 0.40, p = 0.044 < 0.05)
Proportion of tertiary industry in total GDP (r = 0.39, p = 0.049 < 0.05)
Significant Negative correlationAnnual maximum temperature
(r = | −0.66|, p = 0.0001 < 0.01)
Proportion of farmland patch area
(r = | −0.60|, p = 0.001 < 0.01)
Growth rate of total retail sales of social consumption
(r = | −0.62|, p = 0.001 < 0.01)
Proportion of farmland patch area
(r = | −0.65|, p = 0.0001 < 0.01)
Annual maximum temperature
(r = | −0.46|, p = 0.017 < 0.05)
Distribution density of secondary education schools
(r = | −0.47|, p = 0.016 < 0.05)
Rural disposable income
(r = | −0.56|, p = 0.003 < 0.01)
Aerosol Optical Depth of days with the worst air quality
(r = | −0.39|, p = 0.049 < 0.05)
Proportion of farmland patch area
(r = | −0.43|, p = 0.029 < 0.05)
Per capita construction land area
(r = | −0.050|, p = 0.018 < 0.05)
Per capita rural disposable income
(r = | −0.43|, p = 0.03 < 0.05)
Resident population density
(r = | −0.42|, p = 0.031 < 0.05)
Note: Factors are sorted from the highest to lowest correlation coefficient.
Disclaimer/Publisher’s Note: The statements, opinions and data contained in all publications are solely those of the individual author(s) and contributor(s) and not of MDPI and/or the editor(s). MDPI and/or the editor(s) disclaim responsibility for any injury to people or property resulting from any ideas, methods, instructions or products referred to in the content.

