

An IVIF-Distance Measure and Relative Closeness Coefficient-Based Model for Assessing the Sustainable Development Barriers to Biofuel Enterprises in India


Abstract
:1. Introduction
- Distance measure, as one of the important information measures, plays a vital role in real-life problems such as decision-making, pattern recognition, texture recognition, and so forth. In this study, we propose a new IVIF-distance measure with enviable properties to measure the degree of discrimination between IVIFSs.
- Direct assumption of decision experts’ (DEs’) weights results in loss of information while making decisions. Thus, it is very important to determine the weights of DEs during the process of decision-making. In this paper, we propose a new IVIF-score value and rank sum (RS) model-based weighting approach to derive the DEs’ weights within the IVIFS context.
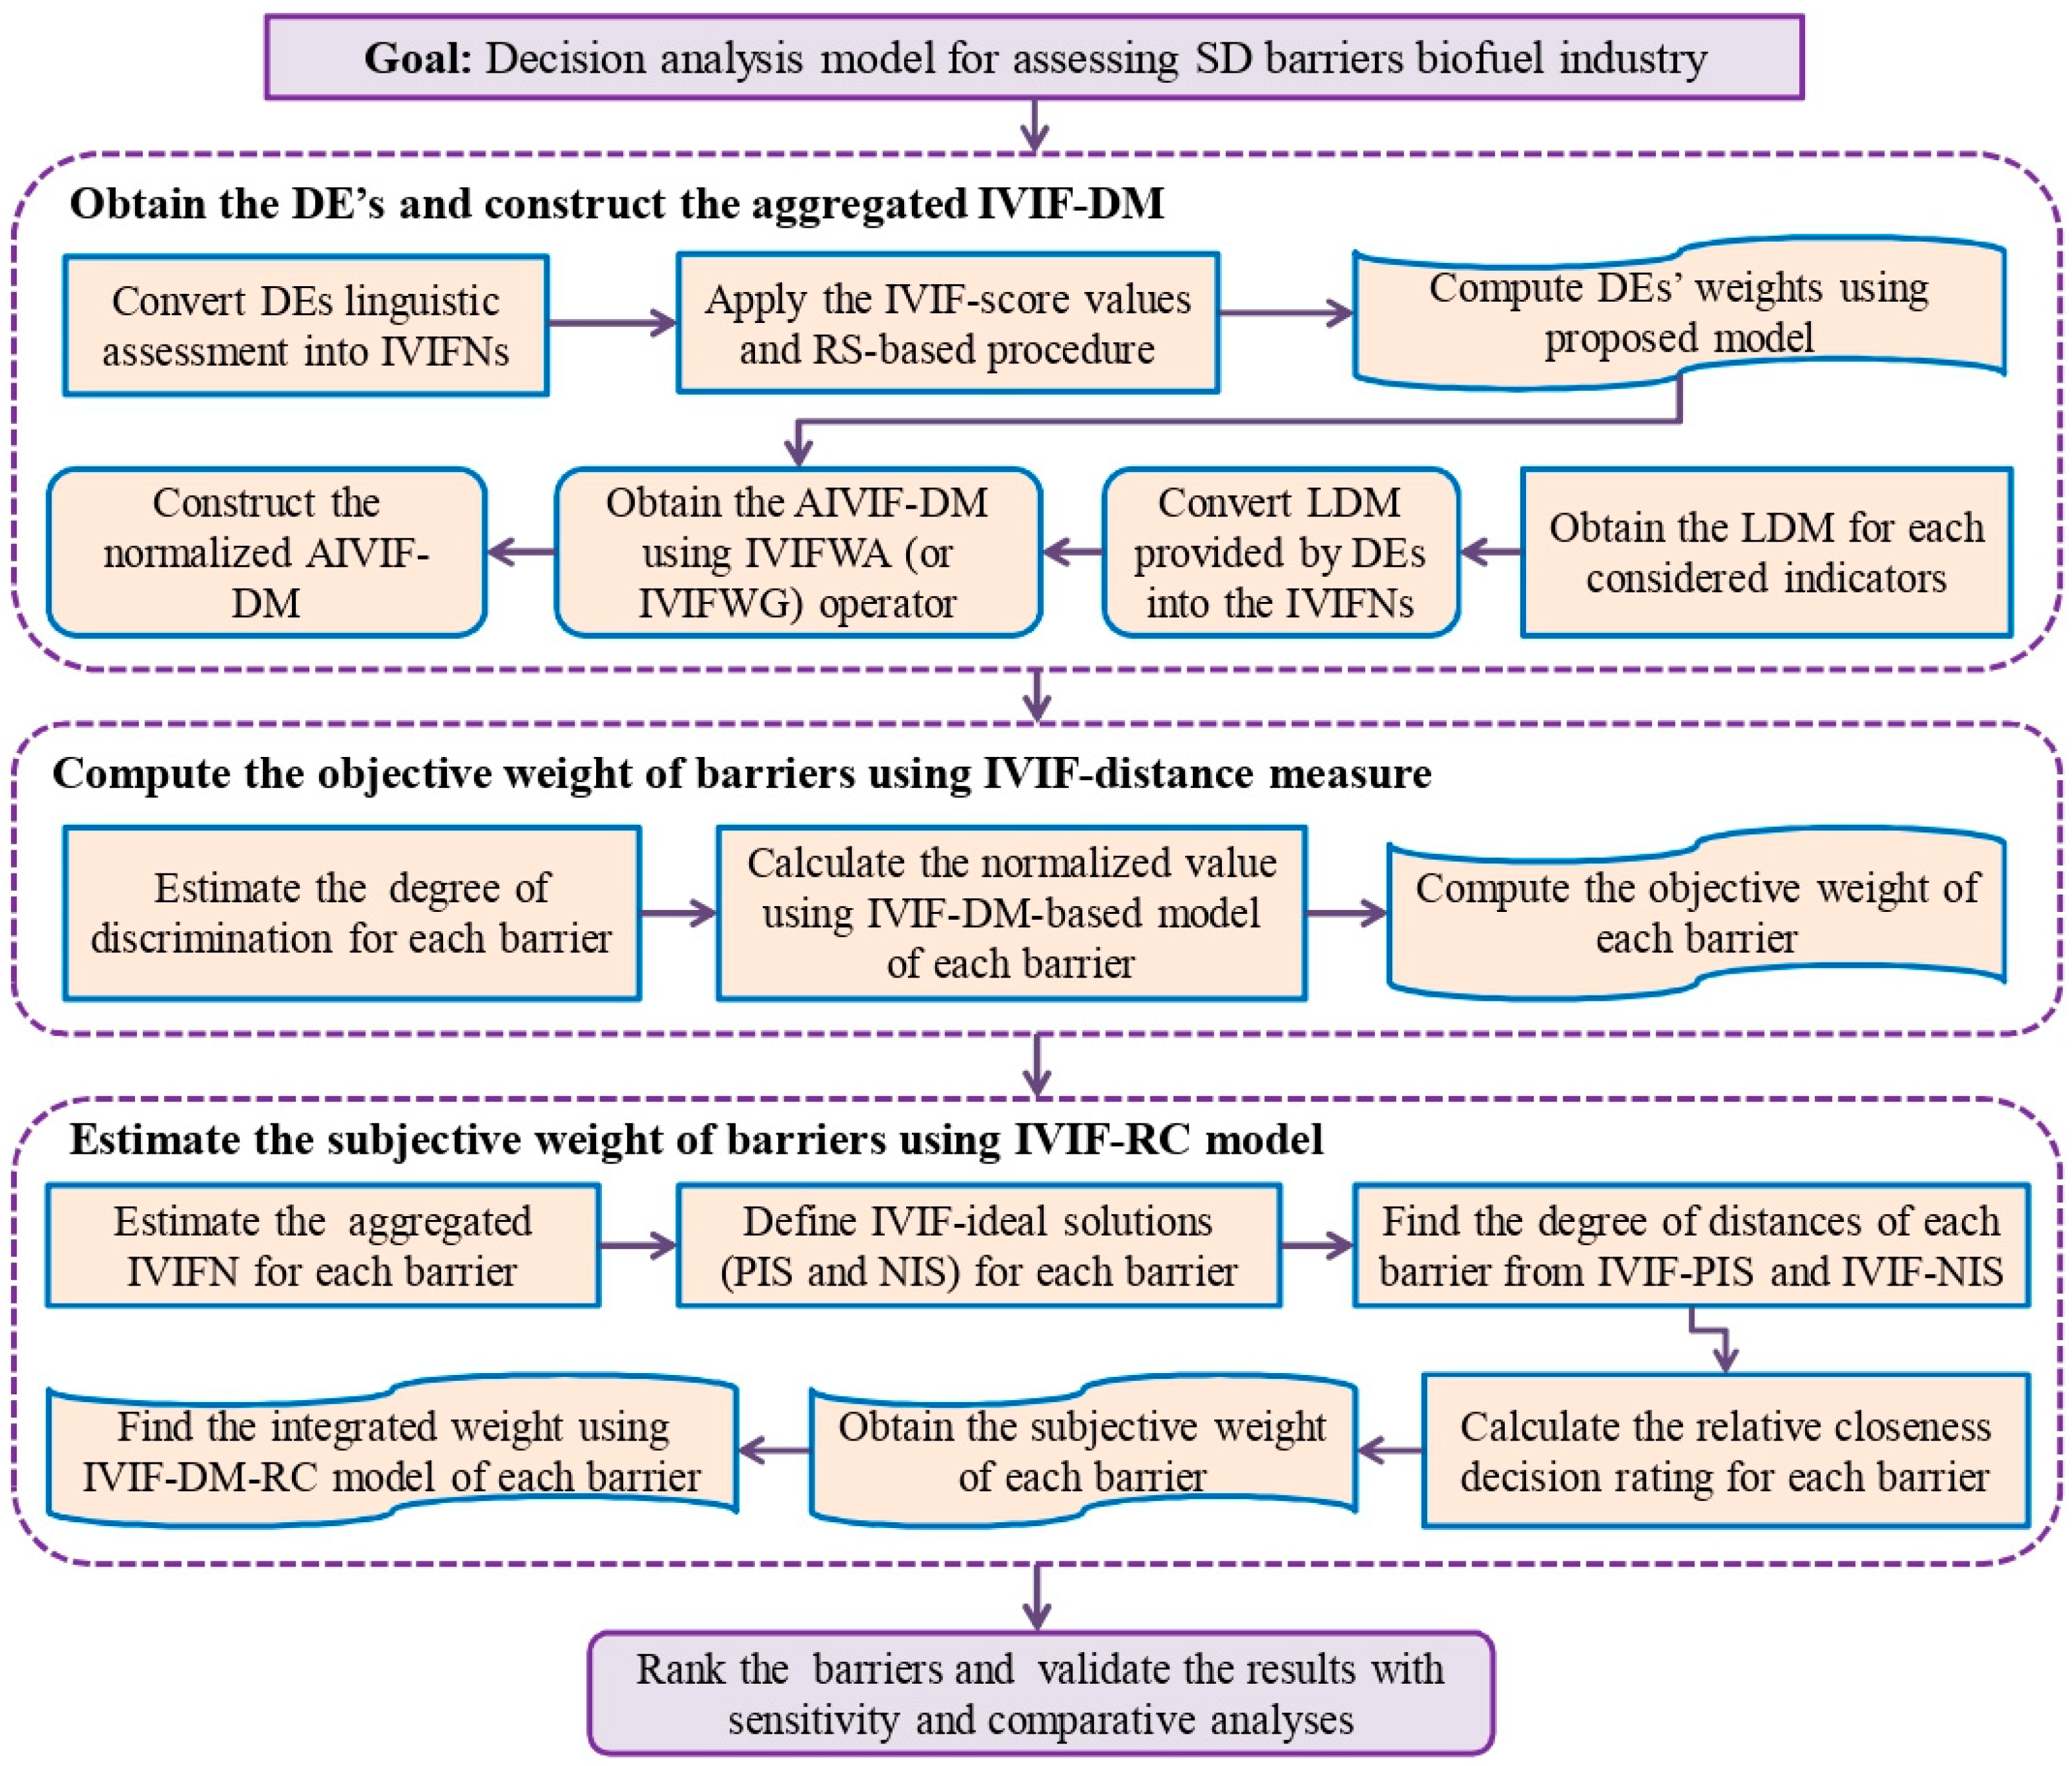
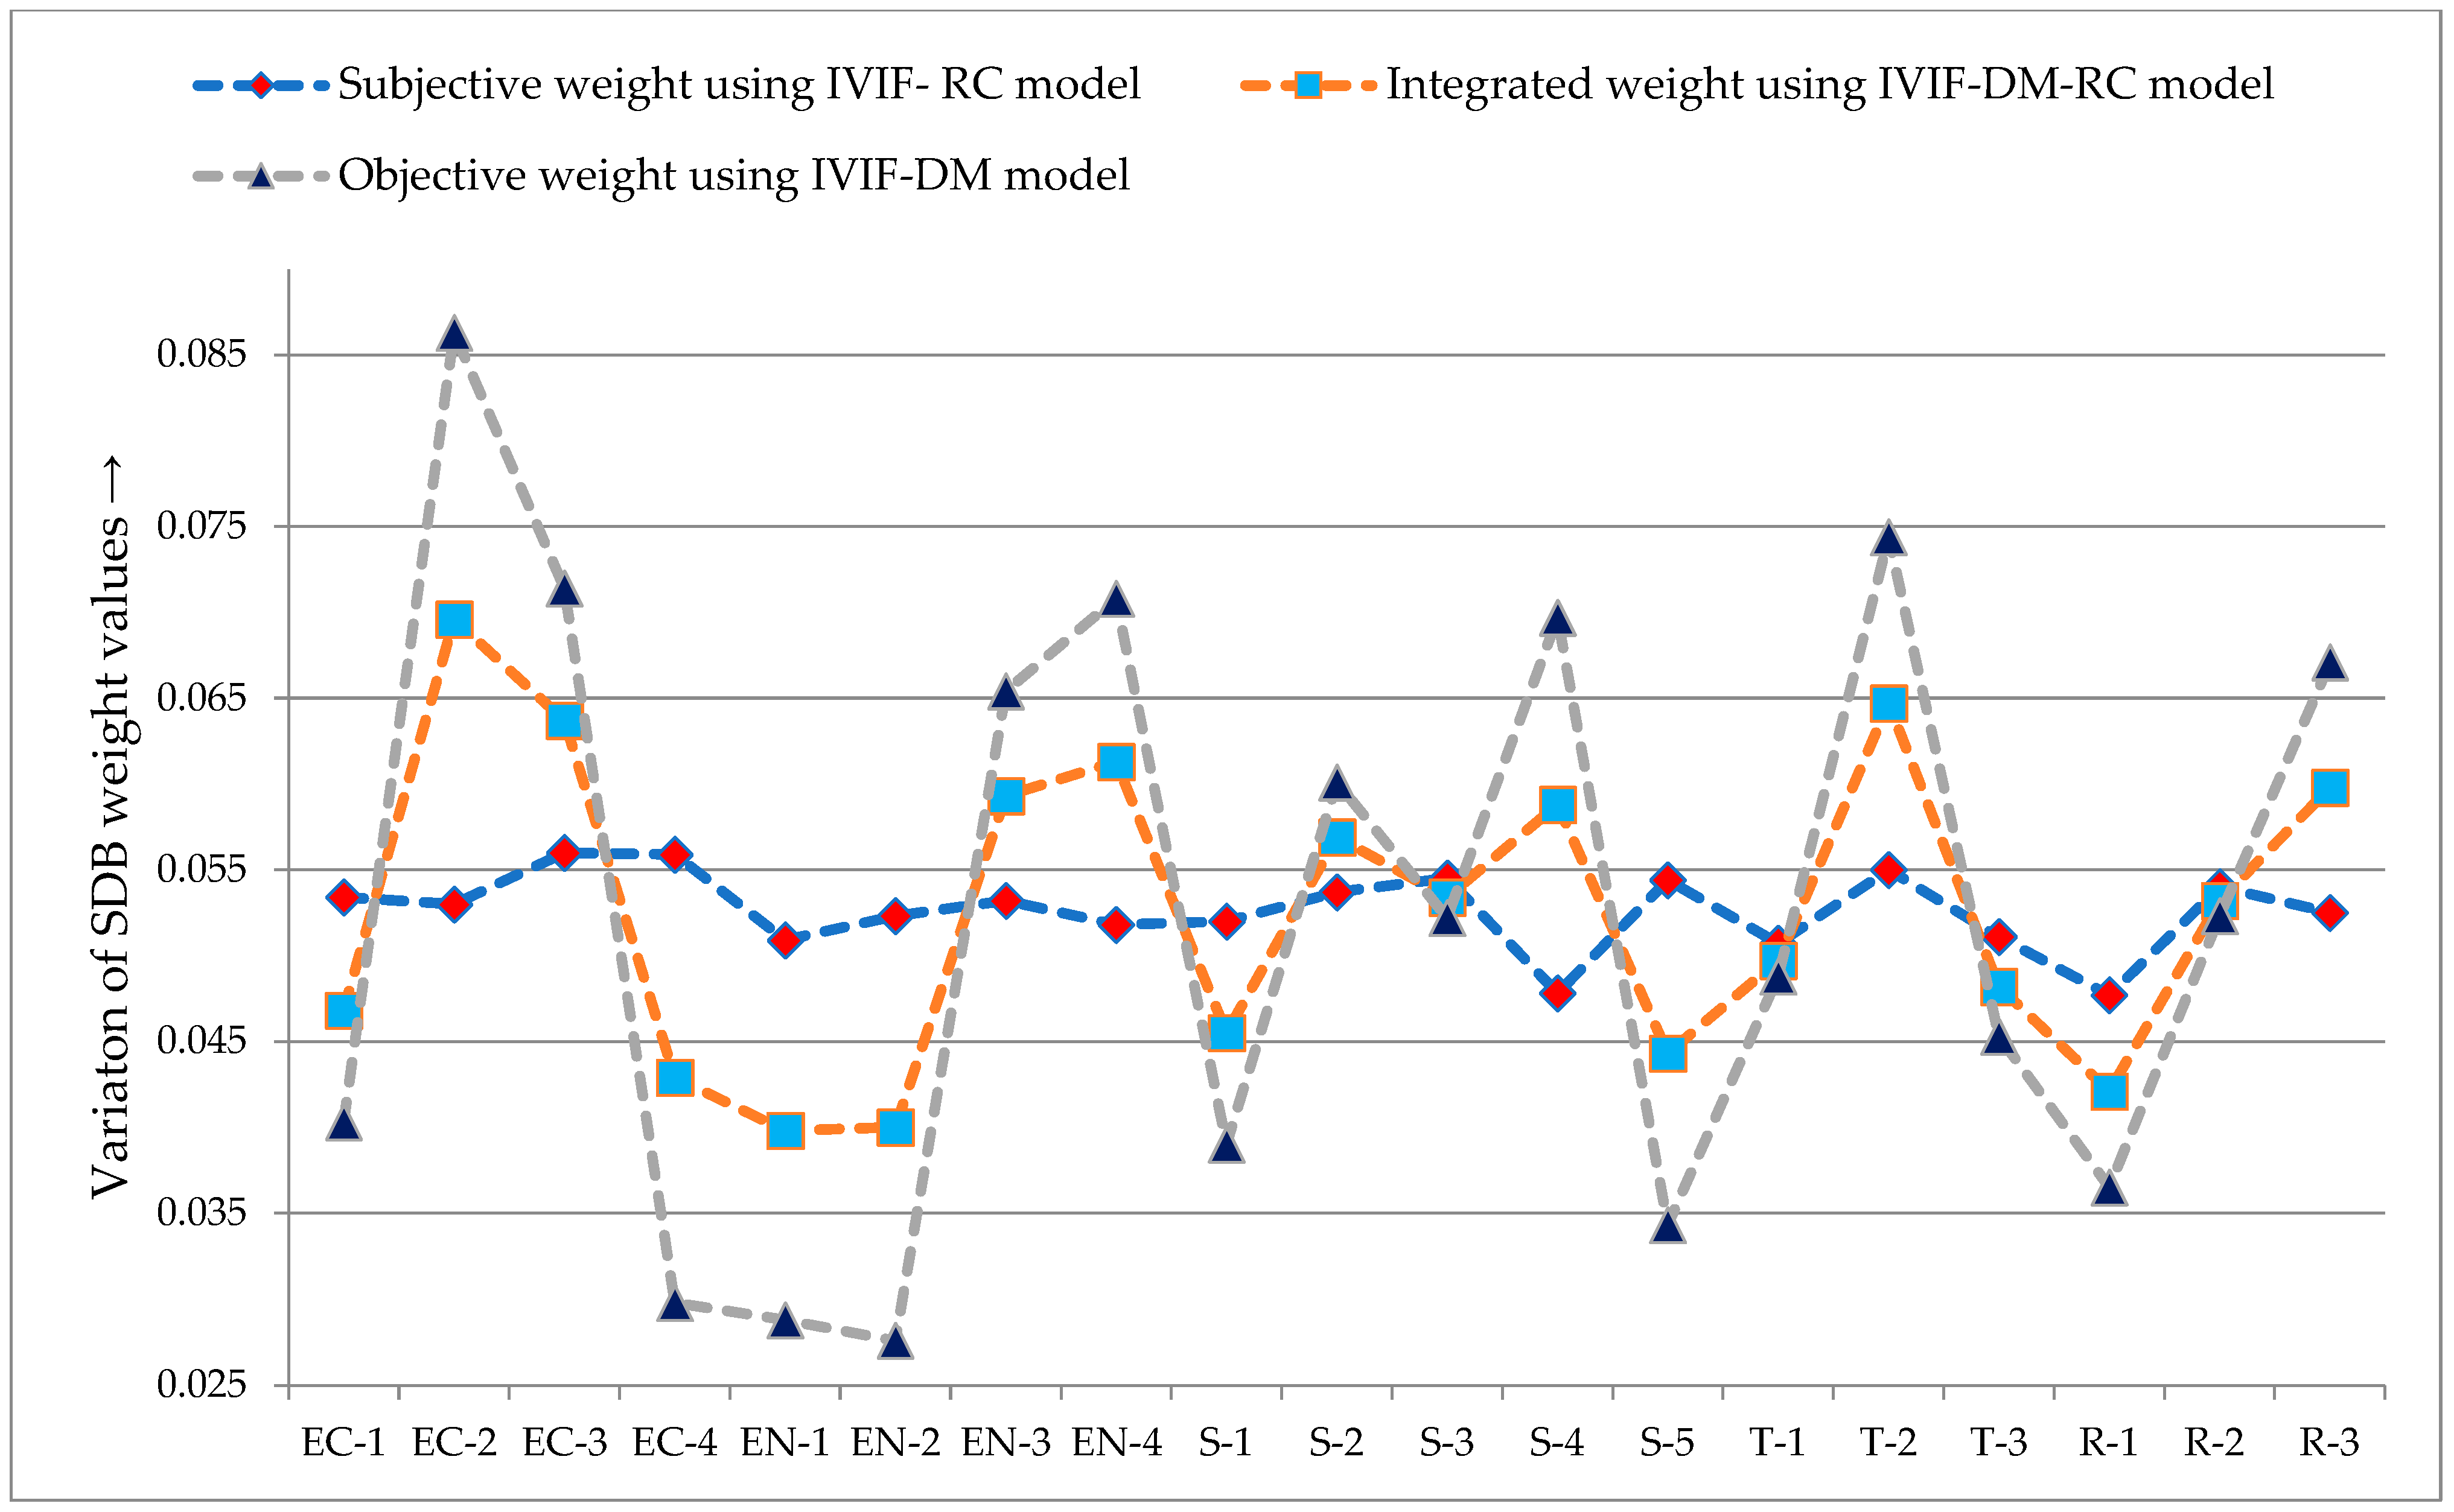
- In order to consider the relative closeness coefficient of barriers, this paper presents a new IVIF-distance-based model and uses it to find the objective and subjective weight of barriers to prioritize the SDBs in the biofuel industry.
2. Literature Review
2.1. Studies on the Biofuel Sector
2.2. Review on IVIFSs and MADA
3. IVIF-Distance Measure
3.1. Preliminaries
3.2. Proposed IVIF-Distance Measure
4. Proposed IVIF-DM-Relative Closeness Coefficient Model
5. Case Study: Assessment of SDBs to BEs in India
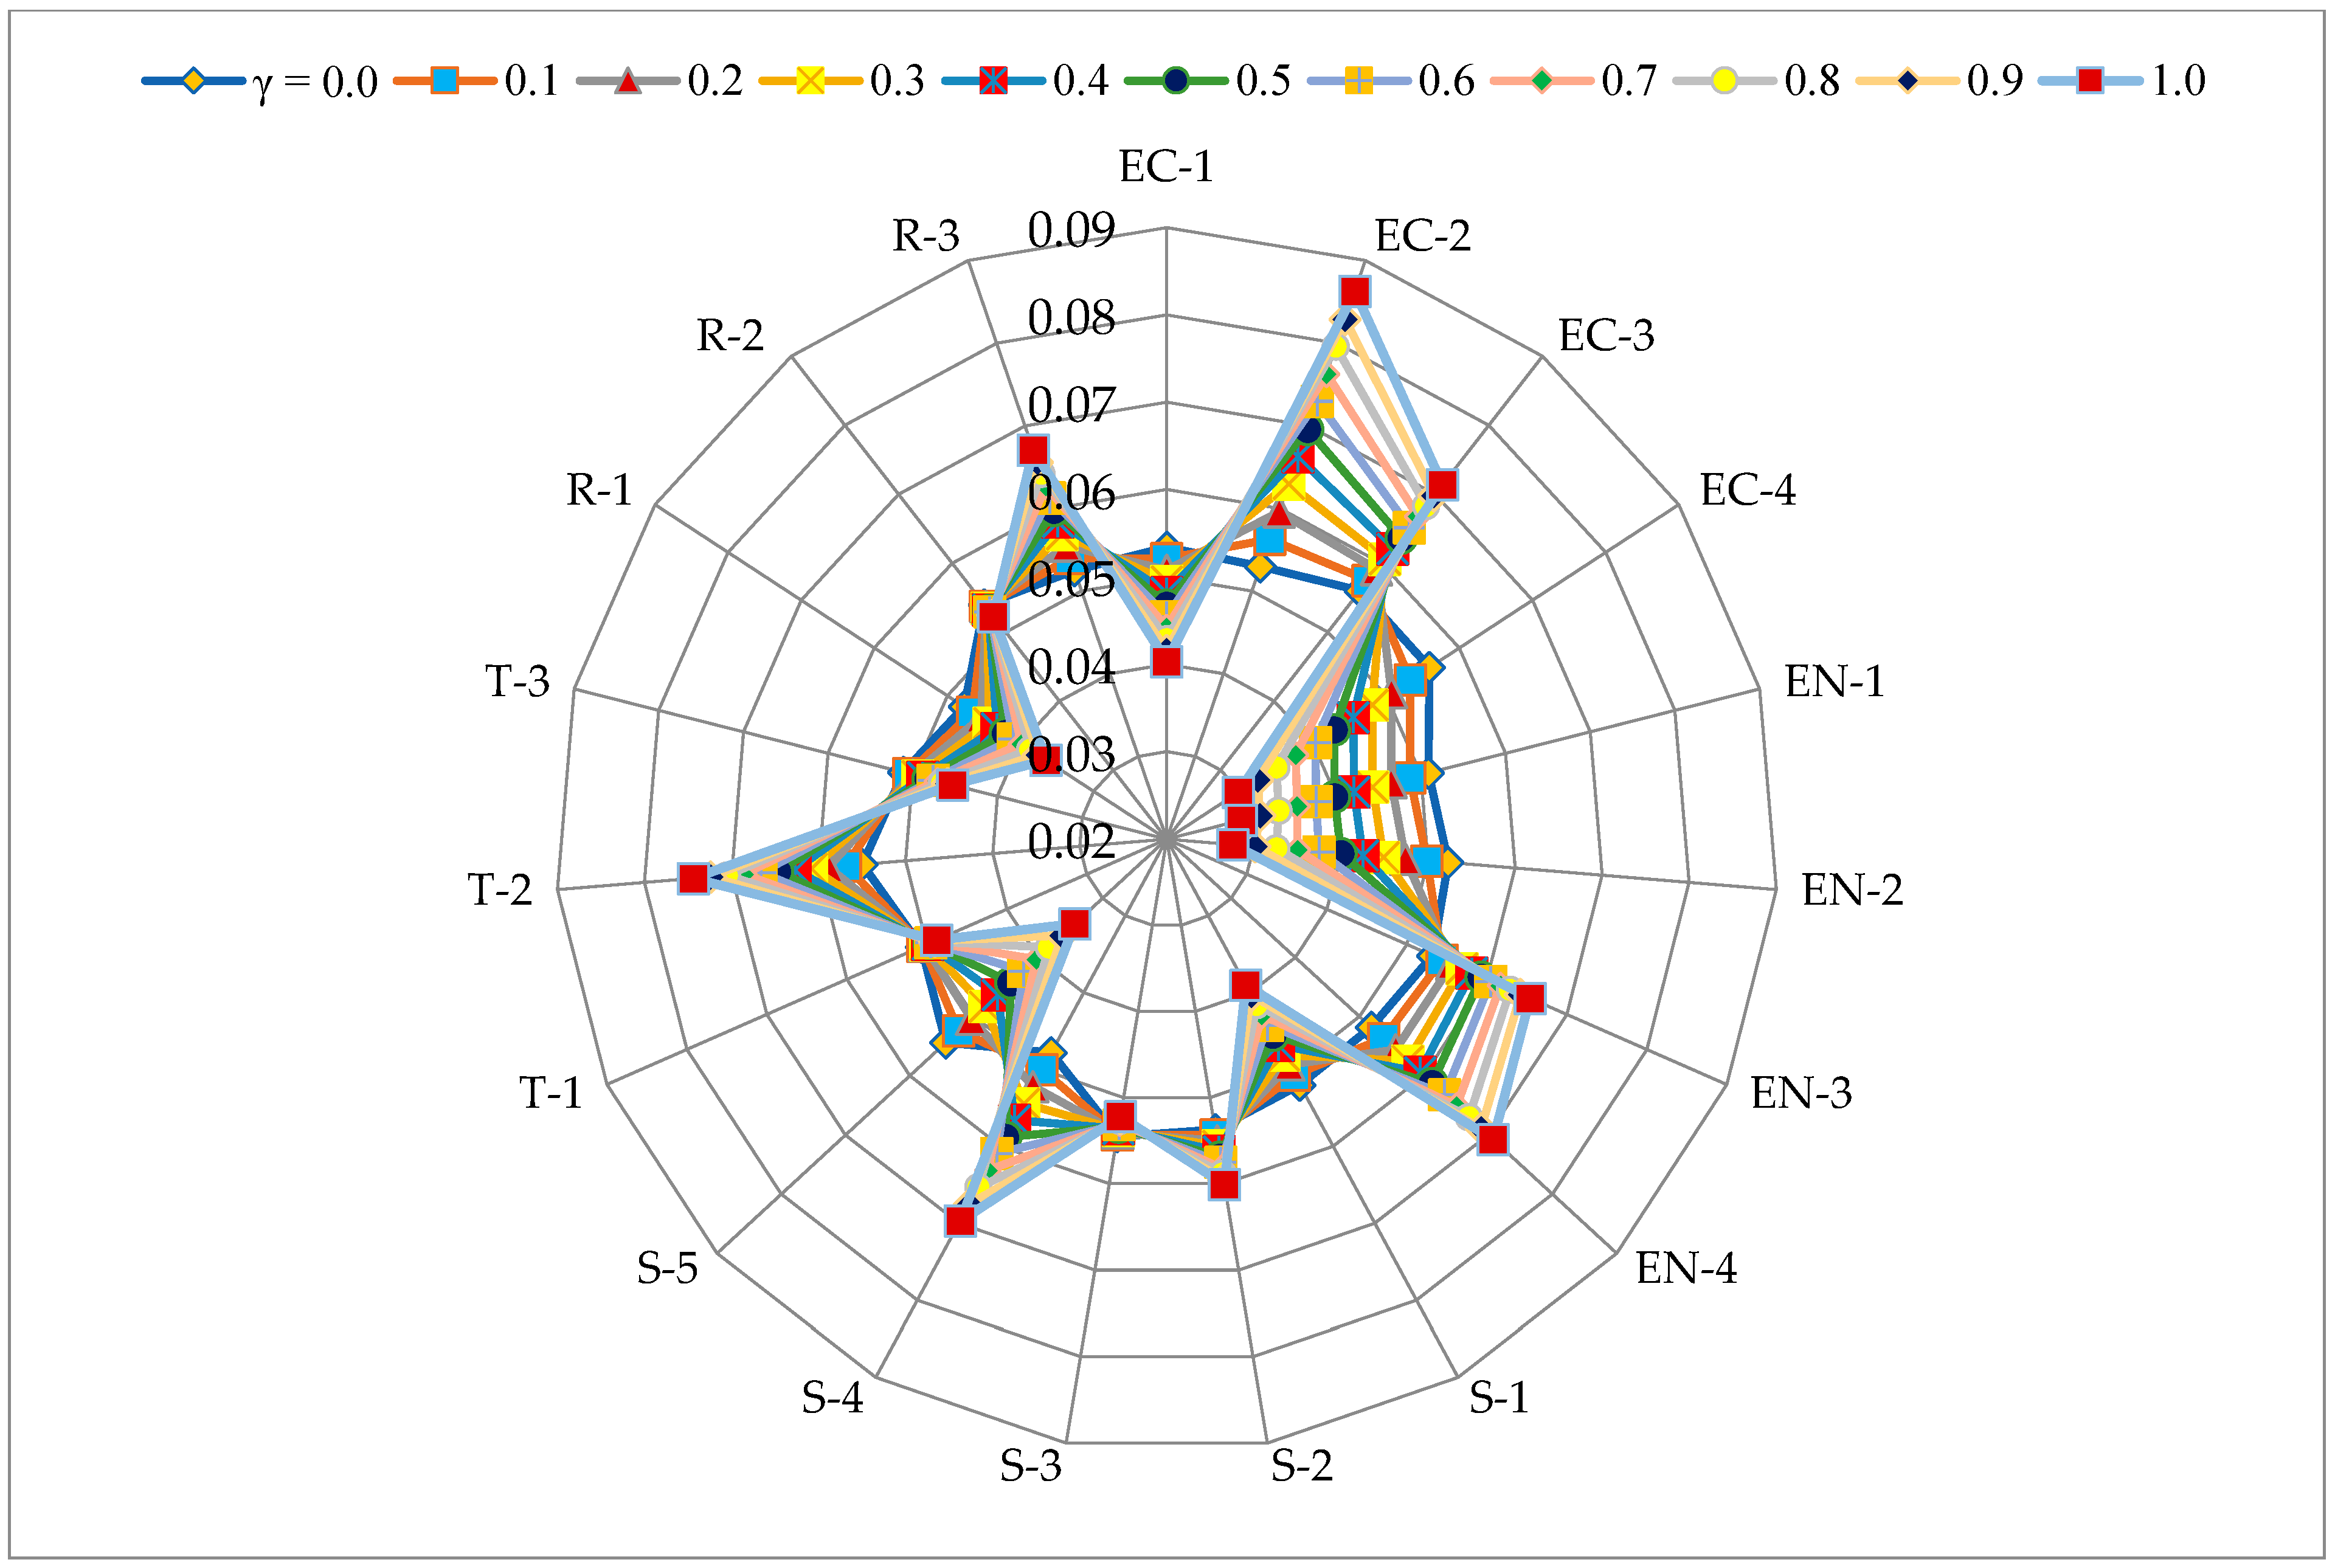
5.1. Sensitivity Analysis
5.2. Discussion and Implications
- —
- In the present work, we determine a systematic assessment of the DEs’ weights using the IVIF-score value and IVIF-rank sum model, which reduces the imprecision and biases in the MADA procedure, while existing studies do not provide this information.
- —
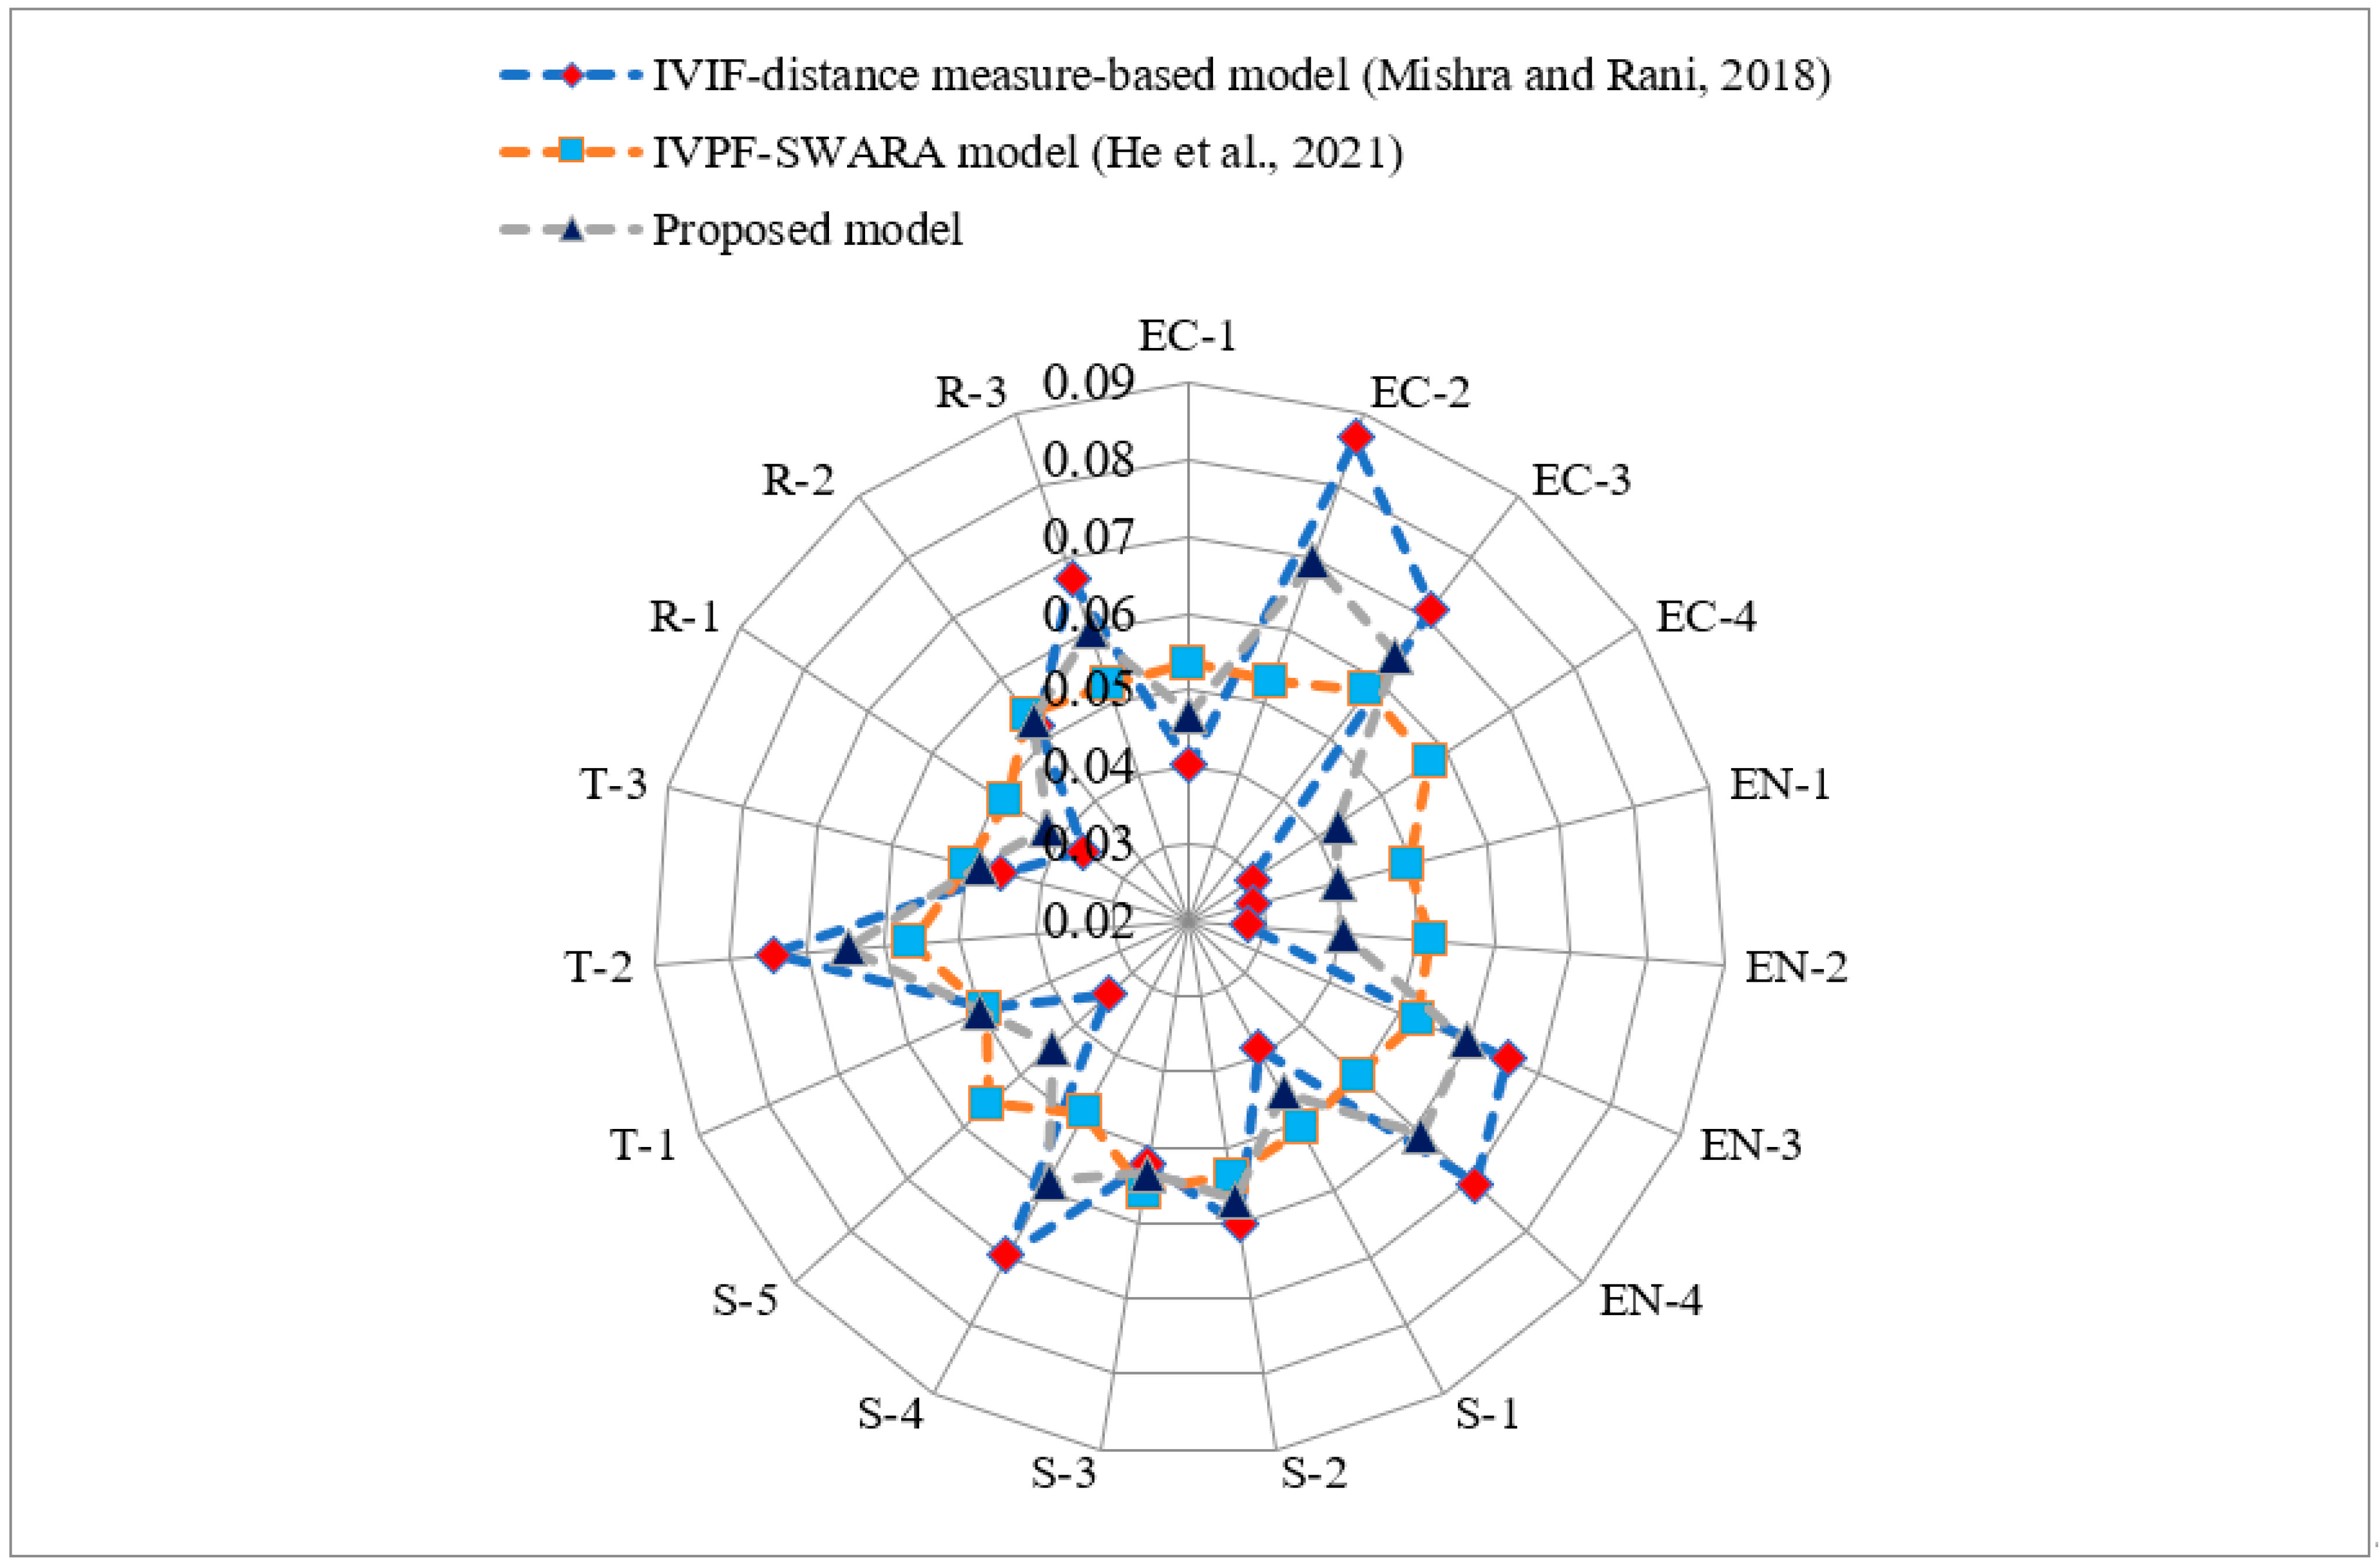
- The developed method determines the integrated weights (combination of objective and subjective weighting) of SDBs using the IVIF-DM-relative closeness coefficient-based tool. In contrast, in IVPF-SWARA, the subjective weighting of SDB is estimated with the SWARA model, and in the IVIF-distance measure-entropy model, the objective weights of the SDBs are obtained using distance measure and entropy-based approach.
- —
6. Conclusions
- (i)
- The considered evaluation criteria are not inter-dependent;
- (ii)
- Risk aspects of sustainability are missing during the assessment of SDBs;
- (iii)
- The proposed work is not able to express uncertain, indeterminate, and inconsistent information simultaneously.
Author Contributions
Funding
Institutional Review Board Statement
Informed Consent Statement
Data Availability Statement
Conflicts of Interest
References
- Liang, H.; Ren, J.; Gao, Z.; Gao, S.; Luo, X.; Dong, L.; Scipioni, A. Identification of critical success factors for sustainable development of biofuel industry in China based on grey decision-making trial and evaluation laboratory (DEMATEL). J. Clean. Prod. 2016, 131, 500–508. [Google Scholar] [CrossRef] [Green Version]
- Mortensen, A.W.; Mathiesen, B.V.; Hansen, A.B.; Pedersen, S.L.; Grandal, R.D.; Wenzel, H. The role of electrification and hydrogen in breaking the biomass bottleneck of the renewable energy system—A study on the Danish energy system. Applied Energy 2020, 275, 115331. [Google Scholar] [CrossRef]
- Zhang, X.; Li, H.; Harvey, J.T.; Butt, A.A.; Jia, M.; Liu, J. A review of converting woody biomass waste into useful and eco-friendly road materials. Transp. Saf. Environ. 2021, 4, tdab031. [Google Scholar] [CrossRef]
- Khan, M.A.H.; Bonifacio, S.; Clowes, J.; Foulds, A.; Holland, R.; Matthews, J.C.; Percival, C.J.; Shallcross, D.E. Investigation of biofuel as a potential renewable energy source. Atmosphere 2021, 12, 1289. [Google Scholar] [CrossRef]
- Cadillo-Benalcazar, J.J.; Bukkens, S.G.F.; Ripa, M.; Giampietro, M. Why does the European Union produce biofuels? Examining consistency and plausibility in prevailing narratives with quantitative storytelling. Energy Res. Soc. Sci. 2021, 71, 101810. [Google Scholar] [CrossRef]
- Bhutto, A.W.; Bazmi, A.A.; Zahedi, G. Greener energy: Issues and challenges for Pakistan—Biomass energy prospective. Renew. Sustain. Energy Rev. 2011, 15, 3207–3219. [Google Scholar] [CrossRef]
- Bravo, M.D.L.; Naim, M.M.; Potter, A. Key issues of the upstream segment of biofuels supply chain: A qualitative analysis. Logist. Res. 2012, 5, 21–31. [Google Scholar] [CrossRef]
- Altan, A.; Karasu, S.; Bekiros, S. Digital currency forecasting with chaotic metaheuristic bio-inspired signal processing techniques. Chaos, Solit. Fractals 2019, 126, 325–336. [Google Scholar] [CrossRef]
- Piterou, A.; Shackley, S.; Upham, P. Project ARBRE: Lessons for bio-energy developers and policy-makers. Energy Policy 2008, 36, 2044–2050. [Google Scholar] [CrossRef]
- Kumar, A.; Kumar, N.; Baredar, P.; Shukla, A. A review on biomass energy resources, potential, conversion and policy in India, Renew. Sustain. Energy Rev. 2015, 45, 530–539. [Google Scholar] [CrossRef]
- Singh, J.; Gu, S. Biomass conversion to energy in India-A critique. Renew. Sustain. Energy Rev. 2010, 14, 1367–1378. [Google Scholar] [CrossRef]
- Narwane, V.S.; Yadav, V.S.; Raut, R.D.; Narkhede, B.E.; Gardas, B.B. Sustainable development challenges of the biofuel industry in India based on integrated MCDM approach. Renew. Energy 2021, 164, 298–309. [Google Scholar] [CrossRef]
- IEA. World Energy Outlook 2014; Int. Energy Agency (IEA): Paris, France, 2014. Available online: http://www.iea.org/publications/freepublications/publication/WEO2014.pdf (accessed on 5 January 2023).
- Purohit, P.; Dhar, S. Promoting Low Carbon Transport in India, Biofuel Roadmap for India; UNEP: Nairobi, Kenya, 2015.
- Upreti, B.R. Conflict over biomass energy development in the United Kingdom: Some observations and lessons from England and Wales. Energy Policy 2004, 32, 785–800. [Google Scholar] [CrossRef]
- Charles, M.B.; Ryan, R.; Ryan, N.; Oloruntoba, R. Public policy and biofuels: The way forward? Energy Policy 2007, 35, 5737–5746. [Google Scholar] [CrossRef]
- D’Adamo, I.; Gastaldi, M.; Morone, P.; Rosa, P.; Sassanelli, C.; Settembre-Blundo, D.; Shen, Y. Bioeconomy of Sustainability: Drivers, Opportunities and Policy Implications. Sustainability 2022, 14, 200. [Google Scholar] [CrossRef]
- D’Adamo, I.; Rosa, P. A structured literature review on obsolete electric vehicles management practices. Sustainability 2019, 11, 6876. [Google Scholar] [CrossRef] [Green Version]
- Atanassov, K.; Gargov, G. Interval valued intuitionistic fuzzy sets. Fuzzy Sets Syst. 1989, 31, 343–349. [Google Scholar] [CrossRef]
- Kumar, K.; Chen, S.-M. Multiattribute decision making based on interval-valued intuitionistic fuzzy values, score function of connection numbers, and the set pair analysis theory. Inf. Sci. 2021, 551, 100–112. [Google Scholar] [CrossRef]
- Mishra, A.R.; Rani, P. Interval-valued intuitionistic fuzzy WASPAS method: Application in reservoir flood control management policy. Group Decis. Negot. 2018, 27, 1047–1078. [Google Scholar] [CrossRef]
- Alrasheedi, M.; Mardani, A.; Mishra, A.R.; Streimikiene, D.; Liao, H.; Al-nefaie, A.H. Evaluating the green growth indicators to achieve sustainable development: A novel extended interval-valued intuitionistic fuzzy-combined compromise solution approach. Sustain. Dev. 2021, 29, 120–142. [Google Scholar] [CrossRef]
- Jernstrom, E.; Karvonen, V.; Kassi, T.; Kraslawski, A.; Hallikas, J. The main factors affecting the entry of SMEs into bio-based industry. J. Clean. Prod. 2017, 141, 1–10. [Google Scholar] [CrossRef]
- Saravanan, A.P.; Mathimani, T.; Deviram, G.; Rajendran, K.; Pugazhendhi, A. Biofuel policy in India: A review of policy barriers in sustainable marketing of biofuel. J. Clean. Prod. 2018, 193, 734–747. [Google Scholar] [CrossRef]
- Malode, S.J.; Prabhu, K.K.; Mascarenhas, R.J.; Shetti, N.P.; Aminabhavi, T.M. Recent advances and viability in biofuel production. Energy Convers. Manag. X 2021, 10, 100070. [Google Scholar] [CrossRef]
- Hajek, P.; Froelich, W. Integrating TOPSIS with interval-valued intuitionistic fuzzy cognitive maps for effective group decision making. Inf. Sci. 2019, 485, 394–412. [Google Scholar] [CrossRef]
- Xu, Z. Methods for aggregating interval-valued intuitionistic fuzzy information and their application to decision making. Control. Decis. 2007, 22, 215–219. [Google Scholar]
- Wang, W.; Mendel, J.M. Interval-valued intuitionistic fuzzy aggregation methodology for decision making with a prioritization of criteria. Iran. J. Fuzzy Syst. 2019, 16, 115–127. [Google Scholar]
- Hu, K.; Tan, Q.; Zhang, T.; Wang, S. Assessing technology portfolios of clean energy-driven desalination-irrigation systems with interval-valued intuitionistic fuzzy sets. Renew. Sustain. Energy Rev. 2020, 132, 109950. [Google Scholar] [CrossRef]
- Mishra, A.R.; Rani, P.; Pardasani, K.R.; Mardani, A.; Stević, Ž.; Pamučar, D. A novel entropy and divergence measures with multi-criteria service quality assessment using interval-valued intuitionistic fuzzy TODIM method. Soft Comput. 2020, 24, 11641–11661. [Google Scholar] [CrossRef]
- Oraki, M.; Gordji, M.E.; Ardakani, H. Some frank aggregation operators based on the interval-valued intuitionistic fuzzy numbers. Int. J. Nonlinear Anal. Appl. 2021, 12, 325–342. [Google Scholar]
- Bharati, S.K. Transportation problem with interval-valued intuitionistic fuzzy sets: Impact of a new ranking. Prog. Artif. Intell. 2021, 10, 129–145. [Google Scholar] [CrossRef]
- Bai, Z.-Y. An interval-valued intuitionistic fuzzy TOPSIS method based on an improved score function. Sci. World J. 2013, 2013, 879089. [Google Scholar] [CrossRef] [PubMed] [Green Version]
- Xu, Z. A method based on distance measure for interval-valued intuitionistic fuzzy group decision making. Inf. Sci. 2010, 180, 181–190. [Google Scholar] [CrossRef]
- Tripathi, D.; Nigam, S.K.; Mishra, A.R.; Shah, A.R. A novel intuitionistic fuzzy distance measure-SWARA-COPRAS method for multi-criteria food waste treatment technology selection. Oper. Res. Eng. Sci. Theory Appl. 2022, in press. [Google Scholar] [CrossRef]
- McCormick, K.; Kåberger, T. Key barriers for bioenergy in Europe: Economic conditions, know-how and institutional capacity, and supply chain co-ordination. Biomass Bioenergy 2007, 31, 443–452. [Google Scholar] [CrossRef]
- Popp, J.; Lakner, Z.; Harangi-Rakos, M.; Fari, M. The effect of bioenergy expansion: Food, energy, and environment. Renew. Sustain. Energy Rev. 2014, 32, 559–578. [Google Scholar] [CrossRef] [Green Version]
- Mafakheri, F.; Nasiri, F. Modeling of biomass-to-energy supply chain operations: Applications, challenges and research directions. Energy Policy 2014, 67, 116–126. [Google Scholar] [CrossRef]
- Saidur, R.; Abdelaziz, E.A.; Demirbas, A.; Hossain, M.S.; Mekhilef, S. A review on biomass as a fuel for boilers. Renew. Sustain. Energy Rev. 2011, 15, 2262–2289. [Google Scholar] [CrossRef]
- Thornley, P. Increasing biomass based power generation in the UK. Energy Policy 2006, 34, 2087–2099. [Google Scholar] [CrossRef]
- Faaij, A.P.C.; Domac, J. Emerging international bio-energy markets and opportunities for socio-economic development. Energy Sustain. Dev. 2006, 10, 7–19. [Google Scholar] [CrossRef] [Green Version]
- Engelken, M.; Romer, B.; Drescher, M.; Welpe, I.M.; Picot, A. Comparing drivers, barriers, and opportunities of business models for renewable energies: A review. Renew. Sustain. Energy Rev. 2016, 60, 795–809. [Google Scholar] [CrossRef]
- Adams, P.W.; Hammond, G.P.; McManus, M.C.; Mezzullo, W.G. Barriers to and drivers for UK bioenergy development. Renew. Sustain. Energy Rev. 2011, 15, 1217–1227. [Google Scholar] [CrossRef]
- Gegg, P.; Budd, L.; Ison, S. The market development of aviation biofuel: Drivers and constraints. J. Air Transport. Manag. 2014, 39, 34–40. [Google Scholar] [CrossRef] [Green Version]
- He, J.; Huang, Z.; Mishra, A.R.; Alrasheedi, M. Developing a new framework for conceptualizing the emerging sustainable community-based tourism using an extended interval-valued Pythagorean fuzzy SWARA-MULTIMOORA. Technol. Forecast. Soc. Change 2021, 171, 120955. [Google Scholar] [CrossRef]
- Khan, N.; Sudhakar, K.; Mamat, R. Role of biofuels in energy transition, green economy and carbon neutrality. Sustainability 2021, 13, 12374. [Google Scholar] [CrossRef]


| Dimensions | Barriers | Meaning | References |
|---|---|---|---|
| Economic (Ec) | Financial concerns during the whole lifespan of the plant (EC-1) | Financial problems that impact the SC performance and ambiguity related to return on investment are continuously an issue for stakeholders. | [9,36,37,38] |
| Lack of effective storage services (EC-2) | Storage services need to be require enhanced, especially in the biomass zone. | [12] | |
| Lack of investors (EC-3) | The biofuel region has good prospects and investors must be fascinated to fund. | [12] | |
| High logistics costs (EC-4) | Logistic charge rises because of a lack of significantly sized resources, namely biomass. | [39,40] | |
| Environmental (En) | By-products disposal with their chemical properties (EN-1) | Disposing of by-products is a key issue because of environmental pollution and chemical impacts. | [15,36,41] |
| Emission of light at night (EN-2) | People continuously complain related to the emission of light at night from the biofuel plant. | [12,15] | |
| The minimum energy density of bioenergy (EN-3) | Fossil fuels ease effective transport; however, biomass has a minimum energy density problem. | [39,40,41,42] | |
| Emissions (water vapor and GHG) (EN-4) | Emission lessening must be taken into consideration for a “green image” of the enterprise. | [15,36,37,38,41] | |
| Social (S) | Lack of entrepreneurship assistance (S-1) | Developing nations such as India can utilize social entrepreneurship. | [12,42] |
| Unfriendly odor, noise, and vibration from the power plant (S-2) | Noise and vibration at power plants may cause accidents. The issue of odor must be addressed for a healthier working situation. | [15,34,41] | |
| Fear of public health and safety hazards (S-3) | Safety assessments must be conducted periodically to deal with the concern of public health and hazards. | [15,38,41] | |
| Lack of trust between local societies, enterprises, and inventors (S-4) | Owing to the lack of trust of diverse stakeholders, there is a suspension in plant expansion. | [38,41,43] | |
| Lack of public awareness of bioenergy technologies (S-5) | Government organizations and NGOs must be conducted awareness programs about bioenergy technologies. | [36,38] | |
| Technological (T) | Seasonality of biomass (T-1) | Seasonality is an appropriate (weekly, monthly, or quarterly) occurrence of variation that ensued in a year. There are important technical and technological concerns. | [12,36,44] |
| Technical issues about the conversion technologies (T-2) | Technical concerns in biofuel comprise fuel chain assessment, prolonged problems, and life cycle. Modern technological developments can be supportive. | [36,38,43] | |
| Lack of professional training institutions (T-3) | Training organizations must assist specialists, scholars, and DEs in training and education. | [12] | |
| Regulatory (R) | Lack of administrative standards on SC coordination (R-1) | SC about the conversion, transport, records, and farming provide their own standards. | [36,38] |
| Lack of biomass SC standards (R-2) | SC benchmarks must be defined predominantly for SC functioning in rural regions. SCM doctrines must be used by the inventors. | [36,38,41] | |
| Lack of governmental support for SSC solutions (R-3) | The Indian government must assist in solutions for SSC of effective employment in bioenergy. | [36,38,44] |
| LRs | IVIFNs |
|---|---|
| Extremely significant (ES) | ([0.90, 0.95], [0.00, 0.05]) |
| Very very significant (VVS) | ([0.80, 0.85], [0.05, 0.10]) |
| Very significant (VS) | ([0.75, 0.85], [0.10, 0.15]) |
| Significant (S) | ([0.60, 0.70], [0.15, 0.30]) |
| Moderate (M) | ([0.50, 0.60], [0.30, 0.40]) |
| Insignificant (I) | ([0.30, 0.45], [0.45, 0.50]) |
| Very insignificant (VI) | ([0.20, 0.30], [0.50, 0.60]) |
| Very very insignificant (VVI) | ([0.10, 0.20], [0.60, 0.75]) |
| Extremely insignificant (EI) | ([0.00, 0.05], [0.80, 0.95]) |
| LRs | IVIFNs |
|---|---|
| Extremely good (EG) | ([0.90, 0.95], [0.0, 0.05]) |
| Very good (VG) | ([0.80, 0.90], [0.05, 0.10]) |
| Good (G) | ([0.70, 0.80], [0.10, 0.15]) |
| Slightly good (SG) | ([0.65, 0.70], [0.15, 0.25]) |
| Average (A) | ([0.55, 0.65], [0.20, 0.35]) |
| Slightly Low (SL) | ([0.40, 0.50], [0.40, 0.45]) |
| Low (L) | ([0.25, 0.40], [0.45, 0.50]) |
| Very Low (VL) | ([0.15, 0.20], [0.60, 0.75]) |
| Extremely Low (EL) | ([0.05, 0.10], [0.80, 0.90]) |
| Barriers | T1 | T2 | T3 | T4 |
|---|---|---|---|---|
| q1 | (A,VG,SG,G,G) | (G,A,G,VG,SG) | (G, SG,A,G,A) | (SG,G,G,VG,SL) |
| q2 | (SL,G,A,VG,A) | (G,G,VL,SG,A) | (A,G,SG,SL,SL) | (SG,G,SG,VG,L) |
| q3 | (L,VG,SL,SG,G) | (SG,SL,G,VG,G) | (SL, G,VG,L,SG) | (VL,SL,VG,G,VG) |
| q4 | (VL,SL,A,G,VG) | (VL,G,VG,SL,G) | (VG,A,SL,SL,G) | (A,VG,SG,SL,SG) |
| q5 | (G,SG,A,SL,VG) | (VG,SG,A,A,G) | (A,SG,G,SG,SG) | (VG,G,G,SG,A) |
| q6 | (VG, G,VG,A,SG) | (SL,G,A,VG,SG) | (VG,SG,A,G,A) | (G,G,A,VG,SG) |
| q7 | (VG,SG,SL,L,VG) | (VG,SG,A,SL,SL) | (VG,VG,SG,SL,L) | (SL,G,VG,G,A) |
| q8 | (VL,SL,SG,VG,G) | (SL,L,SL,G,SG) | (L,SL,A,VG,VG) | (L,VG,A,SL,VG) |
| q9 | (L,SL,A,G,VG) | (A,SL,SL,VG,G) | (L,SG,G,SG,A) | (L,SL,SG,A,VG) |
| q10 | (A,SG,G,VG,L) | (VG,G,G,SL,VL) | (SG,SL,VG,G,A) | (SG,G,SL,G,A) |
| q11 | (VG,G,SG,G,A) | (SG,G,VG,SG,A) | (L,G,SG,G,SL) | (G,SG,G,VG,VL) |
| q12 | (L,SL,A,SG,VG) | (SL,SG,G,SL,G) | (G,A,SG,SL,G) | (A,SL,SG,A,VG) |
| q13 | (SG,G,A,L,VG) | (VG,G,A,A,SG) | (A,G,G,SL,SG) | (SG,G,SG,SG,A) |
| q14 | (G, SG,VG,A,SL) | (L,VG,A,G,SG) | (VG,SL,A,VG,A) | (SG,G,A,VG,G) |
| q15 | (SG,G,SL,VL,VG) | (G,SG,A,SG,SL) | (VG,G,SL,SL,L) | (SL,SG,VG,G,A) |
| q16 | (L,SL,G,VG,A) | (L,SL,SG,G,G) | (SL,SL,A,G,VG) | (SL,VG,A,SL,G) |
| q17 | (VL,SL,A,SG,VG) | (A,SG,SL,G,G) | (SL,SG,G,G,A) | (L,A,SG,A,VG) |
| q18 | (A,G,SG,VG,SL) | (SG,G,G,A,VL) | (G,SL,G,SG,A) | (SG,A,SG,G,A) |
| q19 | (G,G,VG,SG,A) | (G,SG,VG,G,A) | (SL,SG,VG,G,L) | (A,G,SG,VG,L) |
| e1 | e2 | e3 | e4 | e5 | |
|---|---|---|---|---|---|
| LRs | Significant | Moderate | Very Significant | Extremely significant | Very very significant |
| IVIFNs | ([0.60, 0.70], [0.15, 0.30]) | ([0.50, 0.60], [0.30, 0.40]) | ([0.75, 0.85], [0.10, 0.15 ]) | ([0.90,0.95], [0.0,0.05]) | ([0.80,0.85], [0.05, 0.10]) |
| 0.7250 | 0.6000 | 0.8562 | 0.9700 | 0.9063 | |
| rk | 4 | 5 | 3 | 1 | 2 |
| Weights | 0.1560 | 0.1073 | 0.2055 | 0.2862 | 0.2450 |
| Barriers | T1 | T2 | T3 | T4 |
|---|---|---|---|---|
| q1 | ([0.684, 0.780], [0.112, 0.174]) | ([0.710, 0.808], [0.098, 0.157]) | ([0.634, 0.731], [0.143, 0.227]) | ([0.676, 0.781], [0.123, 0.183]) |
| q2 | ([0.654, 0.757], [0.151, 0.232]) | ([0.571, 0.657], [0.192, 0.279]) | ([0.523, 0.614], [0.253, 0.326]) | ([0.646, 0.751], [0.137, 0.199]) |
| q3 | ([0.601, 0.701], [0.175, 0.236]) | ([0.705, 0.807], [0.101, 0.157]) | ([0.585, 0.697], [0.183, 0.248]) | ([0.683, 0.800], [0.112, 0.181]) |
| q4 | ([0.626, 0.741], [0.149, 0.234]) | ([0.604, 0.720], [0.171, 0.243]) | ([0.586, 0.701], [0.191, 0.265]) | ([0.600, 0.684], [0.185, 0.256]) |
| q5 | ([0.634, 0.743], [0.151, 0.228]) | ([0.651, 0.753], [0.132, 0.220]) | ([0.647, 0.717], [0.144, 0.235]) | ([0.675, 0.769], [0.119, 0.188]) |
| q6 | ([0.698, 0.798], [0.105, 0.177]) | ([0.664, 0.766], [0.130, 0.202]) | ([0.656, 0.759], [0.128, 0.213]) | ([0.698, 0.797], [0.104, 0.171]) |
| q7 | ([0.611, 0.738], [0.162, 0.233]) | ([0.550, 0.658], [0.226, 0.310]) | ([0.575, 0.692], [0.195, 0.263]) | ([0.660, 0.770], [0.132, 0.202]) |
| q8 | ([0.651, 0.756], [0.137, 0.205]) | ([0.564, 0.654], [0.214, 0.272]) | ([0.673, 0.797], [0.117, 0.195]) | ([0.602, 0.729], [0.170, 0.256]) |
| q9 | ([0.633, 0.752], [0.143, 0.219]) | ([0.647, 0.762], [0.141, 0.215]) | ([0.594, 0.681], [0.176, 0.249]) | ([0.609, 0.718], [0.164, 0.249]) |
| q10 | ([0.638, 0.755], [0.138, 0.211]) | ([0.557, 0.672], [0.207, 0.286]) | ([0.664, 0.766], [0.127, 0.200]) | ([0.609, 0.691], [0.168, 0.242]) |
| q11 | ([0.679, 0.776], [0.116, 0.184]) | ([0.674, 0.762], [0.123, 0.193]) | ([0.577, 0.677], [0.193, 0.251]) | ([0.649, 0.759], [0.133, 0.204]) |
| q12 | ([0.617, 0.722], [0.160, 0.238]) | ([0.586, 0.687], [0.263, 0.368]) | ([0.606, 0.700], [0.174, 0.239]) | ([0.639, 0.741], [0.145, 0.236]) |
| q13 | ([0.607, 0.724], [0.159, 0.239]) | ([0.643, 0.739], [0.139, 0.229]) | ([0.595, 0.687], [0.183, 0.252]) | ([0.634, 0.702], [0.154, 0.222]) |
| q14 | ([0.627, 0.734], [0.155, 0.237]) | ([0.626, 0.727], [0.149, 0.221]) | ([0.676, 0.791], [0.117, 0.207]) | ([0.703, 0.804], [0.105, 0.181]) |
| q15 | ([0.568, 0.677], [0.200, 0.282]) | ([0.589, 0.671], [0.190, 0.262]) | ([0.504, 0.631], [0.257, 0.325]) | ([0.655, 0.760], [0.137, 0.221]) |
| q16 | ([0.633, 0.754], [0.143, 0.223]) | ([0.615, 0.715], [0.159, 0.216]) | ([0.646, 0.759], [0.140, 0.216]) | ([0.576, 0.688], [0.198, 0.278]) |
| q17 | ([0.609, 0.709], [0.182, 0.298]) | ([0.625, 0.725], [0.192, 0.258]) | ([0.625, 0.724], [0.154, 0.226]) | ([0.621, 0.729], [0.152, 0.243]) |
| q18 | ([0.652, 0.757], [0.139, 0.212]) | ([0.555, 0.649], [0.201, 0.297]) | ([0.627, 0.716], [0.154, 0.226]) | ([0.634, 0.718], [0.148, 0.224]) |
| q19 | ([0.681, 0.777], [0.115, 0.184]) | ([0.690, 0.792], [0.107, 0.175]) | ([0.609, 0.726], [0.163, 0.227]) | ([0.632, 0.745], [0.144, 0.217]) |
| Barriers | d1 | d2 | d3 | d4 | d5 | AIVIF-DM | ||||
|---|---|---|---|---|---|---|---|---|---|---|
| q1 | G | VG | G | A | G | ([0.677, 0.782], [0.113, 0.183]) | 0.346 | 0.872 | 0.716 | 0.0534 |
| q2 | SG | A | VG | SG | SG | ([0.679, 0.757], [0.123, 0.184]) | 0.352 | 0.866 | 0.711 | 0.0530 |
| q3 | VG | SL | VG | G | G | ([0.721, 0.828], [0.090, 0.146]) | 0.297 | 0.897 | 0.751 | 0.0560 |
| q4 | A | A | VG | G | VG | ([0.722, 0.830], [0.088, 0.156]) | 0.298 | 0.896 | 0.750 | 0.0559 |
| q5 | SG | SL | SG | SG | G | ([0.643, 0.713], [0.151, 0.203]) | 0.392 | 0.844 | 0.683 | 0.0509 |
| q6 | G | SL | SG | A | VG | ([0.661, 0.765], [0.130, 0.207]) | 0.365 | 0.859 | 0.702 | 0.0523 |
| q7 | VG | SG | SL | VG | A | ([0.675, 0.787], [0.121, 0.199]) | 0.348 | 0.868 | 0.714 | 0.0532 |
| q8 | SL | VG | SG | VG | SL | ([0.651, 0.761], [0.144, 0.221]) | 0.374 | 0.851 | 0.695 | 0.0518 |
| q9 | VG | SG | G | SL | G | ([0.651, 0.756], [0.139, 0.199]) | 0.371 | 0.856 | 0.697 | 0.0520 |
| q10 | A | VG | VG | A | G | ([0.684, 0.794], [0.109, 0.192]) | 0.340 | 0.874 | 0.720 | 0.0537 |
| q11 | VG | SG | G | SG | G | ([0.701, 0.789], [0.105, 0.158]) | 0.324 | 0.883 | 0.731 | 0.0545 |
| q12 | A | G | SG | L | G | ([0.571, 0.675], [0.186, 0.256]) | 0.452 | 0.810 | 0.642 | 0.0478 |
| q13 | G | L | G | VG | SG | ([0.694, 0.796], [0.106, 0.163]) | 0.327 | 0.882 | 0.729 | 0.0544 |
| q14 | SG | SG | G | SG | A | ([0.639, 0.713], [0.148, 0.216]) | 0.395 | 0.842 | 0.680 | 0.0507 |
| q15 | G | A | SG | G | VG | ([0.707, 0.805], [0.099, 0.158]) | 0.315 | 0.887 | 0.738 | 0.0550 |
| q16 | L | VG | G | SG | SG | ([0.640, 0.727], [0.146, 0.202]) | 0.388 | 0.848 | 0.686 | 0.0511 |
| q17 | G | SG | SG | L | SG | ([0.575, 0.657], [0.193, 0.249]) | 0.455 | 0.808 | 0.640 | 0.0477 |
| q18 | A | VG | VG | G | A | ([0.689, 0.798], [0.106, 0.186]) | 0.334 | 0.877 | 0.724 | 0.0540 |
| q19 | SG | G | SG | G | SG | ([0.671, 0.744], [0.128, 0.179]) | 0.361 | 0.863 | 0.705 | 0.0525 |
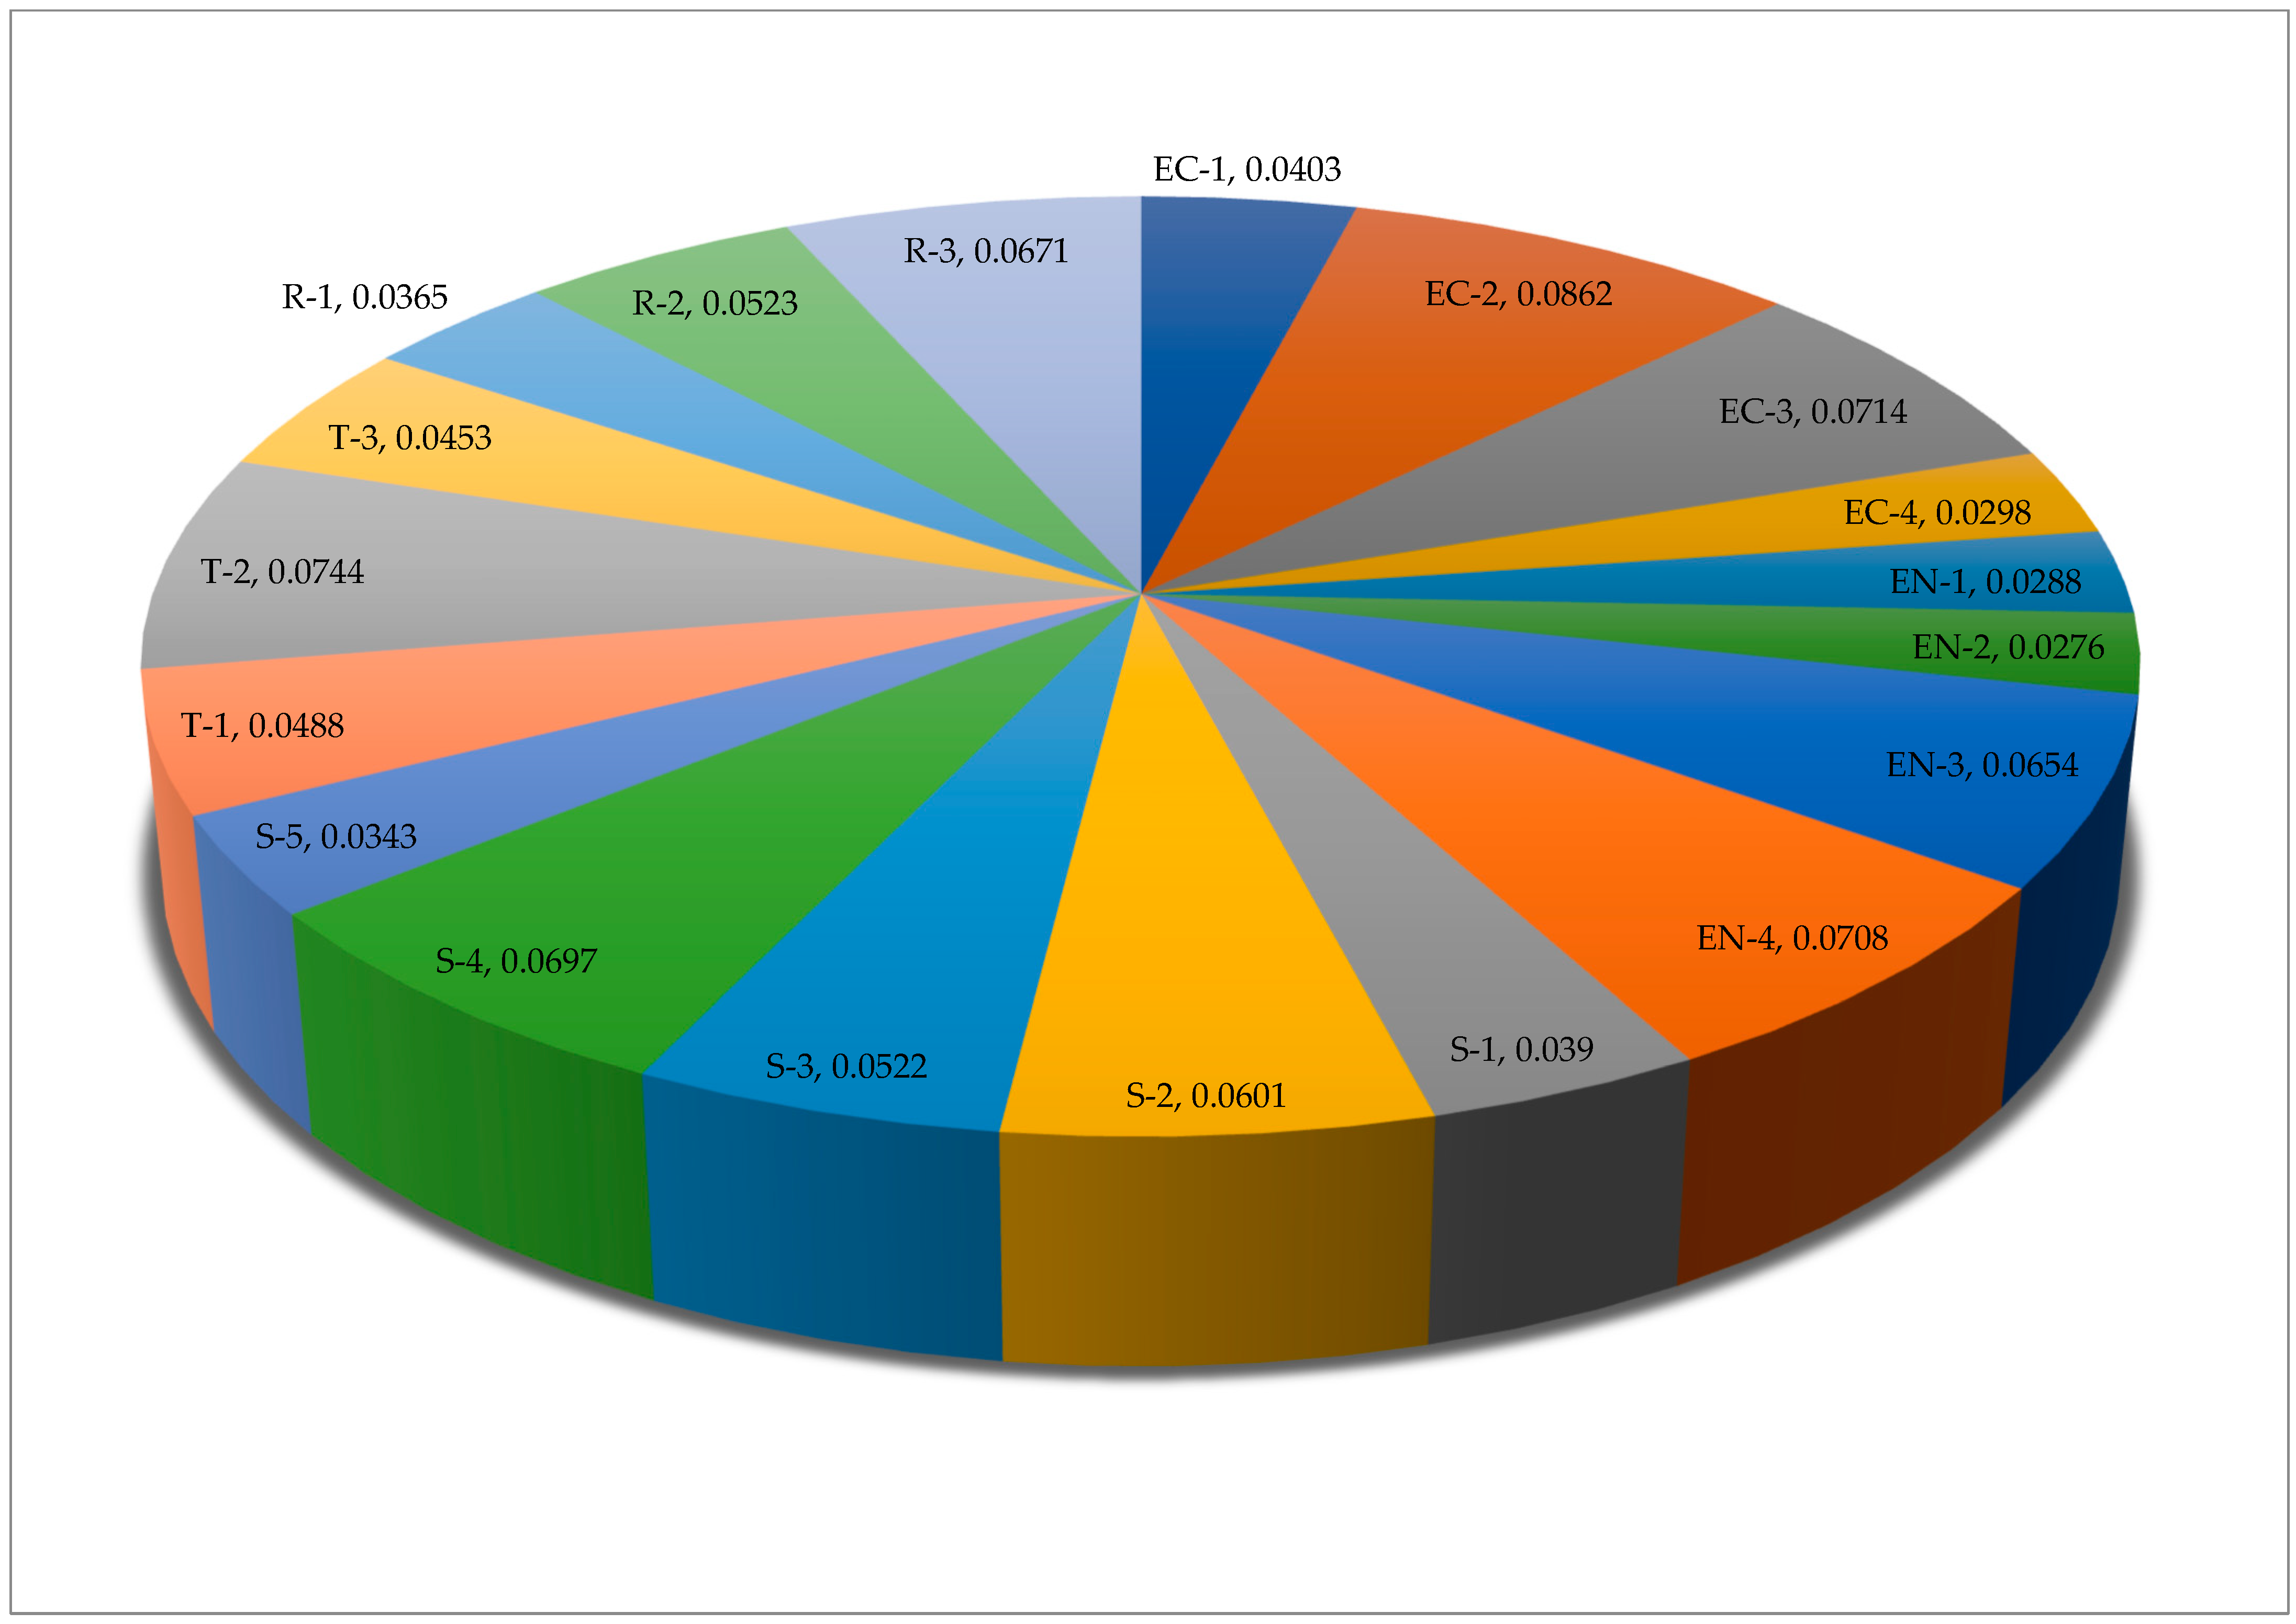
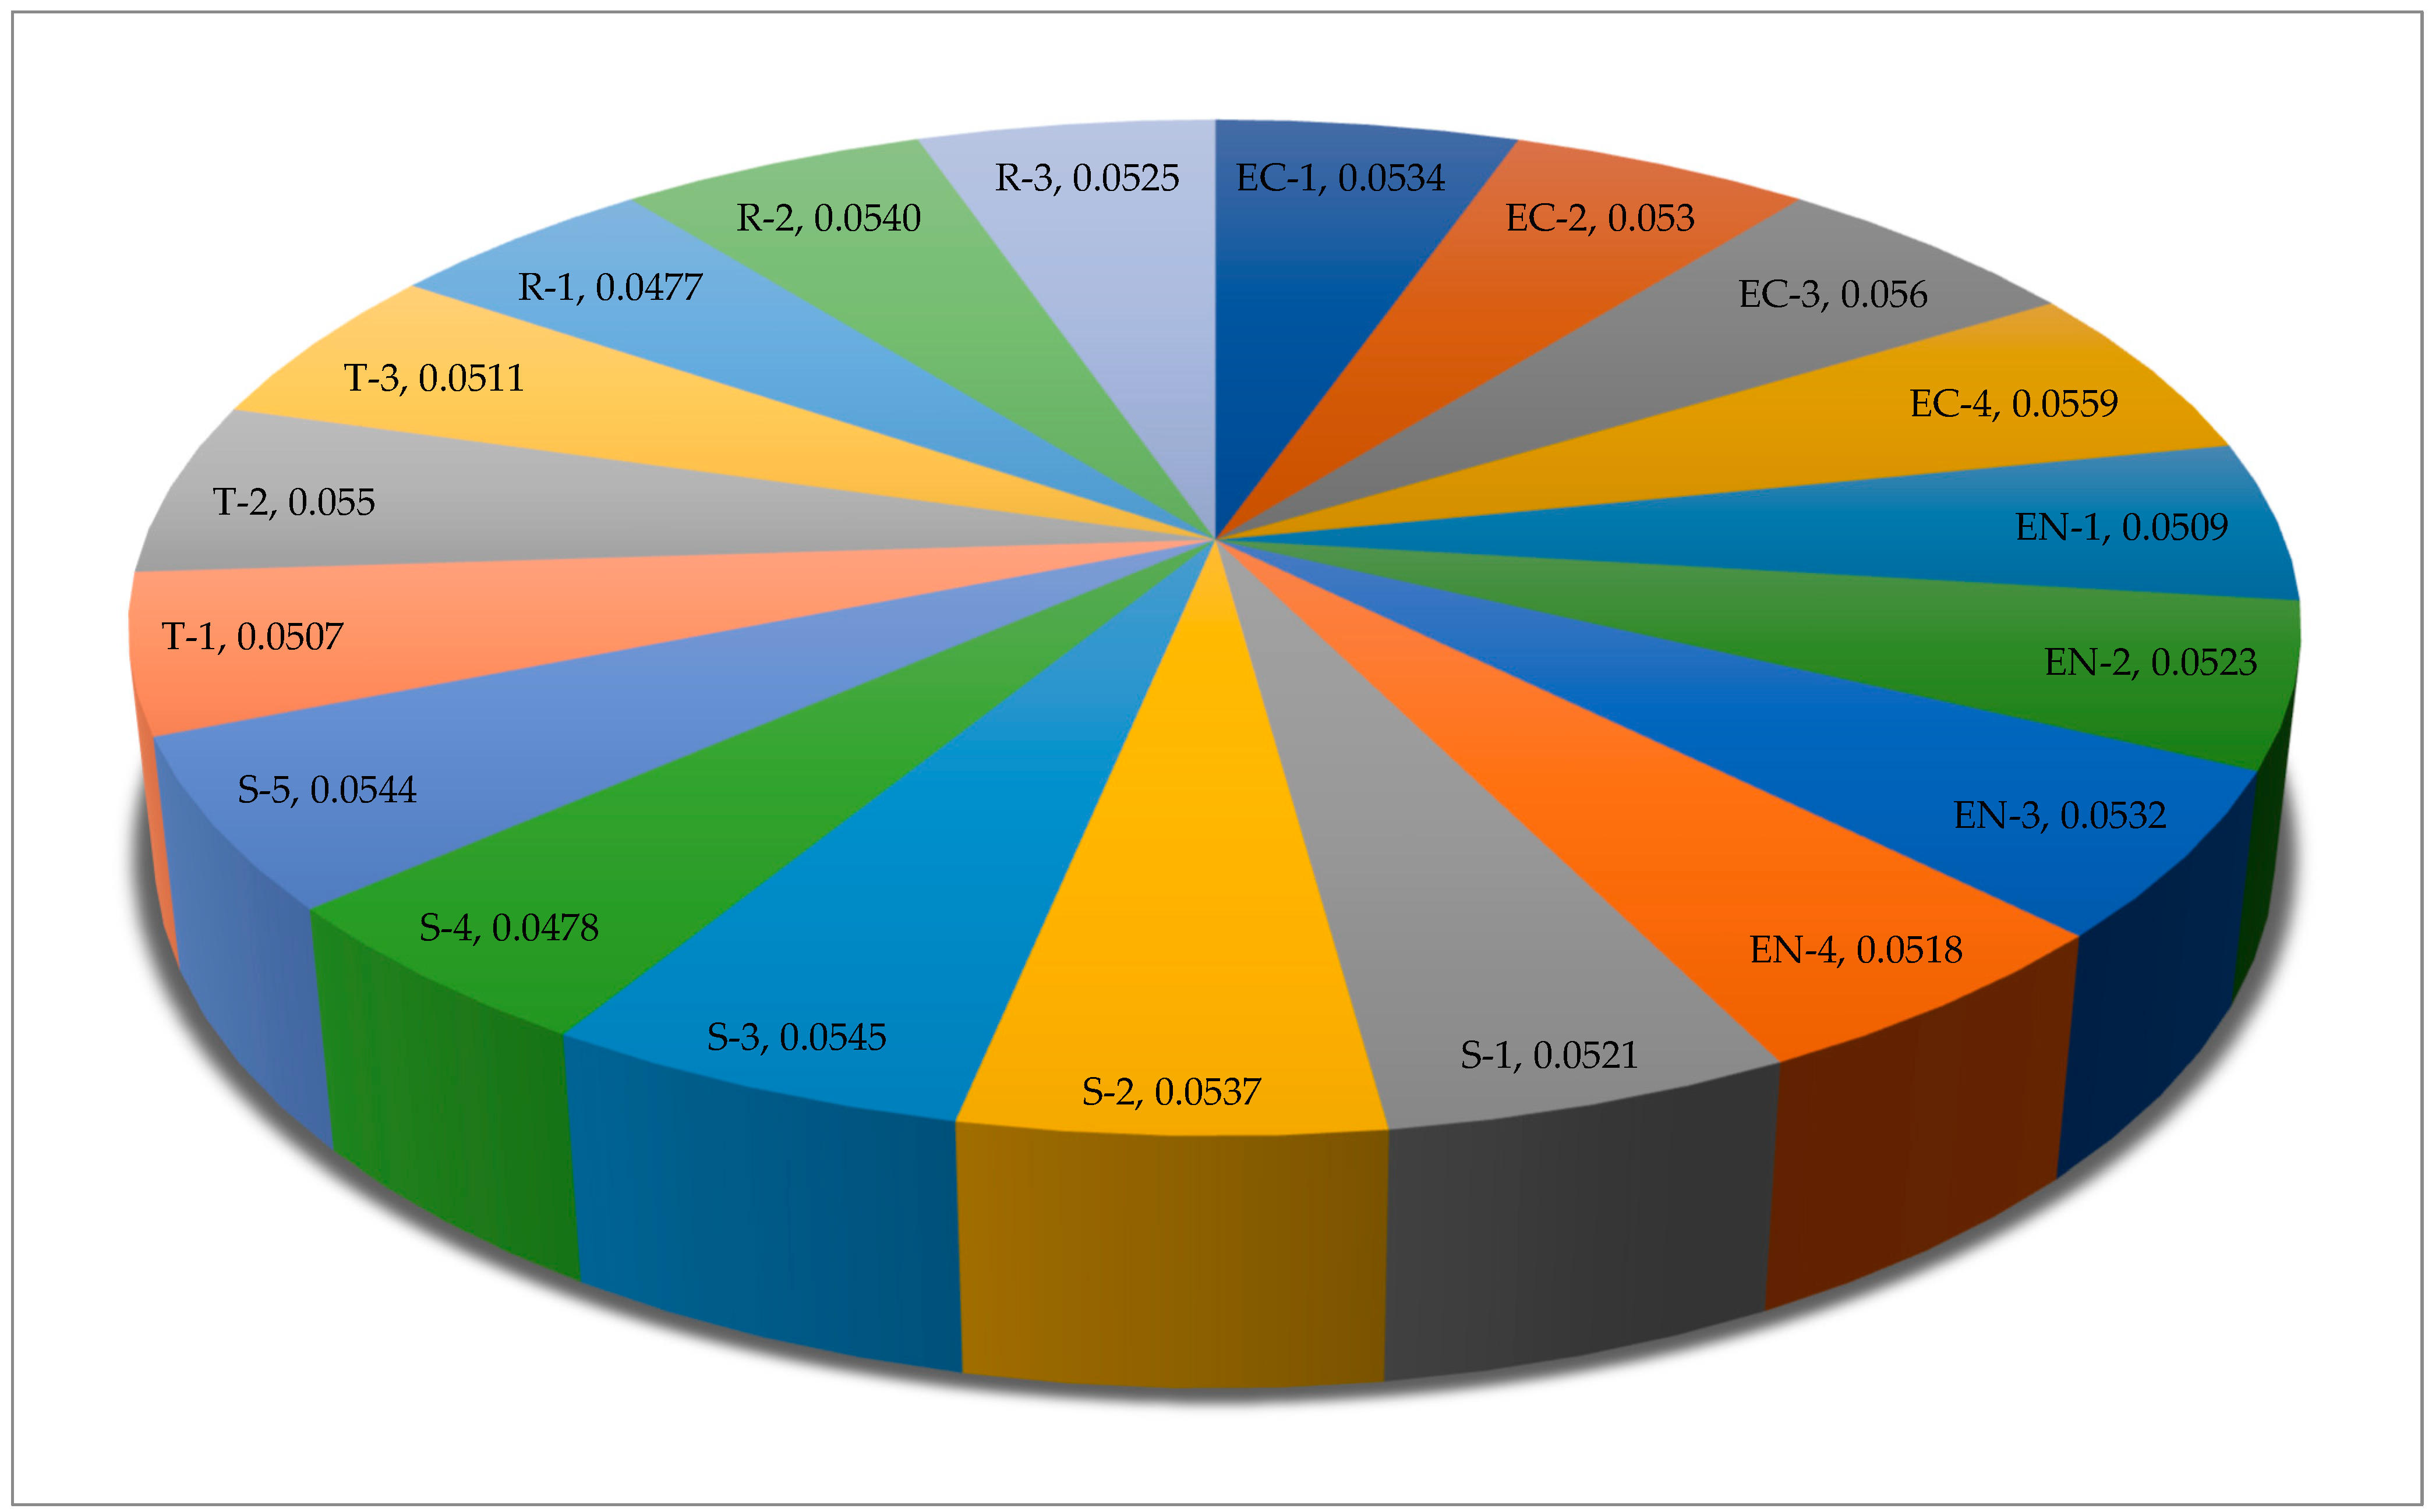
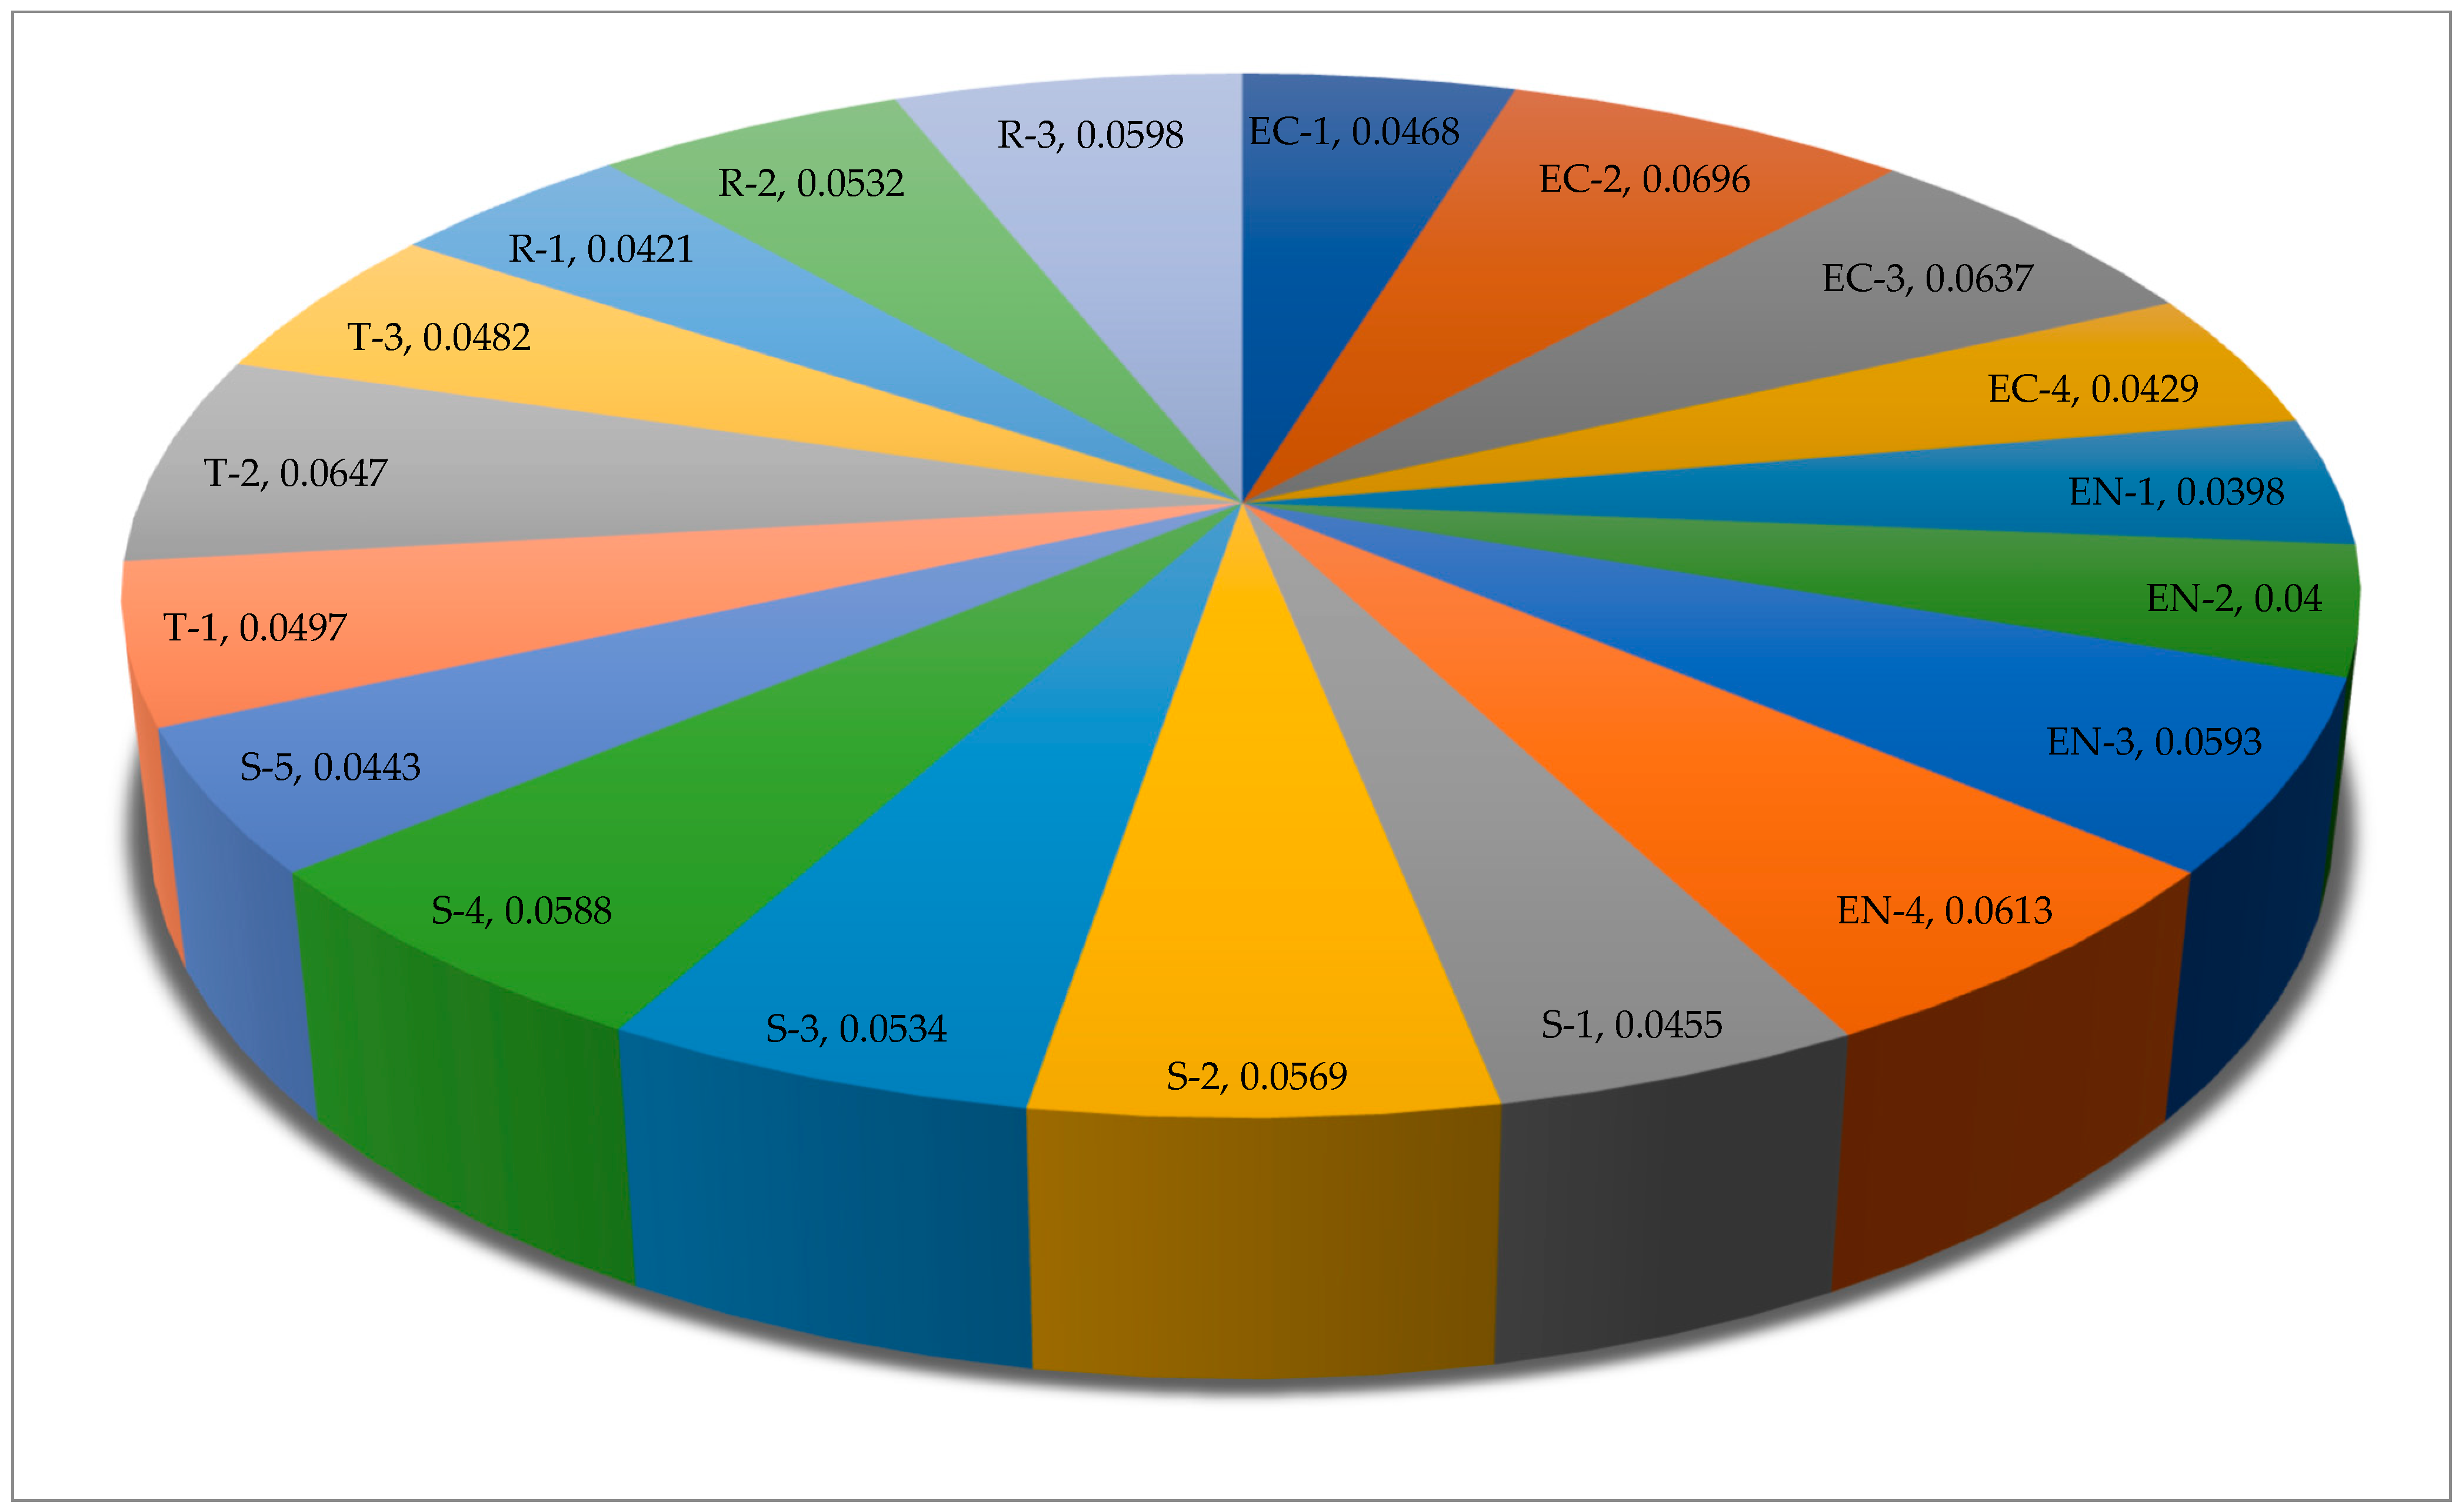
| γ = 0.0 | 0.1 | 0.2 | 0.3 | 0.4 | 0.5 | 0.6 | 0.7 | 0.8 | 0.9 | 1.0 | |
|---|---|---|---|---|---|---|---|---|---|---|---|
| q1 | 0.0534 | 0.0521 | 0.0508 | 0.0495 | 0.0482 | 0.0468 | 0.0455 | 0.0442 | 0.0429 | 0.0416 | 0.0403 |
| q2 | 0.0530 | 0.0563 | 0.0596 | 0.0630 | 0.0663 | 0.0696 | 0.0730 | 0.0763 | 0.0796 | 0.0829 | 0.0863 |
| q3 | 0.0560 | 0.0575 | 0.0591 | 0.0606 | 0.0621 | 0.0637 | 0.0652 | 0.0668 | 0.0683 | 0.0698 | 0.0714 |
| q4 | 0.0559 | 0.0533 | 0.0507 | 0.0481 | 0.0455 | 0.0429 | 0.0403 | 0.0376 | 0.0350 | 0.0324 | 0.0298 |
| q5 | 0.0509 | 0.0487 | 0.0465 | 0.0443 | 0.0421 | 0.0398 | 0.0376 | 0.0354 | 0.0332 | 0.0310 | 0.0288 |
| q6 | 0.0523 | 0.0499 | 0.0474 | 0.0449 | 0.0425 | 0.0400 | 0.0375 | 0.0350 | 0.0326 | 0.0301 | 0.0276 |
| q7 | 0.0532 | 0.0544 | 0.0556 | 0.0569 | 0.0581 | 0.0593 | 0.0605 | 0.0617 | 0.0629 | 0.0642 | 0.0654 |
| q8 | 0.0518 | 0.0537 | 0.0556 | 0.0575 | 0.0594 | 0.0613 | 0.0632 | 0.0651 | 0.0670 | 0.0689 | 0.0708 |
| q9 | 0.0520 | 0.0507 | 0.0494 | 0.0481 | 0.0468 | 0.0455 | 0.0442 | 0.0429 | 0.0416 | 0.0403 | 0.0390 |
| q10 | 0.0537 | 0.0543 | 0.0550 | 0.0556 | 0.0562 | 0.0569 | 0.0575 | 0.0582 | 0.0588 | 0.0595 | 0.0601 |
| q11 | 0.0545 | 0.0543 | 0.0541 | 0.0538 | 0.0536 | 0.0534 | 0.0531 | 0.0529 | 0.0527 | 0.0524 | 0.0522 |
| q12 | 0.0478 | 0.0500 | 0.0522 | 0.0544 | 0.0566 | 0.0588 | 0.0609 | 0.0631 | 0.0653 | 0.0675 | 0.0697 |
| q13 | 0.0544 | 0.0524 | 0.0504 | 0.0483 | 0.0463 | 0.0443 | 0.0423 | 0.0403 | 0.0383 | 0.0363 | 0.0343 |
| q14 | 0.0507 | 0.0505 | 0.0503 | 0.0501 | 0.0499 | 0.0497 | 0.0495 | 0.0494 | 0.0492 | 0.0490 | 0.0488 |
| q15 | 0.0550 | 0.0569 | 0.0589 | 0.0608 | 0.0627 | 0.0647 | 0.0666 | 0.0686 | 0.0705 | 0.0724 | 0.0744 |
| q16 | 0.0511 | 0.0505 | 0.0500 | 0.0494 | 0.0488 | 0.0482 | 0.0476 | 0.0471 | 0.0465 | 0.0459 | 0.0453 |
| q17 | 0.0477 | 0.0466 | 0.0454 | 0.0443 | 0.0432 | 0.0421 | 0.0410 | 0.0399 | 0.0387 | 0.0376 | 0.0365 |
| q18 | 0.0540 | 0.0538 | 0.0537 | 0.0535 | 0.0533 | 0.0532 | 0.0530 | 0.0528 | 0.0527 | 0.0525 | 0.0523 |
| q19 | 0.0525 | 0.0540 | 0.0555 | 0.0569 | 0.0584 | 0.0598 | 0.0613 | 0.0627 | 0.0642 | 0.0656 | 0.0671 |
| Parameters | He et al. [45] | Mishra and Rani [21] | Proposed Model |
|---|---|---|---|
| Benchmark | IVPF-SWARA model | IVIF-distance measure-entropy model | IVIF-DM-relative closeness model |
| Alternatives/criteria assessments | IVPFSs | IVIFSs | IVIFSs |
| Criteria weight | Subjective weight | Objective weight | Integrated weight using objective and subjective weights |
| DMEs’ weights | Assumed | Considered | IVIF-rank sum andScore degree-based model |
| Decision-making process | Group | Group | Group |
Disclaimer/Publisher’s Note: The statements, opinions and data contained in all publications are solely those of the individual author(s) and contributor(s) and not of MDPI and/or the editor(s). MDPI and/or the editor(s) disclaim responsibility for any injury to people or property resulting from any ideas, methods, instructions or products referred to in the content. |
© 2023 by the authors. Licensee MDPI, Basel, Switzerland. This article is an open access article distributed under the terms and conditions of the Creative Commons Attribution (CC BY) license (https://creativecommons.org/licenses/by/4.0/).
Share and Cite
Mishra, A.R.; Rani, P.; Cavallaro, F.; Hezam, I.M. An IVIF-Distance Measure and Relative Closeness Coefficient-Based Model for Assessing the Sustainable Development Barriers to Biofuel Enterprises in India. Sustainability 2023, 15, 4354. https://doi.org/10.3390/su15054354
Mishra AR, Rani P, Cavallaro F, Hezam IM. An IVIF-Distance Measure and Relative Closeness Coefficient-Based Model for Assessing the Sustainable Development Barriers to Biofuel Enterprises in India. Sustainability. 2023; 15(5):4354. https://doi.org/10.3390/su15054354
Chicago/Turabian StyleMishra, Arunodaya Raj, Pratibha Rani, Fausto Cavallaro, and Ibrahim M. Hezam. 2023. "An IVIF-Distance Measure and Relative Closeness Coefficient-Based Model for Assessing the Sustainable Development Barriers to Biofuel Enterprises in India" Sustainability 15, no. 5: 4354. https://doi.org/10.3390/su15054354