
Influence of Passenger Capacity on Fatigue Life of Gearbox Suspender of the Traction Transmission System in Urban Railway Vehicles

Abstract
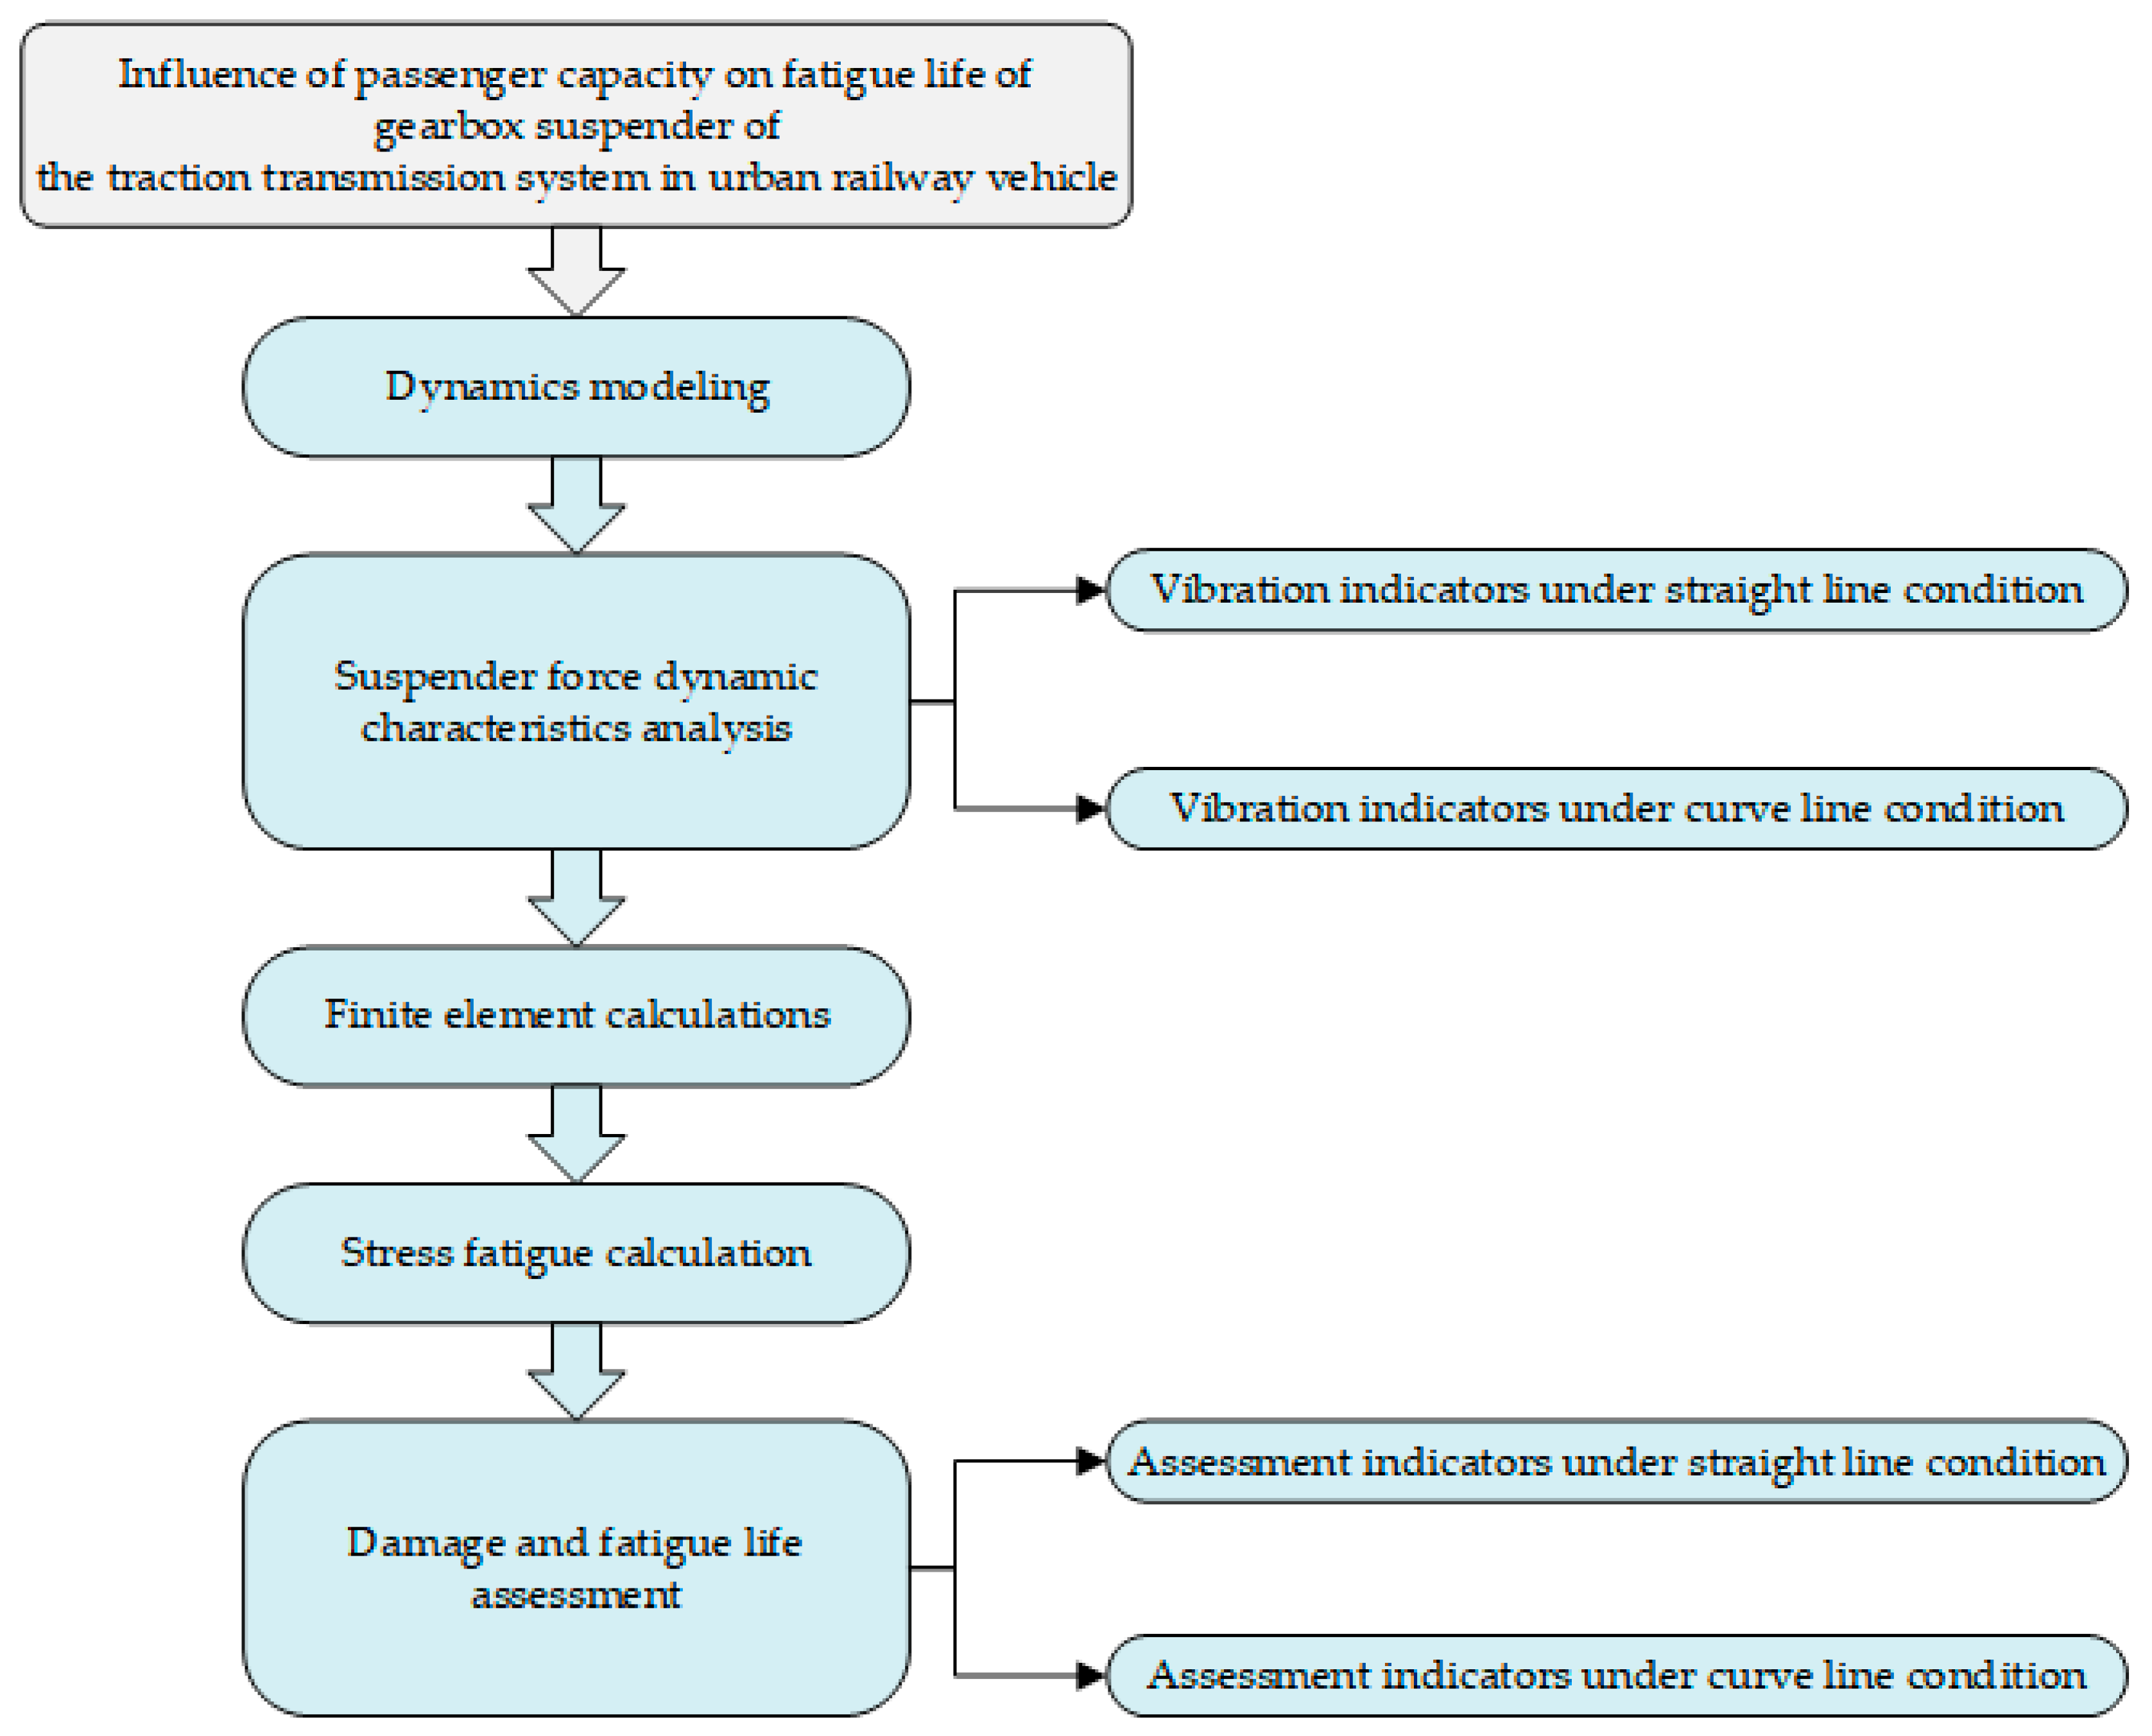
:1. Introduction
2. Urban Railway Vehicle Model with a Traction Transmission System
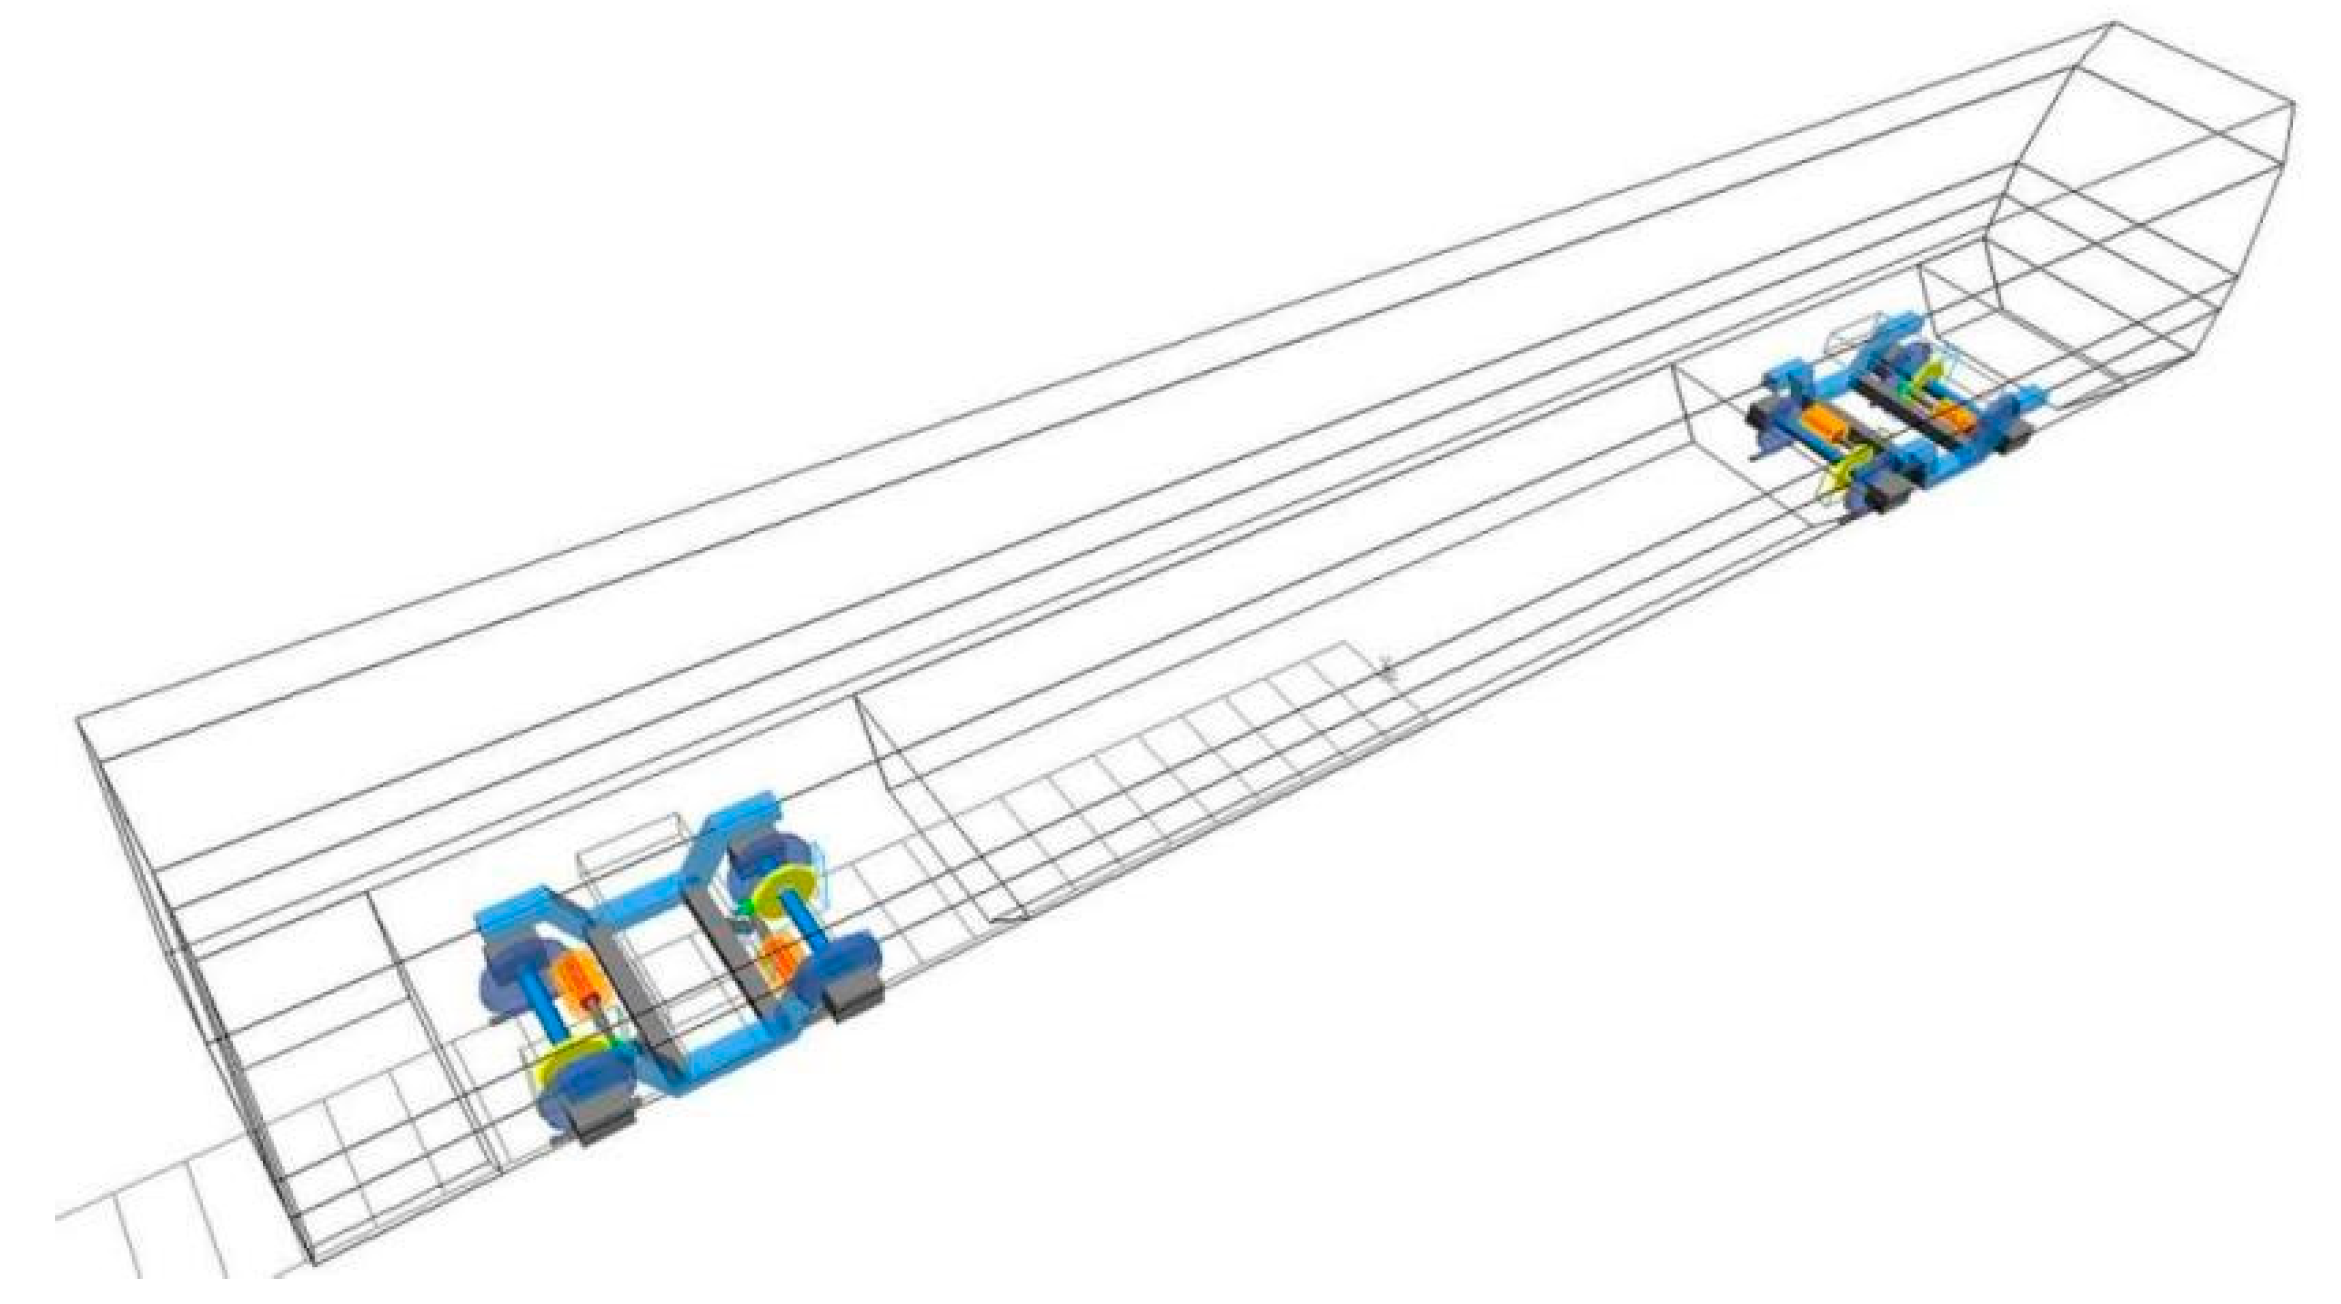
2.1. Dynamic Modeling
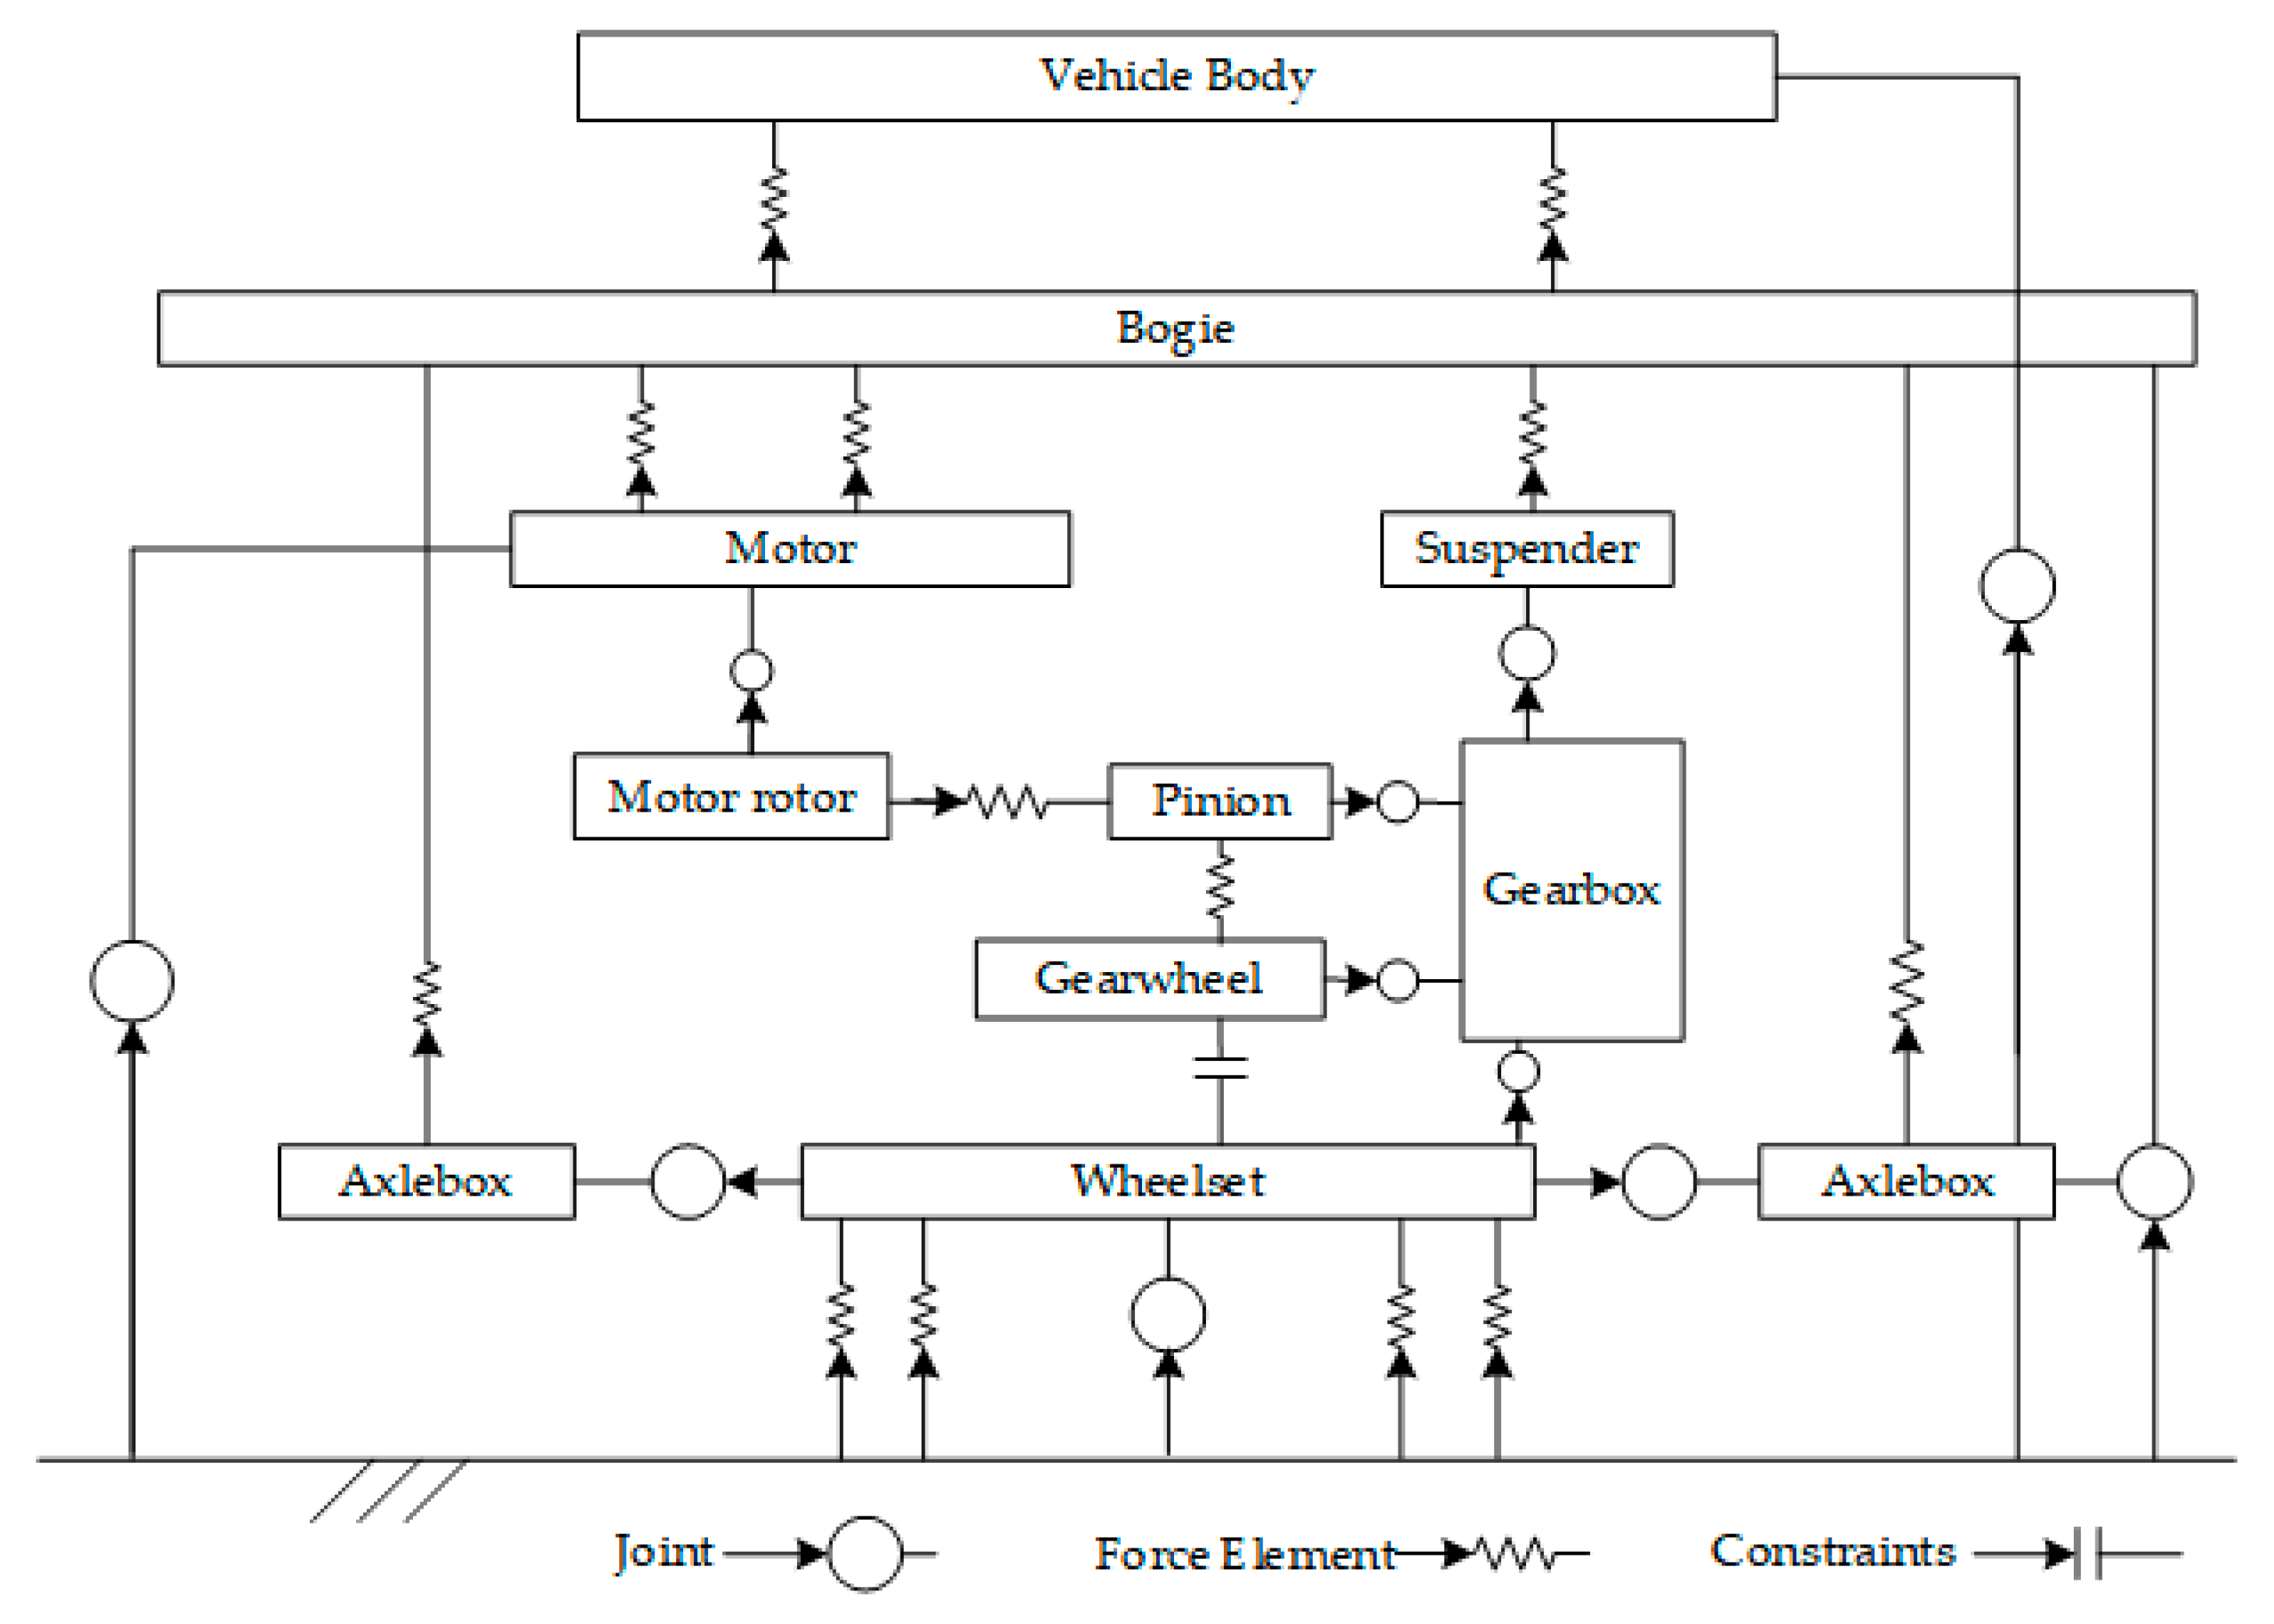
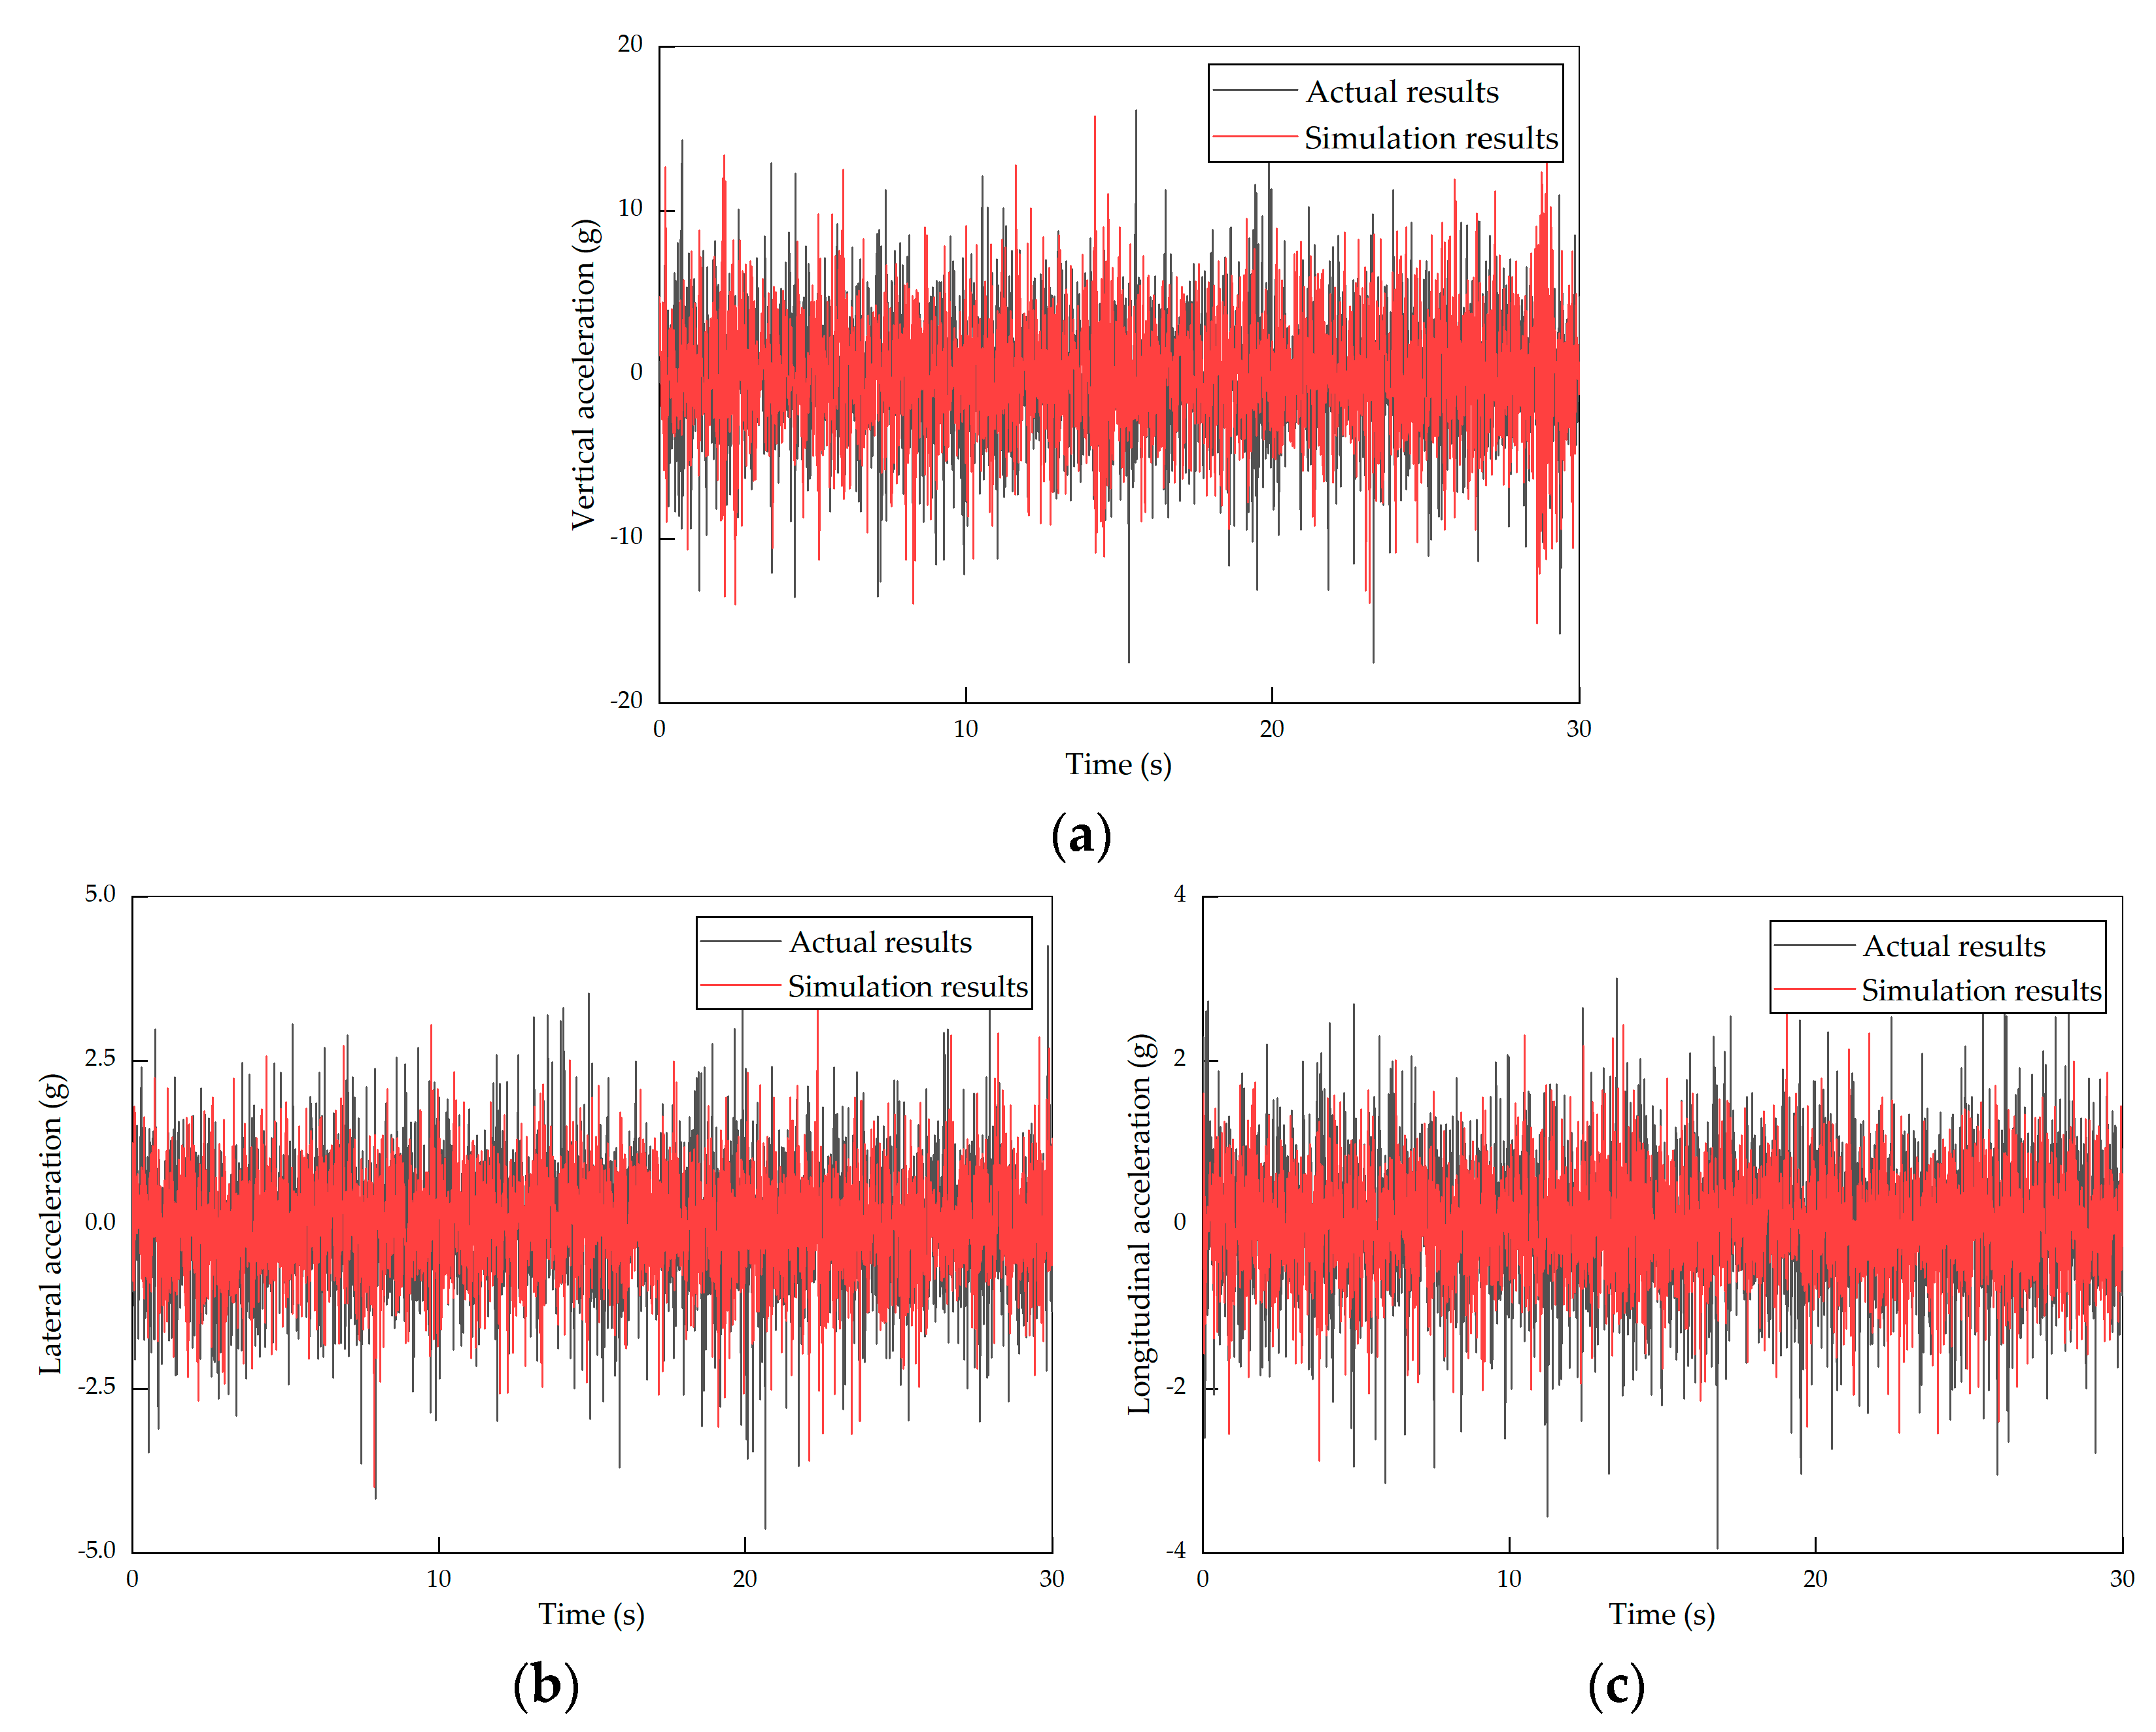
2.2. Topology Relations and Validation of Model
2.3. Simulation Conditions
3. Effect of Passenger Capacity on Dynamic Load for Gearbox Suspender
3.1. Vibration Indicators of Interest
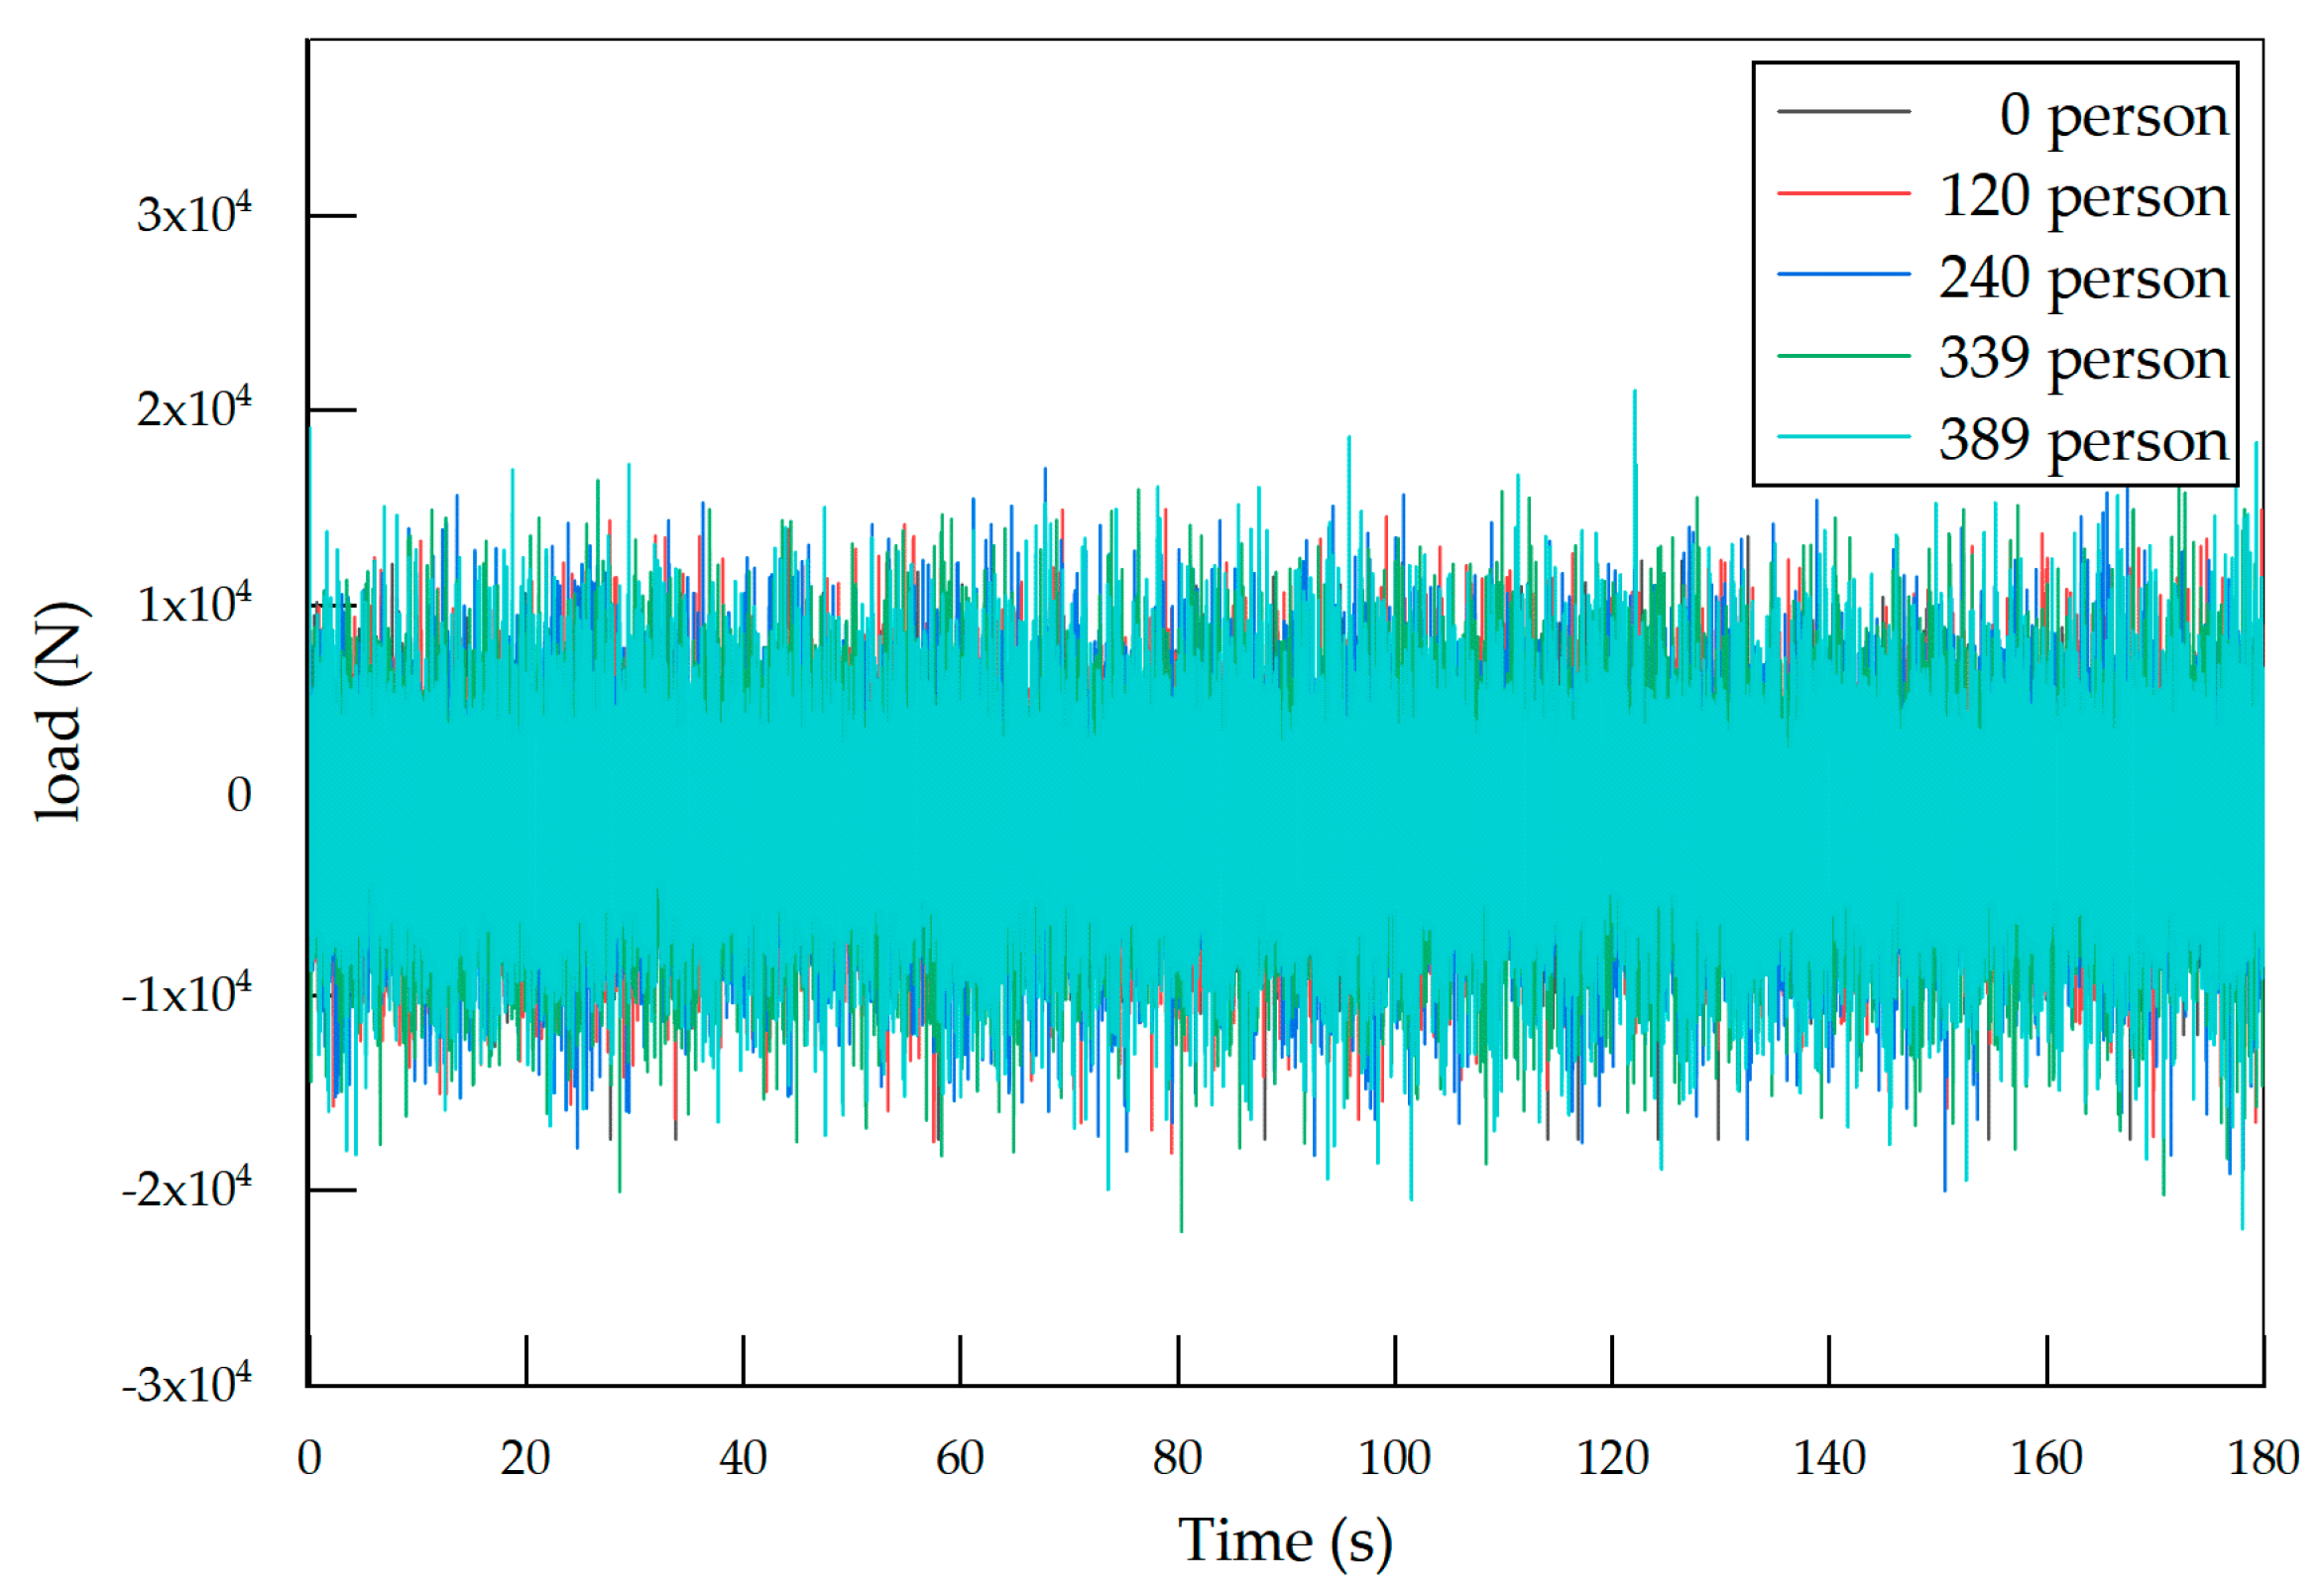
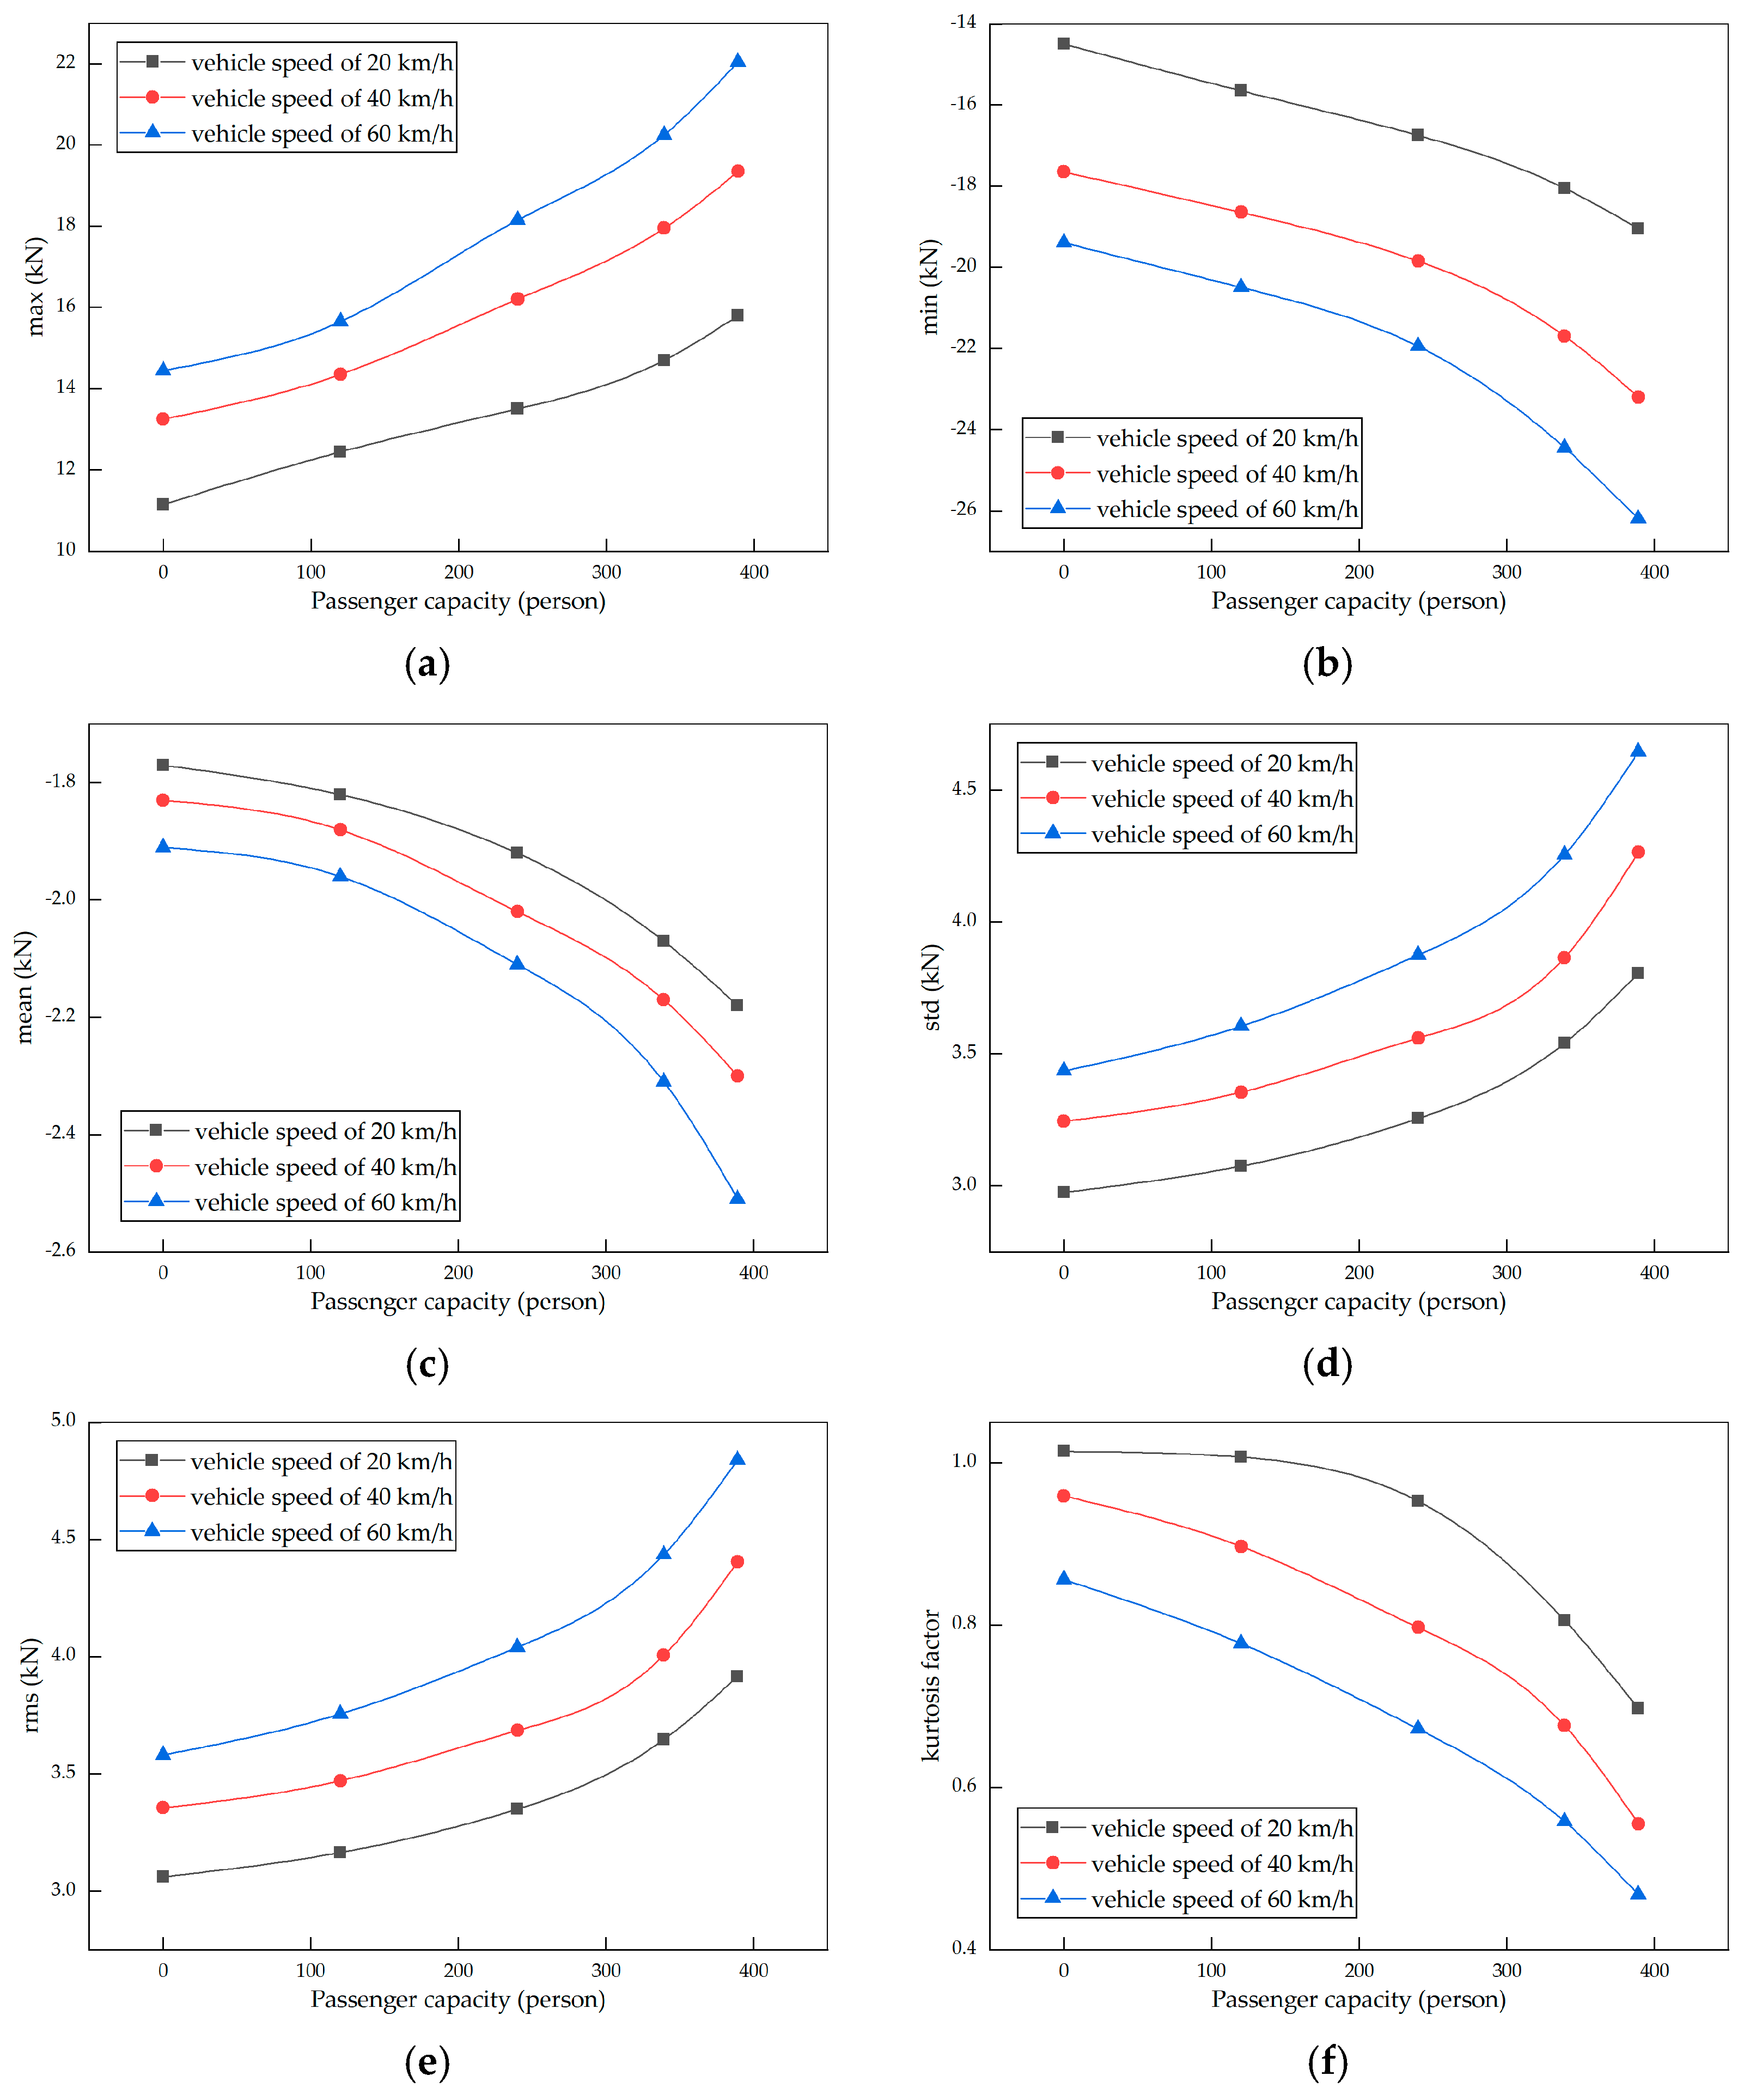
3.2. Straight Line Condition
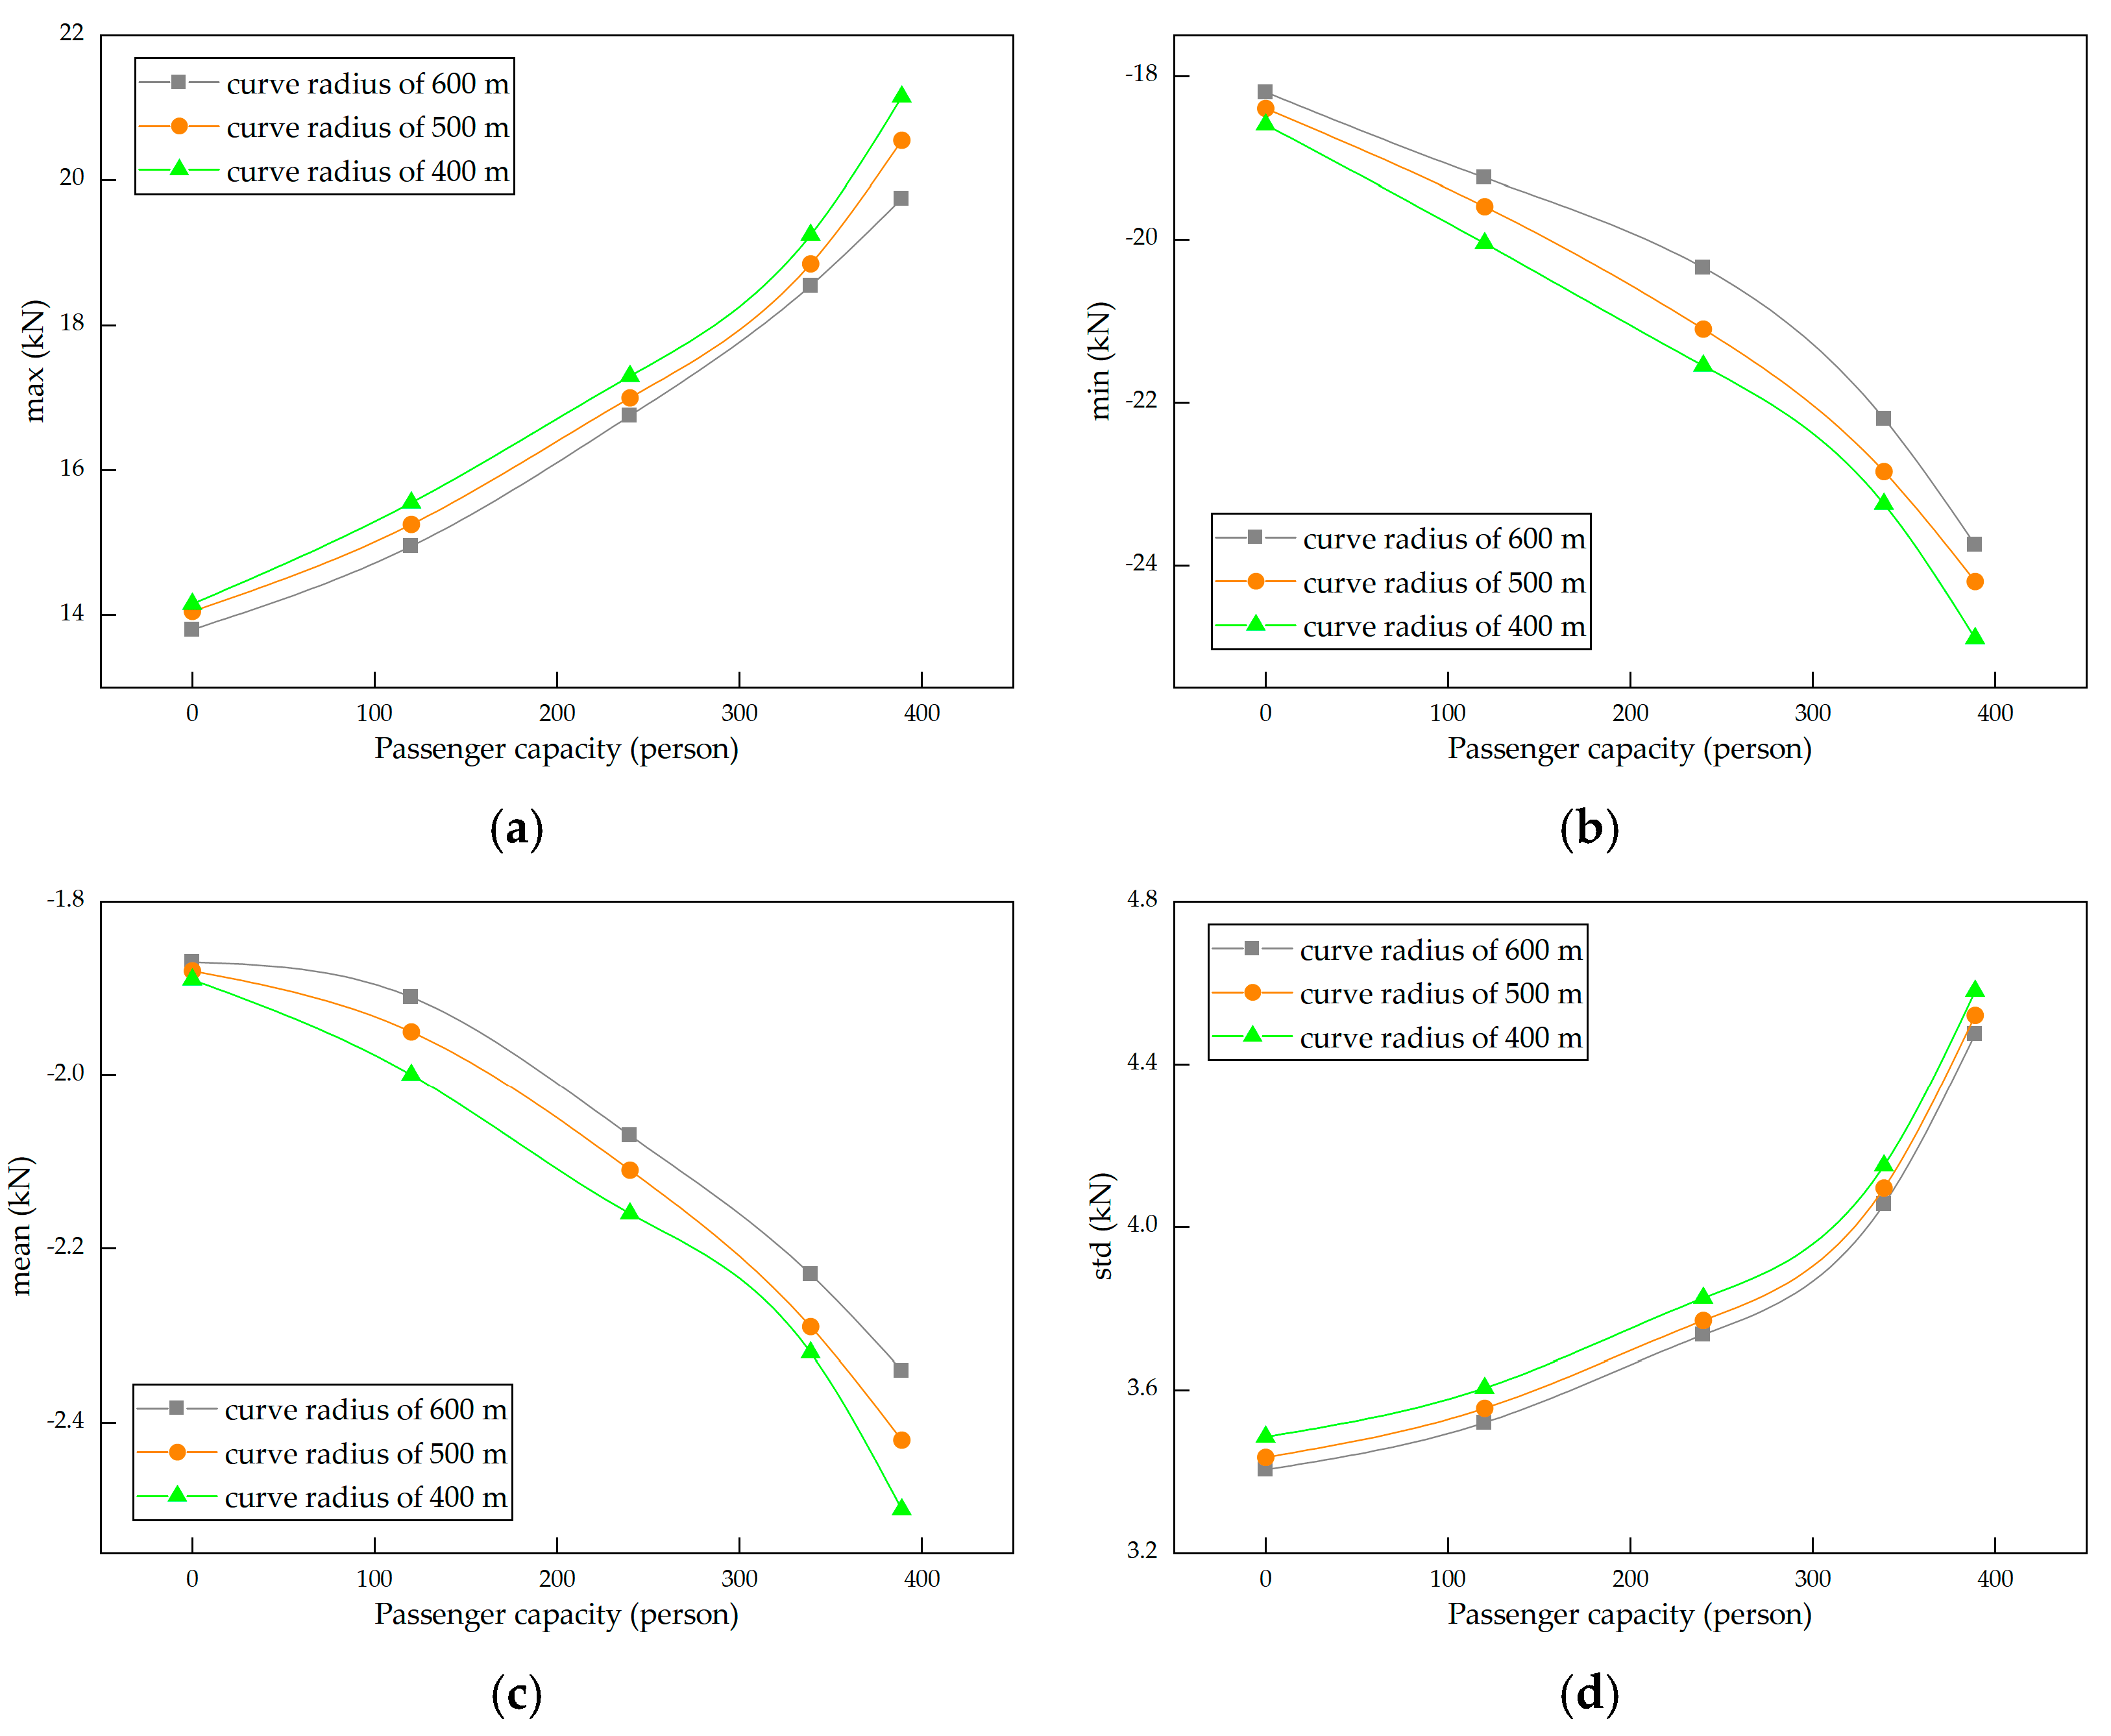
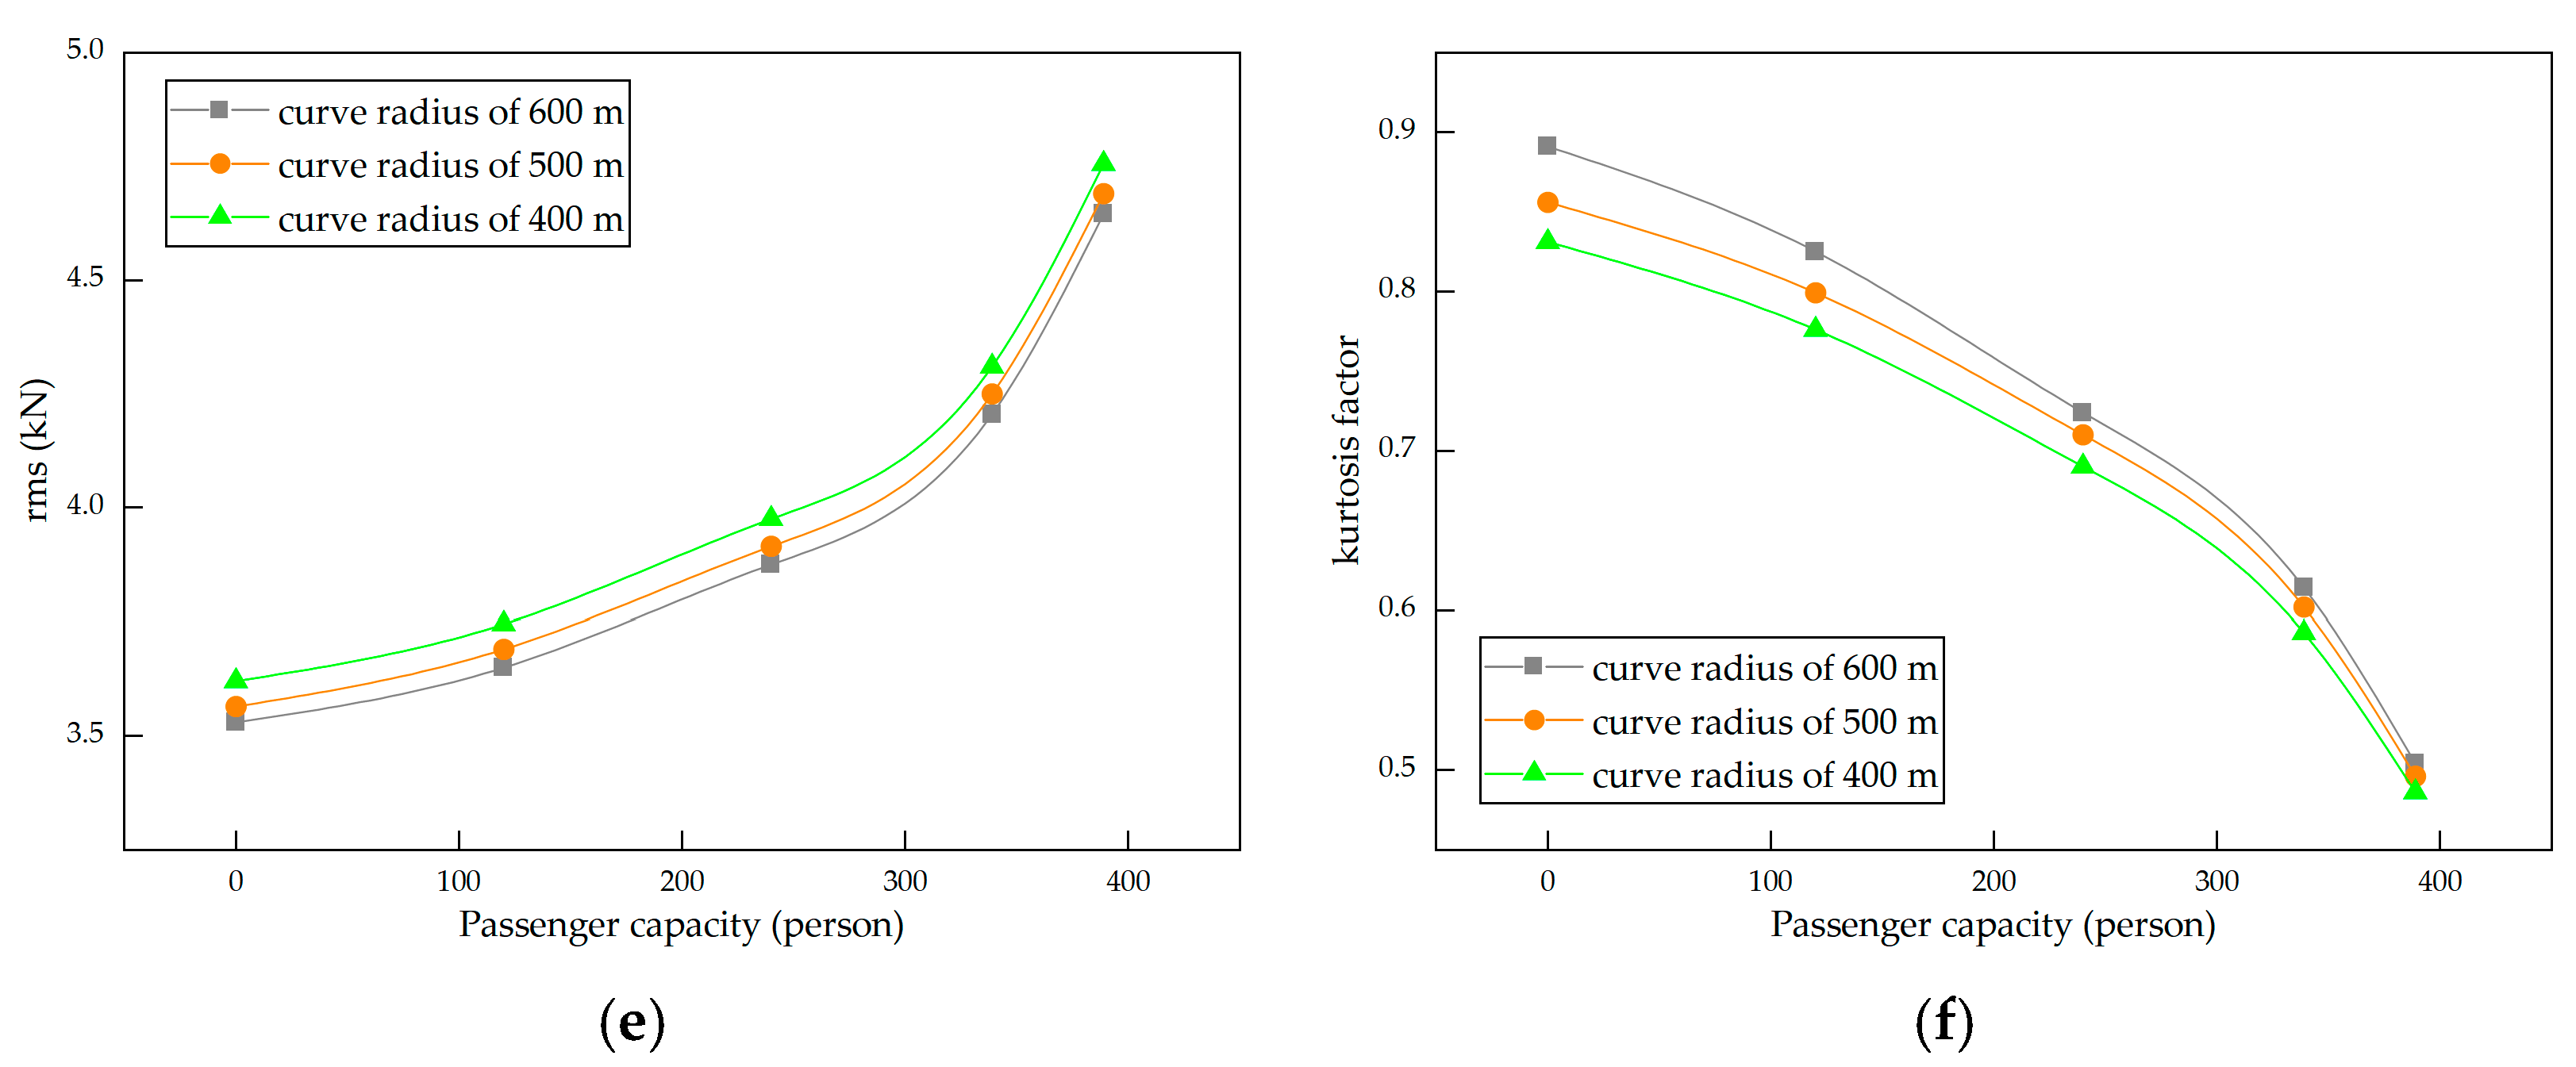
3.3. Curved Line Condition
4. Effect of Passenger Capacity on Fatigue Life of Gearbox Suspender
4.1. Fatigue Life Evaluation Approach
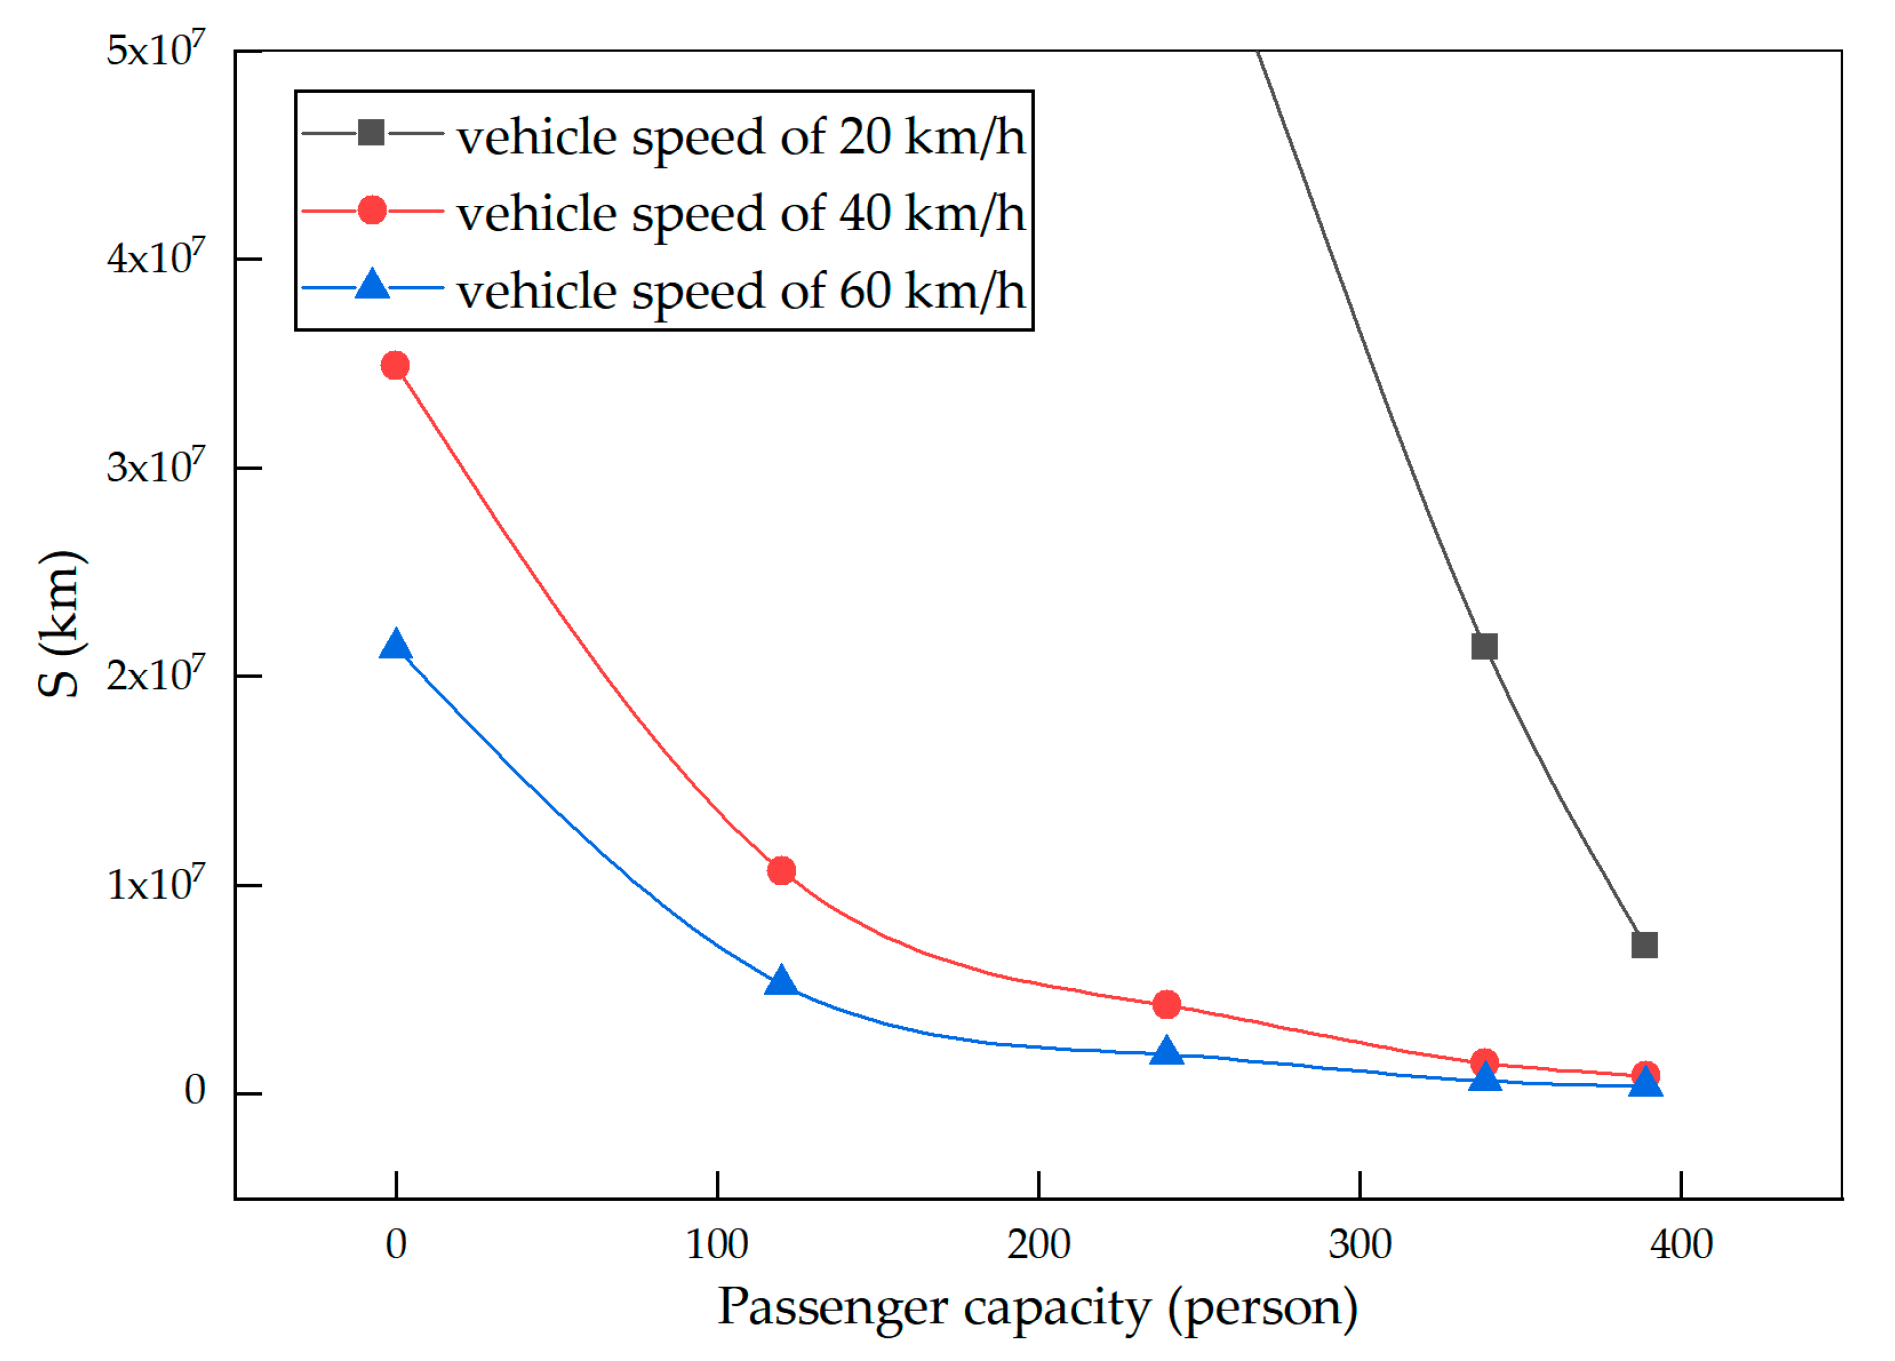
4.2. Straight-Line Conditions
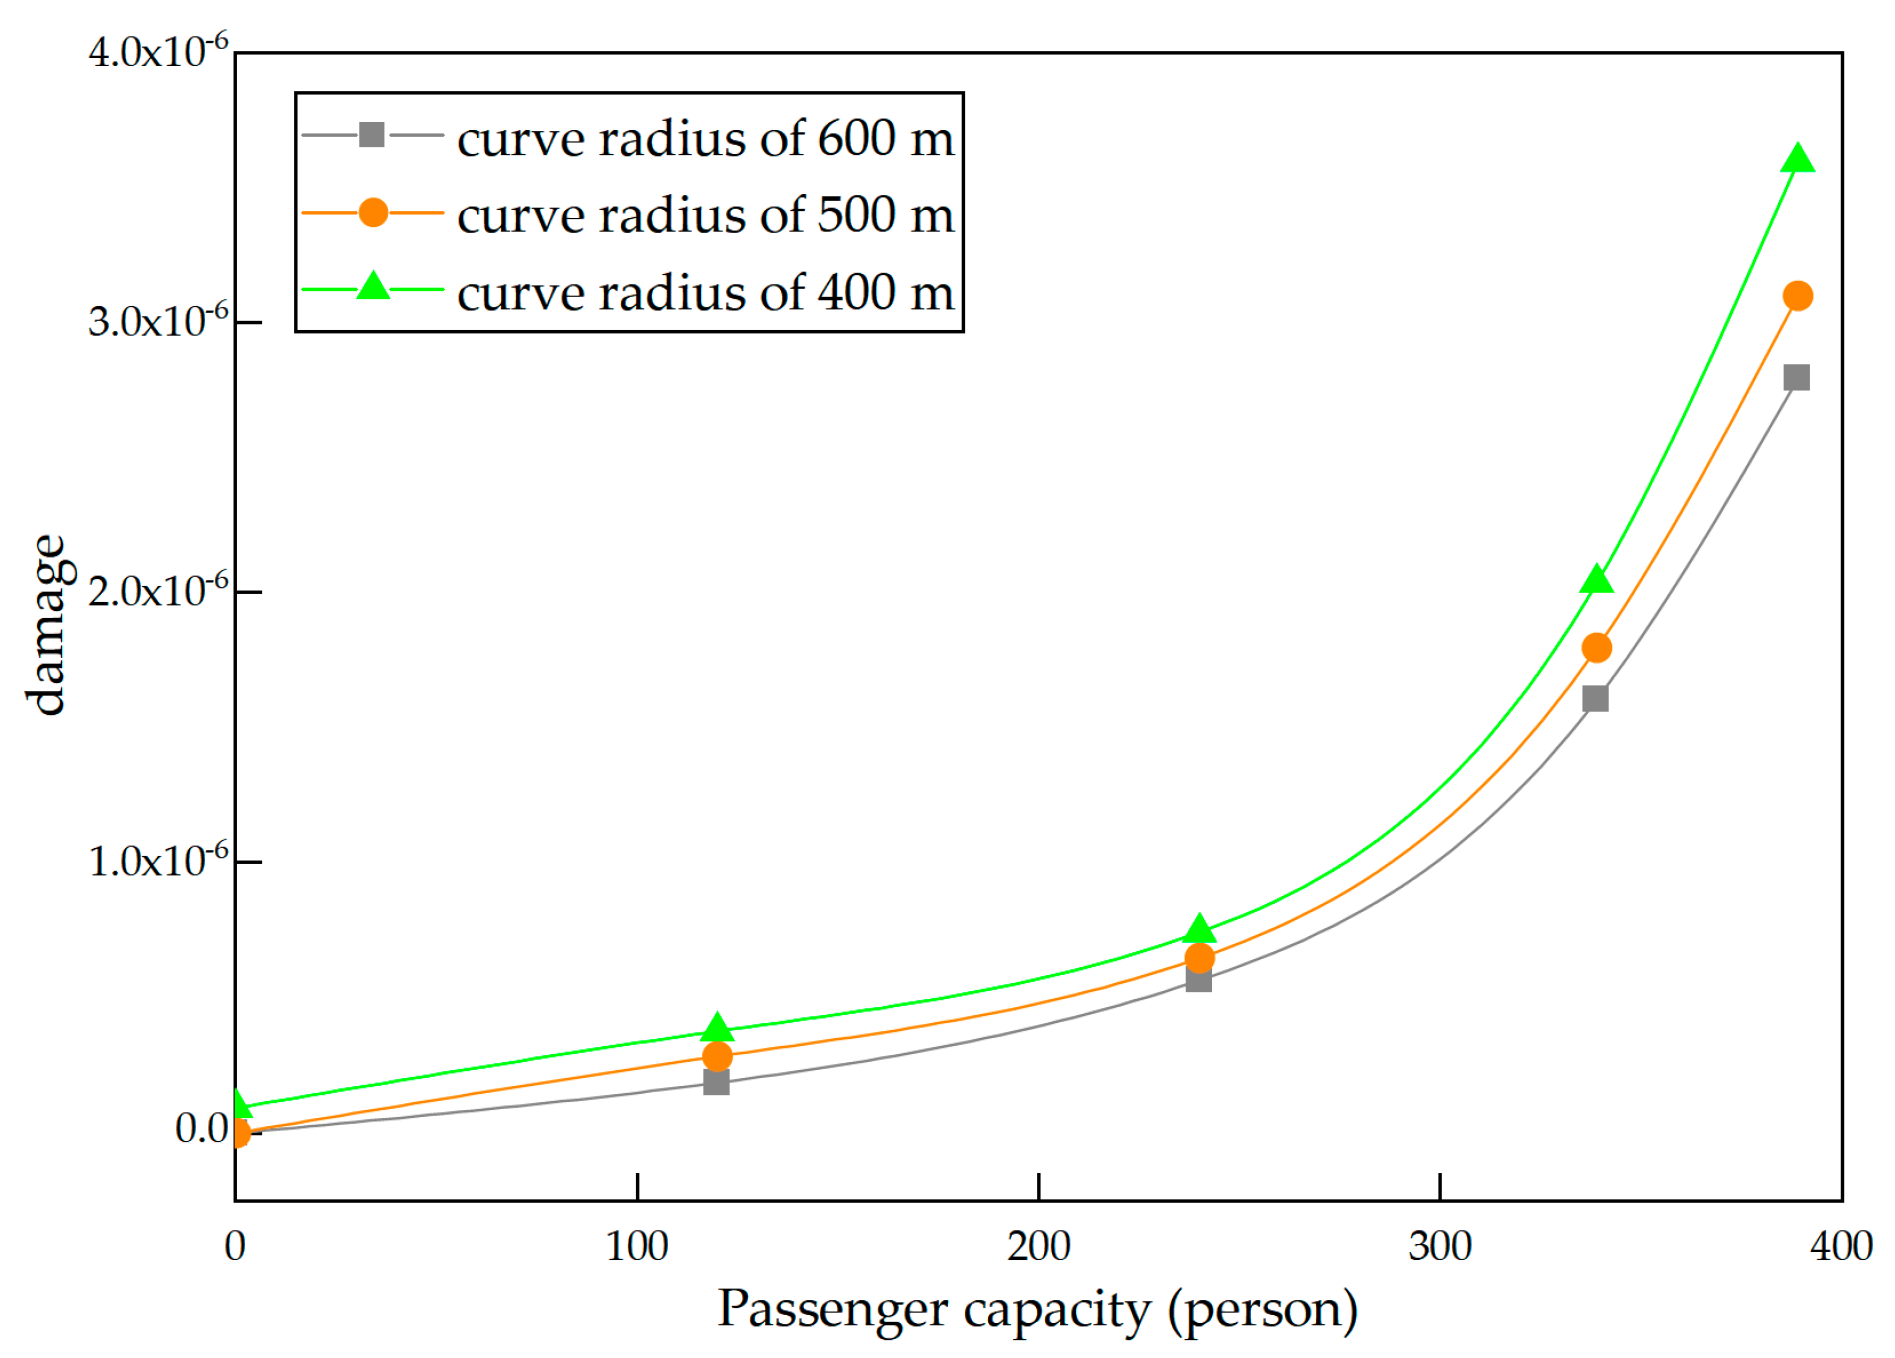
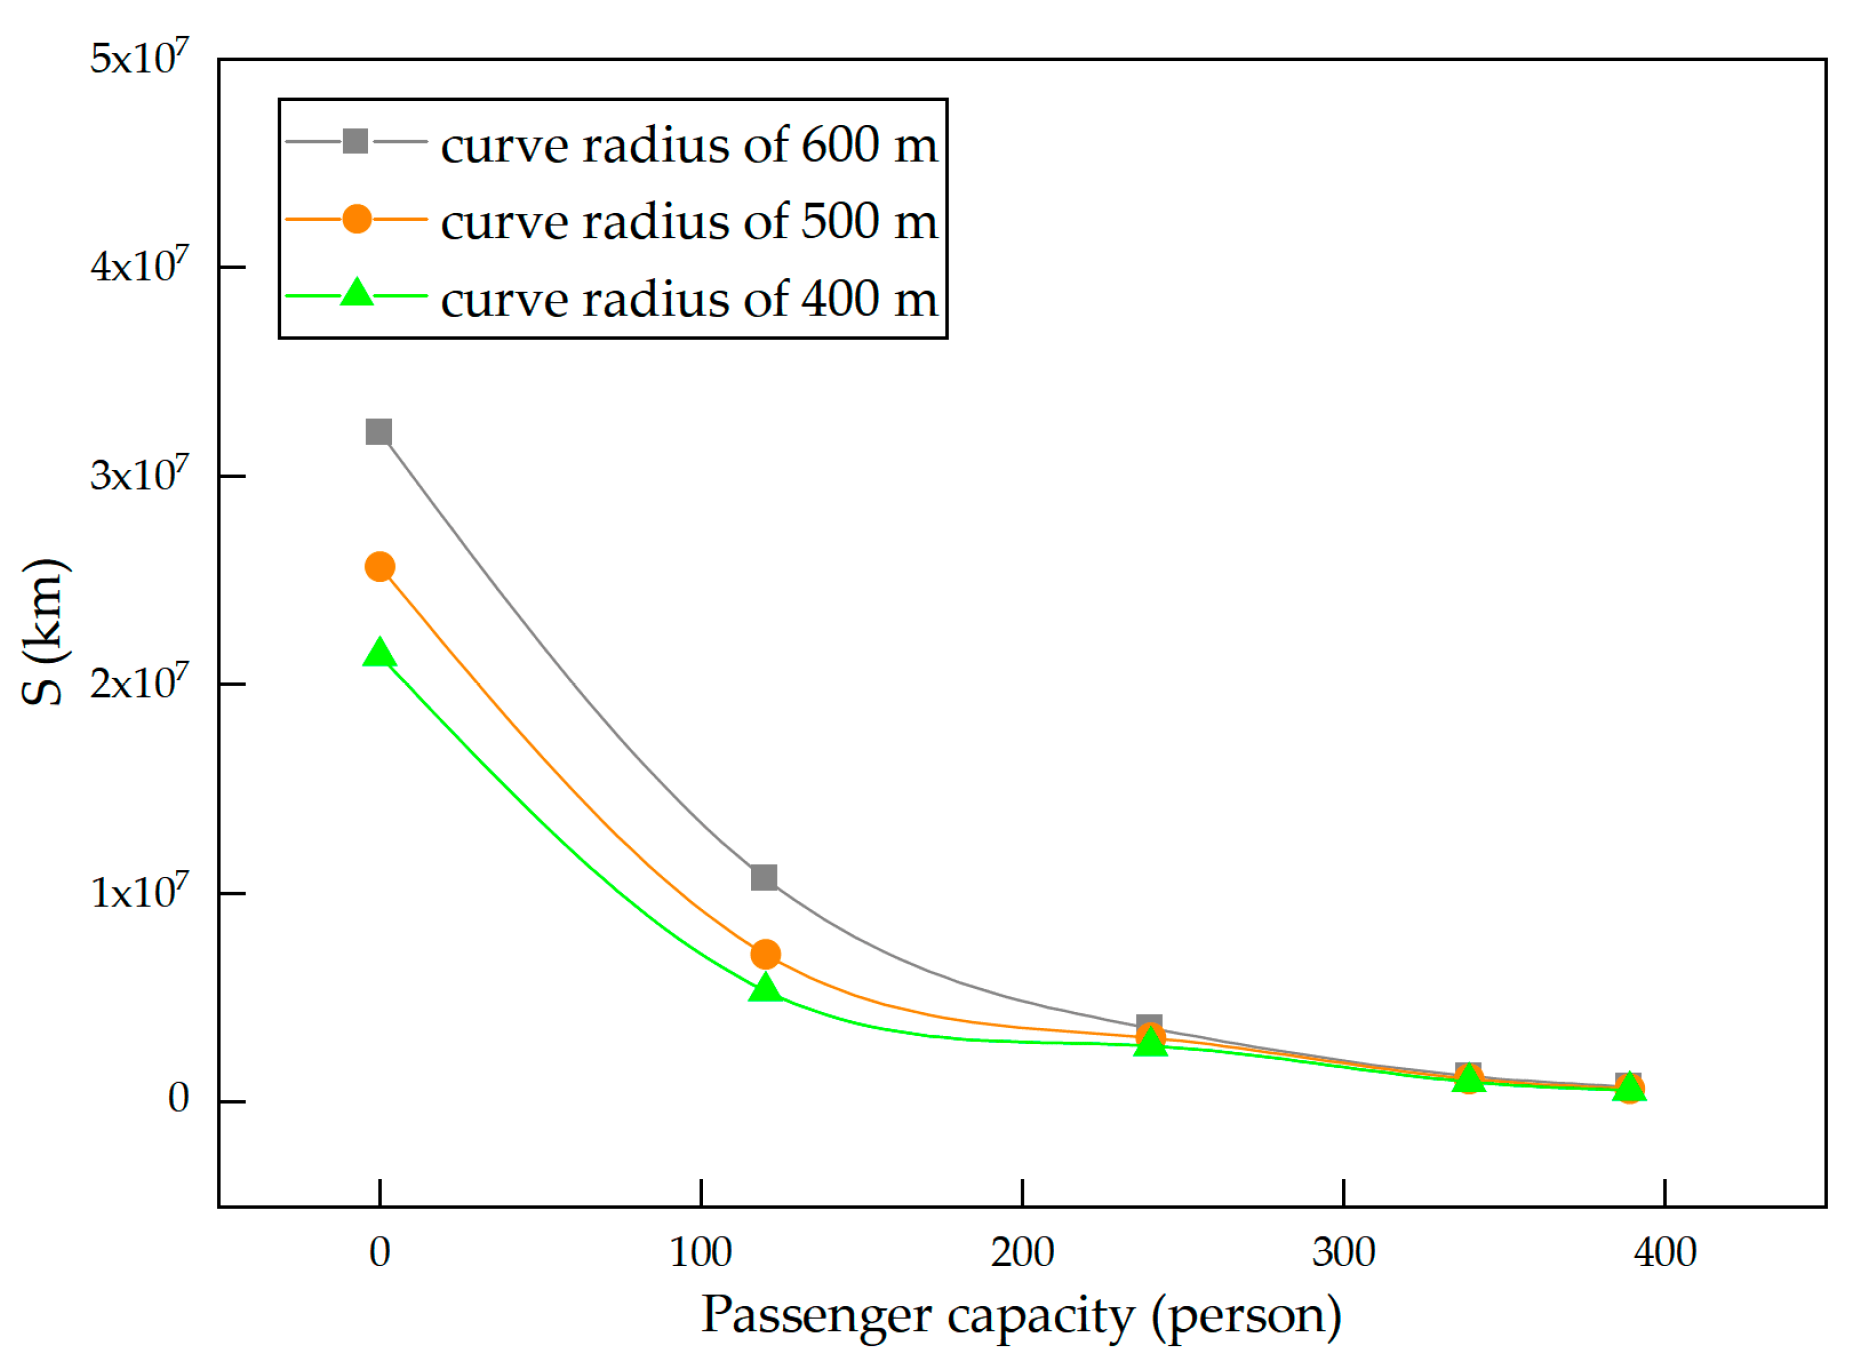
4.3. Curved Line Conditions
5. Conclusions
- (1)
- In this paper, a rigid body and bogie are established and treated with different degrees of equivalence to reduce the calculation. When the necessary conditions are available, the dynamics model can be further improved using the rigid–flexible coupling model and by establishing a complete model to make the simulation results more accurate and closer to reality;
- (2)
- Due to the complex structure of the transmission system and various load inputs, the impact characteristics of each part of the excitation are not specifically analyzed in this paper. The effect of a single load on the dynamic characteristics of the drive train can be explored in detail in subsequent studies;
- (3)
- The fatigue life analysis and prediction in this paper are based on the simulation model, the floating value of linear cumulative damage theory is relatively large, and the calculation results have some deviation from the actual working conditions in theory. When the conditions and equipment allow, the fatigue life of a large number of gearbox suspenders employed in this line can be tested for long-term line tracking, so the model can be verified and corrected for engineering practice;
- (4)
- Future work should be based on the analysis in this paper, aiming to optimize the suspender design and fatigue life to meet requirements.
Author Contributions
Funding
Institutional Review Board Statement
Informed Consent Statement
Data Availability Statement
Conflicts of Interest
References
- Sun, G.; Ren, Z.S.; Xin, X. Dynamics of Gear Transmission System of High-speed Vehicle. Int. J. Mech. Eng. Educ. 2019, 55, 104–111. [Google Scholar]
- Zhu, W.; Sun, W.; Wu, H. Vibration and Stress Response of High-Speed Train Gearboxes under Different Excitations. Appl. Sci. 2022, 12, 712. [Google Scholar] [CrossRef]
- Li, J.; Qian, X.; Liu, C. Comparative Study of Different Moving Mesh Strategies for Investigating Oil Flow Inside a Gearbox. Int. J. Numer. Methods Heat Fluid Flow 2022, 32, 3504–3525. [Google Scholar] [CrossRef]
- Shi, D.X. Finite Element Analysis and Optimum Design of Traction Gear Box of Locomotives. Master’s Thesis, Dalian Jiaotong University, Dalian, China, 2015. [Google Scholar]
- Fomin, O.; Lovska, A.; Kucera, P. Determination of the Vertical Load on the Carrying Structure of a Flat Wagon with the 18-100 and Y25 Bogies. Appl. Sci. 2021, 11, 4130. [Google Scholar] [CrossRef]
- Lourenco, M.A.D.; Eckert, J.J.; Silva, L.C.A. Vehicle and Twin-Roller Chassis Dynamometer Model Considering Slip Tire Interactions. Mech. Based Des. Struc. 2022, 50, 1–18. [Google Scholar] [CrossRef]
- Liu, T.; Cui, L.; Zhang, C. Research on Fault Diagnosis of Planetary Gearbox Based on Variable Multi-Scale Morphological Filtering and Improved Symbol Dynamic Entropy. Int. J. Adv. Manuf. Tech. 2022, 124, 3947–3961. [Google Scholar] [CrossRef]
- Wang, W.; Wang, S.; Xu, C. Research on Vibration and Noise Reduction of Planetary Gear Reducer Based on Rigid-Flexible Coupling. Mod. Manuf. Eng. 2022, 2, 79–85. [Google Scholar]
- Li, Z. Research on Installation Method of Gearbox for High-Speed Trains. Master’s Thesis, Southwest Jiaotong University, Chengdu, China, 2017. [Google Scholar]
- Xu, N.; Ren, Z.; Li, X. Vibration Transmission and Smoothness Study of Vehicle and Hanging Equipment Coupling Action Vertical System. J. Vib. Eng. 2017, 30, 965–974. [Google Scholar]
- Xu, K. Research on Driving System Dynamics for High Speed Motor Car with Bogie Frame-Suspended Motors. Master’s Thesis, Southwest Jiaotong University, Chengdu, China, 2019. [Google Scholar]
- Li, W.; Wei, J.; Zhang, Y. Harmonic Torque Vibration Analysis and Active Disturbance Rejection Control of High-Speed Train. J. Vib. Shock. 2022, 41, 98–106. [Google Scholar]
- Qi, L.; Zhou, J.; Xu, H. Multi-Objective Optimization of Gearbox Based on Panel Acoustic Participation and Response Surface Methodology. J. Low Freq. Noise Vib. Act. Control. 2022, 41, 1108–1130. [Google Scholar] [CrossRef]
- Hajnayeb, A.; Sun, Q. Study of Gear Pair Vibration Caused by Random Manufacturing Errors. Arch. Appl. Mech. 2022, 92, 1451–1463. [Google Scholar] [CrossRef]
- Wang, J.; Yang, J.; Bai, Y. A Comparative Study of The Vibration Characteristics of Railway Vehicle Axlebox Bearings with Inner/Outer Race Faults. Proc. Inst. Mech. Eng. Part F J. Rail Rapid Transit 2021, 235, 1035–1047. [Google Scholar] [CrossRef]
- Wang, J.; Yang, J.; Lin, Y. Analytical Investigation of Profile Shifts on The Mesh Stiffness and Dynamic Characteristics of Spur Gears. Mech. Mach. Theory 2022, 167, 104529. [Google Scholar] [CrossRef]
- Wang, J.; Yang, J.; Li, Q. Quasi-Static Analysis of The Nonlinear Behavior of a Railway Vehicle Gear System Considering Time-Varying and Stochastic Excitation. Nonlinear Dynam. 2018, 93, 463–485. [Google Scholar] [CrossRef]
- Yang, J.; Zhao, Y.; Wang, J. Influence of Wheel Flat on Railway Vehicle Helical Gear System under Traction/Braking Conditions. Eng. Fail. Anal. 2022, 134, 106022. [Google Scholar] [CrossRef]
- Wang, J.; Yang, J.; Zhao, Y. Nonsmooth Dynamics of a Gear-Wheelset System of Railway Vehicles under Traction/Braking Conditions. J. Comput. Nonlin. Dyn. 2020, 15, 081003. [Google Scholar] [CrossRef]
- Ye, Y.; Zhu, B.; Huang, P. OORNet: A Deep Learning Model for On-Board Condition Monitoring and Fault Diagnosis of Out-of-Round Wheels of High-Speed Trains. Measurement 2022, 199, 111268. [Google Scholar] [CrossRef]
- Fang, J.; Ma, Y.; Xue, X. Research on Vibration Fatigue Life Prediction of Gearbox Structure for and Intercity Train. J. Rail. Way Sci. Eng. 2021, 18, 2418–2426. [Google Scholar]
- Ai, Y.; Ma, H.; Zhang, W. The Cross-Scale Life Prediction for the High-Speed Train Gearbox Shell Based on the Three-Interval Method. Sci. Program. 2022, 2022, 6439229. [Google Scholar] [CrossRef]
- Yuan, D. Analysis on The Strength and Fatigue-Life Prediction of Standard High-Speed Emu Gear Box Housing. Master’s Thesis, Beijing Jiaotong University, Beijing, China, 2016. [Google Scholar]
- Zhao, C.; Yang, J.; Wang, H. Strength Analysis and Fatigue Life Prediction of the Subway Gear Box Bracket. J. Beijing Univ. Archit. Archit. 2015, 31, 60–64. [Google Scholar]
- Wang, D.; Du, L.; Wu, L. Rail Train Gear Drive Line Test Study. Roll Stock Tech. 2021, 2, 44–46. [Google Scholar]
- Zhang, Y.; Zhang, M.; Xie, L. Fatigue Life Analysis of Ball Bearings and a Shaft System Considering the Combined Bearing Preload and Angular Misalignment. Appl. Sci. 2020, 10, 2750. [Google Scholar] [CrossRef] [Green Version]
- Han, J.; Chen, W. An Ordinary State-Based Peridynamic Model for Fatigue Cracking of Ferrite and Pearlite Wheel Material. Appl. Sci. 2020, 10, 4325. [Google Scholar] [CrossRef]
- Lisowski, F.; Lisowski, E. Testing and Fatigue Life Assessment of Timber Truck Stanchions. Appl. Sci. 2020, 10, 6134. [Google Scholar] [CrossRef]
- Li, H.; Wu, G. Fatigue Evaluation of Steel Bridge Details Integrating Multi-Scale Dynamic Analysis of Coupled Train-Track-Bridge System and Fracture Mechanics. Appl Sci. 2020, 10, 3261. [Google Scholar] [CrossRef]
- Tian, Q.; Liao, Y.; Zhu, H. Study on the Prediction Method of the Ultra-Low-Cycle Fatigue Damage of Steel. Appl. Sci. 2020, 10, 679. [Google Scholar] [CrossRef] [Green Version]
- Xu, J.; Zhang, Y.; Lacidogna, G. Research on the Scope of Spectral Width Parameter of Frequency Domain Methods in Random Fatigue. Appl. Sci. 2020, 10, 4715. [Google Scholar] [CrossRef]
- Li, C.; Dai, W.; He, D. Fatigue Life Estimation of Medium-Carbon Steel with Different Surface Roughness. Appl. Sci. 2017, 7, 338. [Google Scholar] [CrossRef] [Green Version]
- Hu, B.; Liu, J.Z.; Chen, J. Relationship between Fatigue Notch Factor Kf and Stress Concentration Factor Kt. J. Mater. Eng. Perform. 2007, 7, 70–73. [Google Scholar]
- Wang, M. Study on the Fatigue Appraising and Load Spectrum of the Bogie Frame for the Subway. Master’s Thesis, Beijing Jiaotong University, Beijing, China, 2011. [Google Scholar]
- Wang, H.; Xing, B.; Luo, H. Rainflow Counting Method and Application in Fatigue Life Estimation. Min. Mach. 2006, 34, 95–97. [Google Scholar]
- Zhang, Y.J. S-N Exploration of The Mathematical Expression Treatment of Fatigue Curves. Phys. Chem. Exam. Phys. 2007, 43, 563–565. [Google Scholar]
- Zeng, J.; Bu, J.; Liu, J. Optimization Design of Bogie Gear Box Suspender. Comput. Aid. Eng. 2013, 22, 27–30. [Google Scholar]
- Zhang, X. Study on Heat Treatment and Shot Peening Process of Elastic Boom of High-speed Railway Traction Device. Master’s Thesis, University of Jinan, Jinan, China, 2019. [Google Scholar]
- Meng, Y.; Wang, Q.; Gong, F. Finite Element Analysis and Test Verification on EMU Gearbox Suspender. Comput. Aid. Eng. 2017, 26, 27–31. [Google Scholar]
- Qin, C. Analysis of the Strength Performance of an Under-Car Suspension Device for a Certain Type of Rolling Stock. Sci. Tech. Innov. 2019, 8, 35–36. [Google Scholar]
- Zhang, Z. Strength Analysis of Subway Gearbox Suspender Device. Mech. Eng. Aut. 2017, 200, 42–43. [Google Scholar]
- Wang, H. Study on the Failure Reason and Improvement Scheme of Hanging Device Structure of Gear Transmission System Used in the Railway Vehicle. Master’s Thesis, Beijing Jiaotong University, Beijing, China, 2020. [Google Scholar]
- Shi, Y.Z.; Gao, Y.D. Strength Analysis of Gear Box Boom Assembly. J. Mong. Univ. Sci. Tech. 2021, 40, 405–410. [Google Scholar]
- Yang, C.; Yue, T.; Hu, W.H. Optimization Design of a Gearbox Suspension Device. Mechanical 2022, 49, 37–44. [Google Scholar]
- Wu, A.W.; Xu, D.W.; Zhang, X.R.; Li, L.Y. Structural Design and Experimental Research on the Rubber Joints of the Gearbox Boom. J. Mech. Str. 2021, 43, 1245–1249. [Google Scholar]
- Wan, X.Y.; Jiang, F.; Li, C.; Chen, Y.Z. Optimized Design of Bogie Gearbox Suspender. Eng. Tech. 2021, 1, 217–219. [Google Scholar]
- Sun, P.; Chen, C.; Xue, Z.G. Analysis of Material Selection of U-Shaped Gearbox Suspender for Bogie of Urban Railway Vehicle. CHN. Strat. Em. Ind. 2020, 6, 14. [Google Scholar]
- Wu, H.C.; Wu, P.B.; Wu, N.; Wang, Y.J.; Shan, Y.L. Matching Relations between Equipment Suspension Parameters and a Carbody Structure. J. Vib. Shock 2013, 32, 124–128. [Google Scholar]


| Title | Approaches | Key Parameters |
|---|---|---|
| Strength Analysis of Gear Box Boom Assembly [43] | SW software was used to establish the gearbox derrick assembly model; the 3-D model structure was simplified, the model parameters were optimized, and the strength of the gearbox boom was checked through FEA analysis software. | Material: 42 CrMo Maximum stress: 129.3 MPa Safety factor: 7.0 |
| Optimization Design of a Gearbox Suspension Device [44] | We compared the strength of the boom before and after optimization and predicted the fatigue life of major metal components. Finally, we designed a new type of gearbox suspension device. | Bolt preload force: 612 kN. Extreme working condition: 0~1800 kN Fatigue condition: 0~900 kN Compound stress fatigue damage reliability: 0.17 |
| Structural Design and Experimental Research on the Rubber Joints of the Gearbox Boom [45] | New rubber joint was designed. By using finite element analysis software and FEA software, the fatigue resistance of the new structure was optimized. | Fatigue loading times: 1 × 10⁷ Fatigue test load: 40 kN |
| Optimized Design of Bogie Gearbox Suspender [46] | We optimized the mathematical model and determined the objective function, then reduced the mass of the boom using free-shape optimization. | Load: 27.8 kN Maximum stress: 121.9 Mpa Safety factor: 1.27 |
| Analysis of Material Selection of U-Shaped Gearbox Suspender for Bogie of Urban Railway Vehicle [47] | The suspender was modeled in three dimensions using Pro/Engineer software and subjected to finite element analysis, and then the effects of a material heat treatment process and dimensions were discussed. We determined the material selection based on the Goodman curve. | Ultimate vertical acceleration: 70 g Max. traction torque: 1400 Nm Screw size after machining: Φ39 |
| Modulus/mm | Teeth Number of Pinion | Teeth Number of Gearwheel | Helix Angle/° |
|---|---|---|---|
| 5 | 22 | 133 | 20 |
| Numerical Value | Unit | |
|---|---|---|
| Center distance of bogie | mm | |
| Wheelbase | 2200 | mm |
| Transverse span of wheel rolling circle | 1493 | mm |
| Wheel rolling circle diameter | 840 | mm |
| Distance between backs of wheel flanges | 1353 | mm |
| Wheel profile | LM | |
| Vehicle body mass | 40.8 | t |
| Height of vehicle centroid from the rail surface | 1756 | mm |
| Frame mass | 3188 | kg |
| Height of frame centroid from the rail surface | 570 | mm |
| Mass of axle box | 85.367 | kg |
| Repairing Course | Time Interval (Month) | Distance Traveled (104 km) | Inspection Time (Days) |
|---|---|---|---|
| Monthly inspection | 1 | 1 | 0.5 |
| 3-month inspection | 3 | 3 | 2 |
| Scheduled repair | 15 | 15 | 7 |
| Un-wheeling repair | 60 | 60 | 20 |
| Overhaul | 120 | 120 | 35 |
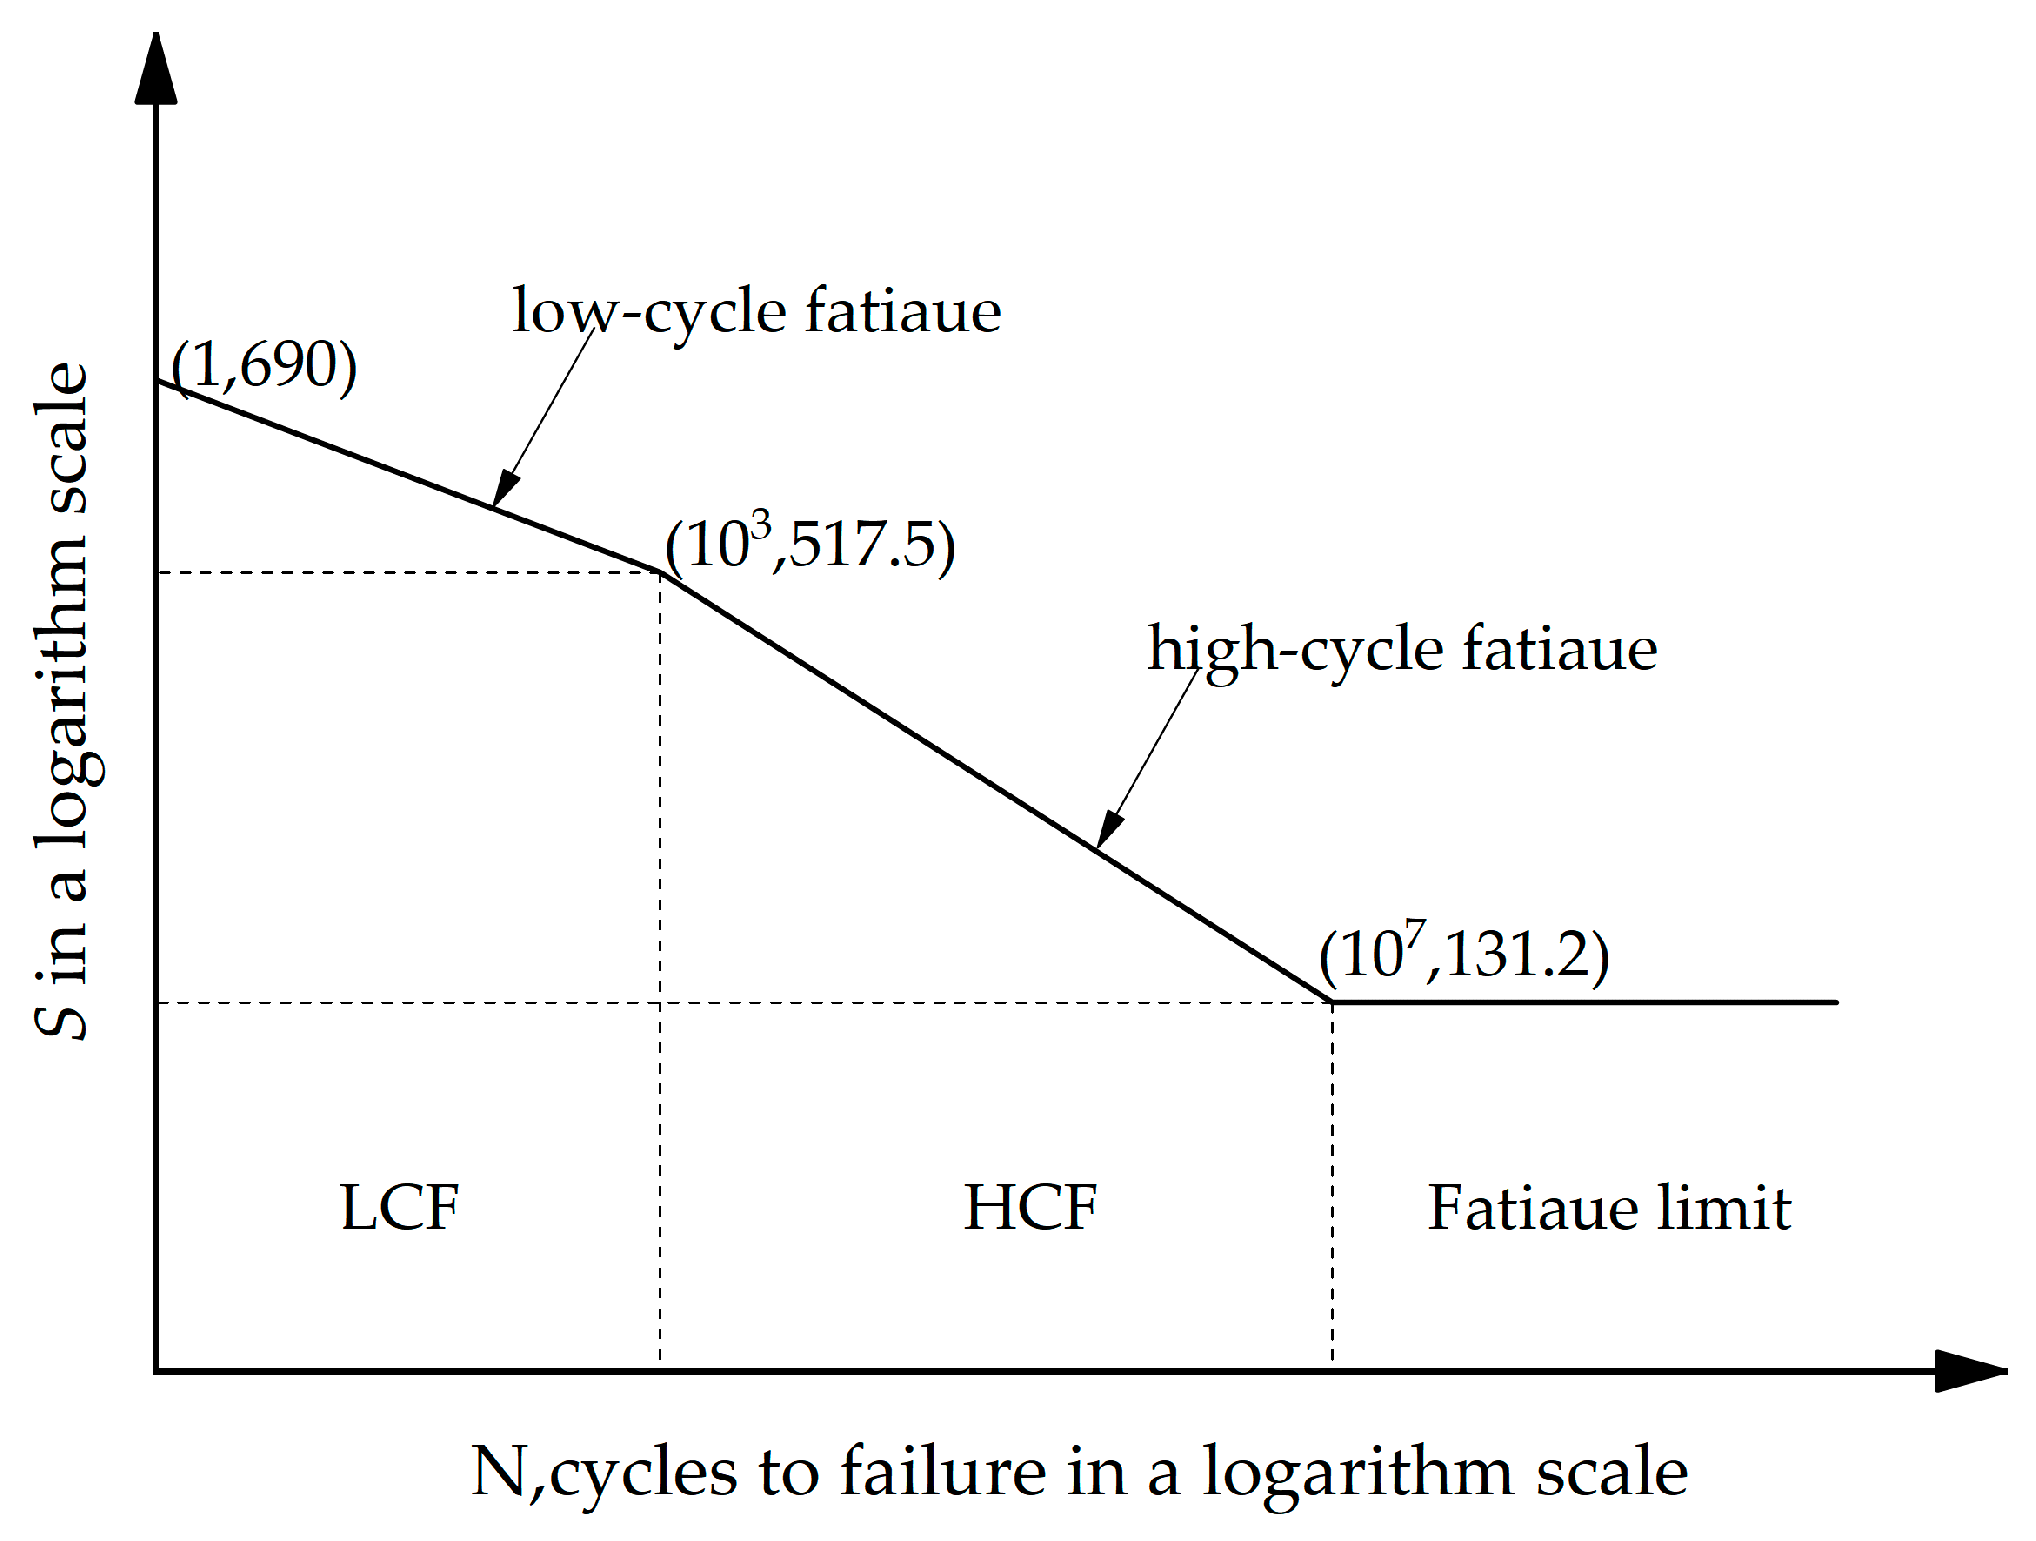
| Tensile Strength σb MPa | Yield Strength σ0.2 MPa | Elastic Modulus E N/mm2 | Poisson’s Ratio μ |
|---|---|---|---|
| 690 | 490 | 0.3 |
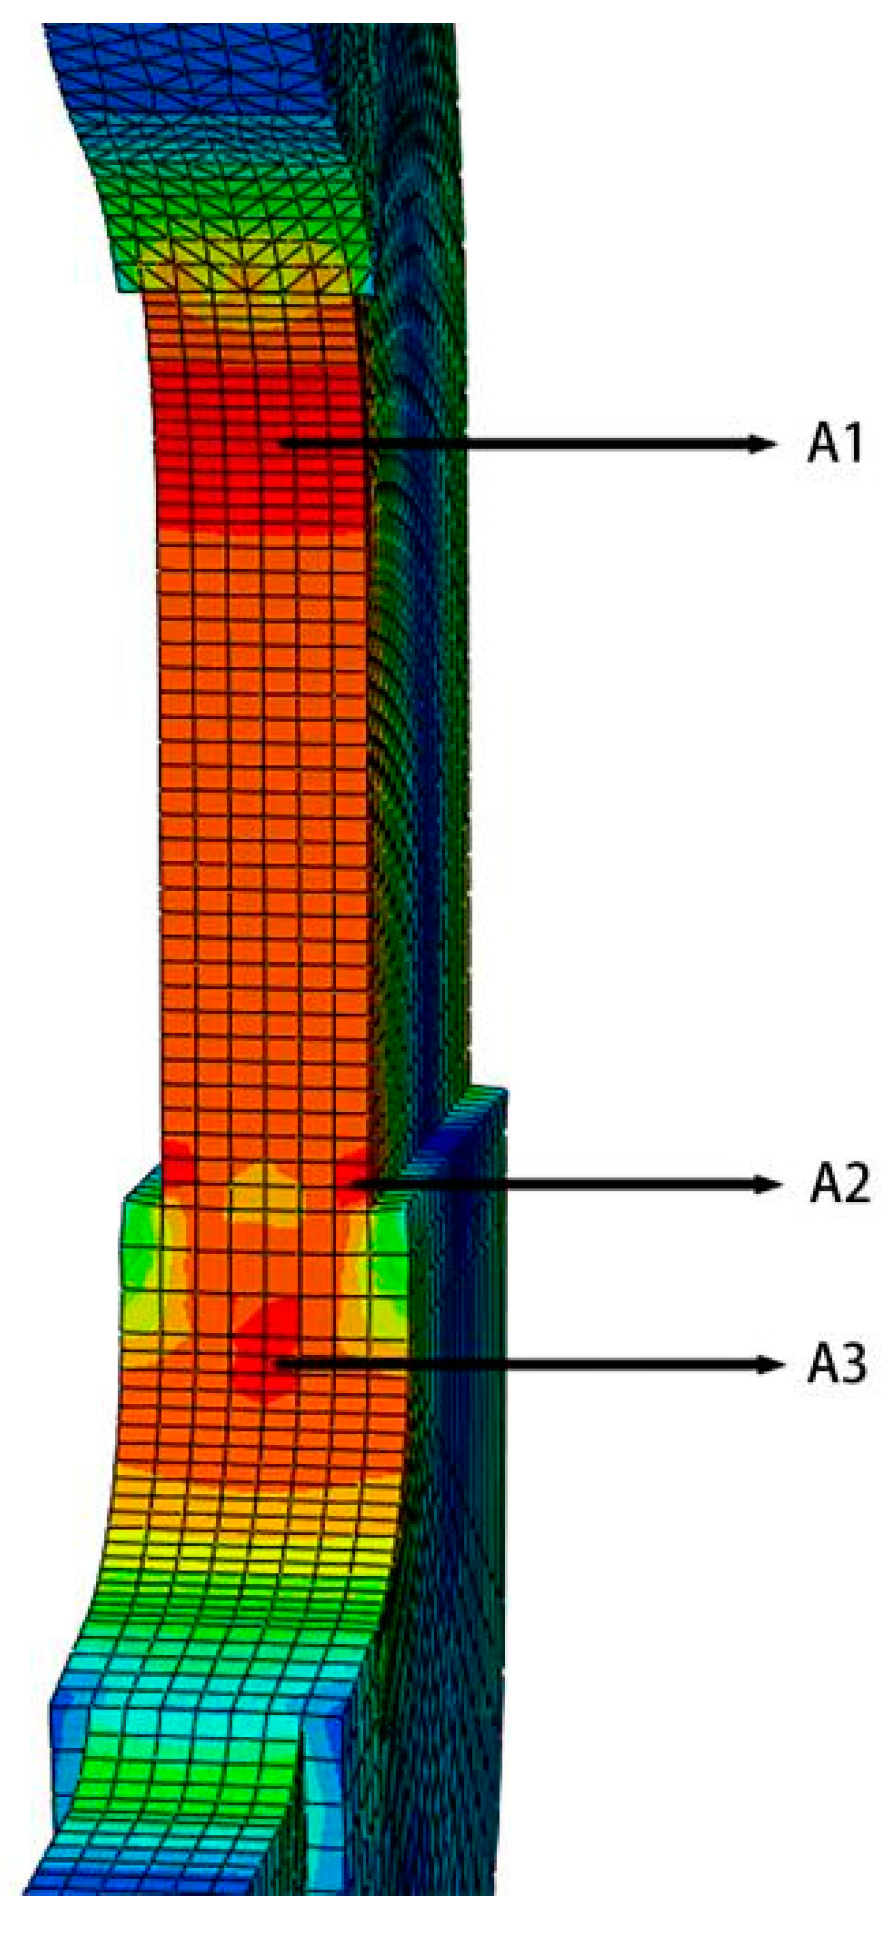
| Position\Parameter | Kt | Kf | ε | β | a |
|---|---|---|---|---|---|
| A1 | 1.15 | 1.09 | 0.73 | 0.8 | 3.89 |
| A2 | 1.30 | 1.15 | 0.73 | 0.8 | 4.07 |
| A3 | 1.25 | 1.13 | 0.7 | 0.8 | 3.76 |
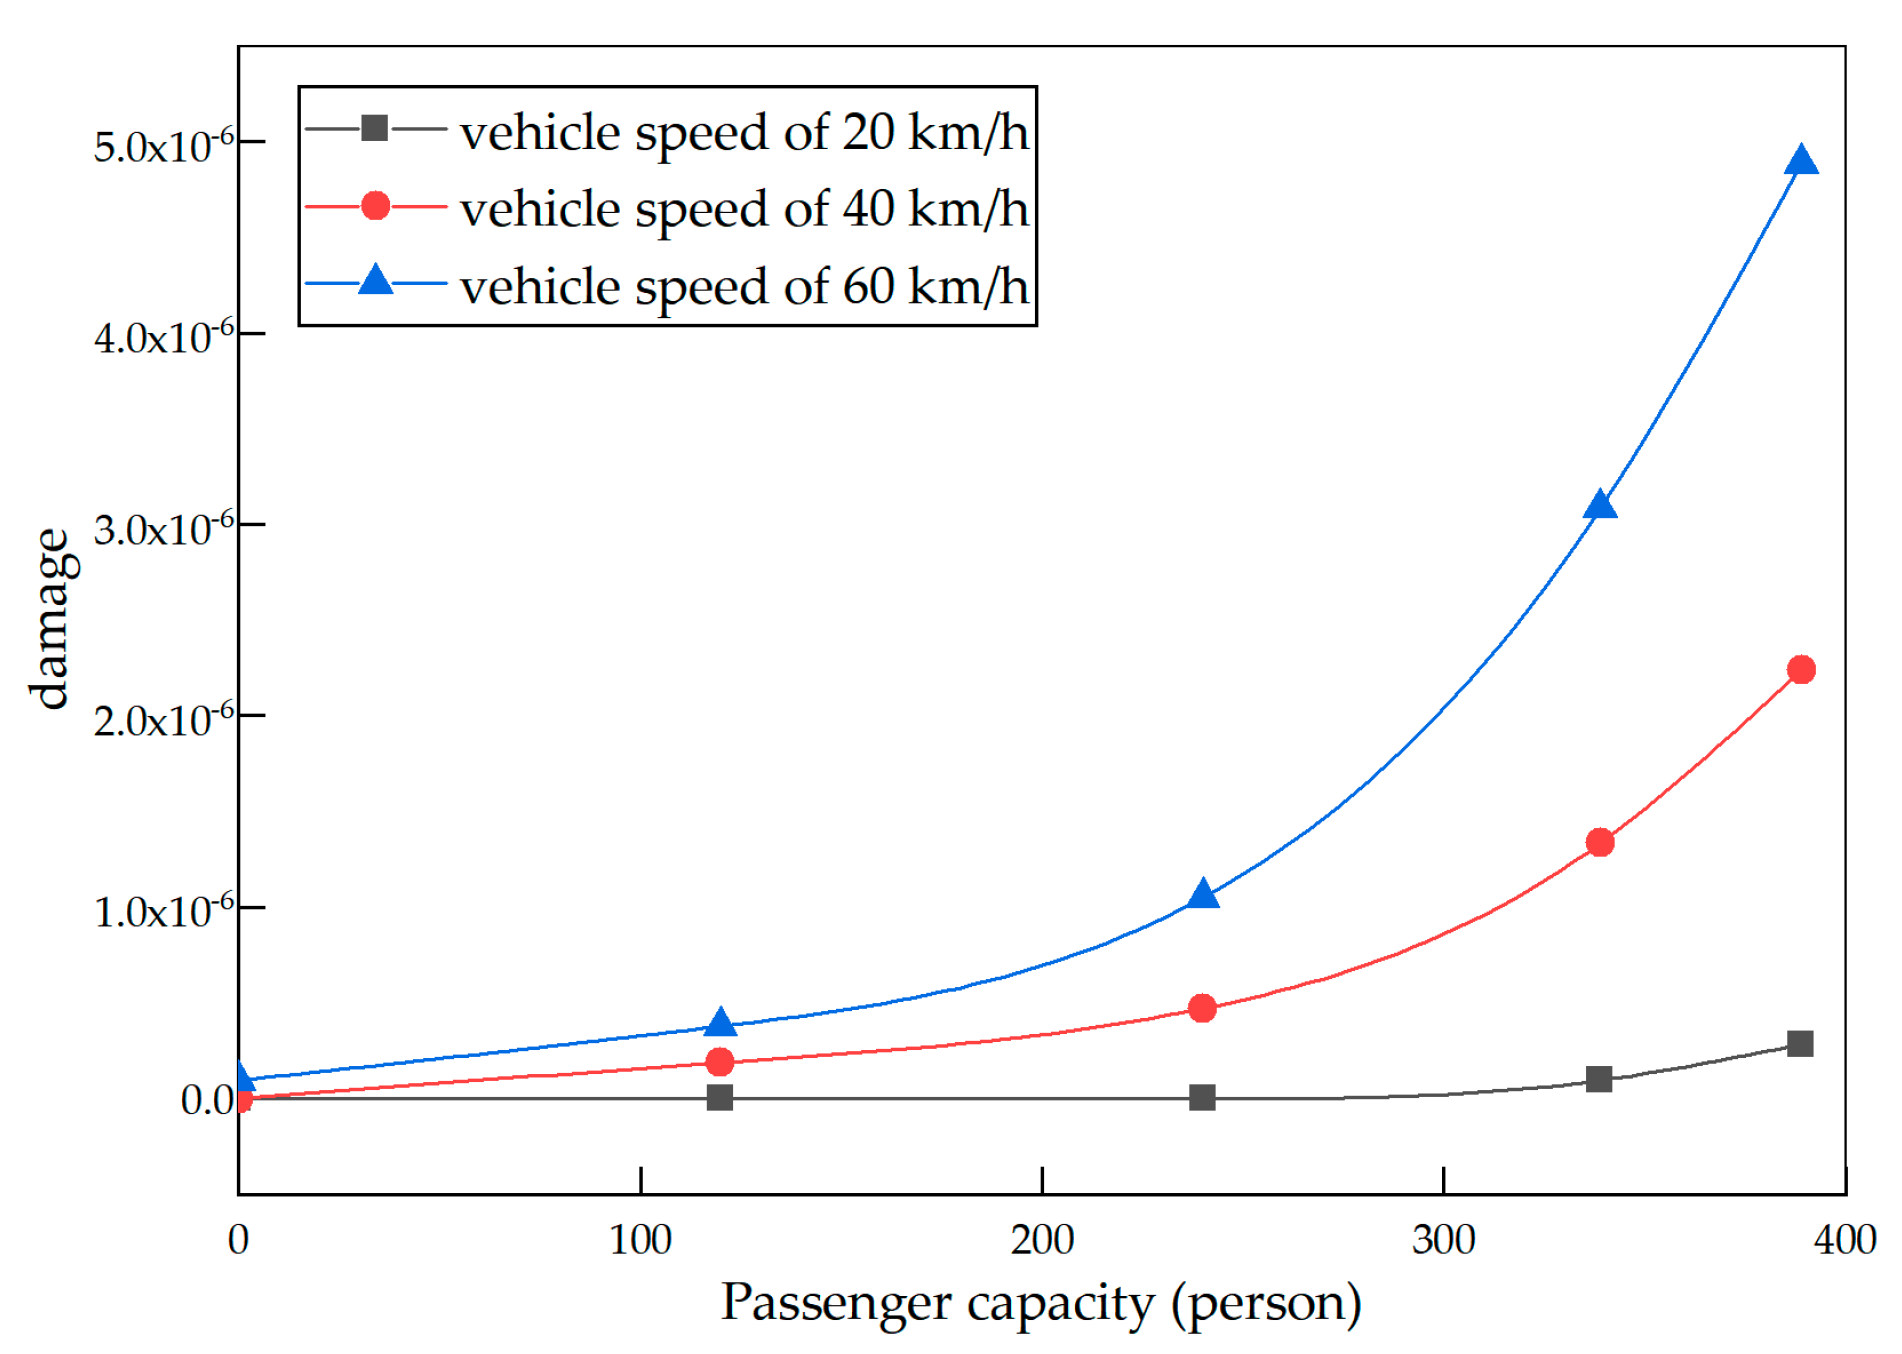
| Damage Growth Rate\Level | 0–120 Person | 120–240 Person | 240–339 Person | 339–389 Person |
|---|---|---|---|---|
| vehicle speed of 20 km/h | 9.45 × 10⁻¹⁰ | 3.79 × 10⁻⁹ | ||
| vehicle speed of 40 km/h | 1.56 × 10⁻⁹ | 2.36 × 10⁻⁹ | 8.74 × 10⁻⁹ | 1.81 × 10⁻⁸ |
| vehicle speed of 60 km/h | 2.38 × 10⁻⁹ | 5.61 × 10⁻⁹ | 2.05 × 10⁻⁹ | 3.61 × 10⁻⁸ |
| Damage Growth Rate\Level | 0–120 Person | 120–240 Person | 240–339 Person | 339–389 Person |
|---|---|---|---|---|
| curve radius of 600 m | 1.56 × 10⁻⁹ | 3.16 × 10⁻⁹ | 1.05 × 10⁻⁸ | 2.37 × 10⁻⁸ |
| curve radius of 500 m | 2.34 × 10⁻⁹ | 3.06 × 10⁻⁹ | 1.16 × 10⁻⁸ | 2.61 × 10⁻⁸ |
| curve radius of 400 m | 2.36 × 10⁻⁹ | 3.05 × 10⁻⁹ | 1.31 × 10⁻⁸ | 3.12 × 10⁻⁸ |
Disclaimer/Publisher’s Note: The statements, opinions and data contained in all publications are solely those of the individual author(s) and contributor(s) and not of MDPI and/or the editor(s). MDPI and/or the editor(s) disclaim responsibility for any injury to people or property resulting from any ideas, methods, instructions or products referred to in the content. |
© 2023 by the authors. Licensee MDPI, Basel, Switzerland. This article is an open access article distributed under the terms and conditions of the Creative Commons Attribution (CC BY) license (https://creativecommons.org/licenses/by/4.0/).
Share and Cite
Huang, X.; Wang, J.; Yang, J.; Zhao, Y.; Wang, Y. Influence of Passenger Capacity on Fatigue Life of Gearbox Suspender of the Traction Transmission System in Urban Railway Vehicles. Sustainability 2023, 15, 4338. https://doi.org/10.3390/su15054338
Huang X, Wang J, Yang J, Zhao Y, Wang Y. Influence of Passenger Capacity on Fatigue Life of Gearbox Suspender of the Traction Transmission System in Urban Railway Vehicles. Sustainability. 2023; 15(5):4338. https://doi.org/10.3390/su15054338
Chicago/Turabian StyleHuang, Xianghe, Jinhai Wang, Jianwei Yang, Yue Zhao, and Yuzhu Wang. 2023. "Influence of Passenger Capacity on Fatigue Life of Gearbox Suspender of the Traction Transmission System in Urban Railway Vehicles" Sustainability 15, no. 5: 4338. https://doi.org/10.3390/su15054338