
Response of the Thick and Thin Debris-Covered Glaciers between 1971 and 2019 in Ladakh Himalaya, India—A Case Study from Pensilungpa and Durung-Drung Glaciers

Abstract
:1. Introduction
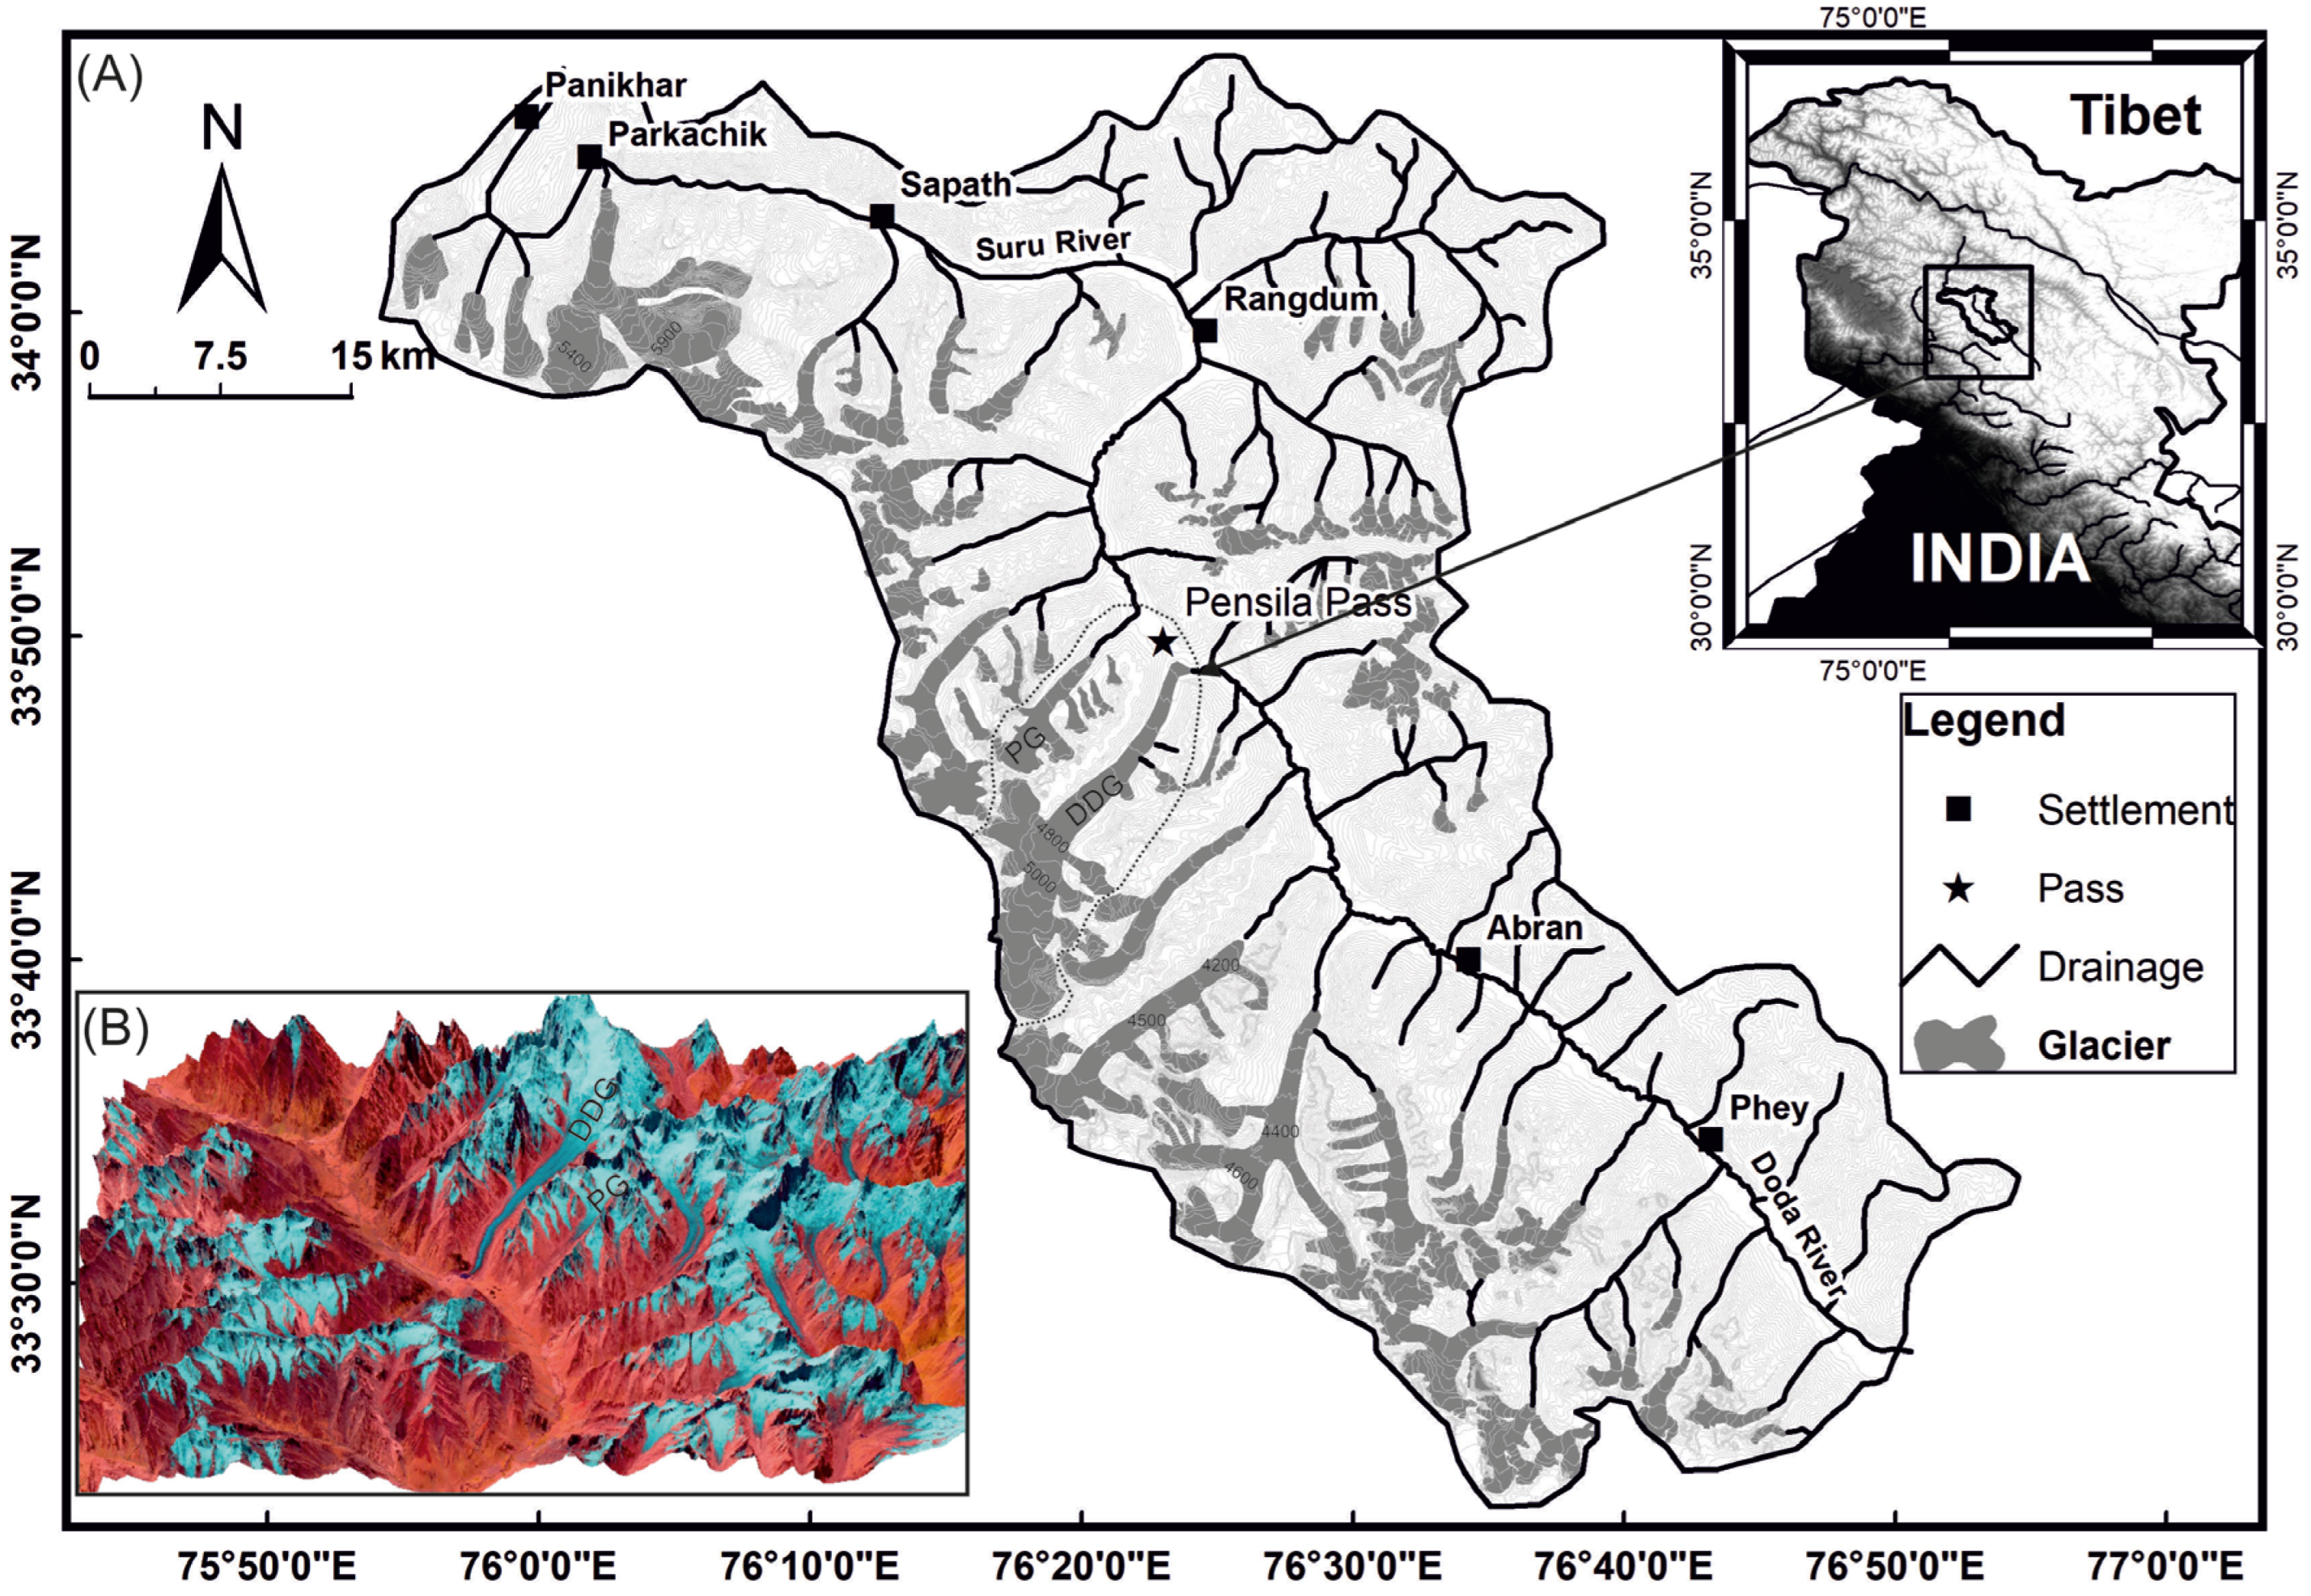
1.1. Study Site
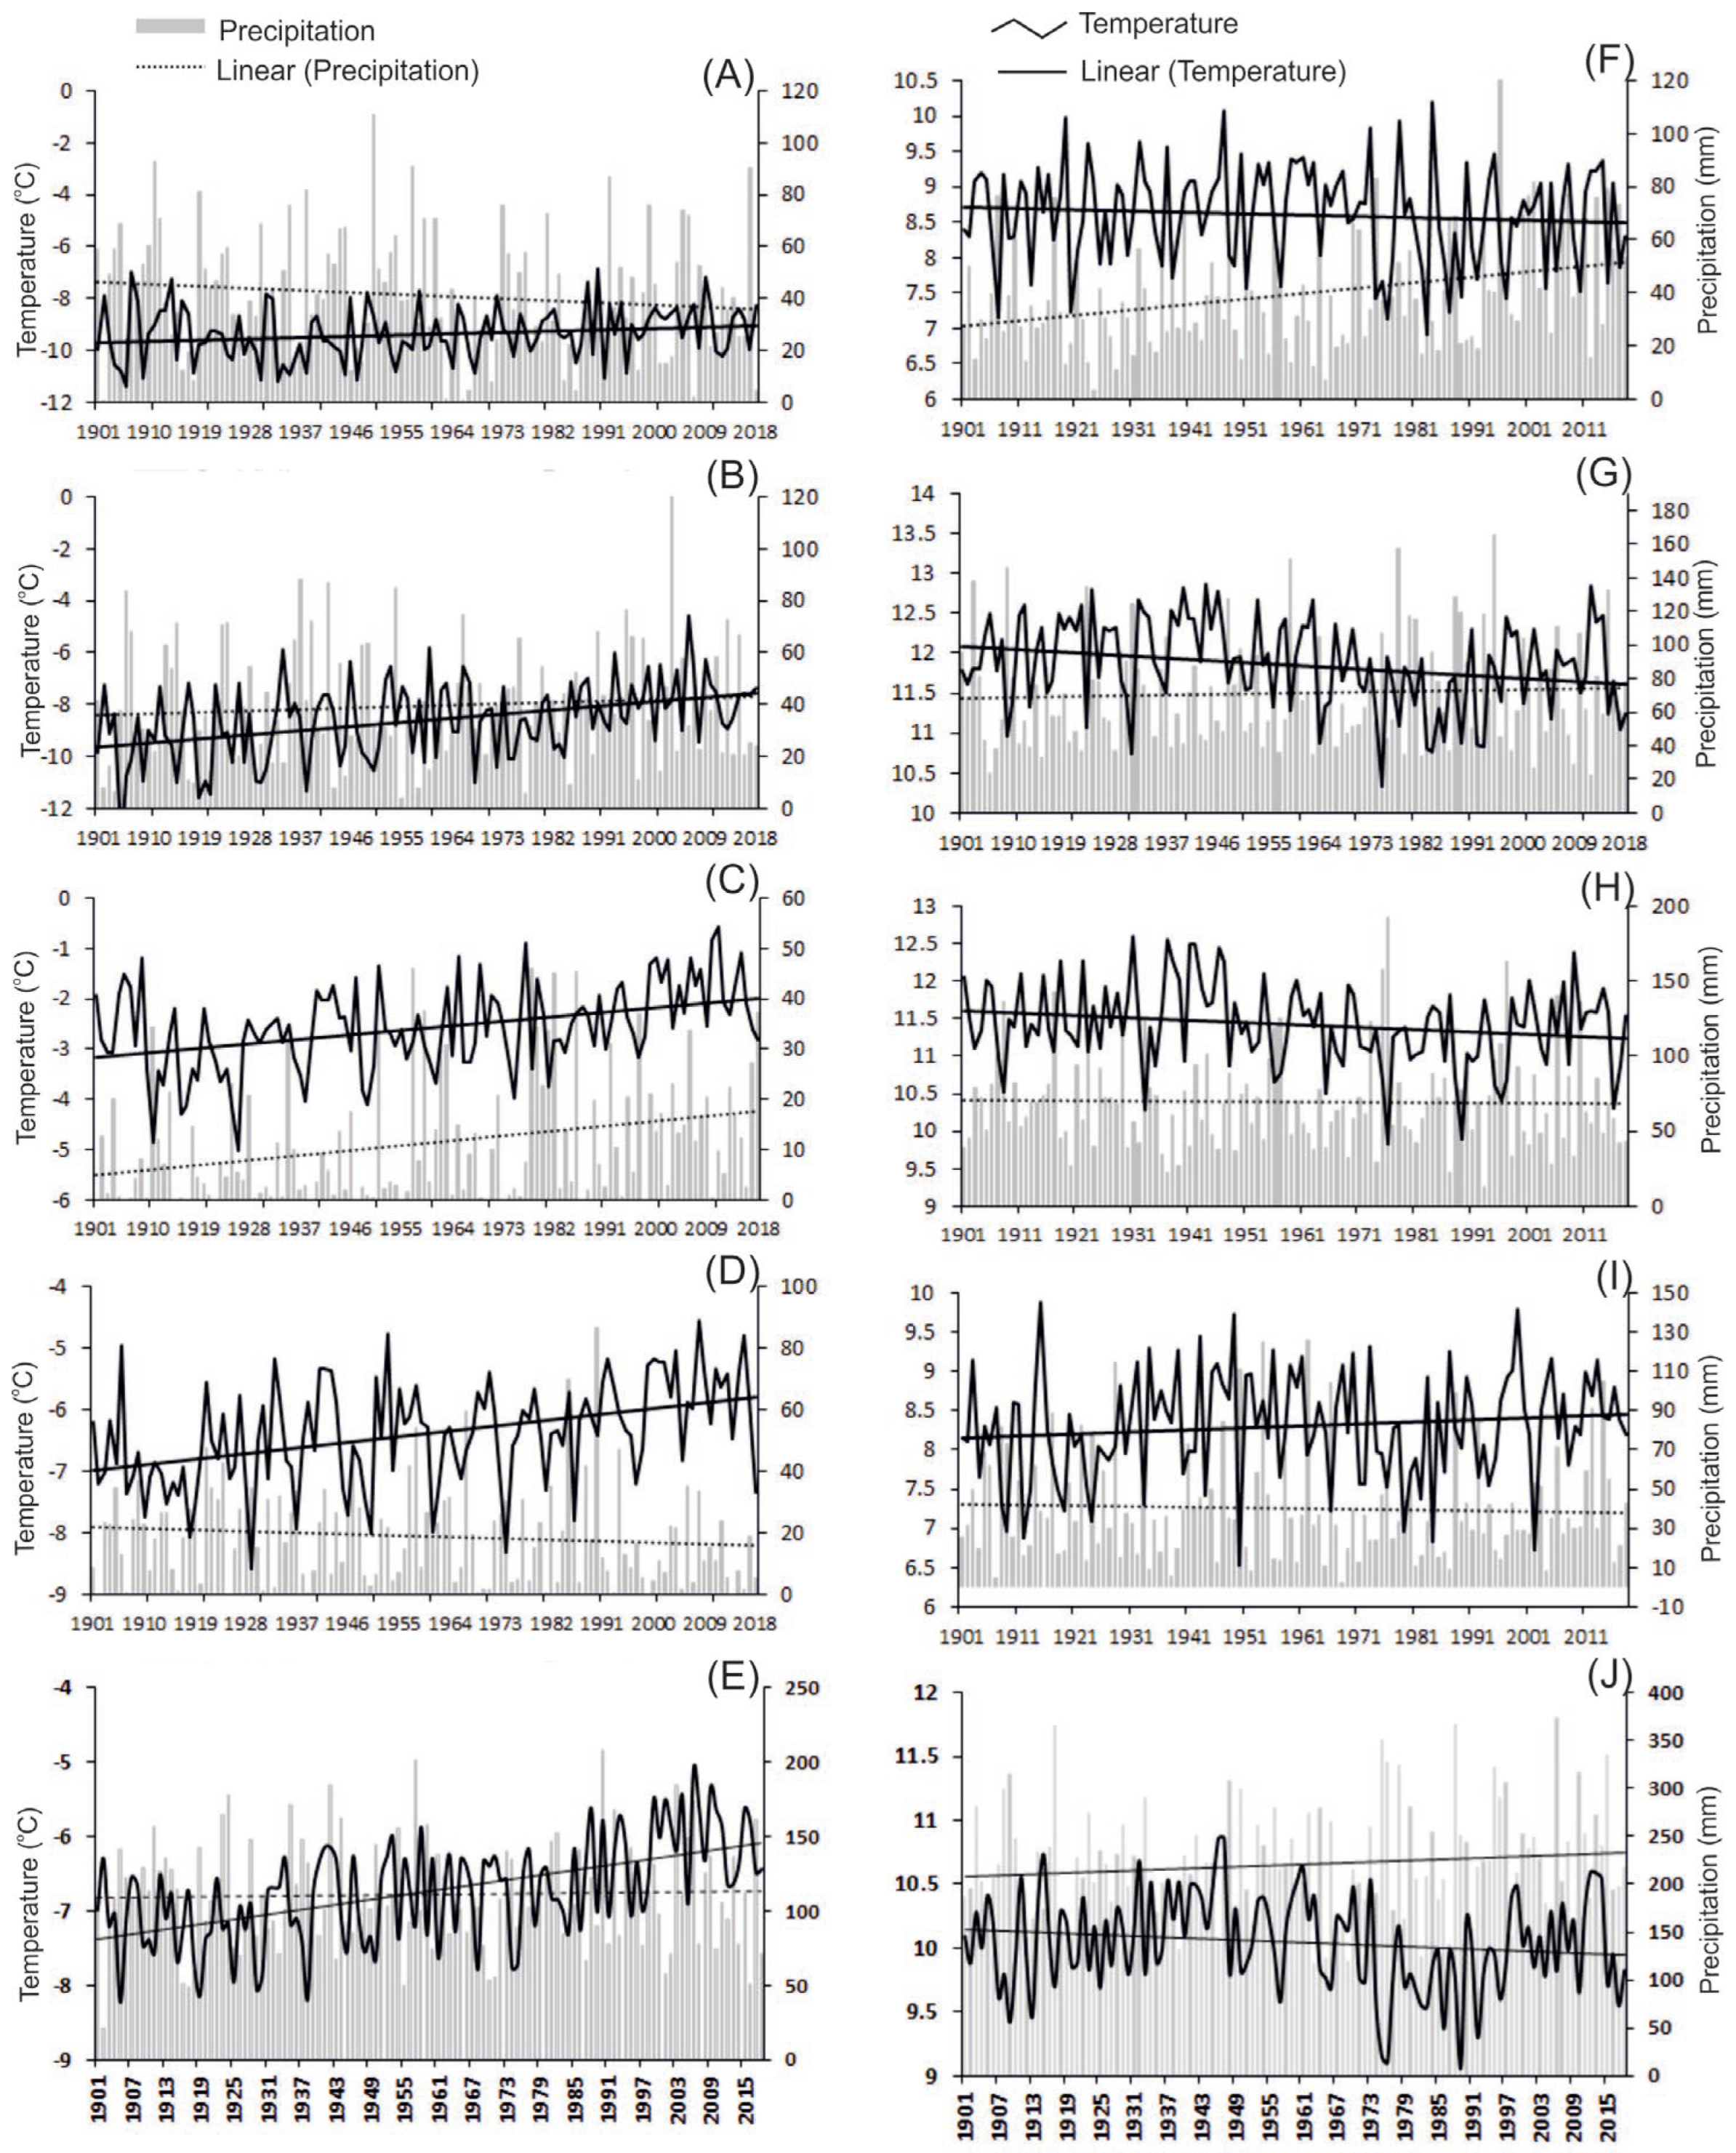
1.2. Climate of the Study Area
2. Datasets and Methods
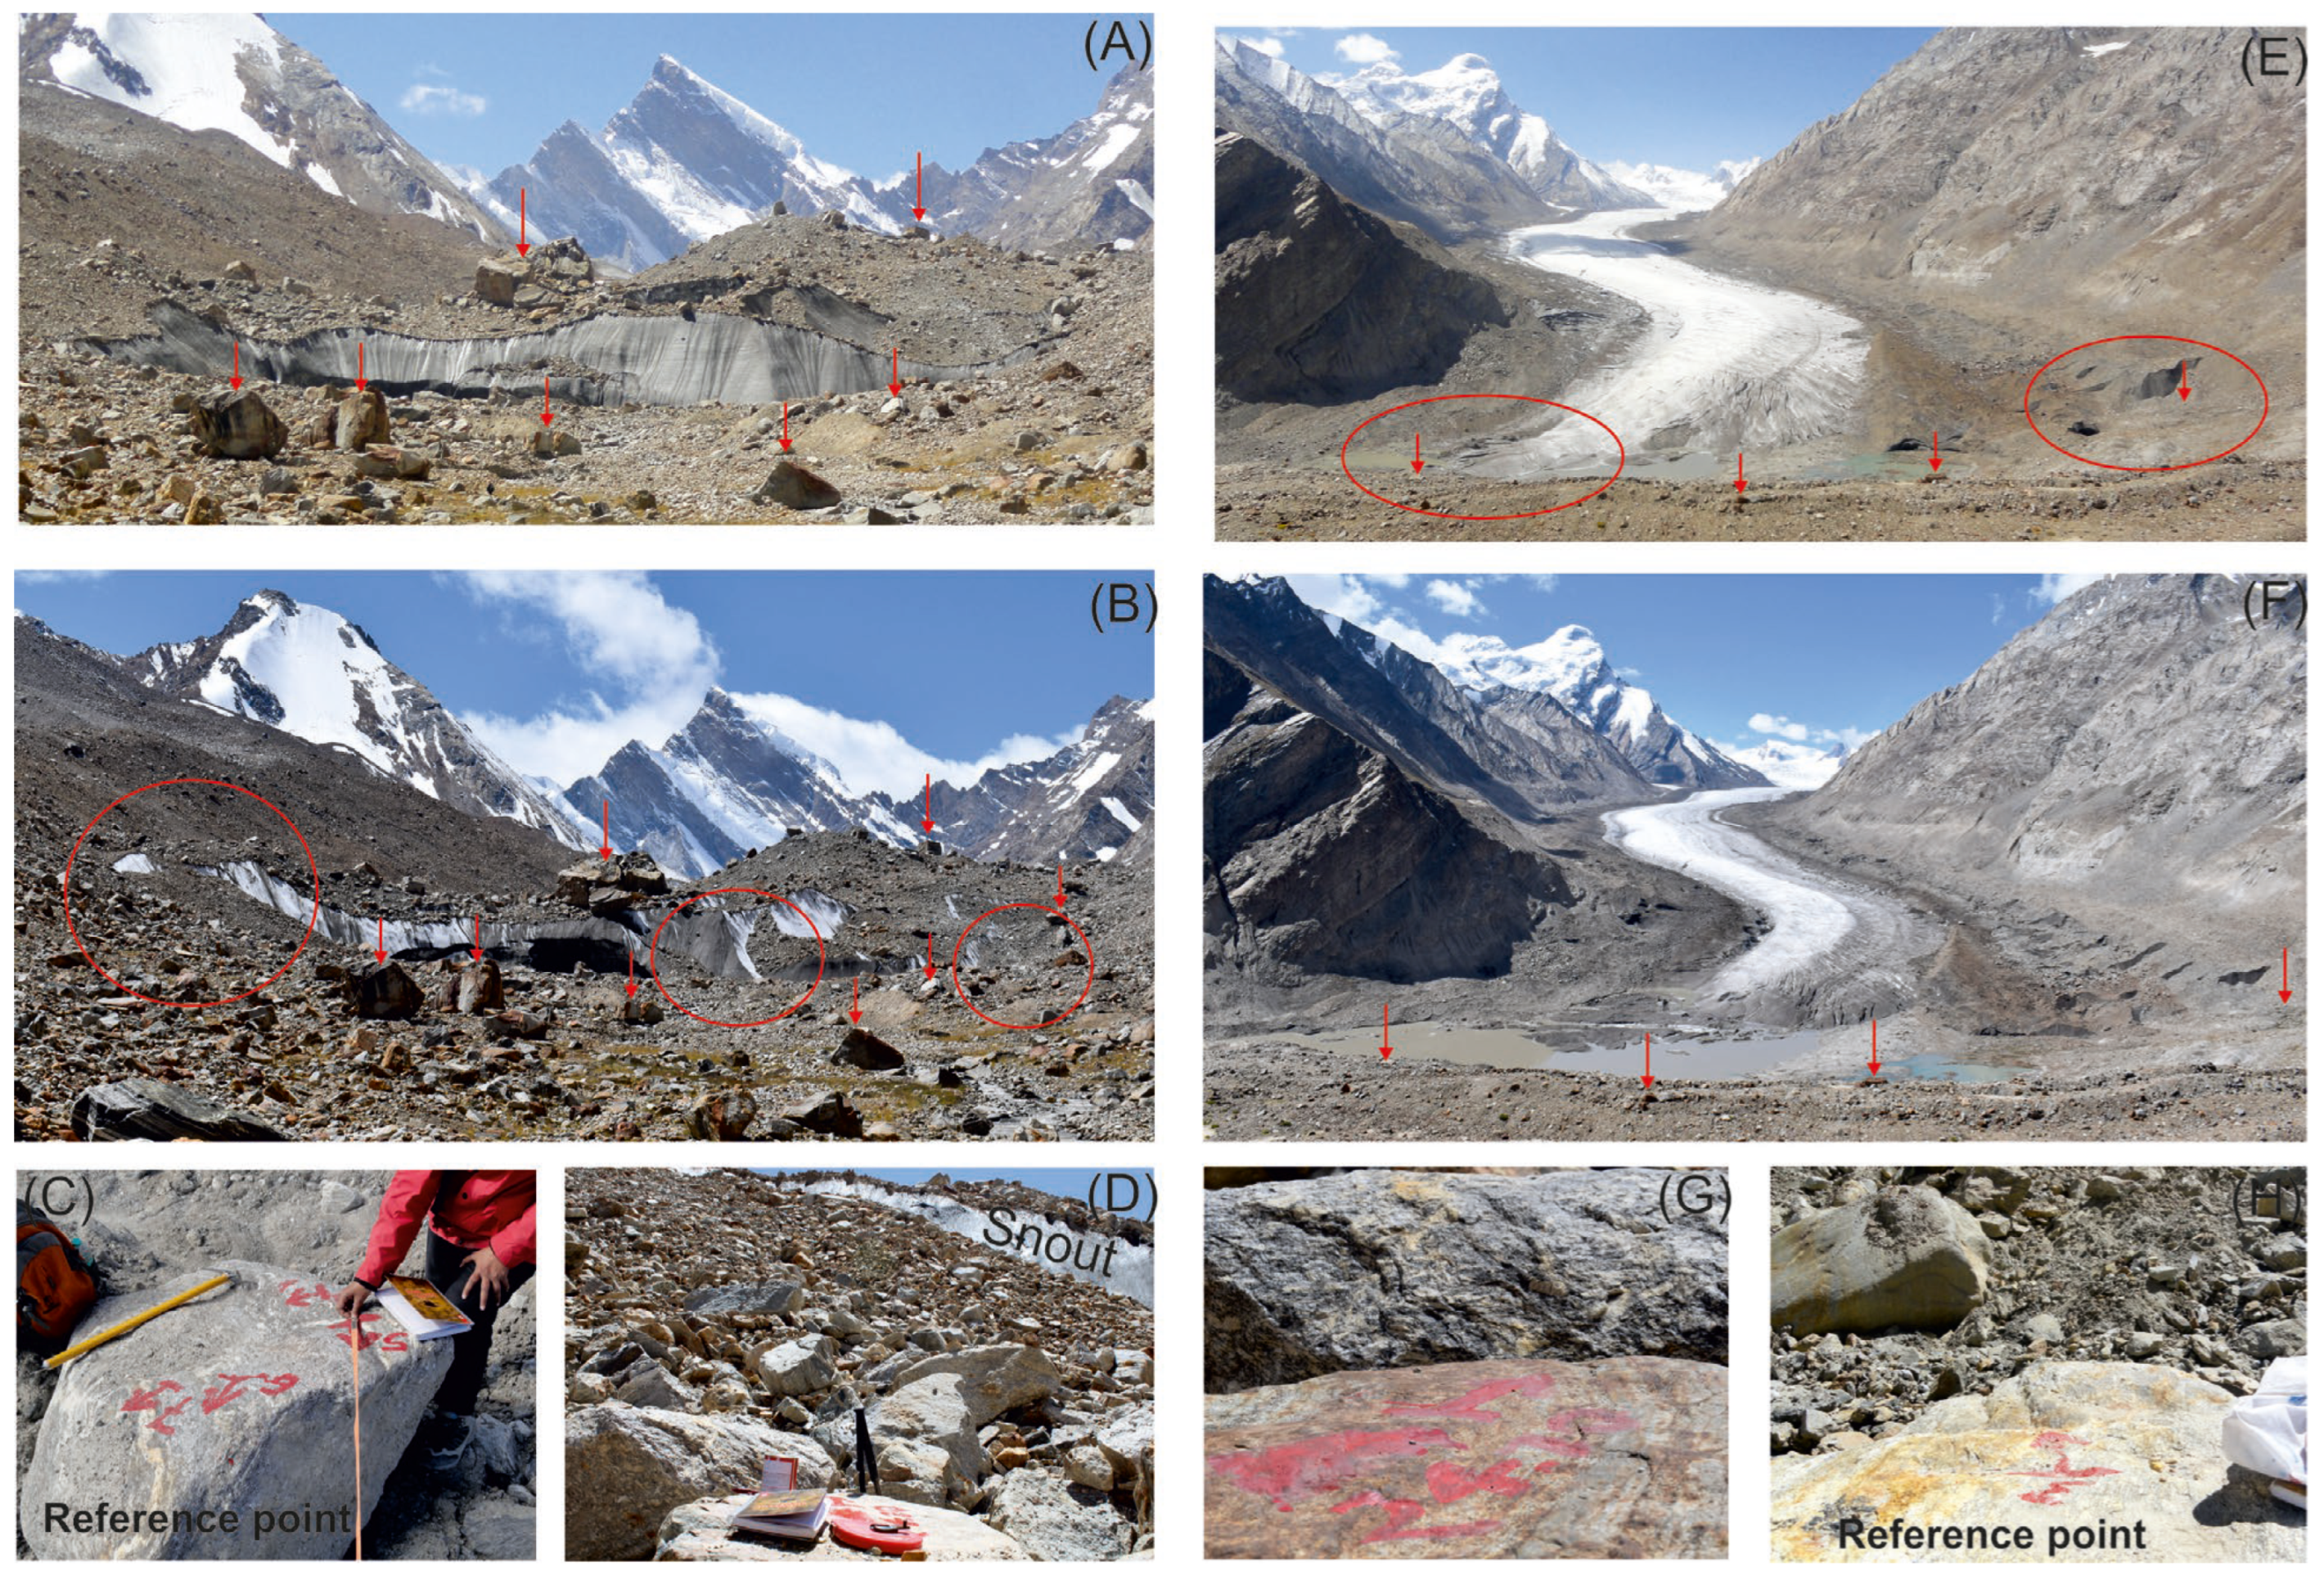
2.1. Field Survey
2.2. Estimation of Equilibrium Line Altitude (ELA)
2.3. Glacier Volume Estimation
2.4. Glacier Mass Balance and Surface Elevation Change
3. Results
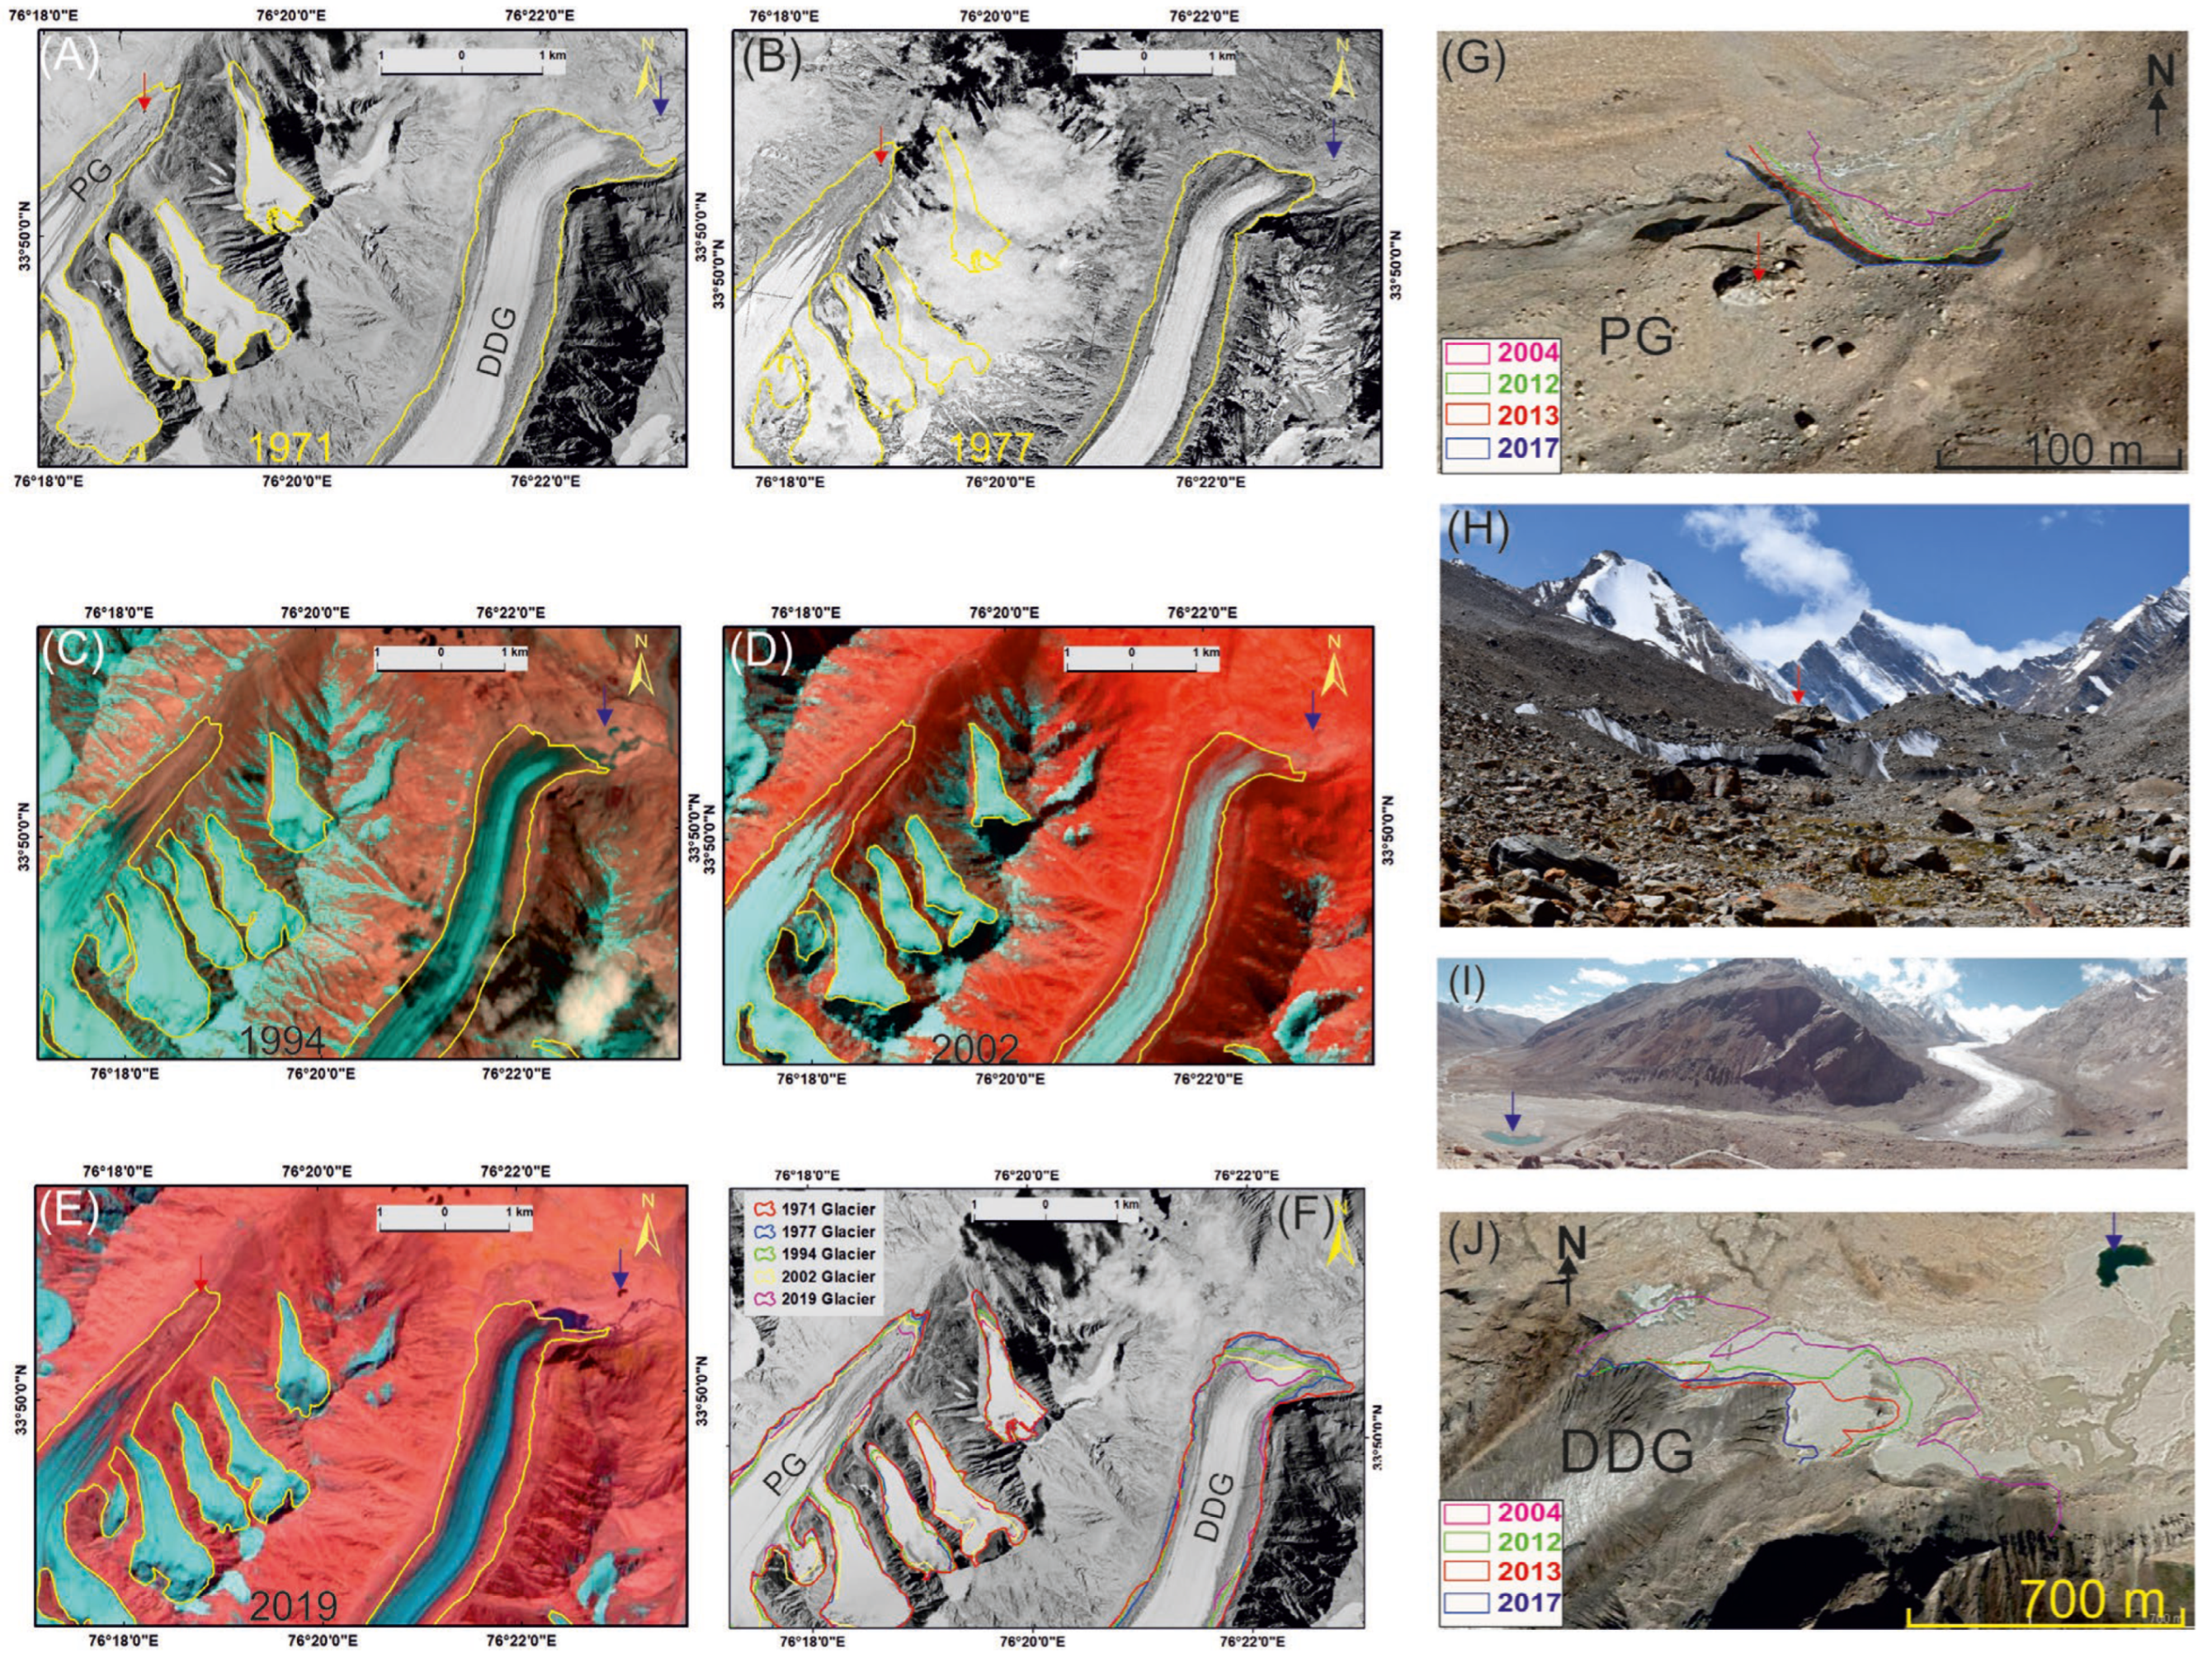
3.1. Terminus Retreat and Area Changes
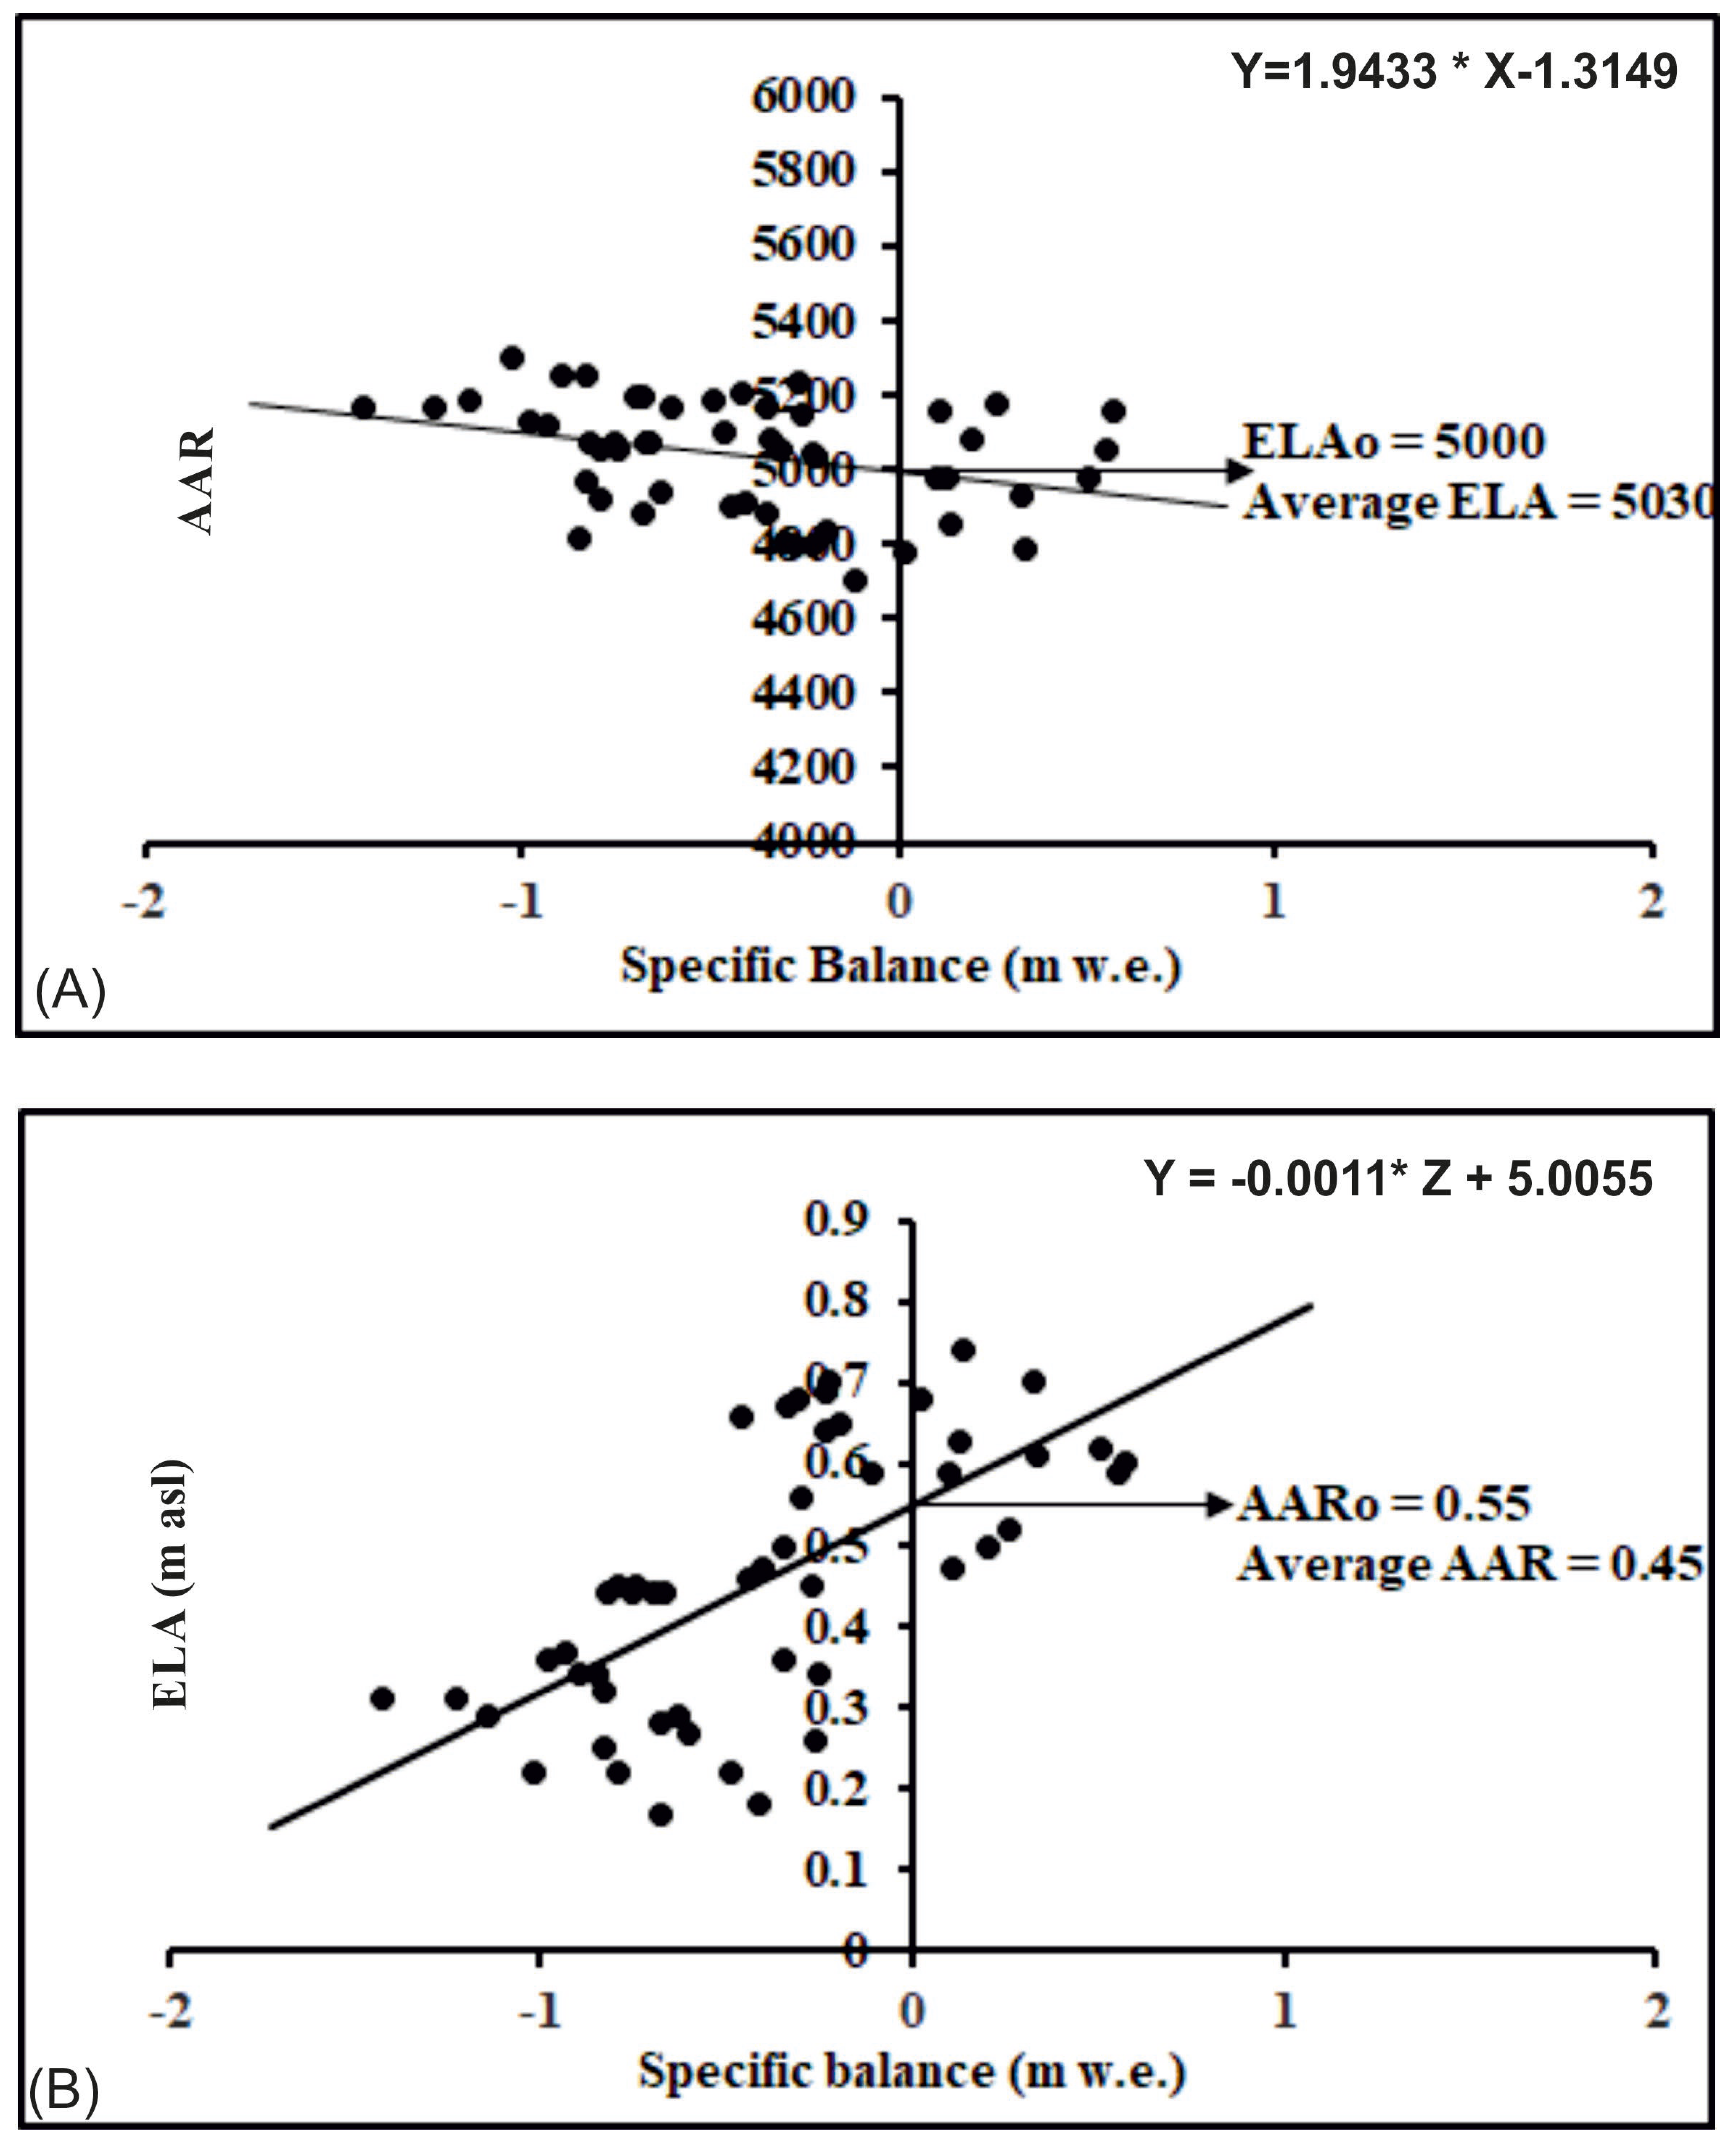
3.2. Equilibrium Line Altitude (ELA) and Accumulation Area Ratio (AAR) Changes
3.3. Volume Loss by the Glaciers
3.4. Glacier Mass Balance and Thickness Change
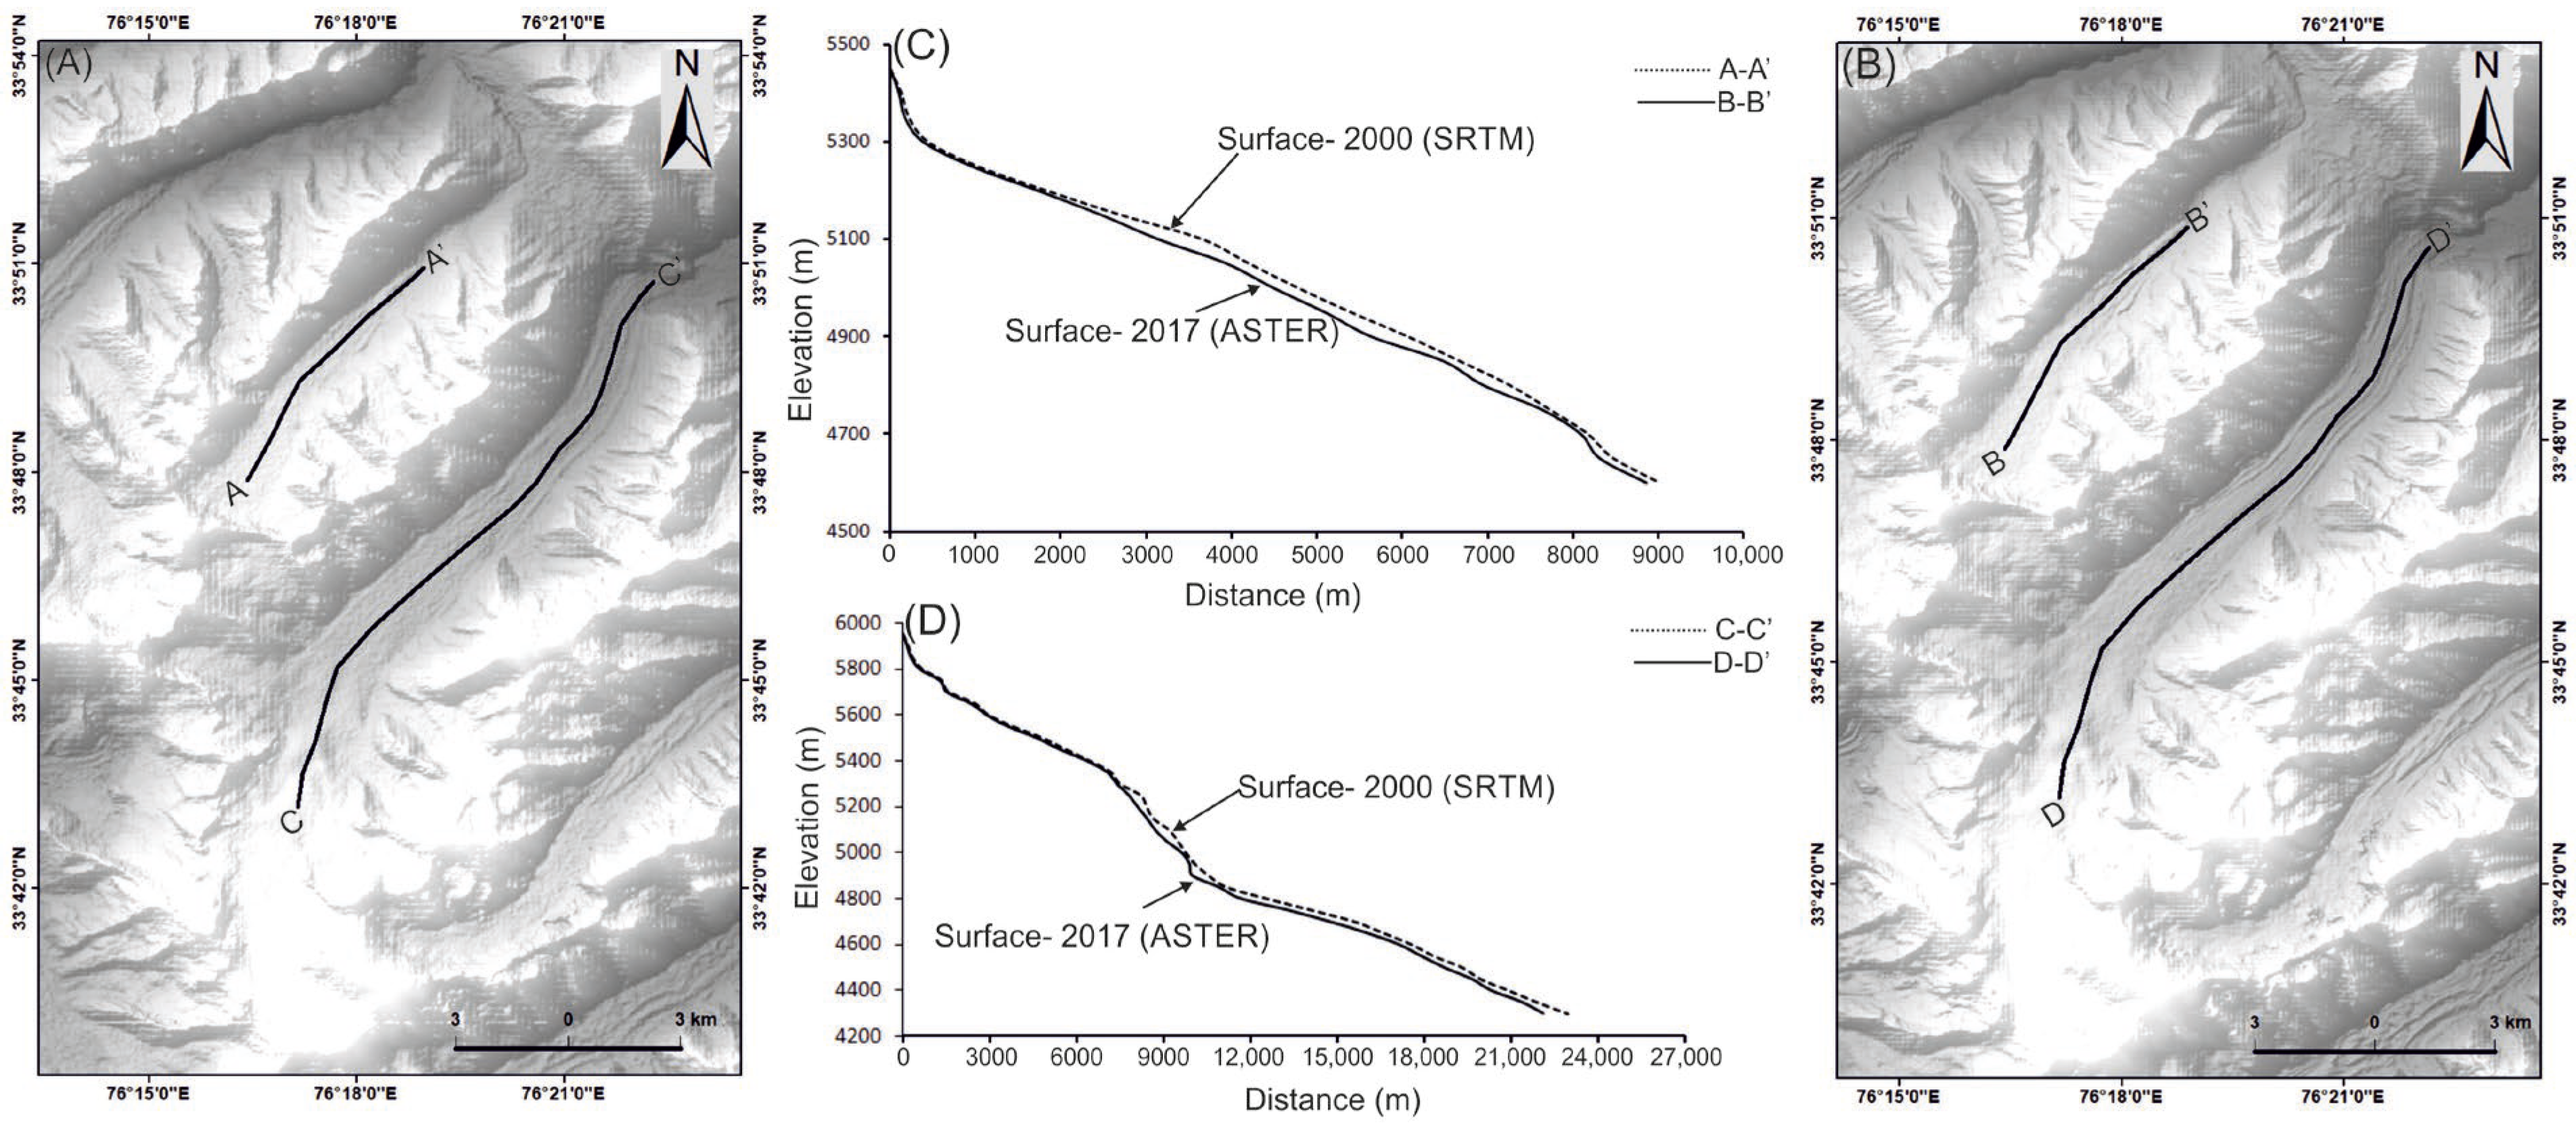
3.5. Longitudinal Profiles and Elevation Change
4. Discussion
5. Conclusions
Author Contributions
Funding
Institutional Review Board Statement
Informed Consent Statement
Data Availability Statement
Acknowledgments
Conflicts of Interest
References
- Shahgedanova, M.; Stokes, R.C.; Gurney, S.D.; Popovnin, V. Interactions between mass balance, atmospheric circulation, and recent climate change on the Djankuat Glacier, Caucasus Mountains, Russia. J. Geophys. Res. Atmos. 2005, 110, 1–14. [Google Scholar] [CrossRef]
- Paterson, W.S.B. The Physics of Glaciers, 3rd ed.; Elsevier: New York, NY, USA, 1994; p. 480. [Google Scholar]
- Kumar, V.; Shukla, T.; Mishra, A.; Kumar, A.; Mehta, M. Chronology and climate sensitivity of the Post LGM glaciation in the Dunagiri valley, Dhauliganga basin, Central Himalaya, India. Boreas 2020, 49, 594–614. [Google Scholar] [CrossRef]
- Vinit, K.; Shukla, T.; Mehta, M.; Dobhal, D.P.; Bisht, M.P.S.; Nautiyal, S. Glacier changes and associated climate drivers for the last three decades, Nanda Devi region, Central Himalaya, India. Quat. Int. 2021, 575, 213–226. [Google Scholar]
- Mehta, M.; Kumar, V.; Garg, S.; Shukla, A. Little ice age glacier extent and temporal changes in annual mass balance (2016–2019) of Pensilungpa Glacier, Zanskar Himalaya. Reg. Environ. Chang. 2021, 21, 38. [Google Scholar] [CrossRef]
- Raina, V.K.; Srivastava, D. Glacier Atlas of India; Geological Society of India: Bangalore, India, 2008; p. 316. [Google Scholar]
- Mayewski, P.A.; Jeschke, P.A. Himalayan and trans-Himalayan glacier fluctuations since A.D 1812. Arct. Antarct. Alp. Res. 1979, 11, 267–287. [Google Scholar] [CrossRef]
- Sakai, A.; Takeuchi, N.; Fujita, K.; Nakawo, M. Role of Supraglacial Ponds in the Ablation Process of a Debris Covered Glacier in the Nepal Himalayas. Iahs Publ. 2000, 265, 119–130. [Google Scholar]
- Casey, K.; Kääb, A.; Benn, D. Geochemical characterization of supraglacial debris via in situ and optical remote sensing methods: A case study in Khumbu Himalaya, Nepal. Cryosphere 2012, 6, 85–100. [Google Scholar] [CrossRef] [Green Version]
- Dobhal, D.P.; Mehta, M.; Srivastava, D. Influence of debris cover on terminus retreat and mass changes of Chorabari Glacier, Garhwal region, central Himalaya, India. J. Glaciol. 2013, 59, 961–971. [Google Scholar] [CrossRef] [Green Version]
- Pratap, B.; Dobhal, D.P.; Mehta, M. Influence of debris cover and altitude on glacier surface melting: A case study on Dokriani Glacier, central Himalaya, India. Ann. Glaciol. 2015, 56, 9–16. [Google Scholar] [CrossRef] [Green Version]
- Maurer, J.M.; Schaefer, J.M.; Rupper, S.; Corley, A. Acceleration of ice loss across the Himalayas over the past 40 years. Sci. Adv. 2019, 5, 1–12. [Google Scholar] [CrossRef] [Green Version]
- Ethan, L.; Carrivick, J.L.; Quincey, D.J.; Cook, S.J.; James, W.H.M.; Brown, L.E. Accelerated mass loss of Himalayan glaciers since the Little Ice Age. Sci. Rep. 2021, 11, 1–8. [Google Scholar]
- Bozhinskiy, A.N.; Krass, M.S.; Popovnin, V.V. Role of debris cover in the thermal physics of glaciers. J. Glaciol. 1986, 32, 255–266. [Google Scholar] [CrossRef] [Green Version]
- Lundstrom, S.C.; McCafferty, A.E.; Coe, J.A. Photogrammetric analysis of 1984–89 surface altitude changes of the partially debris-covered Eliot Glacier, Mount Hood, Oregon, USA. Ann. Glaciol. 1993, 17, 167–170. [Google Scholar] [CrossRef] [Green Version]
- Bolch, T.; Buchroithner, M.; Pieczonka, T.; Kunert, A. Planimetric and volumetric glacier changes in the Khumbu Himalaya, Nepal, since 1962 using Corona, Landsat TM, and ASTER data. J. Glaciol. 2008, 54, 592–600. [Google Scholar] [CrossRef] [Green Version]
- Schmidt, S.; Nüsser, M. Changes of high-altitude glaciers from 1969 to 2010 in the Trans-Himalayan Kang Yatze massif, Ladakh, Northwest India. Arct. Antarct. Alp. Res. 2012, 44, 107–121. [Google Scholar] [CrossRef]
- Kumar, V.; Mehta, M.; Mishra, A.; Trivedi, A. Temporal fluctuations and frontal area change of Bangni and Dunagiri glaciers from 1962 to 2013, Dhauliganga Basin, central Himalaya, India. Geomorphology 2017, 284, 88–98. [Google Scholar] [CrossRef]
- Mal, S.; Mehta, M.; Singh, R.B.; Schickhoff, U.; Bisht, M.P.S. Recession and morphological changes of the debris-covered Milam Glacier in Gori Ganga Valley Central Himalaya India derived from satellite data. Front. Environ. Sci. 2019, 7, 42. [Google Scholar] [CrossRef] [Green Version]
- Shukla, A.; Garg, S.; Mehta, M.; Kumar, V.; Shukla, U.K. Temporal inventory of glaciers in the Suru sub-basin, western Himalaya: Impacts of the regional climate variability. Earth Syst. Sci. Data 2020, 12, 1245–1265. [Google Scholar] [CrossRef]
- Scherler, D.; Bookhagen, B.; Strecker, M.R. Spatially Variable Response of Himalayan Glaciers to Climate Change Affected by Debris Cover. Nat. Geosci. 2011, 4, 156–159. [Google Scholar] [CrossRef]
- Rowan, A.V.; Egholm, D.L.; Quincey, D.J.; Hubbard, B.; King, O.; Miles, E.S.; Miles, K.E.; Hornsey, J. The role of differential ablation and dynamic detachment in driving accelerating mass loss from a debris-covered Himalayan glacier. J. Geophys. Res. Earth Surf. 2021, 126, 1–20. [Google Scholar] [CrossRef]
- Shukla, A.; Gupta, R.P.; Arora, M.K. Estimation of debris cover and its temporal variation using optical satellite sensor data: A case study in Chenab basin, Himalaya. J. Glaciol. 2009, 55, 444–452. [Google Scholar] [CrossRef] [Green Version]
- Kamp, U.; Byrne, M.; Bolch, T. Mapping glacier fluctuations between 1975 and 2008 in the Greater Himalaya Range of Ladakh, north-western India. J. Mt. Sci. 2011, 8, 374–389. [Google Scholar] [CrossRef]
- Yao, T.; Thompson, L.; Yang, W.; Yu, W.; Gao, Y.; Guo, X.; Yang, X.; Duan, K.; Zhao, H.; Xu, B.; et al. Different glacier status with atmospheric circulations in Tibetan Plateau and surroundings. Nat. Clim. Chang. 2012, 2, 663. [Google Scholar] [CrossRef]
- Brun, F.; Berthier, E.; Wagnon, P.; Kääb, A.; Treichler, D. A spatially resolved estimate of high mountain Asia glacier mass balance from 2000 to 2016. Nat. Geosci. 2017, 10, 468–474. [Google Scholar] [CrossRef] [PubMed] [Green Version]
- Bhushan, S.; Syed, T.H.; Arendt, A.A.; Kulkarni, A.V.; Sinha, D. Assessing controls on mass budget and surface velocity variations of glaciers in Western Himalaya. Sci. Rep. 2018, 8, 8885. [Google Scholar] [CrossRef] [Green Version]
- Garg, P.K.; Garg, S.; Yousuf, B.; Shukla, A.; Kumar, V.; Mehta, M. Stagnation of the Pensilungpa glacier, western Himalaya, India: Causes and implications. J. Glaciol. 2022, 68, 221–235. [Google Scholar] [CrossRef]
- Sangewar, C.V.; Shukla, S.P. Inventory of the Himalayan Glaciers: A Contribution to the International Hydrological Programme, An Updated Edition, Kolkata. Geol. Surv. India Spec. Publ. 2009, 34, 0254–0436. [Google Scholar]
- Kumar, V.; Mehta, M.; Shukla, A.; Kumar, A.; Garg, S. Late Quaternary glacial advances and equilibrium-line altitude changes in a semi-arid region, Suru Basin, western Himalaya. Quat. Sci. Rev. 2021, 267, 107100. [Google Scholar] [CrossRef]
- Harris, I.; Osborn, T.J.; Jones, P.; Lister, D. Version 4 of the CRU TS monthly high-resolution gridded multivariate climate dataset. Sci. Data 2020, 7, 1–18. [Google Scholar] [CrossRef] [Green Version]
- Bhambri, R.; Bolch, T.; Chaujar, R.K. Frontal recession of Gangotri Glacier, Garhwal Himalayas, from 1965 to 2006, measured through high-resolution remote sensing data. Curr. Sci. 2012, 102, 489–494. [Google Scholar]
- Shukla, A.; Garg, P.K. Evolution of a debris-covered glacier in the western Himalaya during the last four decades (1971–2016): A multiparametric assessment using remote sensing and field observations. Geomorphology 2019, 341, 1–14. [Google Scholar] [CrossRef]
- Shukla, A.; Garg, S.; Kumar, V.; Mehta, M.; Shukla, U.K. Sensitivity of glaciers in Part of the Suru River valley, Western Himalaya to ongoing climatic perturbations. In Himalayan Weather and Climate and Their Impact on the Environment; Springer International Publishing: New York, NY, USA, 2020; pp. 351–377. [Google Scholar]
- Garg, S.; Shukla, A.; Mehta, M.; Kumar, V.; Samuel, S.A.; Bartarya, S.K.; Shukla, U.K. Field evidence showing rapid frontal degeneration of the Kangriz glacier, western Himalayas, Jammu & Kashmir. J. Mt. Sci. 2018, 15, 1199–1208. [Google Scholar]
- Garg, S.; Shukla, A.; Mehta, M.; Kumar, V.; Shukla, U.K. On geomorphic manifestations and glaciation history of the Kangriz glacier, western Himalaya. Himal. Geol. 2019, 40, 115–127. [Google Scholar]
- Azam, M.F.; Wagnon, P.; Vincent, C. Reconstruction of the annual mass balance of Chhota Shigri glacier, Western Himalaya, India, since 1969. Ann. Glaciol. 2014, 55, 69–80. [Google Scholar] [CrossRef] [Green Version]
- Dobhal, D.P.; Pratap, B.; Bhambri, R.; Mehta, M. Mass balance and morphological changes of Dokriani Glacier (1992–2013), Garhwal Himalaya, India. Quat. Sci. Adv. 2021, 4, 100033. [Google Scholar] [CrossRef]
- Meier, M.F.; Post, A.S. Recent variations in mass net budgets of glacier in western North America. In Symposium of Obergurgl, Tyrol, Austria, 10 September 1962; International Association of Scientific Hydrology: Wallingford, UK, 1962; Volume 58, pp. 63–77. [Google Scholar]
- Benn, D.I.; Owen, L.A.; Osmaston, H.A.; Seltzer, G.O.; Porter, C.S.; Mark, B. Reconstruction of equilibrium-line altitudes for tropical and sub-tropical glaciers. Quat. Int. 2005, 138–139, 8–21. [Google Scholar] [CrossRef]
- Mehta, M.; Dobhal, D.P.; Bhanu, P.; Majeed, Z.; Gupta, A.K.; Srivastava, P. Late Quaternary glacial advances in the Tons River Valley, Garhwal Himalaya, India and regional synchronicity. Holocene 2014, 24, 1336–1350. [Google Scholar] [CrossRef]
- Shukla, T.; Mehta, M.; Jaiswal, M.K.; Srivastava, P.; Dobhal, D.P.; Nainwal, H.C.; Singh, A.K. Late Quaternary glaciation history of monsoon-dominated Dingad basin, central Himalaya, India. Quat. Sci. Rev. 2018, 181, 43–64. [Google Scholar] [CrossRef]
- Meierding, T.C. Late Pleistocene glacial equilibrium line altitudes in the Colorado Front Range: A comparison of methods. Quat. Res. 1982, 18, 289–310. [Google Scholar] [CrossRef]
- Osmaston, H. Estimates of glacier equilibrium line altitudes by the Area X Altitude, the Area X Altitude BalanceRatio and the Area X Altitude Balance Index methods and their validation. Quat. Int. 2005, 138–139, 22–31. [Google Scholar] [CrossRef]
- Sharma, M.C.; Owen, L.A. Quaternary glacial history of the NW Garhwal, central Himalayas, India. Quat. Sci. Rev. 1996, 15, 335–365. [Google Scholar] [CrossRef]
- Furbish, D.J.; Andrews, J.T. The use of hypsometry to indicate long-term stability and response of valley glaciers to changes in mass transfer. J. Glaciol. 1984, 30, 199–211. [Google Scholar] [CrossRef] [Green Version]
- Kaser, G.; Osmaston, H. Tropical Glaciers; Cambridge University Press: Cambridge, UK, 2002; p. 207. [Google Scholar]
- Benn, D.I.; Lehmkuhl, F. Mass balance and equilibrium-line altitudes of glaciers in high mountain environments. Quat. Int. 2000, 65–66, 15–29. [Google Scholar] [CrossRef]
- Richards, B.W.M.; Owen, L.A.; Rhodes, E.J. Asynchronous glaciation at Naga Parbat, northwestern Himalaya Mountains, Pakestan: Comment. Geology 2001, 29, 287. [Google Scholar] [CrossRef]
- Porter, S.C. Snowline depression in the tropics during the last glaciation. Quat. Sci. Rev. 2001, 20, 1067–1091. [Google Scholar] [CrossRef]
- Liu, S.; Sun, W.; Shen, Y.; Li, G. Glacier changes since the Little Ice Age maximum in the western Qilian Shan, northwest China, and consequences of glacier runoff for water supply. J. Glaciol. 2003, 49, 117–124. [Google Scholar] [CrossRef] [Green Version]
- Cogley, J.G. Present and future states of Himalaya and Karakoram glaciers. Ann. Glaciol. 2011, 52, 69–73. [Google Scholar] [CrossRef] [Green Version]
- Frey, H.; Machguth, H.; Huss, M.; Huggel, C.; Bajracharya, S.; Bolch, T.; Stoffel, M. Estimating the volume of glaciers in the Himalayan–Karakoram region using different methods. Cryosphere 2014, 8, 2313–2333. [Google Scholar] [CrossRef] [Green Version]
- Mool, P.K.; Bajracharya, S.R.; Joshi, S.P. Inventory of Glaciers. In Glacial Lakes and Glacial Lake Outburst Floods—Nepal; ICIMOD: Kathmandu, Nepal, 2006. [Google Scholar]
- Bajracharya, S.R.; Shrestha, B.R. The Status of Glaciers in the Hindu Kush-Himalayan Region; International Centre for Integrated Mountain Development (ICIMOD): Kathmandu, Nepal, 2011. [Google Scholar]
- Chen, J.; Ohmura, A. Estimation of Alpine Glacier Water Resources and Their Change Since the 1870s; IAHS Publication: Wallingford, UK, 1990; Volume 193, pp. 127–135. [Google Scholar]
- Bahr, D.B.; Meier, M.F.; Peckham, S.D. The physical basis of glacier volume-area scaling. J. Geophys. Res. Solid Earth 1997, 102, 20355–20362. [Google Scholar] [CrossRef]
- LIGG; Water and Energy Commission Secretariat (WECS); Nepal Electricity Authority (NEA). Report on the First Expedition to Glaciers and Glacier Lakes in the Pumqu (Arun) and Poiqu (Bhote-Sun Koshi) River Basins, Xizang (Tibet), China; Science Press: Beijing, China, 1988.
- Su, Z.; Ding, L.; Liu, C.C. Glacier thickness and its reserves calculation on Tianshan Mountains. Xinjiang Geogr. 1984, 7, 37–44. [Google Scholar]
- Haeberli, W.; Hoelzle, M. Application of Inventory Data for Estimating Characteristics of and Regional Climate-Change Effects on Mountain Glaciers: A Pilot Study with the European Alps. Ann. Glaciol. 1995, 21, 834. [Google Scholar] [CrossRef] [Green Version]
- Ostrem, G. Sediment Transport in Glacial Meltwater Streams; Jopling, A.V., McDonald, B.C., Eds.; Glaciofluvial and Glaciolacustrine Sedimentation; Society of Economic Paleontologists and Mineralogists Special Publication SEPM Society for Sedimentary Geology: Broken Arrow, OK, USA, 1975; Volume 23, pp. 101–122. [Google Scholar]
- Braithwaite, R.J. Can the mass balance of a glacier be estimated from its equilibrium-line altitude? J. Glaciol. 1984, 30, 364–368. [Google Scholar] [CrossRef] [Green Version]
- Kulkarni, A.V. Mass balance of Himalayan glaciers using AAR and ELA methods. J. Glaciol. 1992, 38, 101–104. [Google Scholar] [CrossRef] [Green Version]
- Pelto, M.S. Forecasting temperate alpine glacier survival from accumulation zone observations. Cryosphere 2010, 4, 67–75. [Google Scholar] [CrossRef] [Green Version]
- Brahmbhatt, R.M.; Bahuguna, I.; Rathore, B.P. Variation of Snowline and Mass Balance of Glaciers of Warwan and Bhut Basins of Western Himalaya Using Remote Sensing Technique. J. Indian Soc. Remote Sens. 2012, 40, 629–637. [Google Scholar] [CrossRef]
- Pelto, M.; Brown, C. Mass balance loss of Mount Baker, Washington glaciers 1990–2010. Hydrol. Process. 2012, 26, 2601–2607. [Google Scholar] [CrossRef]
- Kulkarni, A.V.; Rathore, B.P.; Suja, A. Monitoring of glacial mass balance in the Baspa basin using accumulation area ratio method. Curr. Sci. 2004, 86, 101–106. [Google Scholar]
- Dyurgerov, M.; Meier, M.F.; Bahr, D.B. A new index of glacier area change: A tool for glacier monitoring. J. Glaciol. 2009, 55, 710–716. [Google Scholar] [CrossRef] [Green Version]
- Garg, S.; Shukla, A.; Garg, P.K.; Yousuf, B.; Shukla, U.K. Surface evolution and dynamics of the Kangriz glacier, western Himalaya in past 50 years. Cold Reg. Sci. Technol. 2022, 196, 103496. [Google Scholar] [CrossRef]
- Oerlemans, J.; Hoogendoorn, N.C. Mass-balance gradients and climatic change. J. Glaciol. 1989, 35, 399–405. [Google Scholar] [CrossRef] [Green Version]
- Haeberli, W. Glacier and permafrost signals of 20th-century warming. Ann. Glaciol. 1990, 14, 99–101. [Google Scholar] [CrossRef] [Green Version]
- Kraaijenbrink, P.; Meijer, S.W.; Shea, J.M.; Pellicciotti, F.; Jong, S.D.; Immerzeel, W.W. Seasonal surface velocities of a Himalayan Glacier derived by automated correlation of unmanned aerial vehicle imagery. Ann. Glaciol. 2016, 57, 103–113. [Google Scholar] [CrossRef] [Green Version]
- Harrison, W.D.; Elsberg, D.H.; Echelmeyer, K.A.; Krimmel, R.M. On the characterization of glacier response by a single timescale. J. Glaciol. 2001, 47, 659–664. [Google Scholar] [CrossRef] [Green Version]
- Jóhannesson, T.; Raymond, C.; Waddington, E. Timescale for adjustment of glaciers to changes in mass balance. J. Glaciol. 1989, 35, 355–369. [Google Scholar] [CrossRef] [Green Version]
- Bolch, T.; Kulkarni, A.; Kääb, A.; Huggel, C.; Paul, F.; Cogley, J.G.; Frey, H.; Kargel, J.S.; Fujita, K.; Scheel, M.; et al. The State and Fate of Himalayan Glaciers Science. Science 2012, 336, 310–314. [Google Scholar] [CrossRef] [Green Version]
- Kulkarni, A.V.; Bahuguna, I.M.; Rathore, B.P.; Singh, S.K.; Randhawa, S.S.; Sood, R.K.; Dhar, S. Glacial retreat in Himalaya using remote sensing satellite data. Curr. Sci. India 2007, 92, 69–74. [Google Scholar] [CrossRef]
- Mehta, M.; Dobhal, D.P.; Bisht, M.P.S. Change of Tipra Glacier in the Garhwal Himalaya, India, between 1962 and 2008. Prog. Phys. Geogr. 2011, 35, 721–738. [Google Scholar] [CrossRef]
- Tawde, S.A.; Kulkarni, A.V.; Bala, G. Estimation of glacier mass balance on a basin-scale: An approach based on satellite-derived snowlines and a temperature index model. Curr. Sci. 2016, 111, 1977–1989. [Google Scholar] [CrossRef]
- Majeed, U.; Rashid, I.; Najar, N.A.; Gul, N. Spatiotemporal dynamics and geodetic mass changes of glaciers with varying debris cover in the pangong region of Trans-Himalayan Ladakh, India between 1990 and 2019. Front. Earth Sci. 2021, 9, 748107. [Google Scholar] [CrossRef]
- Kumar, V.; Mehta, M.; Shukla, T. Spatially resolved estimates of glacial retreat and lake changes from Gepang Gath Glacier, Chandra Basin, Western Himalaya, India. J. Geol. Soc. India 2021, 97, 520–526. [Google Scholar] [CrossRef]
- Shukla, A.; Qadir, J. Differential response of glaciers with varying debris cover extent: Evidence from changing glacier parameters. Int. J. Remote Sens. 2016, 37, 2453–2479. [Google Scholar] [CrossRef]
- Rashid, I.; Majeed, U. Recent recession and potential future lake formation on Drang Drung glacier, Zanskar Himalaya, as assessed with earth observation data and glacier modelling. Environ. Earth Sci. 2018, 77, 1–13. [Google Scholar] [CrossRef]
- Azam, M.F.; Ramanathan, A.L.; Wagnon, P.; Vincent, C.; Linda, A.; Berthier, E.; Pottakkal, J.G. Meteorological conditions, seasonal and annual mass balances of Chhota Shigri Glacier, western Himalaya, India. Ann. Glaciol. 2016, 57, 328–338. [Google Scholar] [CrossRef] [Green Version]
- Sherpa, S.F.; Wagnon, P.; Brun, F.; Berthier, E.; Vincent, C.; Lejeune, Y.; Arnaud, Y.; Kayastha, R.B.; Sinisalo, A. Contrasted surface mass balances of debris-free glaciers observed between the southern and the inner parts of the Everest region (2007–2015). J. Glaciol. 2017, 63, 637–651. [Google Scholar] [CrossRef] [Green Version]
- Gardelle, J.; Berthier, E.; Arnaud, Y. Impact of resolution and radar penetration on glacier elevation changes computed from DEM differencing. J. Glaciol. 2012, 58, 419–422. [Google Scholar] [CrossRef] [Green Version]
- Kääb, A.; Berthier, E.; Nuth, C.; Gardelle, J.; Arnaud, Y. Contrasting patterns of early twenty-first-century glacier mass change in the Himalayas. Nature 2012, 488, 495–498. [Google Scholar] [CrossRef]
- Garg, S.; Shukla, A.; Garg, P.K.; Yousuf, B.; Shukla, U.K.; Lotus, S. Revisiting the 24 year (1994–2018) record of glacier mass budget in the Suru sub-basin, western Himalaya: Overall response and controlling factors. Sci. Total Environ. 2021, 800, 149533. [Google Scholar] [CrossRef]
- Kulkarni, A.V.; Rathore, B.P.; Mahajan, S.; Mathur, P. Alarming retreat of Parbati Glacier, Beas basin, Himachal Pradesh. Curr. Sci. 2005, 88, 1844–1850. [Google Scholar]
- Wagnon, P.; Linda, A.; Arnaud, Y.; Kumar, R.; Sharma, P. Four years of mass balance on Chhota Shigri Glacier, Himachal Pradesh, India, a new benchmark glacier in the western Himalaya. J. Glaciol. 2007, 53, 603–611. [Google Scholar] [CrossRef] [Green Version]
- Berthier, E.; Arnaud, Y.; Kumar, R.; Ahmad, S.; Wagnon, P.; Chevallier, P. Remote sensing estimates of glacier mass balances in the Himachal Pradesh (Western Himalaya, India). Remote Sens. Environ. 2007, 108, 327–338. [Google Scholar] [CrossRef] [Green Version]
- Dobhal, D.P.; Gergan, J.T.; Thayyen, R.J. Mass balance studies of the Dokriani Glacier from 1992 to 2000, Garhwal Himalaya, India. Bull Glaciol. Res. 2008, 25, 9–17. [Google Scholar]
- Raina, V.K.; Kaul, M.K.; Singh, S. Mass—Balance studies of Gara glacier. J. Glaciol. 1977, 18, 415–423. [Google Scholar] [CrossRef] [Green Version]
- Srivastava, D.; Sangewar, C.V.; Kaul, M.K.; Jamwal, K.S. Mass balance of Rulung glacier—A Trans-Himalayan glacier, Indus basin, Ladakh. Geol. Surv. India Spec. Publ. 2001, 53, 41–46. [Google Scholar]
- Sangewar, C.V.; Siddique, N.S. Thematic compilation of mass balance data on glaciers in Satluj catchment in Himachal Himalaya. Geol. Surv. India Rep. 2006, 141, 159–161. [Google Scholar]
- Dobhal, D.P.; Kumar, S.; Mundepi, A.K. Morphology and glacier dynamics studies in monsoon–arid transition zone: An example from Chhota Shigri glacier, Himachal Himalaya, India. Curr. Sci. 1995, 68, 936–944. [Google Scholar]
- Azam, M.F.; Wagnon, P.; Ramanathan, A.; Vincent, C.; Sharma, P.; Arnaud, Y.; Linda, A.; Pottakkal, J.G.; Chevallier, P.; Singh, V.B.; et al. From balance to imbalance: A shift 15 in the dynamic behavior of Chhota Shigri Glacier (Western Himalaya, India). J. Glaciol. 2012, 58, 315–324. [Google Scholar] [CrossRef] [Green Version]
- Swaroop, S.; Gautam, C.K. Glaciological studies on Dunagiri Glacier, Chamoli district, Uttar Pradesh. Geol. Surv. India Rec. 1990, 24, 186–190. [Google Scholar]
- Srivastava, D.; Swaroop, S.; Mukerji, S.; Gautam, C.K.; Roy, D. Suspended sediment yield and its variation in Dunagiri Glacier melt stream, Garhwal Himalaya. In Proceedings of the Symposium on Snow, Ice, and Glaciers—A Himalayan Perspective, Lucknow, India, 9–11 March 1999; p. 45. [Google Scholar]
- Koul, M.N.; Ganjoo, R.K. Impact of inter and intra-annual variation in weather parameters on mass balance and equilibrium line altitude of Naradu Glacier (Himachal Pradesh), NW Himalaya, India. Clim. Chang. 2010, 99, 119–139. [Google Scholar] [CrossRef]
- Aizen, V.B.; Aizen, E.M.; Nikitin, S.A. Glacier regime on the northern slope of the Himalaya (Xixibangma glaciers). Quat. Int. 2002, 97, 27–39. [Google Scholar] [CrossRef]
- Ostrem, G. Ice melting under a Thin Layer of Moraine, and the existence of ice cores in Moraine Ridges. Georg. Ann. 1959, 41, 228–230. [Google Scholar] [CrossRef]
- Li, J.; Su, Z. Glacier in Hengduan; Mountains Science Press: Beijing, China, 1996. [Google Scholar]
- Nicholson, L.; Benn, D.I. Calculating ice melt beneath a debris layer using meteorological data. J. Glaciol. 2006, 52, 463–470. [Google Scholar] [CrossRef] [Green Version]
- Quincey, D.J.; Copland, L.; Mayer, C.; Bishop, M.; Luckman, A.; Belò, M. Ice velocity and climate variations for Baltoro Glacier, Pakistan. J. Glaciol. 2009, 55, 1061–1071. [Google Scholar] [CrossRef] [Green Version]
- Brun, F.; Wagnon, P.; Berthier, E.; Shea, J.M.; Immerzeel, W.W.; Kraaijenbrink, P.D.; Arnaud, Y. Ice cliff contribution to the tongue-wide ablation of Changri Nup Glacier, Nepal, central Himalaya. Cryosphere 2018, 12, 3439–3457. [Google Scholar] [CrossRef] [Green Version]


| Sl. No. | Satellite Sensor | Date of Acquisition | Remarks on Quality | Spatial Resolution (m) | Scene/Product ID | Purpose | Source |
|---|---|---|---|---|---|---|---|
| 1. | Corona KH-4B | 28-09-1971 | Cloud-free | 5 | DS1115-2282DA056/DS1115-2282DA057 | Delineation of glacier boundary (DGB) | USGS |
| 2. | Hexagon KH-9 | 06-10-1977 | Partially cloud covered | 7 | DZB1213-500234L001001 | DGB | USGS |
| 3. | Landsat TM | 27-08-1994 | Partially cloud covered | 30 | LT51480361994239ISP00 | DGB | USGS |
| 4. | Landsat ETM+ | 04-09-2002 | Cloud free | 30 | LE71480362000248SGS00 | DGB | USGS |
| 5. | Sentinel MSI | 20-09-2017 & 15-09-2019 | Cloud free | 10 | S2A_MSIL1C_20170920T053641_N0205_R005_ T43SET_20170920T053854 LC81480362019228LGN00 | DGB | USGS |
| 6 | Field data; GPS, DGPS measurements, stake measurements, and photographs | 2015 to 2019 | NA | Point data | NA | NA | Ground based |
| Method | Equations | References | Remarks |
|---|---|---|---|
| Area Accumulation Ratio (AAR) | [39,40,41,42,50] | Here we used AARs of 0.45 (debris cover glaciers), 0.65 (less debris cover/clean glaciers) and 0.55 (all Himalayan glaciers) for estimate the present and past ELAs of the glaciers. | |
| Terminus to Head Altitude Ratio (THAR) | [40,42,43,44,47] | The mass balance of north and north-western glaciers suggested that the THAR value of north-western Himalayan glaciers ranged between 0.5 and 0.6. Here we used these value for ELA Estimation. | |
| Area Altitude Balance Ratio (AABR) | Spreadsheet | [40,42,47,48] | We used an Excel spreadsheet for the calculation the ELAs for the study glaciers using the method of AABR given by Osmaston (2005). |
| Maximum Elevation of Lateral Moraine (MELM) | ---------------- | [41,42,45,49,50] | The Maximum altitude of Lateral moraines provide a secure means of determining the minimum altitude of former glacier ELAs. |
| Factor c | Exponent β | Remark |
|---|---|---|
| 0.1910 | 0.375 | 144 glaciers |
| 0.2055 | 0.360 | 61 glaciers |
| 0.8433 | 0.300 | a = −11.32 m in expression, H = a + cSβ |
| 0.2800 | 0.375 | Western Chugach Mountains, southern Alaska |
| 0.2100 | 0.350 | Southern British Columbia, Canada |
| Glacier Name | Periods | Years | Total Retreat (−)/Advance (+) (m) | Rate (m a−1) |
|---|---|---|---|---|
| Durung Drung | 1971–1977 | 6 | (−) 37 ± 20 | (−) 6 ± 3 |
| 1977–1994 | 17 | (−)220 ± 200 | (+)13 ± 12 | |
| 1994–2002 | 8 | (−) 118 ± 107 | (−) 15 ± 13 | |
| 2002–2019 | 17 | (−) 249 ± 220 | (−) 115 ± 13 | |
| Total | - | 48 | (−) 624 ± 547 | (−) 13 ± 11 |
| Pensilungpa | 1971–1977 | 6 | (−) 27 ± 2 | (−) 4.5 ± 0.3 |
| 1977–1994 | 17 | (−) 94.5 ± 10 | (+)5.5 ± 0.6 | |
| 1994–2002 | 8 | (−) 45 ± 4 | (−) 5.6 ± 0.5 | |
| 2002–2019 | 17 | (−) 104 ± 11 | (−) 6 ± 0.6 | |
| Total | - | 48 | (−) 270.5 ± 27 | (−) 5.6 ± 0.56 |
| Glacier Name | Year | AAR (0.45, 0.55, 0.65) | THAR (0.5, 0.6) | AABR | MELM | Average | AAR |
|---|---|---|---|---|---|---|---|
| Durung Drung | 1971 | 5145 | 5212 | 5119 | 5220 | 5192 ± 29 | 0.54 |
| 2002 | 5176 | 5217 | 5223 | 5260 | 5219 ± 30 | 0.49 | |
| 2019 | 5204 | 5228 | 5233 | 5340 | 5251 ± 52 | 0.46 | |
| ΔELA = 59 ± 38 | |||||||
| Pensilungpa | 1971 | 5164 | 5203 | 5228 | 5200 | 5198 ± 23 | 0.51 |
| 2002 | 5169 | 5211 | 5229 | 5250 | 5214 ± 30 | 0.46 | |
| 2019 | 5173 | 5218 | 5239 | 5255 | 5221 ± 31 | 0.43 | |
| ΔELA = 23 ± 19 | |||||||
| Glacier Name | Years | Area (m2) | (m3) | V = c Aγ (m3) | Average (m3) | SD | ||||
|---|---|---|---|---|---|---|---|---|---|---|
| c = 0.1910 γ = 1.375 | c = 0.2055 γ = 1.36 | c = 0.8433 γ = 1.3 | c = 0.2800 γ = 1.375 | c = 0.2100 γ = 1.35 | ||||||
| Durung Drung | 1971 | 82.2 × 10⁶ | 1.1 × 10¹⁰ | 1.45 × 10¹⁰ | 1.19 × 10¹⁰ | 1.64 × 10¹⁰ | 2.14 × 10¹⁰ | 1.02 × 10¹⁰ | 1.42 × 10¹⁰ | 0.38 × 10¹⁰ |
| 2019 | 75 × 106 | 0.9 × 10¹⁰ | 1.29 × 10¹⁰ | 1.05 × 10¹⁰ | 1.45 × 10¹⁰ | 1.87 × 10¹⁰ | 0.89 × 10¹⁰ | 1.25 × 10¹⁰ | 0.34 × 10¹⁰ | |
| Total Loss | - | 7.5 × 10⁶ | 0.15 × 10¹⁰ | 0.18 × 10¹⁰ | 0.15 × 10¹⁰ | 0.19 × 10¹⁰ | 0.26 × 10¹⁰ | 0.12 × 10¹⁰ | 0.18 × 10¹⁰ | 0.05 × 10¹⁰ |
| Pensilungpa | 1971 | 16.2 × 10⁶ | 0.18 × 10¹⁰ | 0.16 × 10¹⁰ | 0.13 × 10¹⁰ | 0.2 × 10¹⁰ | 0.23 × 10¹⁰ | 0.11 × 10¹⁰ | 0.17 × 10¹⁰ | 0.04 × 10¹⁰ |
| 2019 | 13.5 × 10⁶ | 0.16 × 10¹⁰ | 0.12 × 10¹⁰ | 0.10 × 10¹⁰ | 0.16 × 10¹⁰ | 0.18 × 10¹⁰ | 0.09 × 10¹⁰ | 0.14 × 10¹⁰ | 0.03 × 10¹⁰ | |
| Total Loss | - | 2.7 × 10⁶ | 0.13 × 10¹⁰ | 0.04 × 10¹⁰ | 0.03 × 10¹⁰ | 0.04 × 10¹⁰ | 0.05 × 10¹⁰ | 0.02 × 10¹⁰ | 0.03 × 10¹⁰ | 0.01 × 10¹⁰ |
| Glacier Name | Year | Specific Mass Balance (m we.) | |||
|---|---|---|---|---|---|
| Spb = 2.4301 × AAR − 1.20187 | Spb = 1.9433 × AAR − 1.3149 | Spb = −0.0011 × ELA + 5.0055 | Average | ||
| Durung Drung | 1971 | +0.11 | −0.27 | −0.71 | −0.29 ± 0.33 |
| 2002 | −0.01 | −0.36 | −0.73 | −0.37 ± 0.29 | |
| 2019 | −0.08 | −0.42 | −0.77 | −0.42 ± 0.28 | |
| Average mass balance = −0.36 ± 0.3 | |||||
| Pensilungpa | 1971 | +0.04 | −0.32 | −0.71 | −0.33 ± 0.31 |
| 2002 | −0.08 | −0.42 | −0.73 | −0.41 ± 0.26 | |
| 2019 | −0.16 | −0.48 | −0.74 | −0.45 ± 0.23 | |
| Average mass balance = −0.4 ± 0.27 | |||||
| Pensilungpa Glacier | Durung Drung | ||||
|---|---|---|---|---|---|
| Elevation Range (m a.s.l.) | Ice Thickness Lost (m) | SD | Elevation Range (m a.s.l.) | Ice Thickness Lost (m) | SD |
| 5200–5150 | 5 | 2 | 5350–5250 | 5 | 1.5 |
| 5150–5050 | 25 | 12 | 5250–5150 | 20 | 9 |
| 5050–4950 | 18 | 10 | 5150–5000 | 20 | 13 |
| 4950–4900 | 25 | 13 | 5000–4950 | 7 | 2 |
| 4900–4800 | 15 | 7 | 4950–4800 | 25 | 13 |
| 4800–4700 | 5 | 3 | <4800 | 25 | 14 |
| <4700 | 10 | 6 | |||
| Average thickness lost | 14.71 | 8 | 17 | 9 | |
Disclaimer/Publisher’s Note: The statements, opinions and data contained in all publications are solely those of the individual author(s) and contributor(s) and not of MDPI and/or the editor(s). MDPI and/or the editor(s) disclaim responsibility for any injury to people or property resulting from any ideas, methods, instructions or products referred to in the content. |
© 2023 by the authors. Licensee MDPI, Basel, Switzerland. This article is an open access article distributed under the terms and conditions of the Creative Commons Attribution (CC BY) license (https://creativecommons.org/licenses/by/4.0/).
Share and Cite
Mehta, M.; Kumar, V.; Kunmar, P.; Sain, K. Response of the Thick and Thin Debris-Covered Glaciers between 1971 and 2019 in Ladakh Himalaya, India—A Case Study from Pensilungpa and Durung-Drung Glaciers. Sustainability 2023, 15, 4267. https://doi.org/10.3390/su15054267
Mehta M, Kumar V, Kunmar P, Sain K. Response of the Thick and Thin Debris-Covered Glaciers between 1971 and 2019 in Ladakh Himalaya, India—A Case Study from Pensilungpa and Durung-Drung Glaciers. Sustainability. 2023; 15(5):4267. https://doi.org/10.3390/su15054267
Chicago/Turabian StyleMehta, Manish, Vinit Kumar, Pankaj Kunmar, and Kalachand Sain. 2023. "Response of the Thick and Thin Debris-Covered Glaciers between 1971 and 2019 in Ladakh Himalaya, India—A Case Study from Pensilungpa and Durung-Drung Glaciers" Sustainability 15, no. 5: 4267. https://doi.org/10.3390/su15054267