
Strength Iso-Responses of Shear-Deficient Ultra-High Performance Fiber Reinforced Concrete Beams

 ,
,  ,
,  , and
, and
Abstract
:1. Introduction

| Ref. | Elements | Test | Dimensions (mm) | Material | Most Important Findings | |||||||
|---|---|---|---|---|---|---|---|---|---|---|---|---|
| Type | No. | Type | Variables | Type | Fibrous System | |||||||
| [6] | Rectangular-beams | 14 | Four-point loading | , , , , and longitudinal reinforcement strength | 250 | 1800 | Variable = 1.51 to 3.02 | 150 | UHPC | Micro steel fibers | 80–116 | The beam’s capacity was decreased due to an increase in (in certain values); however, it marginally increased with increasing the tensile and transverse reinforcements. Additionally, the concrete plasticity model (CDM) was successfully employed to predict the behavior of beams with of 1.75 to 3.0. |
| [40] | I-girders (Prestressed) | 7 | Three-point loading | 650 | 4000 | 2000 | 250 | RPC | Micro steel fibers | 150–170 | The fibrous system significantly influences the cracking pattern and the ultimate load. | |
| [41] | 8 | and | 650 | 4000, 8000 | 2000, 4000 | 500 | UHPC | Micro steel fibers | 122–140 | The longitudinal shear failure could be a controlling design case for beams with a substantial moment gradient. Additionally, the CDM could be efficiently employed to design the UHPC beam under shear forces. | ||
| [42] | I-girders | 11 | Four-point loading | (stirrups and/or fibers, or neither) | 380 | 2000 | 760 | 230 | UHPC | Micro steel fibers | 151–194 | The behavior of beams under shear was highly influenced by the fibrous content in the UHPC. |
| [37] | T-beams | 12 | Four-point loading | , , and | 500 | 2000–5000 | Variable = 1 to 4 | 140 | RPC | Micro steel fibers | 127–155 | The response of girder to shear was notably influenced by , and . For , the failure pattern was “shear compression” or “diagonal compression.” |
| [43] | T-beams reinforced with high-strength steel | 11 | Four-point loading | , , fiber type, and | 140 | 1200 | Variable = 2.5 to 3.75 | 40 | UHPC | Micro steel fibers | 94–137 () | Fibers are more practical in improving the shear behavior than the flexural behavior of beams. Additionally, both deformability and cracking strength have been enhanced by the use of fibers. |
2. Materials and Methods
2.1. Materials
2.2. Mixing and Production of Concrete
2.3. Details of the UHPC Beams and Testing Arrangement
2.4. Database of Parameters for Developing Neuro-Fuzzy Model
3. Results and Discussion
3.1. Flexural Strength of Concrete (with and without Fibers)
3.2. Models for Predicting the
3.2.1. Sharma [51] Model
3.2.2. Kwak et al. [45] Model
3.2.3. Ahmad et al. [53] Model
3.2.4. Wang et al. [9]
3.3. Design of Experiments
3.3.1. Proposed Robust Model
3.3.2. Isoresponses of the Shear Strength of UHPC Beams
3.4. Simple Proposed Model for
4. Conclusions and Prospective
- On the basis of the Sharma [51] model, it was found that the mean of the tested-to-predicted shear strength of the UHPC beams was 1.09 along with a coefficient of variation of 68.1%. A major concern with this model is that it does not account for the longitudinal reinforcement percentage and has underestimated the shear strength of beams with a high longitudinal reinforcement ratio (greater than 6%). This model seems inadequate for estimating the shear capacity of UHPC beams.
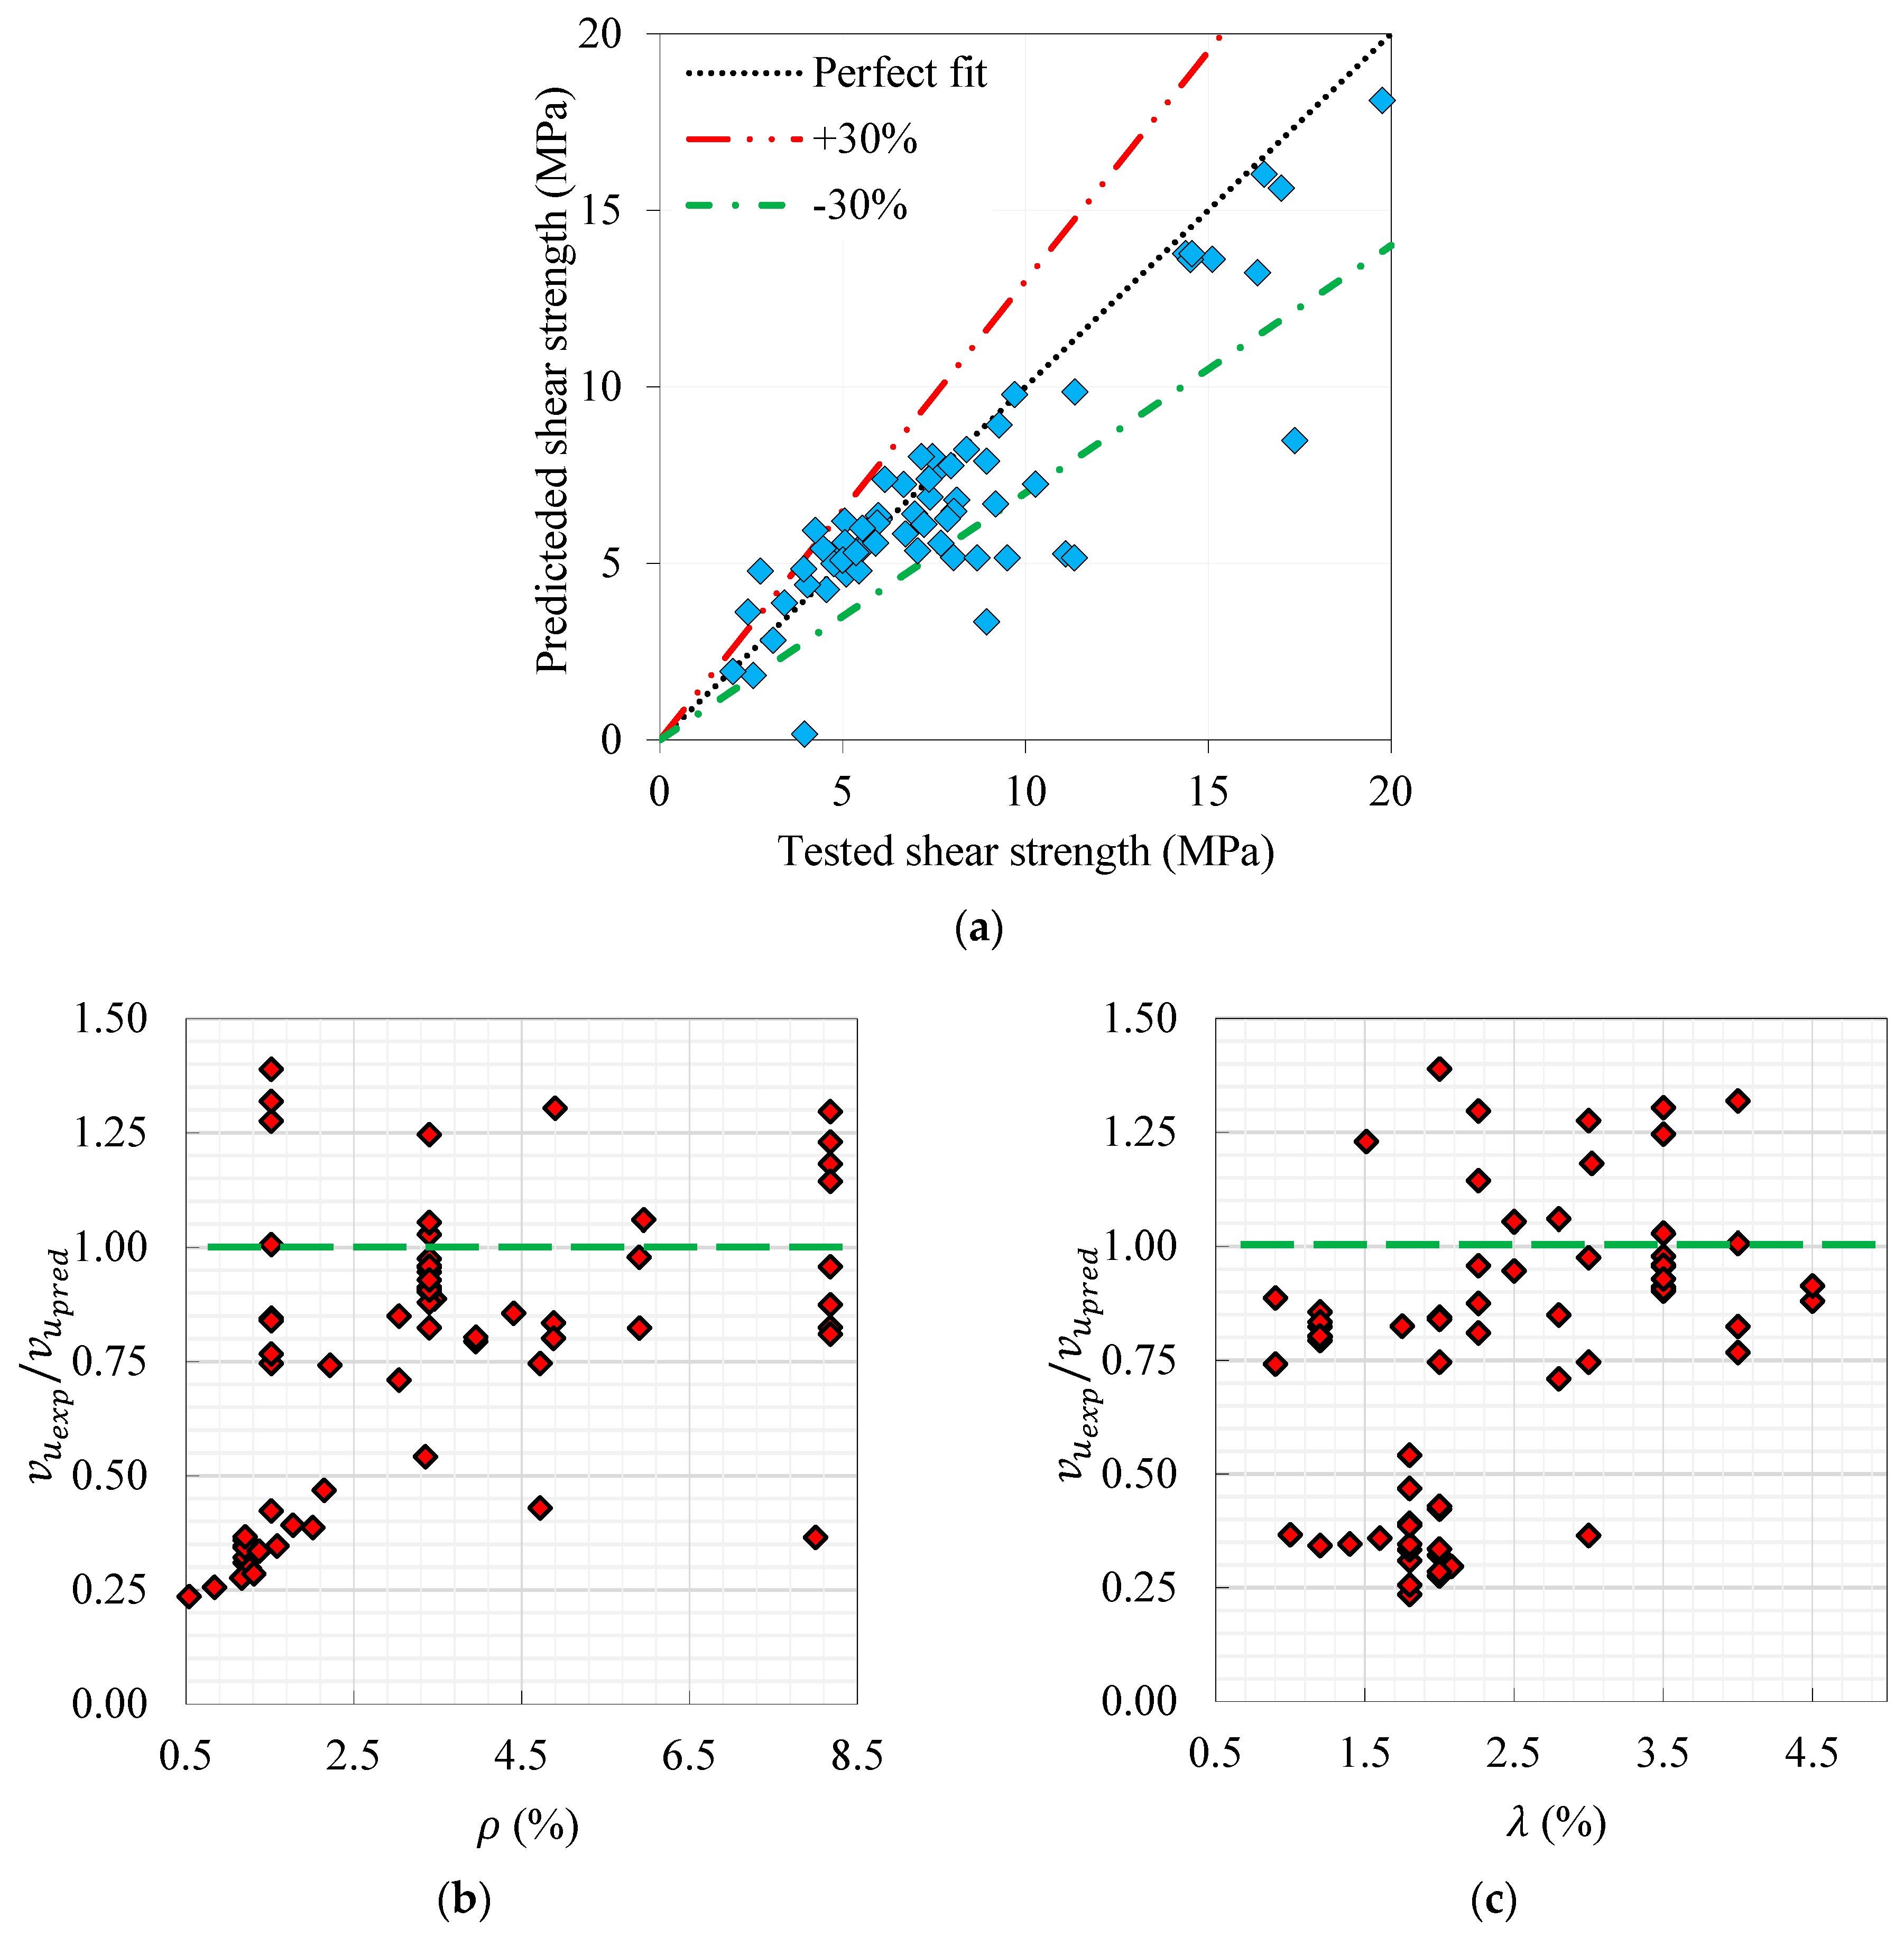
- In the Kwak et al. [45] model, the average ratio of measured-to-predicted shear strength and the variation coefficient associated with test-to-predicted shear strength was 1.22 and 41.9%, respectively, while the error band ranged between −30 and 30%. Thus, this model is likely to result in beams with shear capacities ranging from those of real values.
- The Ahmad et al. [53] model is likely to underestimate the performance of moderately reinforced beams and those with greater depths. According to this formula, the average ratio between the measured and predicted shear strengths was 1.23, with the variation coefficient for test-to-predicted shear strengths being 33.9%, and error bands ranging between −30 and 30%. As a result of the assumptions made in this model, beams will have shear capacities within a range of values that are widely separated from the real values of the beams.
- Based on Wang et al. [9], the test-to-predicted shear strength ratio was 0.77, with a variation coefficient of 42.1%, and error bands between −30 and 30%. The results of this model tended to overestimate the shear strength of UHPC beams in a large number of cases.
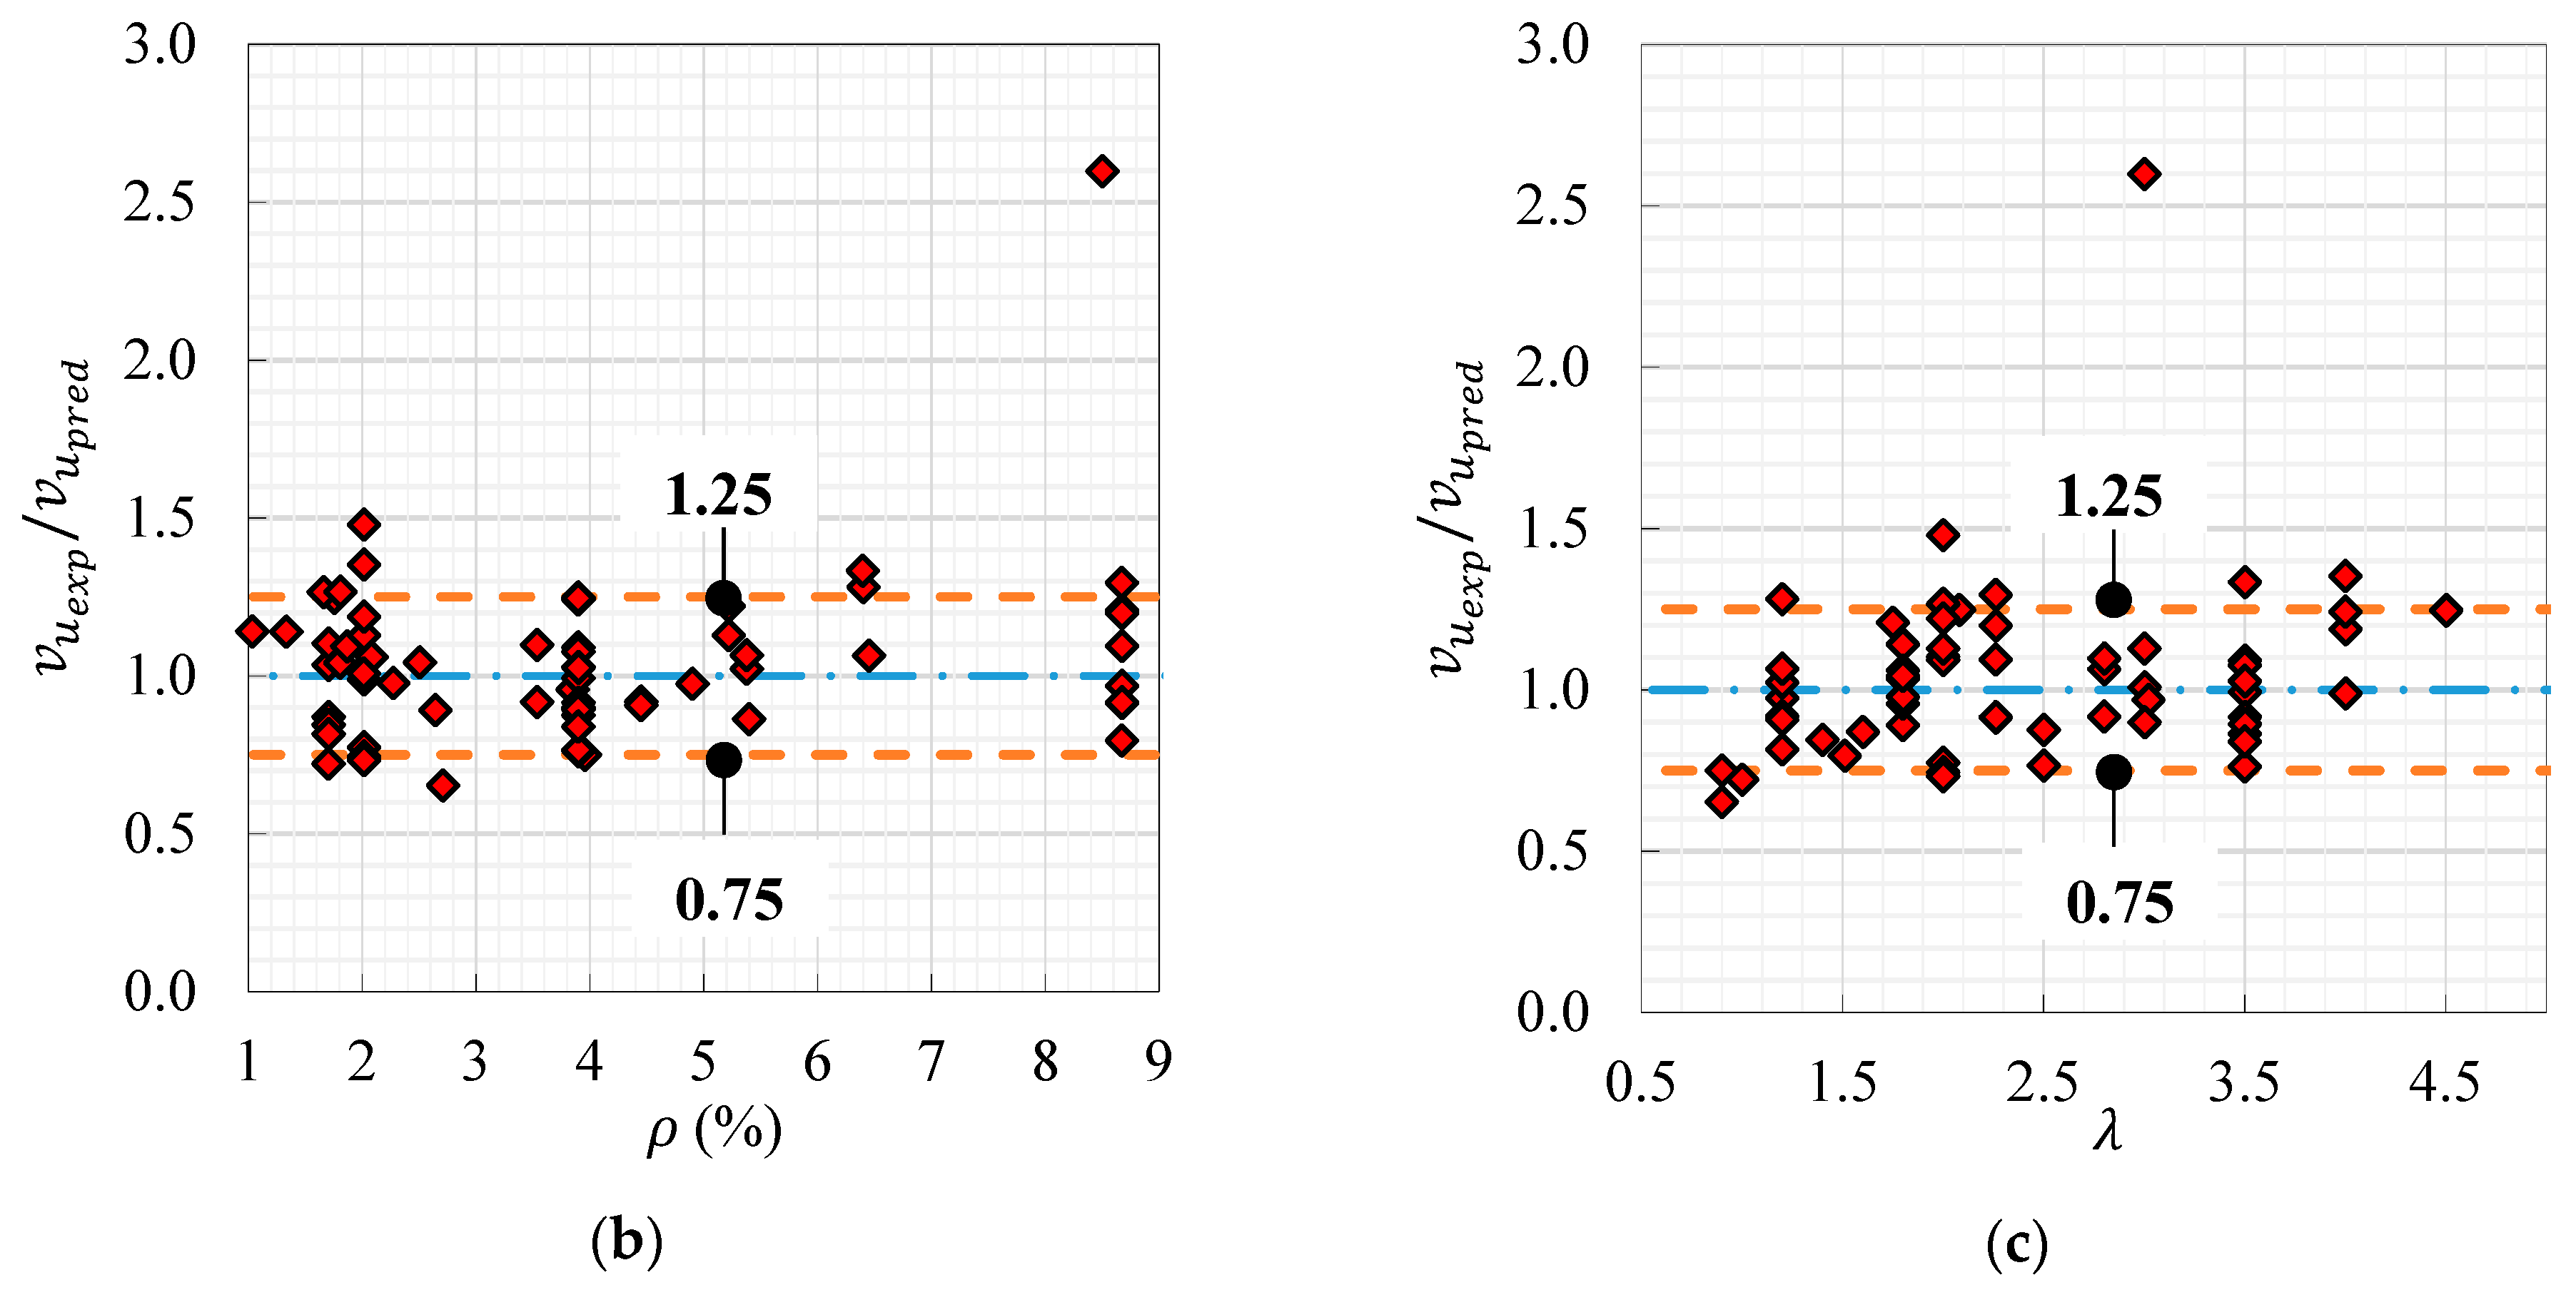
- A comparison of experimentally calculated shear strength with predicted shear strength using the proposed model for different beams was done in this study. Considering the experimentally calculated and predicted shear strength, it was found that the ratio was between 0.75 and 1.25 for the experimental and predicted shear strength, which corresponds to the results of similar literature.
Author Contributions
Funding
Institutional Review Board Statement
Informed Consent Statement
Data Availability Statement
Acknowledgments
Conflicts of Interest
References
- Prakash, R.; Thenmozhi, R.; Raman, S.N.; Subramanian, C. Characterization of eco-friendly steel fiber-reinforced concrete containing waste coconut shell as coarse aggregates and fly ash as partial cement replacement. Struct. Concr. 2020, 21, 437–447. [Google Scholar] [CrossRef]
- Prakash, R.; Thenmozhi, R.; Raman, S. Mechanical characterisation and flexural performance of eco-friendly concrete produced with fly ash as cement replacement and coconut shell coarse aggregate. Int. J. Environ. Sustain. Dev. 2019, 18, 131–148. [Google Scholar] [CrossRef]
- Zheng, S.; Lu, X.; Zhao, J.; He, R.; Chen, H.; Geng, Y. Influence of industrial by-product sulfur powder on properties of cement-based composites for sustainable infrastructures. Constr. Build. Mater. 2023, 367, 130171. [Google Scholar] [CrossRef]
- Bae, B.-I.; Lee, M.-S.; Choi, C.-S.; Jung, H.-S.; Choi, H.-K. Evaluation of the ultimate strength of the ultra-high-performance fiber-reinforced concrete beams. Appl. Sci. 2021, 11, 2951. [Google Scholar] [CrossRef]
- Albidah, A.S. Shear behviour of metakaolin-fly ash based geopolymer concrete deep beams. Eng. Struct. 2023, 275, 115271. [Google Scholar] [CrossRef]
- Li, V.C.; Fischer, G. Reinforced ECC—An evolution from materials to structures. In Proceedings of the 1st Fib Congress-Concrete Structures in the 21st Century, Osaka, Japan, 13–19 October 2002. [Google Scholar]
- Abbas, Y.M. Shear behavior of ultra-high-performance reinforced concrete beams–Finite element and uncertainty quantification study. In Structures; Elsevier: Amsterdam, The Netherlands, 2023; pp. 2365–2380. [Google Scholar]
- Yoo, D.-Y.; Yoon, Y.-S. A review on structural behavior, design, and application of ultra-high-performance fiber-reinforced concrete. Int. J. Concr. Struct. Mater. 2016, 10, 125–142. [Google Scholar] [CrossRef] [Green Version]
- Wang, Q.; Song, H.-L.; Lu, C.-L.; Jin, L.-Z. Shear performance of reinforced ultra-high performance concrete rectangular section beams. In Structures; Elsevier: Amsterdam, The Netherlands, 2020; pp. 1184–1194. [Google Scholar]
- Lim, W.-Y.; Hong, S.-G. Shear tests for ultra-high performance fiber reinforced concrete (UHPFRC) beams with shear reinforcement. Int. J. Concr. Struct. Mater. 2016, 10, 177–188. [Google Scholar] [CrossRef] [Green Version]
- Arafa, A.; Farghaly, A.S.; Ahmed, E.A.; Benmokrane, B. Laboratory testing of GFRP-RC panels with UHPFRC joints of the Nipigon River cable-stayed bridge in Northwest Ontario, Canada. J. Bridge Eng. 2016, 21, 05016006. [Google Scholar] [CrossRef]
- Tayeh, B.; Hadzima-Nyarko, M.; Riad, M.Y.R.; Hafez, R.D.A. Behavior of Ultra-High-Performance Concrete with Hybrid Synthetic Fiber Waste Exposed to Elevated Temperatures. Buildings 2023, 13, 129. [Google Scholar] [CrossRef]
- Wang, J.; Qi, J.; Tong, T.; Xu, Q.; Xiu, H. Static behavior of large stud shear connectors in steel-UHPC composite structures. Eng. Struct. 2019, 178, 534–542. [Google Scholar] [CrossRef]
- Verger-Leboeuf, S.; Charron, J.-P.; Massicotte, B. Design and behavior of UHPFRC field-cast transverse connections between precast bridge deck elements. J. Bridge Eng. 2017, 22, 04017031. [Google Scholar] [CrossRef]
- Liu, Y.; Zhang, Q.; Meng, W.; Bao, Y.; Bu, Y. Transverse fatigue behaviour of steel-UHPC composite deck with large-size U-ribs. Eng. Struct. 2019, 180, 388–399. [Google Scholar] [CrossRef]
- Pourbaba, M.; Joghataie, A.; Mirmiran, A. Shear behavior of ultra-high performance concrete. Constr. Build. Mater. 2018, 183, 554–564. [Google Scholar] [CrossRef]
- Soliman, N.A.; Tagnit-Hamou, A. Using glass sand as an alternative for quartz sand in UHPC. Constr. Build. Mater. 2017, 145, 243–252. [Google Scholar] [CrossRef]
- Abellán-García, J.; Núñez-López, A.M.; Arango-Campo, S.E. Pedestrian Bridge over Las Vegas Avenue in Medellín. First Latin American Infrastructure in UHPFRC. In Fibre Reinforced Concrete: Improvements and Innovations: RILEM-fib International Symposium on FRC (BEFIB) in 2020; Springer: Berlin/Heidelberg, Germany, 2021; pp. 864–872. [Google Scholar]
- Abellán, J.; Núñez, A.; Arango, S. Pedestrian bridge of UNAL in Manizales: A new UPHFRC application in the Colombian building market. Proc. Hipermat 2020, 43–44. [Google Scholar] [CrossRef]
- Abdal, S.; Mansour, W.; Agwa, I.; Nasr, M.; Abadel, A.; Özkılıç, Y.; Akeed, M.H. Application of Ultra-High-Performance Concrete in Bridge Engineering: Current Status, Limitations, Challenges, and Future Prospects. Buildings 2023, 13, 185. [Google Scholar] [CrossRef]
- Russell, E.; Lee, J.; Clift, R. Can the SDGs provide a basis for supply chain decisions in the construction sector? Sustainability 2018, 10, 629. [Google Scholar] [CrossRef] [Green Version]
- ACI Committee. ACI 318-19: Building Code Requirements for Structural Concrete and Commentary; American Concrete Institute: Farmington Hills, MI, USA, 2019. [Google Scholar]
- Zhang, P.; Wang, C.; Gao, Z.; Wang, F. A review on fracture properties of steel fiber reinforced concrete. J. Build. Eng. 2023, 67, 105975. [Google Scholar] [CrossRef]
- Zohrevand, P.; Mirmiran, A. Cyclic behavior of hybrid columns made of ultra high performance concrete and fiber reinforced polymers. J. Compos. Constr. 2012, 16, 91–99. [Google Scholar] [CrossRef]
- Cwirzen, A.; Penttala, V.; Vornanen, C. Reactive powder based concretes: Mechanical properties, durability and hybrid use with OPC. Cem. Concr. Res. 2008, 38, 1217–1226. [Google Scholar] [CrossRef]
- Meng, W.; Khayat, K.H. Effect of hybrid fibers on fresh properties, mechanical properties, and autogenous shrinkage of cost-effective UHPC. J. Mater. Civ. Eng. 2018, 30, 04018030. [Google Scholar] [CrossRef]
- Ipek, M.; Aksu, M.; Uysal, M.; Yilmaz, K.; Vural, I. Effect of pre-setting pressure applied flexure strength and fracture toughness of new SIFCON+ RPC composite during setting phase. Constr. Build. Mater. 2015, 79, 90–96. [Google Scholar] [CrossRef]
- Lee, M.-G.; Wang, Y.-C.; Chiu, C.-T. A preliminary study of reactive powder concrete as a new repair material. Constr. Build. Mater. 2007, 21, 182–189. [Google Scholar] [CrossRef]
- Qi, J.; Wu, Z.; Ma, Z.J.; Wang, J. Pullout behavior of straight and hooked-end steel fibers in UHPC matrix with various embedded angles. Constr. Build. Mater. 2018, 191, 764–774. [Google Scholar] [CrossRef]
- Solhmirzaei, R.; Salehi, H.; Kodur, V.; Naser, M. Machine learning framework for predicting failure mode and shear capacity of ultra high performance concrete beams. Eng. Struct. 2020, 224, 111221. [Google Scholar] [CrossRef]
- Qi, J.N.; Ma, Z.J.; Wang, J.Q. Shear Strength of UHPFRC Beams: Mesoscale Fiber-Matrix Discrete Model. J. Struct. Eng. 2017, 143, 10. [Google Scholar] [CrossRef]
- Qi, J.; Wang, J.; Ma, Z.J. Flexural response of high-strength steel-ultra-high-performance fiber reinforced concrete beams based on a mesoscale constitutive model: Experiment and theory. Struct. Concr. 2018, 19, 719–734. [Google Scholar] [CrossRef]
- Bahij, S.; Adekunle, S.K.; Al-Osta, M.; Ahmad, S.; Al-Dulaijan, S.U.; Rahman, M.K. Numerical investigation of the shear behavior of reinforced ultra-high-performance concrete beams. Struct. Concr. 2018, 19, 305–317. [Google Scholar] [CrossRef] [Green Version]
- Vu, D.-T.; Hoang, N.-D. Punching shear capacity estimation of FRP-reinforced concrete slabs using a hybrid machine learning approach. Struct. Infrastruct. Eng. 2016, 12, 1153–1161. [Google Scholar] [CrossRef]
- Lee, S.; Lee, C. Prediction of shear strength of FRP-reinforced concrete flexural members without stirrups using artificial neural networks. Eng. Struct. 2014, 61, 99–112. [Google Scholar] [CrossRef]
- Yan, K.; Shi, C. Prediction of elastic modulus of normal and high strength concrete by support vector machine. Constr. Build. Mater. 2010, 24, 1479–1485. [Google Scholar] [CrossRef]
- Ji, W.; Li, W.; An, M.; Zhu, L. Shear capacity of T-section girders made of reactive powder concrete. J. Bridge Eng. 2018, 23, 04018041. [Google Scholar] [CrossRef]
- Hou, R.; Hou, Q. Prediction of the shear capacity of ultrahigh-performance concrete beams using neural network and genetic algorithm. Sci. Rep. 2023, 13, 2145. [Google Scholar] [CrossRef] [PubMed]
- Wu, P.; Wu, C.; Liu, Z.; Hao, H. Investigation of shear performance of UHPC by direct shear tests. Eng. Struct. 2019, 183, 780–790. [Google Scholar] [CrossRef]
- Voo, Y.L.; Foster, S.J.; Gilbert, R.I. Shear strength of fiber reinforced reactive powder concrete prestressed girders without stirrups. J. Adv. Concr. Technol. 2006, 4, 123–132. [Google Scholar] [CrossRef] [Green Version]
- Voo, Y.L.; Poon, W.K.; Foster, S.J. Shear strength of steel fiber-reinforced ultrahigh-performance concrete beams without stirrups. J. Struct. Eng. 2010, 136, 1393–1400. [Google Scholar] [CrossRef]
- Baby, F.; Marchand, P.; Toutlemonde, F. Shear behavior of ultrahigh performance fiber-reinforced concrete beams. I: Experimental investigation. J. Struct. Eng. 2014, 140, 04013111. [Google Scholar] [CrossRef]
- Qi, J.N.; Ma, Z.J.; Wang, J.Q.; Liu, T.X. Post-cracking shear strength and deformability of HSS-UHPFRC beams. Struct. Concr. 2016, 17, 1033–1046. [Google Scholar] [CrossRef]
- Khan, M.I.; Fares, G.; Abbas, Y.M. Cost-performance balance and new image analysis technique for ultra-high performance hybrid nano-based fiber-reinforced concrete. Constr. Build. Mater. 2022, 315, 125753. [Google Scholar] [CrossRef]
- Kwak, Y.-K.; Eberhard, M.O.; Kim, W.-S.; Kim, J. Shear strength of steel fiber-reinforced concrete beams without stirrups. ACI Struct. J. 2002, 99, 530–538. [Google Scholar]
- Son, J.; Beak, B.; Choi, C. Experimental study on shear strength for ultra-high performance concrete beam. In Proceedings of the 18th International Conference on Composites Materials (ICCM-18), Gold Coast, Australia, 14–18 July 1997. [Google Scholar]
- Ridha, M.M.; Al-Shaarbaf, I.A.; Sarsam, K.F. Experimental study on shear resistance of reactive powder concrete beams without stirrups. Mech. Adv. Mater. Struct. 2020, 27, 1006–1018. [Google Scholar] [CrossRef]
- Bajaber, M.; Hakeem, I. UHPC evolution, development, and utilization in construction: A review. J. Mater. Res. Technol. 2021, 10, 1058–1074. [Google Scholar] [CrossRef]
- Zhang, H.; Ji, T.; Zeng, X.; Yang, Z.; Lin, X.; Liang, Y. Mechanical behavior of ultra-high performance concrete (UHPC) using recycled fine aggregate cured under different conditions and the mechanism based on integrated microstructural parameters. Constr. Build. Mater. 2018, 192, 489–507. [Google Scholar] [CrossRef]
- Shihada, S.; Arafa, M. Effects of silica fume, ultrafine and mixing sequences on properties of ultra high performance concrete. Asian J. Mater. Sci. 2010, 2, 137–146. [Google Scholar] [CrossRef] [Green Version]
- Sharma, A. Shear strength of steel fiber reinforced concrete beams. J. Proc. 1986, 83, 624–628. [Google Scholar]
- Batson, G.; Jenkins, E.; Spatney, R. Steel fibers as shear reinforcement in beams. J. Proc. 1972, 69, 640–644. [Google Scholar]
- Ahmad, S.; Bahij, S.; Al-Osta, M.; Adekunle, S.; Al-Dulaijan, S. Shear behavior of ultra-high-performance concrete beams reinforced with high-strength steel bars. ACI Struct. J. 2019, 116, 3–14. [Google Scholar] [CrossRef]
- Ryan, B.F.; Joiner, B.L.; Cryer, J.D. MINITAB Handbook: Update for Release; Cengage Learning: Boston, MA, USA, 2012. [Google Scholar]


| Oxides (%) | OPC | FA | SF |
|---|---|---|---|
| SiO2 | 20.41 | 55.23 | 86.20 |
| Al2O3 | 5.32 | 25.95 | 0.49 |
| Fe2O3 | 4.10 | 10.17 | 3.79 |
| CaO | 64.14 | 1.32 | 2.19 |
| MgO | 0.71 | 0.31 | 1.31 |
| SO3 | 2.44 | 0.18 | 0.74 |
| TiO2 | 0.30 | - | - |
| Na2Oeq | 0.10 | 0.86 | 2.80 |
| L.O.I. | 2.18 | 5.00 | 2.48 |
| R.D. | 3.15 | 2.70 | 2.20 |
| Property | RS | WS |
|---|---|---|
| Bulk Specific Gravity (OD Basis) | 2.64 | 2.73 |
| Specific Gravity (SSD Basis) | 2.65 | 2.74 |
| Apparent Specific Gravity | 2.67 | 2.76 |
| Absorption, % | 0.30 | 0.37 |
| Fineness Modulus (range of 2.3–3.1) | 1.11 | 1.46 |
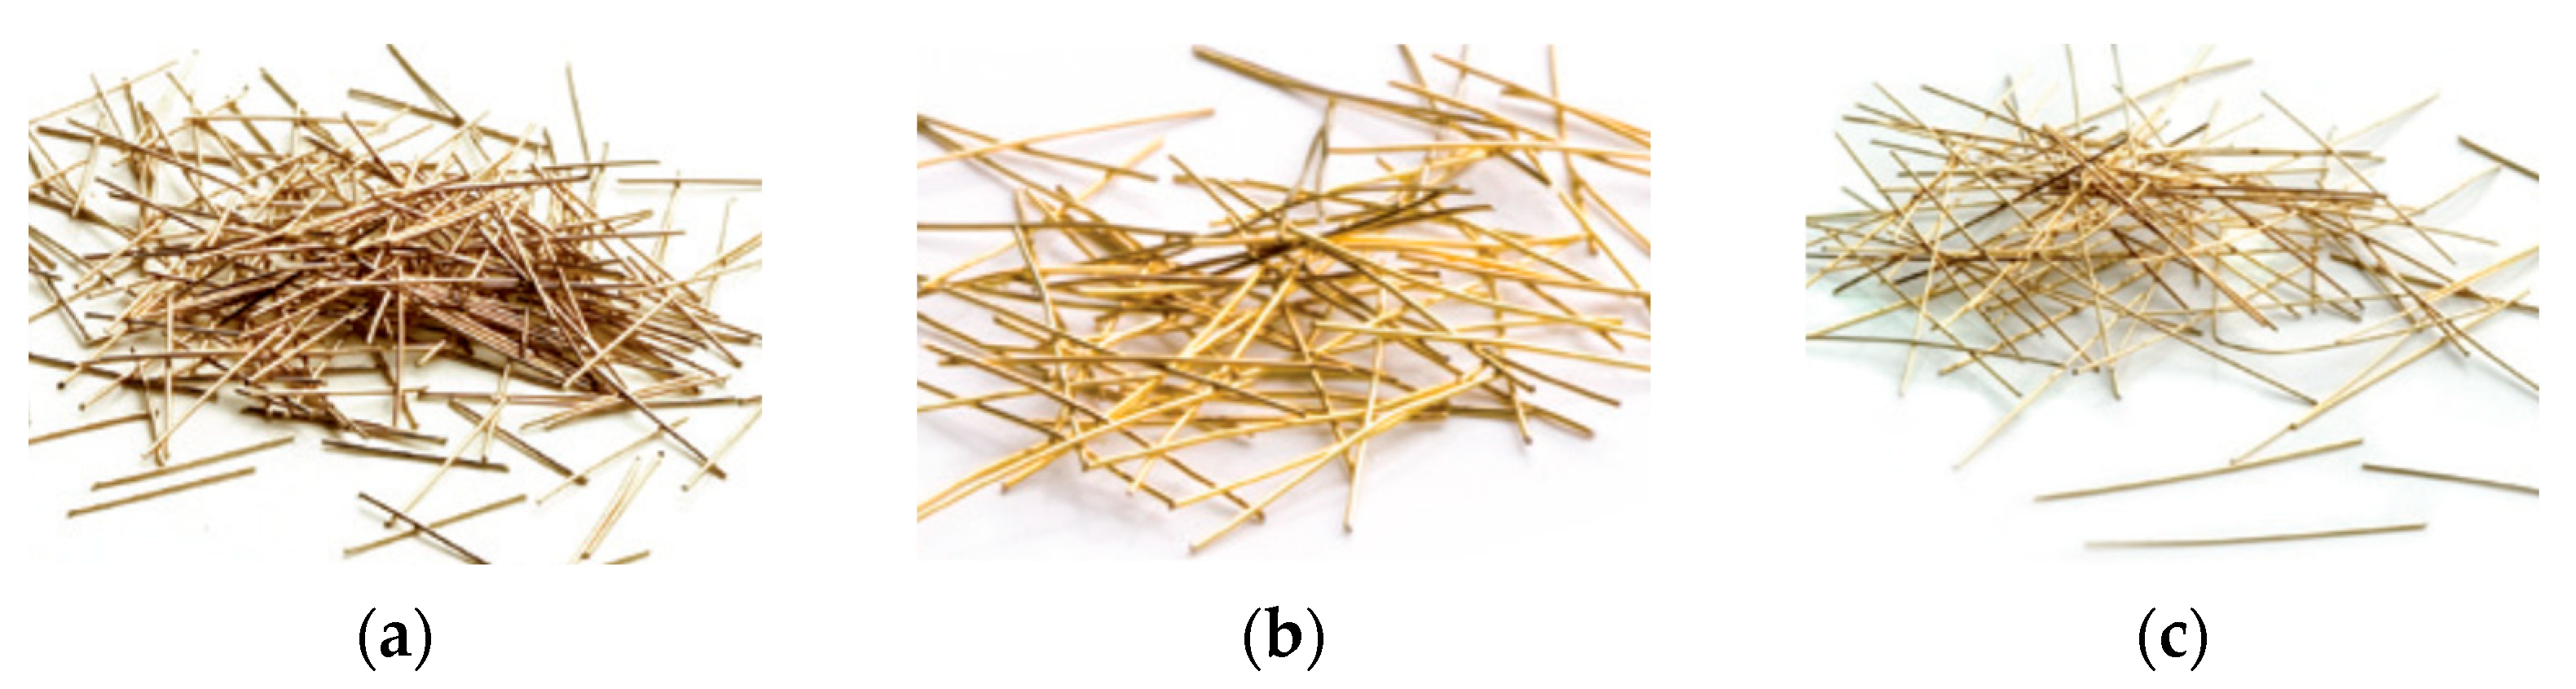
| Type | Geometry | Length (mm) | Aspect Ratio |
|---|---|---|---|
| SF1 |  | 13 | 65 |
| SF2 |  | 20 | 100 |
| SF3 |  | 30 | 150 |
| PC | SF | FA | WS | RS | Water | SP | Fiber | ||
|---|---|---|---|---|---|---|---|---|---|
| A | B | C | |||||||
| 1123.1 | 239.1 | 66.1 | 481.2 | 160.9 | 212.7 | 39.7 | 151.8 | 43.0 | 7.6 |
| Beam | Batch | ||||||
|---|---|---|---|---|---|---|---|
| B2 | C1 | 150 | 225 | 125 | 8 | 0.536 | 1.80 |
| B3 | 150 | 225 | 125 | 10 | 0.838 | 1.80 | |
| B4 | 150 | 225 | 125 | 12 | 1.206 | 1.80 | |
| B5 | C2 | 150 | 225 | 125 | 16 | 2.145 | 1.80 |
| B6 | 150 | 225 | 125 | 20 | 3.351 | 1.80 | |
| B7 | 150 | 207 | 115 | 12 | 1.311 | 1.80 | |
| B8 | C3 | 150 | 171 | 95 | 12 | 1.587 | 1.80 |
| B9 | 150 | 153 | 85 | 12 | 1.774 | 1.80 | |
| B10 | 150 | 135 | 75 | 12 | 2.011 | 1.80 | |
| B11 | C4 | 150 | 250 | 125 | 12 | 1.206 | 2.00 |
| B12 | 150 | 200 | 125 | 12 | 1.206 | 1.60 | |
| B13 | 150 | 175 | 125 | 12 | 1.206 | 1.40 | |
| B14 | C5 | 150 | 150 | 125 | 12 | 1.206 | 1.20 |
| B15 | 150 | 125 | 125 | 12 | 1.206 | 1.00 | |
| B16 | 140 | 250 | 120 | 12 | 1.257 | 2.08 | |
| B17 | C6 | 130 | 220 | 110 | 12 | 1.371 | 2.00 |
| B19 | 110 | 180 | 90 | 10 | 1.164 | 2.00 | |
| B20 | 100 | 160 | 80 | 10 | 1.309 | 2.00 |
| # | Beam | (MPa) | (mm) | (mm) | Inputs | Output | Ref. | ||||
|---|---|---|---|---|---|---|---|---|---|---|---|
(%) | (mm) | (MPa) | (MPa) | (MPa) | |||||||
| 1 | B2 | 520 | 150 | 150 | 0.536 | 1.80 | 125 | 186.7 | 17.7 | 4.560 | Current Study |
| 2 | B3 | 520 | 150 | 150 | 0.838 | 1.80 | 125 | 186.7 | 17.7 | 4.956 | |
| 3 | B4 | 520 | 150 | 150 | 1.206 | 1.80 | 125 | 186.7 | 17.7 | 5.991 | |
| 4 | B5 | 520 | 150 | 150 | 2.145 | 1.80 | 125 | 172.6 | 18.4 | 8.378 | |
| 5 | B6 | 520 | 150 | 150 | 3.351 | 1.80 | 125 | 172.6 | 18.4 | 9.693 | |
| 6 | B7 | 520 | 150 | 150 | 1.311 | 1.80 | 115 | 172.6 | 18.4 | 5.964 | |
| 7 | B8 | 520 | 150 | 150 | 1.587 | 1.80 | 95 | 185.8 | 24.9 | 6.662 | |
| 8 | B9 | 520 | 150 | 150 | 1.774 | 1.80 | 85 | 185.8 | 24.9 | 7.542 | |
| 9 | B10 | 520 | 150 | 150 | 2.011 | 1.80 | 75 | 185.8 | 24.9 | 7.449 | |
| 10 | B11 | 520 | 150 | 150 | 1.206 | 2.00 | 125 | 179.3 | 20.0 | 5.444 | |
| 11 | B12 | 520 | 150 | 150 | 1.206 | 1.60 | 125 | 179.3 | 20.0 | 7.382 | |
| 12 | B13 | 520 | 150 | 150 | 1.206 | 1.40 | 125 | 179.3 | 20.0 | 7.956 | |
| 13 | B14 | 520 | 150 | 150 | 1.206 | 1.20 | 125 | 186.7 | 27.6 | 9.267 | |
| 14 | B15 | 520 | 150 | 150 | 1.206 | 1.00 | 125 | 186.7 | 27.6 | 11.342 | |
| 15 | B16 | 520 | 150 | 140 | 1.257 | 2.08 | 120 | 186.7 | 27.6 | 5.052 | |
| 16 | B17 | 520 | 150 | 130 | 1.371 | 2.00 | 110 | 187.5 | 25.1 | 5.938 | |
| 17 | B19 | 520 | 150 | 110 | 1.164 | 2.00 | 90 | 187.5 | 25.1 | 4.885 | |
| 18 | B20 | 520 | 150 | 100 | 1.309 | 2.00 | 80 | 187.5 | 25.1 | 5.053 | |
| 19 | FHB2-2 | 442 | 125 | 250 | 1.517 | 2.00 | 212 | 63.8 | 5.88 | 5.090 | [45] |
| 20 | FHB3-2 | 442 | 125 | 250 | 1.517 | 2.00 | 212 | 68.6 | 6.05 | 5.440 | |
| 21 | FHB2-3 | 442 | 125 | 250 | 1.517 | 3.00 | 212 | 63.8 | 5.88 | 3.090 | |
| 22 | FHB3-3 | 442 | 125 | 250 | 1.517 | 4.00 | 212 | 68.6 | 6.05 | 3.400 | |
| 23 | FHB2-4 | 442 | 125 | 250 | 1.517 | 4.00 | 212 | 63.8 | 5.88 | 2.410 | |
| 24 | FHB3-4 | 442 | 125 | 250 | 1.517 | 2.00 | 212 | 68.6 | 6.05 | 2.740 | |
| 25 | FNB2-2 | 442 | 125 | 250 | 1.517 | 2.00 | 212 | 30.8 | 3.83 | 4.040 | |
| 26 | FNB2-3 | 442 | 125 | 250 | 1.517 | 3.00 | 212 | 30.8 | 3.83 | 2.550 | |
| 27 | FNB2-4 | 442 | 125 | 250 | 1.517 | 4.00 | 212 | 30.8 | 3.83 | 2.000 | |
| 28 | BS-100-2.0 | 400 | 200 | 350 | 4.720 | 2.00 | 260 | 100.0 | 7.90 * | 7.043 | [46] |
| 29 | BS-200-2.0 | 400 | 200 | 350 | 4.720 | 2.00 | 260 | 200.0 | 11.17 * | 8.114 | |
| 30 | SB1 | 600 | 150 | 290 | 8.002 | 3.00 | 220 | 166.9 | 11.5 | 3.954 | [10] |
| 31 | L-0 | 522 | 150 | 250 | 8.177 | 2.26 | 160 | 117.2 | 6.9 | 9.493 | [9] |
| 32 | LA-1 | 522 | 150 | 250 | 8.177 | 1.51 | 160 | 117.2 | 6.9 | 17.360 | |
| 33 | LA-2 | 522 | 150 | 250 | 8.177 | 1.75 | 160 | 117.2 | 6.9 | 10.267 | |
| 34 | LA-3 | 522 | 150 | 250 | 8.177 | 3.02 | 160 | 117.2 | 6.9 | 8.933 | |
| 35 | LC-3 | 522 | 150 | 250 | 8.177 | 2.26 | 160 | 101.2 | 6.9 | 11.093 | |
| 36 | LD-1 | 522 | 150 | 250 | 8.177 | 2.26 | 160 | 117.2 | 6.9 | 8.027 | |
| 37 | LD-2 | 522 | 150 | 250 | 8.177 | 2.26 | 160 | 117.2 | 6.9 | 11.333 | |
| 38 | LE-1 | 441 | 150 | 250 | 8.177 | 2.26 | 160 | 117.2 | 6.9 | 8.667 | |
| 39 | B4 | 400 | 152 | 152 | 5.905 | 1.20 | 127 | 137.0 | 37.165 | 16.339 | [16] |
| 40 | B5 | 400 | 152 | 152 | 4.404 | 1.20 | 127 | 137.0 | 37.165 | 16.988 | |
| 41 | B21 | 400 | 152 | 152 | 4.880 | 1.20 | 127 | 125.0 | 22.495 | 15.106 | |
| 42 | B22 | 400 | 152 | 152 | 3.953 | 1.20 | 127 | 125.0 | 22.495 | 14.370 | |
| 43 | B23 | 400 | 152 | 152 | 4.880 | 1.20 | 127 | 125.0 | 22.495 | 14.500 | |
| 44 | B24 | 400 | 152 | 152 | 3.953 | 1.20 | 127 | 125.0 | 22.495 | 14.543 | |
| 45 | B29 | 400 | 102 | 203 | 3.459 | 0.90 | 77 | 125.0 | 22.597 | 19.753 | |
| 46 | B30 | 400 | 102 | 203 | 2.214 | 0.90 | 77 | 125.0 | 22.597 | 16.517 | |
| 47 | B35 | 400 | 152 | 76 | 5.954 | 2.80 | 127 | 125.0 | 22.134 | 9.176 | |
| 48 | B36 | 400 | 152 | 76 | 3.038 | 2.80 | 127 | 125.0 | 22.134 | 7.358 | |
| 49 | B37 | 400 | 152 | 76 | 3.038 | 2.80 | 127 | 125.0 | 22.134 | 6.146 | |
| 50 | B2 | 520 | 100 | 140 | 3.400 | 3.50 | 112 | 94.0 | 9.200 | 4.750 | [47] |
| 51 | B3 | 520 | 100 | 140 | 3.400 | 3.50 | 112 | 98.0 | 11.000 | 5.000 | |
| 52 | B4 | 520 | 100 | 140 | 3.400 | 3.50 | 112 | 103.0 | 14.500 | 5.536 | |
| 53 | B5 | 520 | 100 | 140 | 3.400 | 3.50 | 112 | 110.0 | 15.400 | 5.893 | |
| 54 | B6 | 520 | 100 | 140 | 3.400 | 3.50 | 112 | 110.0 | 15.400 | 7.679 | |
| 55 | B7 | 520 | 100 | 140 | 4.900 | 3.50 | 112 | 110.0 | 15.400 | 8.036 | |
| 56 | B8 | 520 | 100 | 140 | 5.900 | 3.50 | 112 | 101.0 | 14.000 | 5.536 | |
| 57 | B9 | 520 | 100 | 140 | 3.400 | 3.50 | 112 | 93.0 | 14.000 | 5.357 | |
| 58 | B10 | 520 | 100 | 140 | 3.400 | 2.50 | 112 | 110.0 | 15.400 | 8.929 | |
| 59 | B11 | 520 | 100 | 140 | 3.400 | 3.00 | 112 | 110.0 | 15.400 | 6.964 | |
| 60 | B12 | 520 | 100 | 140 | 3.400 | 4.00 | 112 | 110.0 | 15.400 | 4.464 | |
| 61 | B13 | 520 | 100 | 140 | 3.400 | 4.50 | 112 | 110.0 | 15.400 | 4.250 | |
| 62 | B14 | 520 | 100 | 140 | 3.400 | 2.50 | 112 | 98.0 | 11.000 | 7.143 | |
| 63 | B15 | 520 | 100 | 140 | 3.400 | 4.50 | 112 | 98.0 | 11.000 | 3.929 | |
| 64 | B16 | 520 | 100 | 140 | 3.400 | 3.50 | 112 | 125.0 | 16.700 | 6.714 | |
| 65 | B17 | 520 | 100 | 140 | 3.400 | 3.50 | 112 | 142.0 | 17.900 | 7.214 | |
| 66 | B18 | 520 | 100 | 140 | 3.400 | 3.50 | 112 | 151.0 | 18.500 | 7.857 | |
| Terms | Coefficient | ||||
|---|---|---|---|---|---|
| Linear | |||||
| 5.06 | (18.81) | 0.119 | (0.042) | (0.07) | |
| Quadratic | |||||
| (0.353) | 1.412 | (0.699 × 10⁻³) | (0.083 × 10⁻³) | 12.67 × 10⁻³ | |
| Terms | Coefficient | |||
|---|---|---|---|---|
| Cross-product | ||||
| (0.007) | (0.004) | (3.98 × 10⁻³) | (0.017) | |
| 0.035 | 0.0144 | 0.188 | ||
| 0.365 × 10³ | (4.42 × 10³) | |||
| (0.46 × 10³) | ||||
Disclaimer/Publisher’s Note: The statements, opinions and data contained in all publications are solely those of the individual author(s) and contributor(s) and not of MDPI and/or the editor(s). MDPI and/or the editor(s) disclaim responsibility for any injury to people or property resulting from any ideas, methods, instructions or products referred to in the content. |
© 2023 by the authors. Licensee MDPI, Basel, Switzerland. This article is an open access article distributed under the terms and conditions of the Creative Commons Attribution (CC BY) license (https://creativecommons.org/licenses/by/4.0/).
Share and Cite
Abbas, Y.M.; Shafiq, N.; Fares, G.; Osman, M.; Khan, M.I.; Khatib, J.M. Strength Iso-Responses of Shear-Deficient Ultra-High Performance Fiber Reinforced Concrete Beams. Sustainability 2023, 15, 4265. https://doi.org/10.3390/su15054265
Abbas YM, Shafiq N, Fares G, Osman M, Khan MI, Khatib JM. Strength Iso-Responses of Shear-Deficient Ultra-High Performance Fiber Reinforced Concrete Beams. Sustainability. 2023; 15(5):4265. https://doi.org/10.3390/su15054265
Chicago/Turabian StyleAbbas, Yassir M., Nasir Shafiq, Galal Fares, Montasir Osman, Mohammad Iqbal Khan, and Jamal M. Khatib. 2023. "Strength Iso-Responses of Shear-Deficient Ultra-High Performance Fiber Reinforced Concrete Beams" Sustainability 15, no. 5: 4265. https://doi.org/10.3390/su15054265