1. Introduction
Present-day air conditioning systems must not only be energy efficient, but they must also guarantee that the air quality inside a space is acceptable. Fluid mechanics is highly relevant to the study of ventilation and pollutant dispersion in a given space, but mainly in closed spaces such as classrooms, offices, and cubicles where human beings engage in activities for several hours per day. Moreover, the COVID-19 pandemic has made ventilation in closed spaces a central public health issue, which society must take into account to reduce the risk of massive aerial spread of infectious disease organisms. Fluid dynamics studies how the air inside any room behaves, and it can show, for example, that pollutants remain in the air for hours in an interior space if there is no efficient ventilation.
Due to climate change, it is important to reduce energy consumption by using more efficient air conditioning strategies and to provide adequate comfort within buildings. As a parameter to size the impact of energy consumption due to air conditioning in hot regions, let us consider that, in 2021, 70% of the electricity consumed in Veracruz, Mexico, was used in buildings, most of it to power air conditioning systems. Most of the research in this area has been carried out in Europe and the United States, where cold climates predominate most of the year; therefore, applying the results of those studies to very hot climates such as that of Veracruz is not feasible.
The use of computational fluid dynamics (CFD) is currently widespread in different fields of knowledge. The study of airflow inside living spaces is no exception. Some studies use basic geometries, generally rectangular, where the CO
2 levels inside the space are analyzed. These works often consider spaces as closed or open two-dimensional cavities with an air inlet and an outlet, and a source of heat and contaminants on one of the walls. Air quality analysis has been done both by laminar flow [
1,
2,
3,
4] and turbulent regime [
5,
6,
7,
8].
On the other hand, there are many CFD studies where air behavior is studied using realistic three-dimensional spaces; however, this is done from the point of view of thermal comfort and energy savings without taking air quality into account and, therefore, they fail to consider pollutant levels [
9,
10,
11,
12,
13,
14]. In these studies, velocity fields and temperature contours are analyzed for different air supply configurations: air inlet on the ceiling [
9,
11,
13], on the floor [
10,
11,
12,
13,
14], and on a side wall [
10]. Of these, [
9] was carried out in Finland—therefore, the analysis was focused on a cold climate—while [
11] was carried out in a subtropical climate.
The literature has many examples of studies in which CO
2 concentration in different classrooms is measured to carry out different analyses, such as determining the times of the day in which the pollutant exceeds an upper limit [
15], evaluating the improvement of ventilation and compliance with regulations by keeping doors and/or windows open or closed [
16,
17], studying the effects of natural ventilation [
18] or mechanically-controlled ventilation systems [
19] on CO
2 levels, calculating the air exchange rate [
20,
21], and determining the ventilation rate [
20]. Other research in which CO
2 concentrations are also studied include an analysis carried out in naturally-ventilated office buildings in two Italian cities considering different opening and closing configurations for doors and windows [
22], a study on air-conditioned laboratories in a Malaysian university with different numbers of occupants [
23], a study focused on a waiting room in a Chinese railway station [
24], and another one centered on a typical small apartment in Korea [
25]. Recently, Di Gilio et al. [
26] studied CO
2 concentrations in Italian classrooms and found that the levels of this pollutant can be used as an indicator of SARS-CoV-2 transmission risk. The authors proposed a four-level risk classification (from low risk to very high risk).
CFD has shown to be a very useful tool in many applications. For example, during health emergencies such as that of Sars-CoV-2, it is possible to quickly and safely analyze the conditions of the air inside a space to propose protocols to help reduce massive infections. Borro et al. [
27] analyzed the influence of air conditioning, ventilation, and a heating system on the dispersion of droplets caused by coughing inside a waiting room in a hospital and in another room in the same hospital. Tamaddon-Jahromi et al. [
28] studied the distribution of ozone concentration levels in a closed space during a disinfection process. Jafar et al. [
29] evaluated flow patterns, temperature fields, and CO
2 dispersion in a mosque attended by a large number of people. Habchi et al. [
30] proposed a ventilation improvement in an office to increase occupancy density and reduce the possibility of cross-contamination using a customized ventilation system on the ceiling and desk fans.
The main motivation of this work is to solve the problems that occur in many teachers’ offices in schools located in places with extremely hot climates, such as Veracruz, Mexico. The solution to this problem involves guaranteeing thermal comfort and air quality at the same time. Unfortunately, in developing countries such as Mexico, where the economic resources and infrastructure of public schools are limited, it is impossible to move to other spaces; therefore, research must be carried out to solve the problems that arise in existing spaces.
In schools located in extremely hot places such as Veracruz, it is impossible to carry out learning and academic activities in offices without air conditioning; therefore, keeping the windows open is not an option. This research has great relevance for a large number of public school teachers’ offices in Mexico, where the weather is very hot throughout the year. Building new offices requires a large amount of economic resources, which the government is unwilling to spend on. Therefore, it is necessary to achieve thermal comfort and appropriate CO2 levels with the available infrastructure, establishing the optimal parameters for the air conditioning equipment to work efficiently and help reduce the energy consumption of the existing spaces instead of building new teachers’ offices.
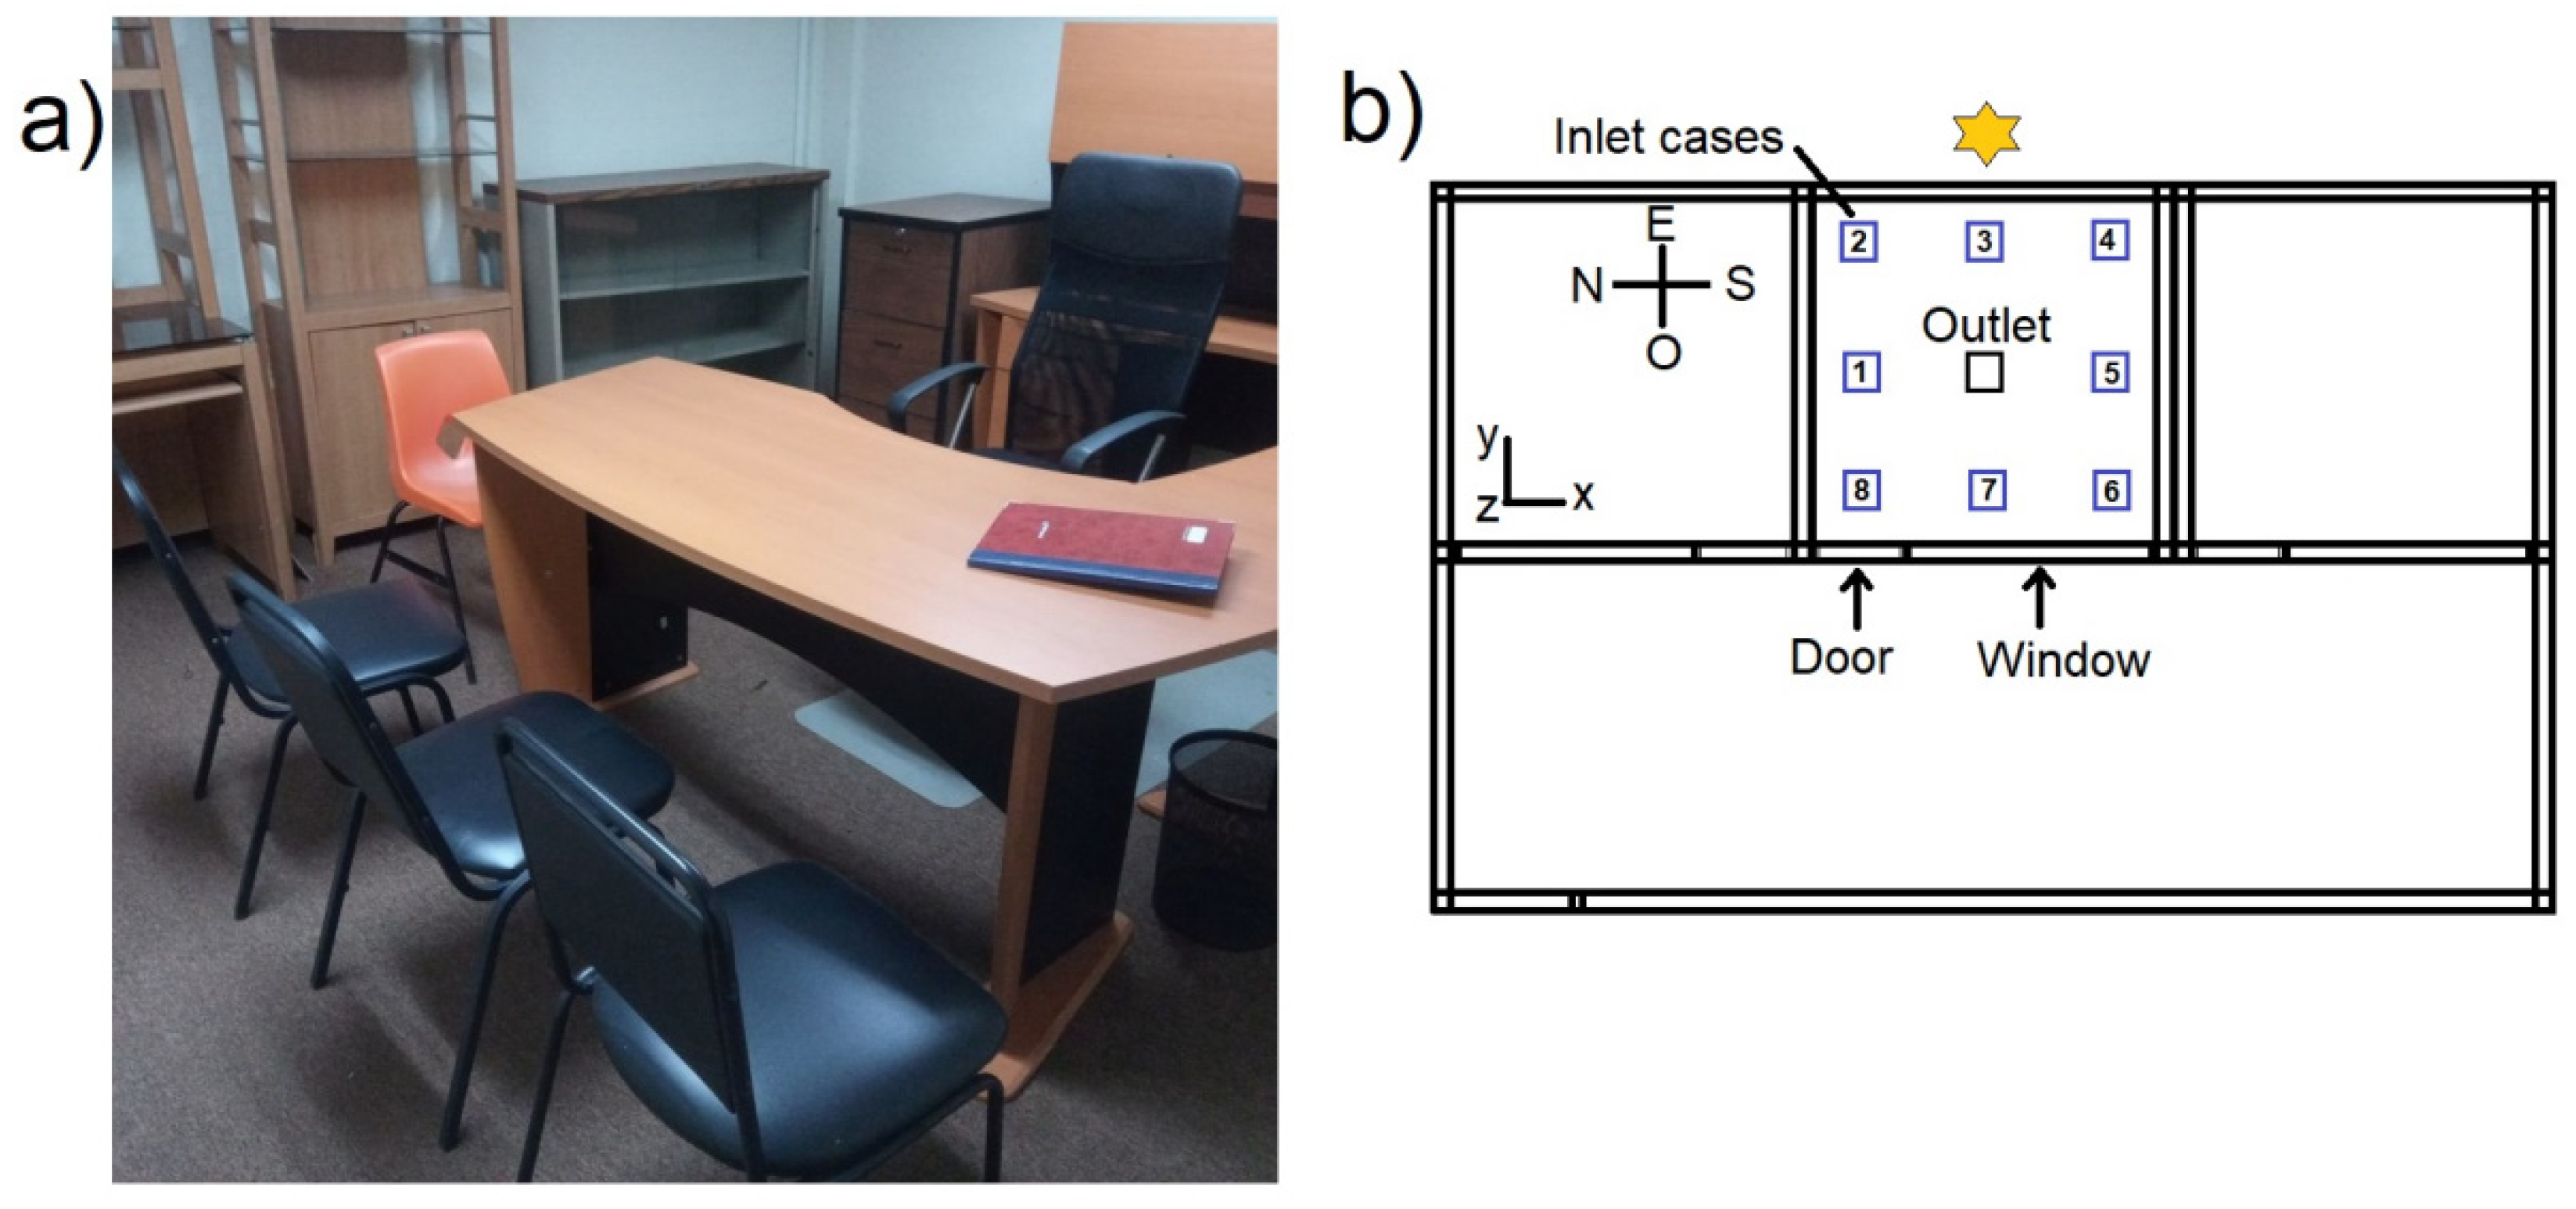
The literature establishes that if the air conditioning inlet is located in the proper place and its inlet velocity is properly adjusted, then optimal ventilation conditions in closed spaces will be achieved. The purpose of the present study is to analyze the thermal comfort and air quality of a typical office in a higher education institution in Veracruz, Mexico, which needs air conditioning due to extremely hot weather throughout the year, and whose doors and windows remain closed at all times due to external noise. Inside this space, a professor conducts different academic activities for several hours per day, such as student counseling. The study includes an analysis of flow dynamics, temperature, and CO2 concentration in a three-dimensional confined space equipped with an air conditioning system that extracts hot and polluted air from the upper central part of the ceiling. Average temperatures and concentrations are also calculated, as well as temperature effectiveness and concentration distribution effectiveness inside the space. The study considers different air conditioning inlet positions, Reynolds numbers, and numbers of people to determine the configuration that provides the best air quality and thermal comfort levels while using energy efficiently.
3. Results
Inside a closed space equipped with an air conditioning system, CO2 levels change depending on the number of people inside and the ventilation conditions. Because of this, it is important to analyze the airflow, air temperature, and contaminant dispersion.
3.1. Flow Fields
Flow dynamics are most important when studying CO2 concentrations inside an office because passive pollutants follow the trajectory of the airflow. Airflow depends on the interaction between the plume formed by the detachment of the boundary layer and the fluid outside the boundary layer.
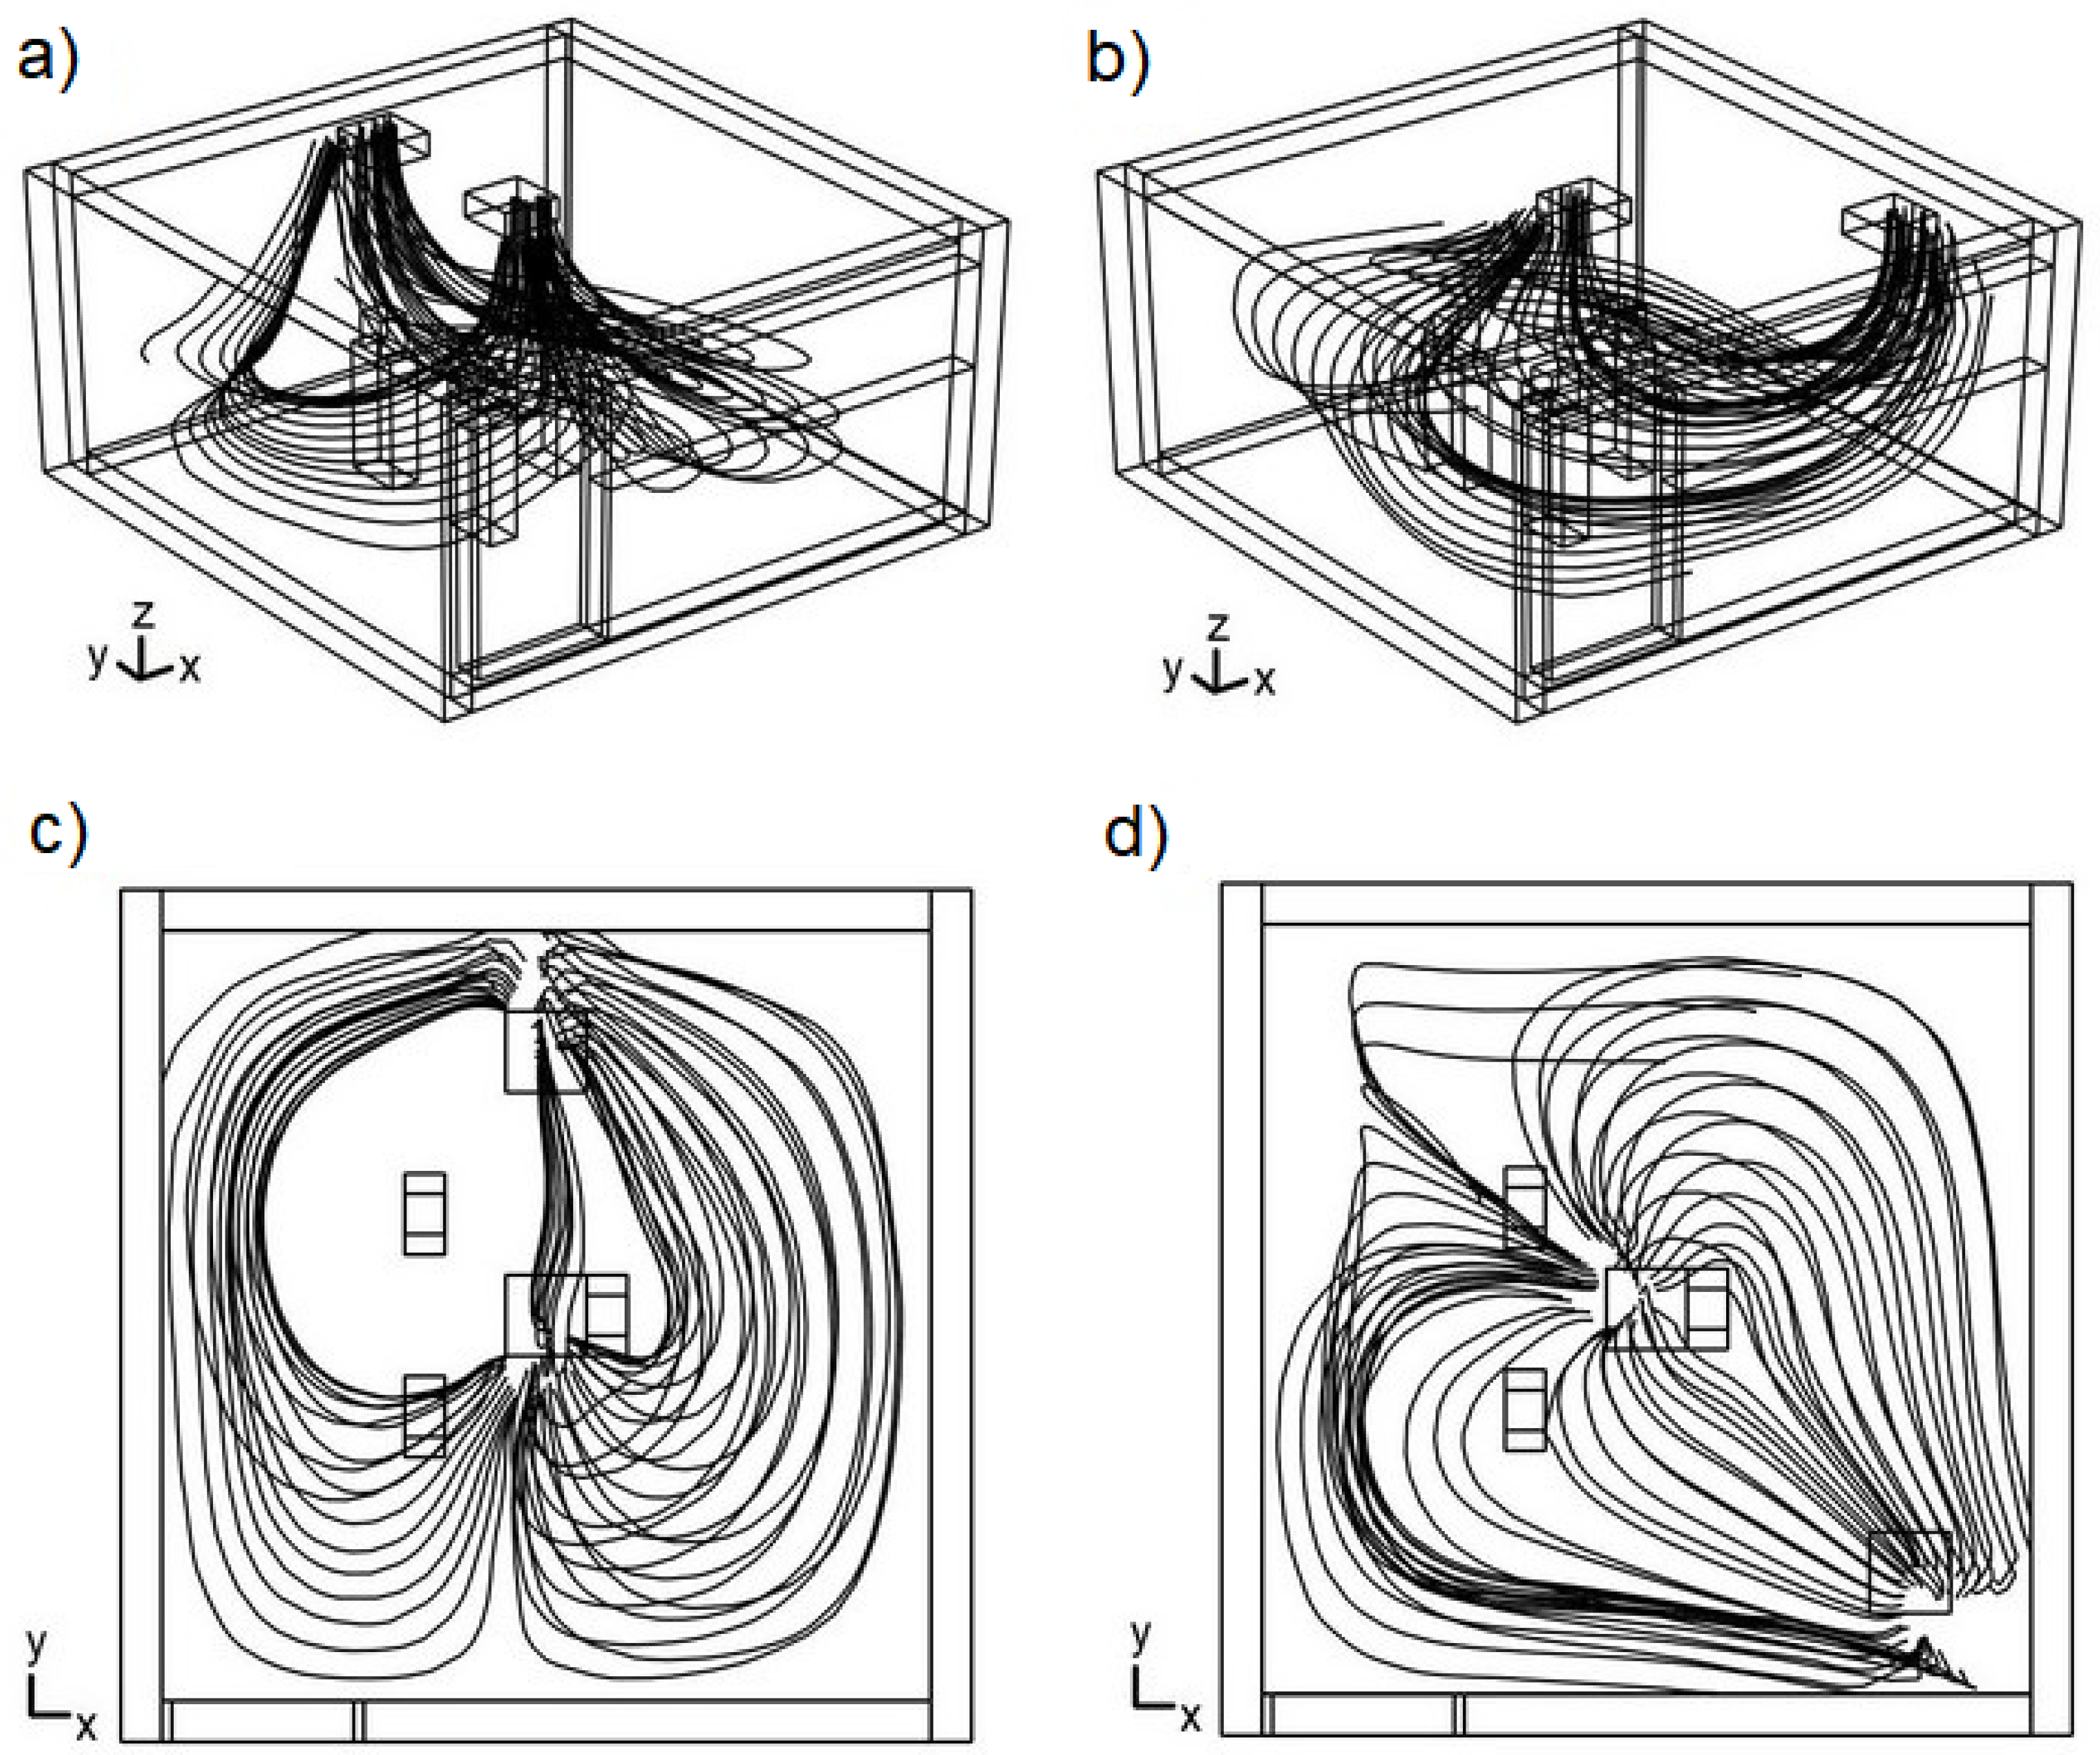
Figure 3 shows the streamlines for cases 3 and 6 when the number of people inside the office is three and the Reynolds number is 14,400.
Figure 3a depicts the streamlines when the air conditioning supply is on the ceiling and near the hot wall exposed to the outside environment. The air stream enters as a jet that moves vertically downward and then splits into two streams that move toward the north and south walls of the office, on which they move. Subsequently, they collide with the west wall, turn, and meet in the center to finally ascend toward the exhaust vent.
Figure 3b shows the flow pattern when the air conditioning inlet is in the southwest corner of the office; although not exposed to the sun, the west wall is exposed to the microclimate of the common indoor area without air conditioning. In this case, the jet of cold, clean air descends vertically from the southwest corner, splitting into an air stream that moves parallel to the south wall and another stream that moves parallel to the west wall. The stream that moves on the south wall collides with the east wall, while the stream that moves on the west wall collides with the north wall; finally, these streams turn toward the center and move upward to the exhaust vent.
Figure 3c,d are views of the streamlines in the XY plane for cases 3 and 6, respectively; they confirm the previously described trajectories. As can clearly be appreciated in case 3 (
Figure 3c), stagnant air zones are formed in the area where the three people are, which causes poor ventilation in the office.
Figure 3d shows that the jet of clean and cold air moves throughout the area where people are, optimizing the office’s aeration.
The different behaviors of flow patterns inside the office depend on the position of the air inlet and its interaction with the walls. In case 3, there is a strong temperature gradient between the east wall and the interior air that surrounds it; as a consequence, the air in contact with the hot east wall moves upward due to the change in its density, while the flow that is injected from the air conditioning system moves in the opposite direction, that is, downward. These opposite behaviors in the direction of the flows have an adverse effect on air mobility. In case 6, there is a weak temperature gradient between the west wall and the indoor air because the west wall is not exposed to the sun but to the common space without air conditioning. Although the flows are still opposed to each other because the west wall is slightly warmer than the interior air, the adverse effect in case 6 is much less intense, facilitating air mobility.
3.2. Heat Transfer Modeling
Understanding how thermal loads disperse their energy inside a climate-controlled space is critical to achieving thermal comfort uniformly throughout the space. In this study, cold air is supplied from different positions on the ceiling of an office at a temperature of 22 °C.
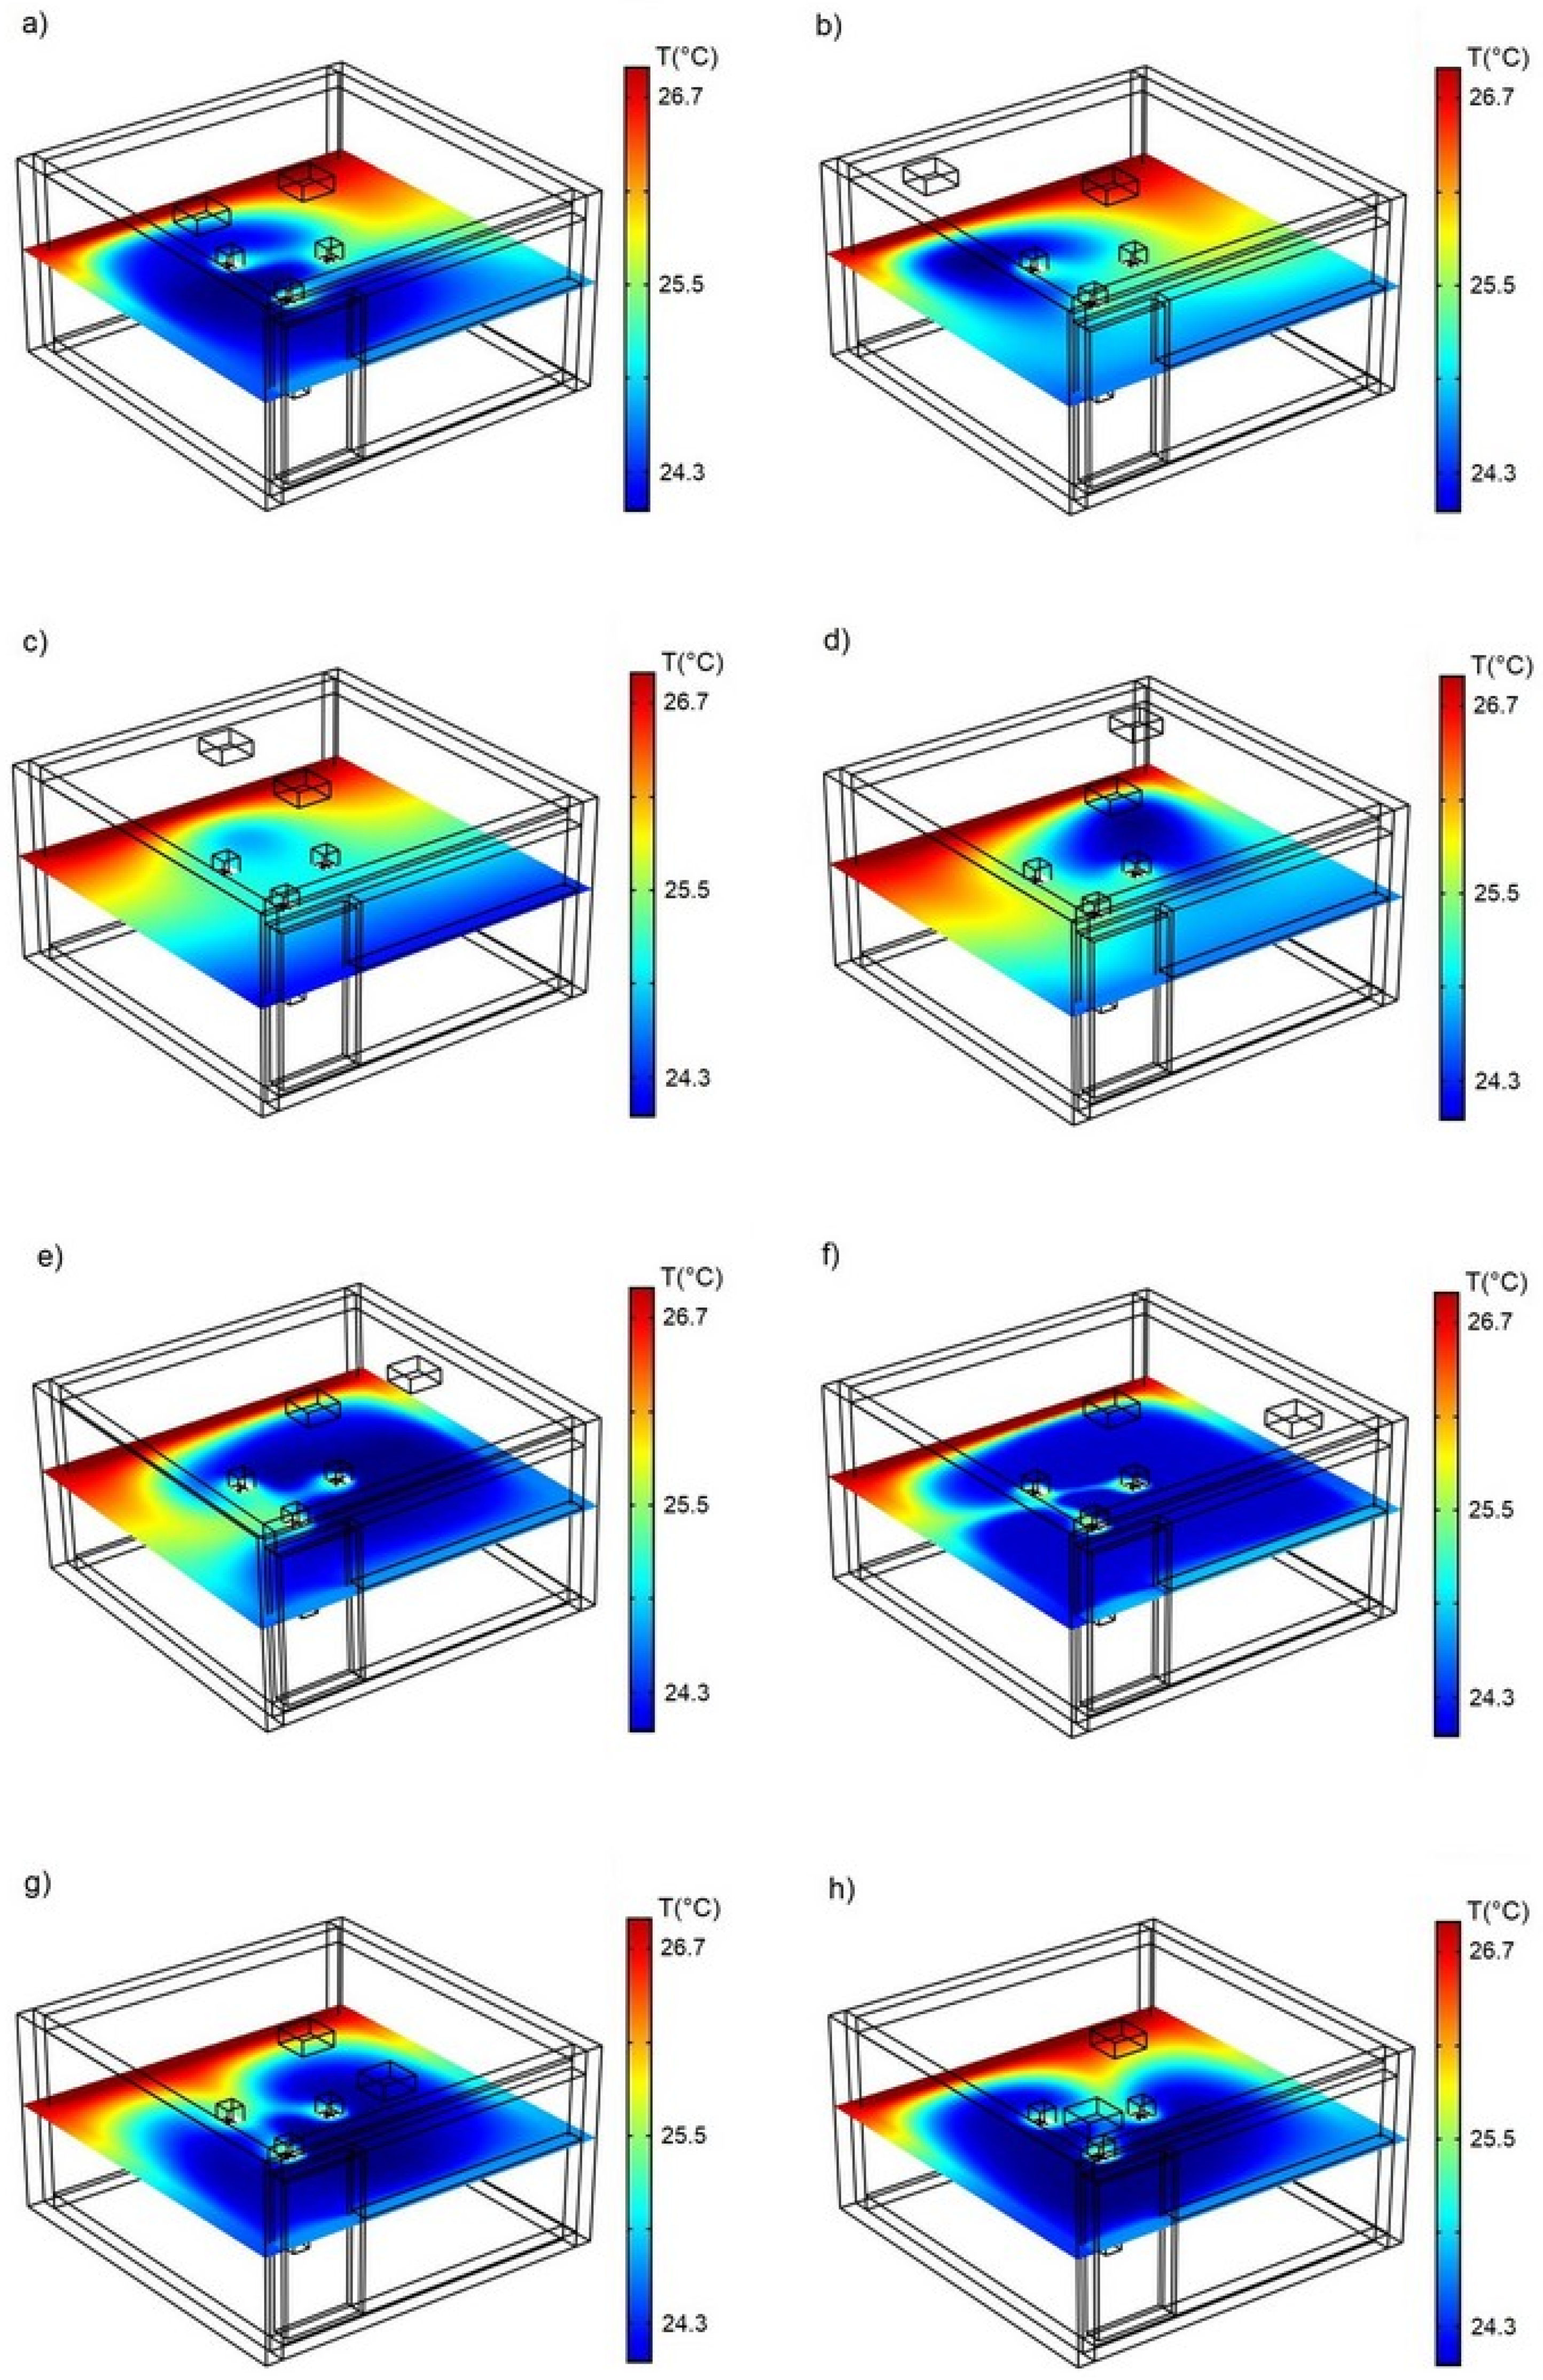
Figure 4 shows temperature fields for different air conditioning inlet positions considering three people inside the office and a Re = 14,400. The east wall of the office is hot in all cases because it is exposed to direct sunlight most of the day. The size of the hot zone changes depending on the position of the air inlet; the coldest zone is located just below the air conditioning inlet. When the cold air inlet is close to the hot wall, as in cases 1–5 (see
Figure 4a–e), the hot zone tends to extend toward the center of the office. This is due to two mechanisms: first, the effect of the opposition between the air conditioning jet, which moves downward, and the upward movement of the thermal plume generated by the hot wall, which causes the formation of hot spots of stagnant air; and second, because the cold jet initially moves on the hot wall, removing heat and transporting that energy to the center of the office. On the other hand, the cold region tends to extend when the cold air is injected from a position close to the west wall, which has a much lower temperature than the opposite wall, as in cases 6–8 (see
Figure 4f–h). Due to the above, the adverse effect of opposing airflows is negligible, improving the distribution of cold air.
In these cases (
Figure 4), extensive air zones with temperatures below 24.9 °C are observed around the people inside the office. This value is within the thermal comfort range between 24 °C and 26 °C. The worst configuration is that of case 3, when the air inlet is near the middle of the east wall, because that location results in poor air circulation. The best configuration is that of case 6, when the air inlet is located in the southwest corner. This position is favorable for airflow.
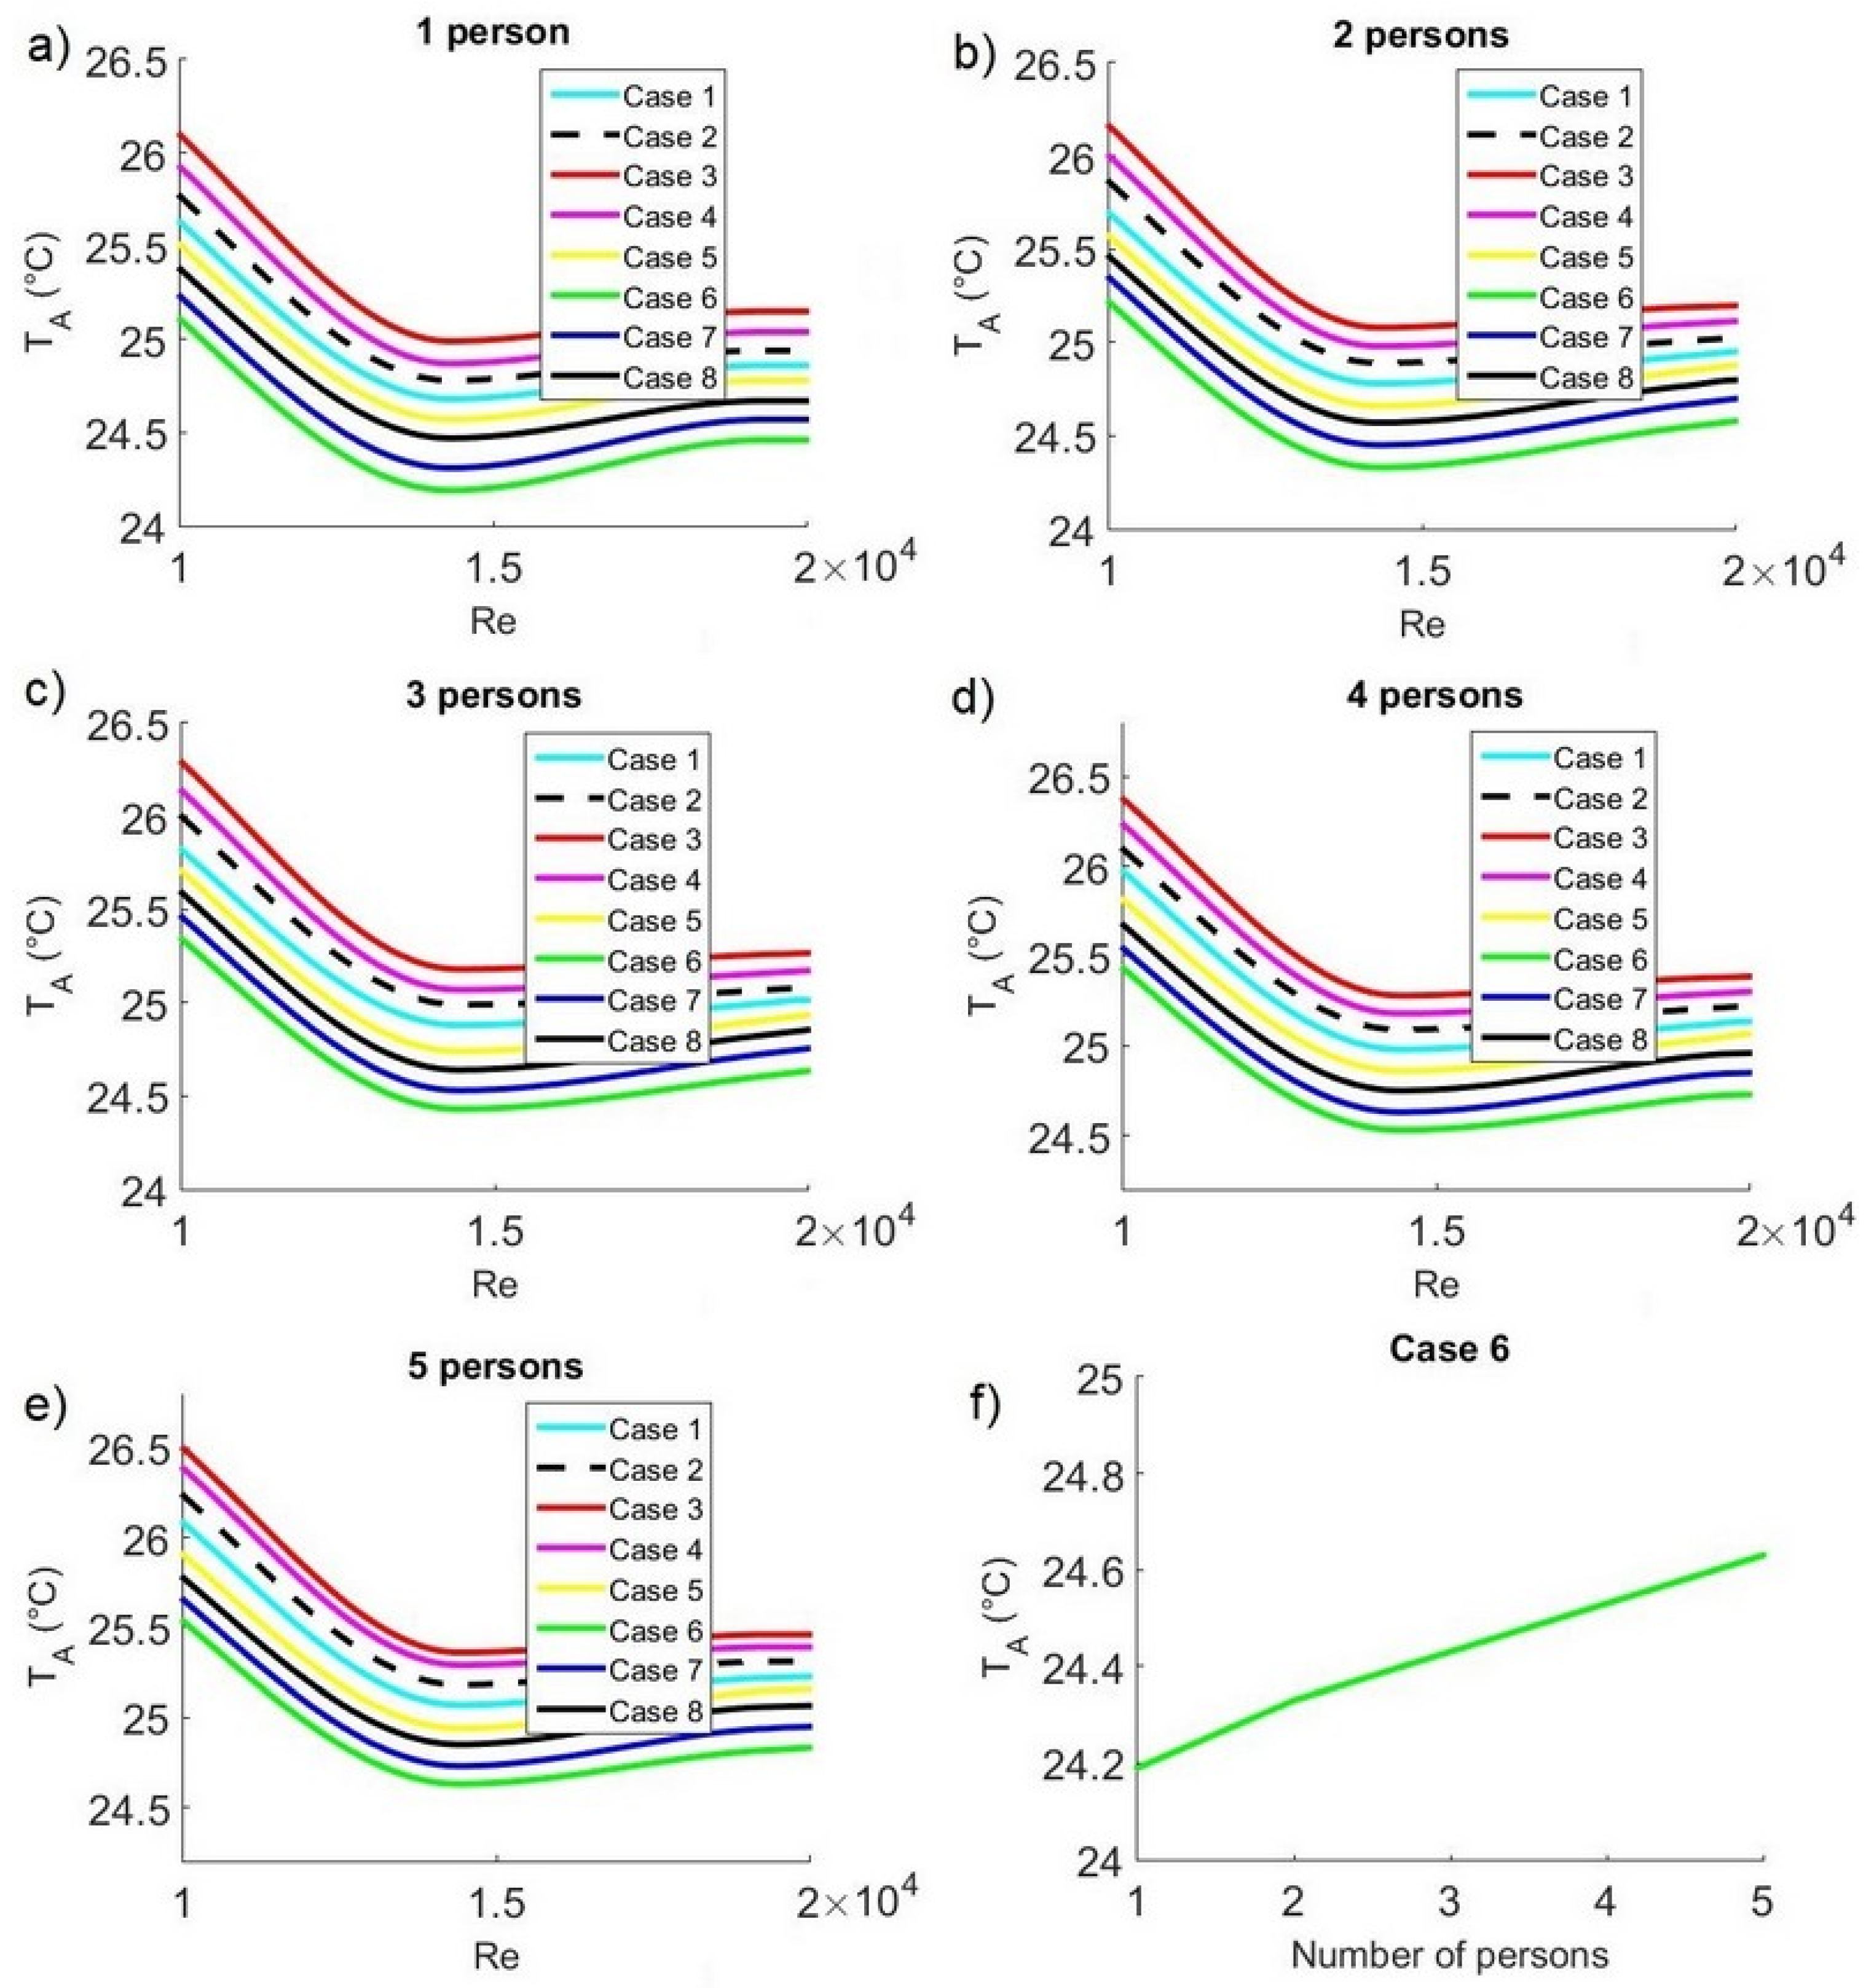
Figure 5 shows the average temperatures inside the office when the number of people inside is one to five; the range of Reynolds numbers analyzed is from 10,000 to 20,000. Regarding the number of people, the lowest average temperatures are observed in case 6, that is, when the air conditioning supply is in the southwest corner. On the other hand, the worst configuration, resulting in the highest temperature, is when the air conditioning supply is located in the middle of the east wall (case 3). As for the Reynolds number, the average temperature tends to decrease as the Reynolds number increases until it reaches a minimum value, and then a slight increase follows. The minimum average temperatures for one and two people are obtained when Re = 14,300 (see
Figure 5a,b), while for three to five people, the minimum values occur for Re = 14,400 (see
Figure 5c–e). It is important to note that, for case 6, the minimum values of the average temperature are between 24.19 °C (one person) and 24.63 °C (five people), which is within the range of thermal comfort, as shown in
Figure 5f. The highest (unfavorable) average temperature values are obtained with Re = 10,000: for one person, T
A = 26.09 °C, while for five people, T
A = 26.49 °C.
3.3. Mass Transport Study
Cleaning the air in closed spaces, such as professors’ offices, represents a tough challenge in hot regions such as Veracruz, Mexico, since doors and windows remain closed when people are working to avoid external distractors such as noise, but also as a protection from the intense heat of the outside environment. Therefore, it is extremely important to understand the mechanisms that help to reduce pollutants inside closed spaces. In this study, a stream of clean air is injected from the ceiling. The CO2 concentration of this air is 340 ppm, and our purpose is to analyze possible configurations to ensure adequate air ventilation.
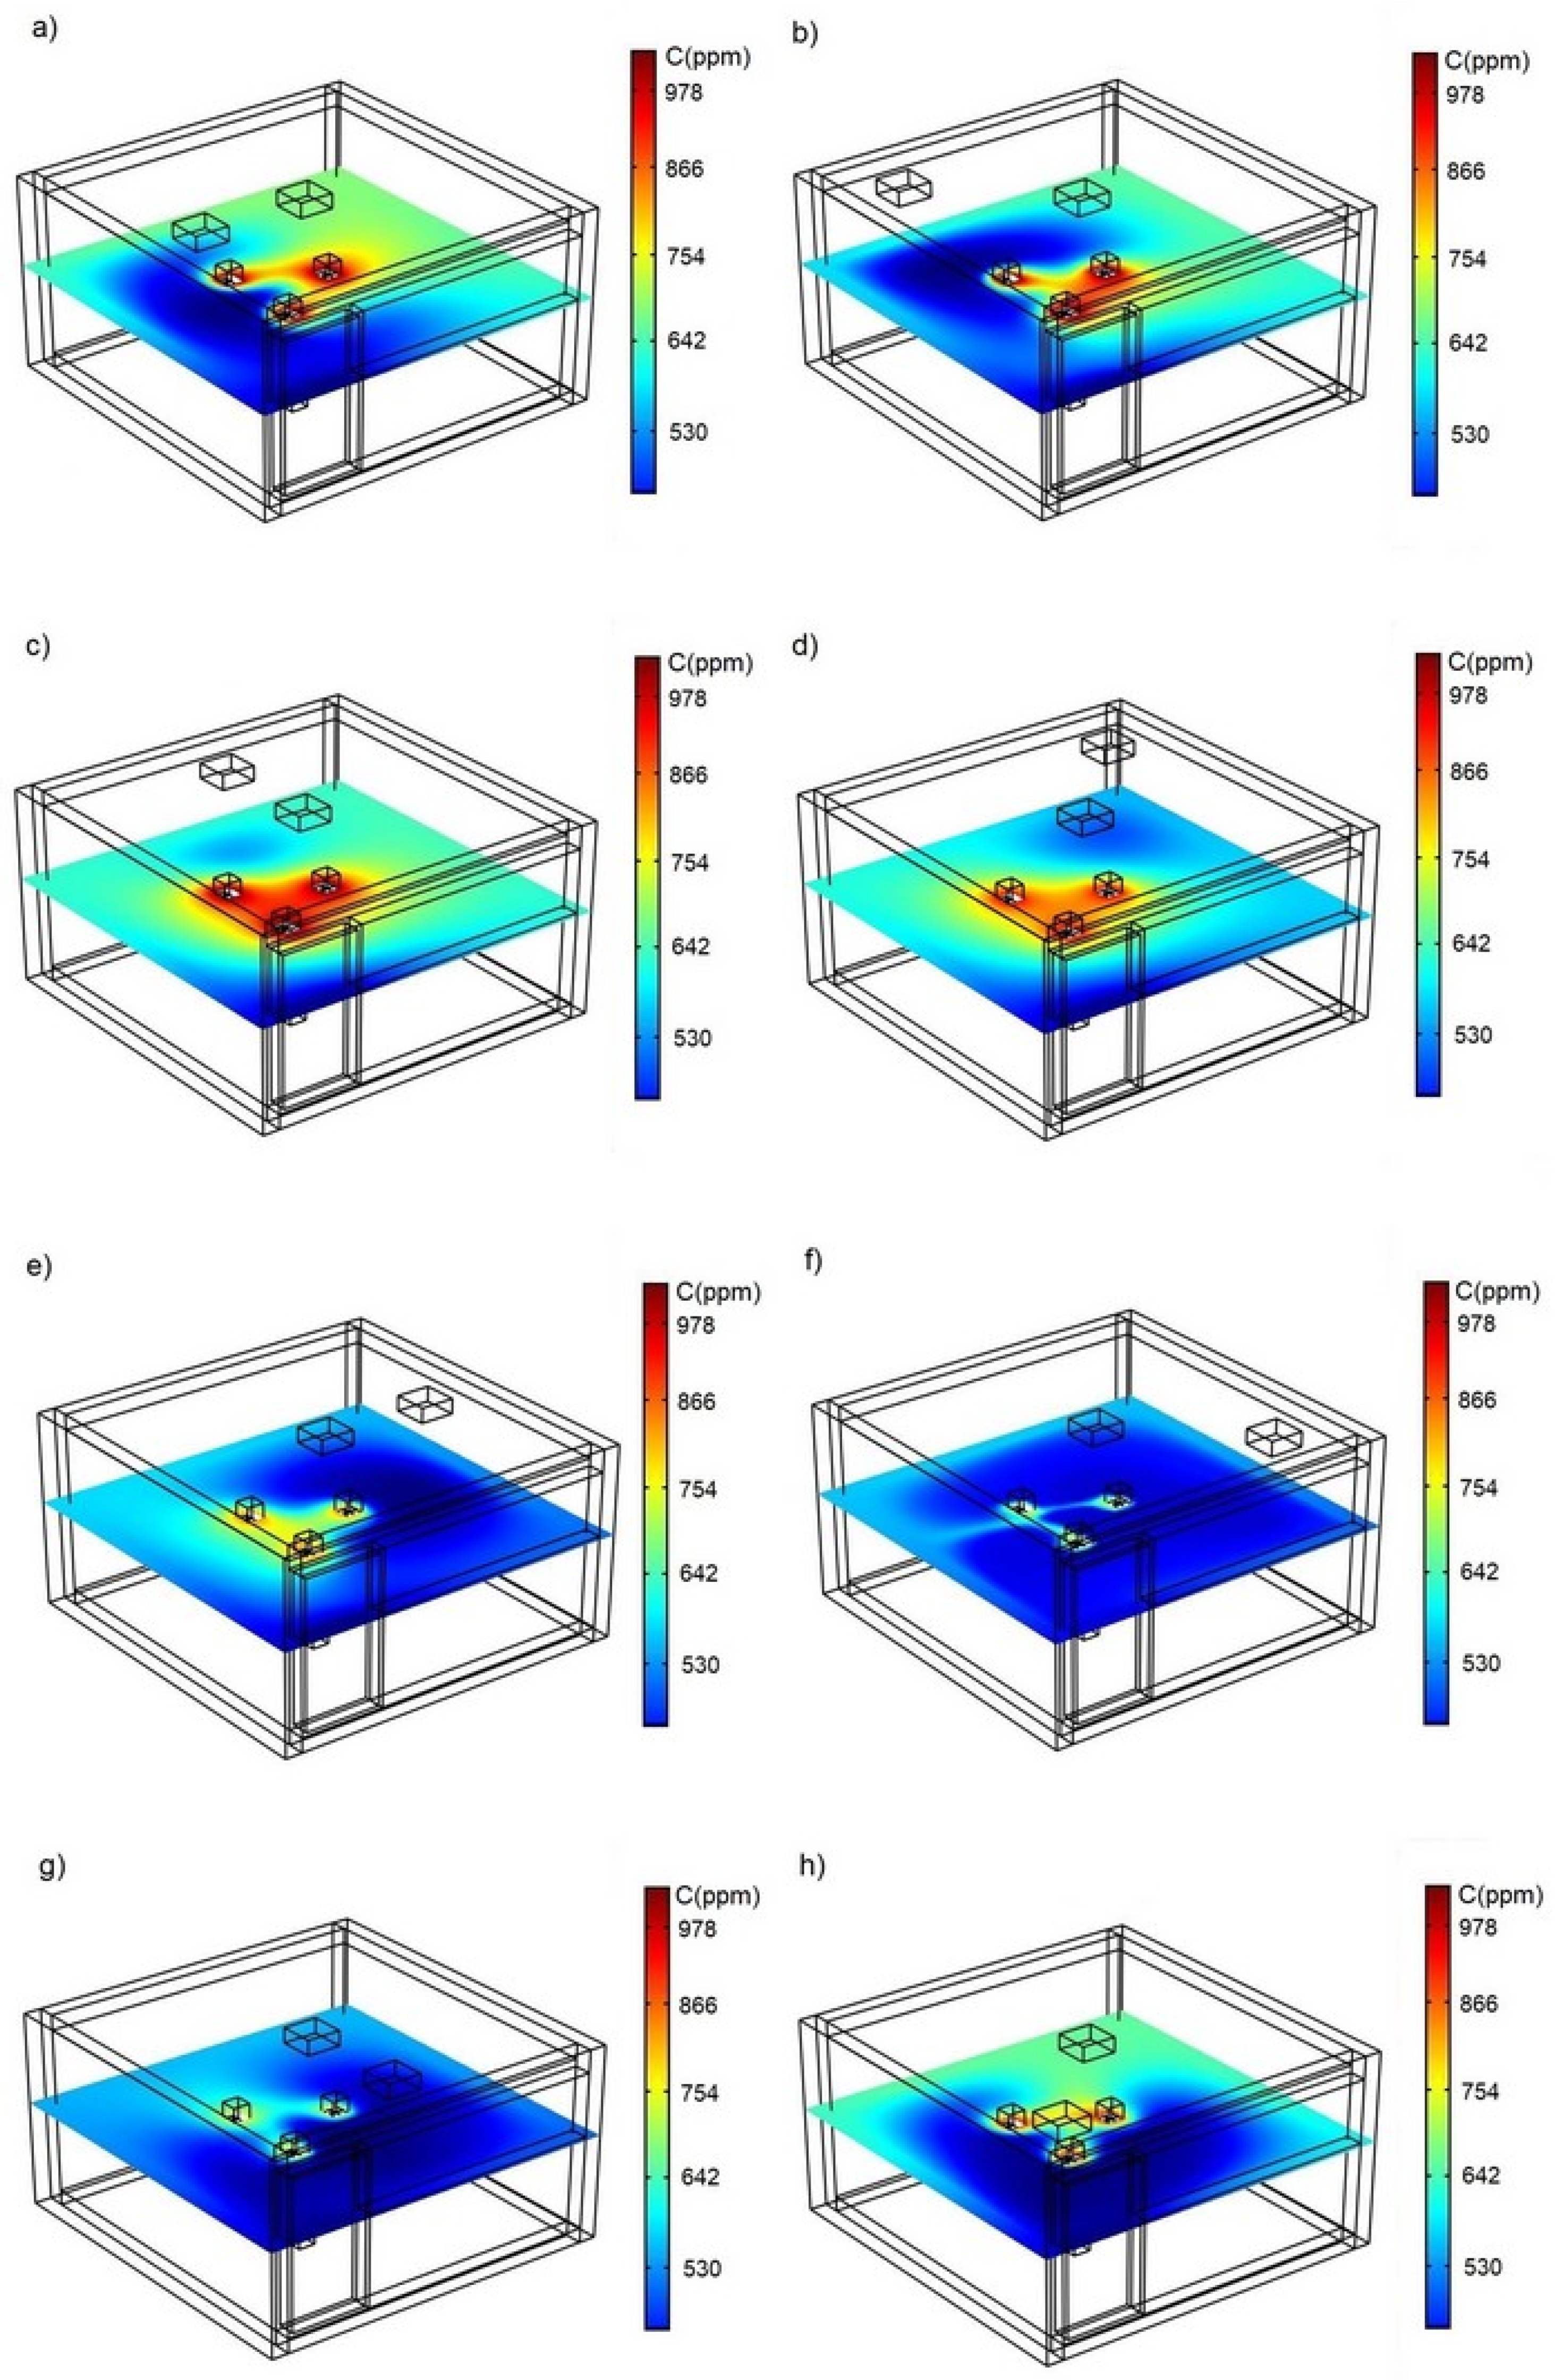
Figure 6 shows the CO
2 concentration fields for different air conditioning inlet positions in the office with three people and Re = 14,400. When the air conditioning inlet is in a position close to the hot wall located to the east, as in cases 2–4 (see
Figure 6b–d), the space is inadequately ventilated since areas where CO
2 concentrations are above 700 ppm occur around people. On the other hand, as the air inlets move inward, the conditions in terms of air cleanliness begin to improve, as in cases 1 and 5 (see
Figure 6a,e). The most favorable conditions take place when the air conditioning flow inlets are on the west wall, which is not exposed to the sun, as in cases 6–8 (see
Figure 6f–h). In these cases, large areas with concentrations below 700 ppm can be observed, which ensures that people inside the office have adequate air quality. Case 3 is associated with the most unfavorable ventilation, with the air inlet in the middle of the east wall. The best possible ventilation is observed in case 6, when the air inlet is located in the southwest corner.
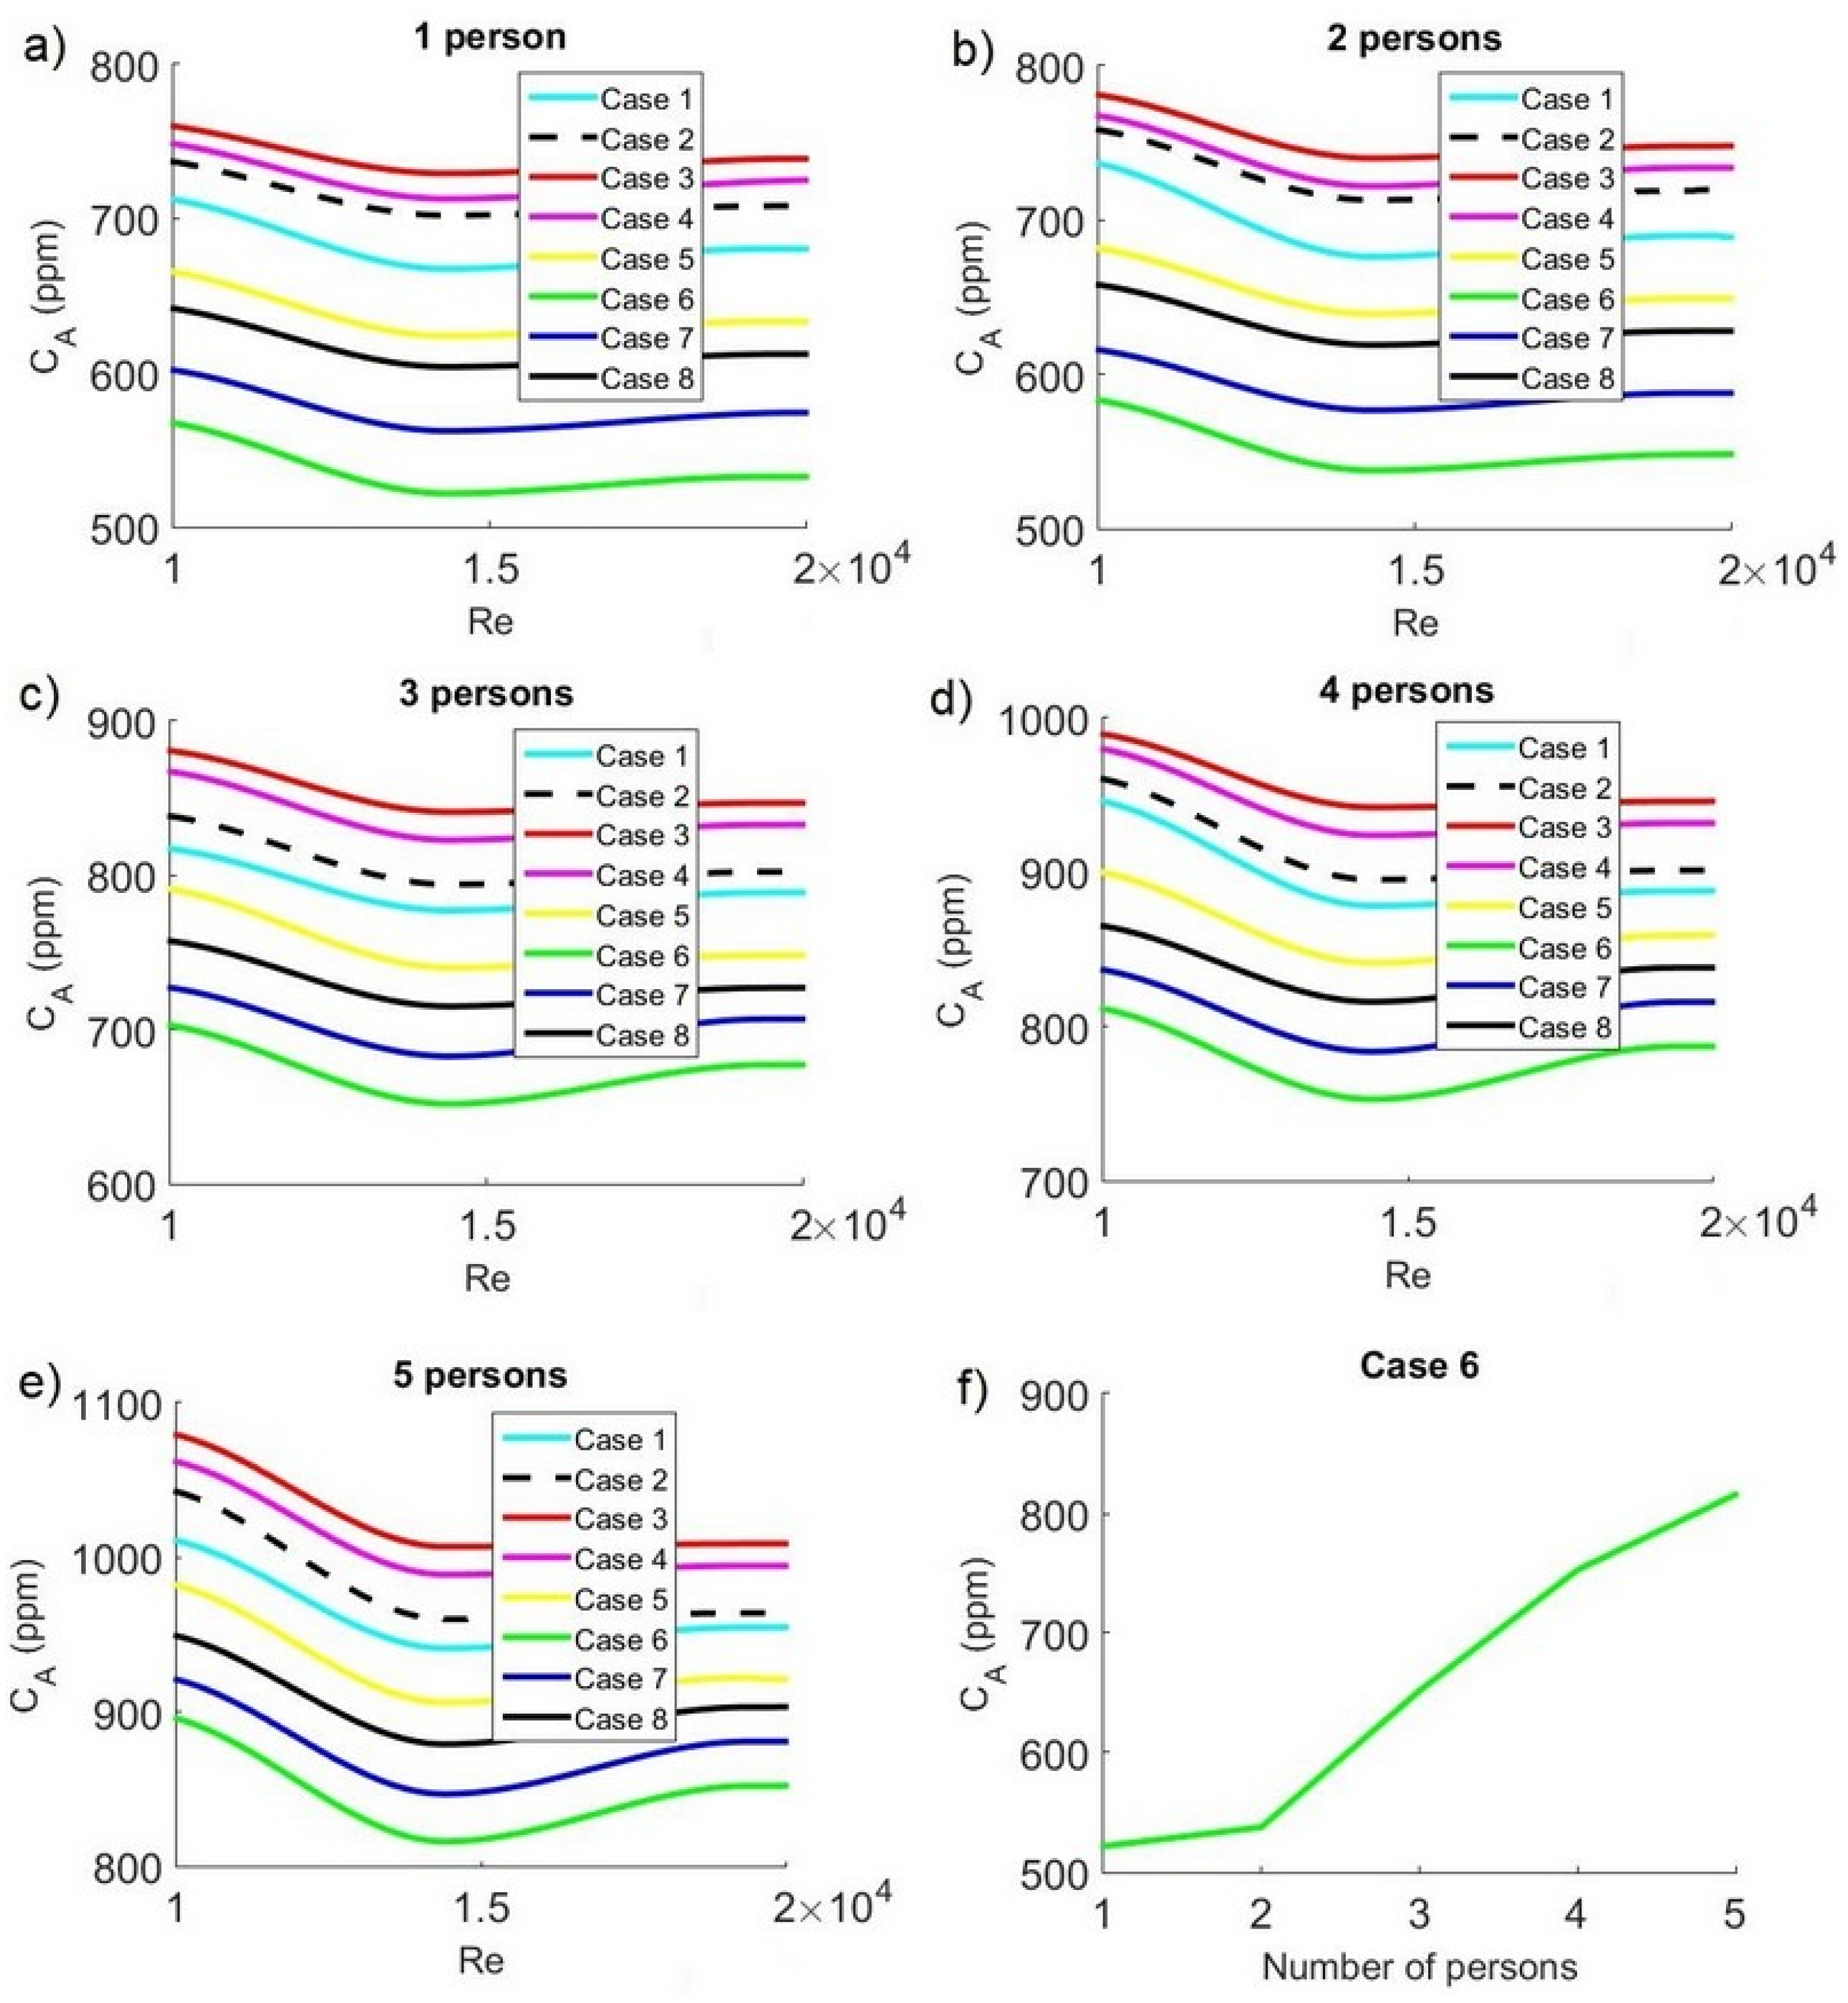
The average concentration as a function of Reynolds number for different air conditioning supply positions and different numbers of people is given in
Figure 7. In general, it can be observed that the lowest CO
2 concentration occurs in case 6, while the highest CO
2 concentration occurs in case 3. Pollutant concentration profiles indicate that the value decreases as the Reynolds number increases; after reaching a minimum, concentration begins to increase regardless of the number of people inside the office. For one and two people, the lowest CO
2 concentration value is attained when Re = 14,300 (see
Figure 7a,b). For three to five people, the lowest CO
2 concentration takes place when Re = 14,400 (see
Figure 7c–e). For one to three people, the minimum CO
2 values attained in case 6 are within a standard range since concentrations are below 700 ppm. For one person, C
A = 521.77 ppm, for two people, C
A = 537.74 ppm, and for three people, C
A = 651.80 ppm. When the number of people increases to four or five, the minimum concentrations are C
A = 752.84 ppm and C
A = 815.90 ppm, respectively. Therefore, these last two cases fail to meet the standard.
Figure 7f shows the behavior of the minimum average air concentration for case 3, confirming that the air quality deteriorates with four or five people inside the office.
The study of the velocity, temperature, and concentration fields for various cases in which the location of the air conditioning inlet is varied shows that placing it away from hot walls improves thermal comfort and CO2 concentrations.
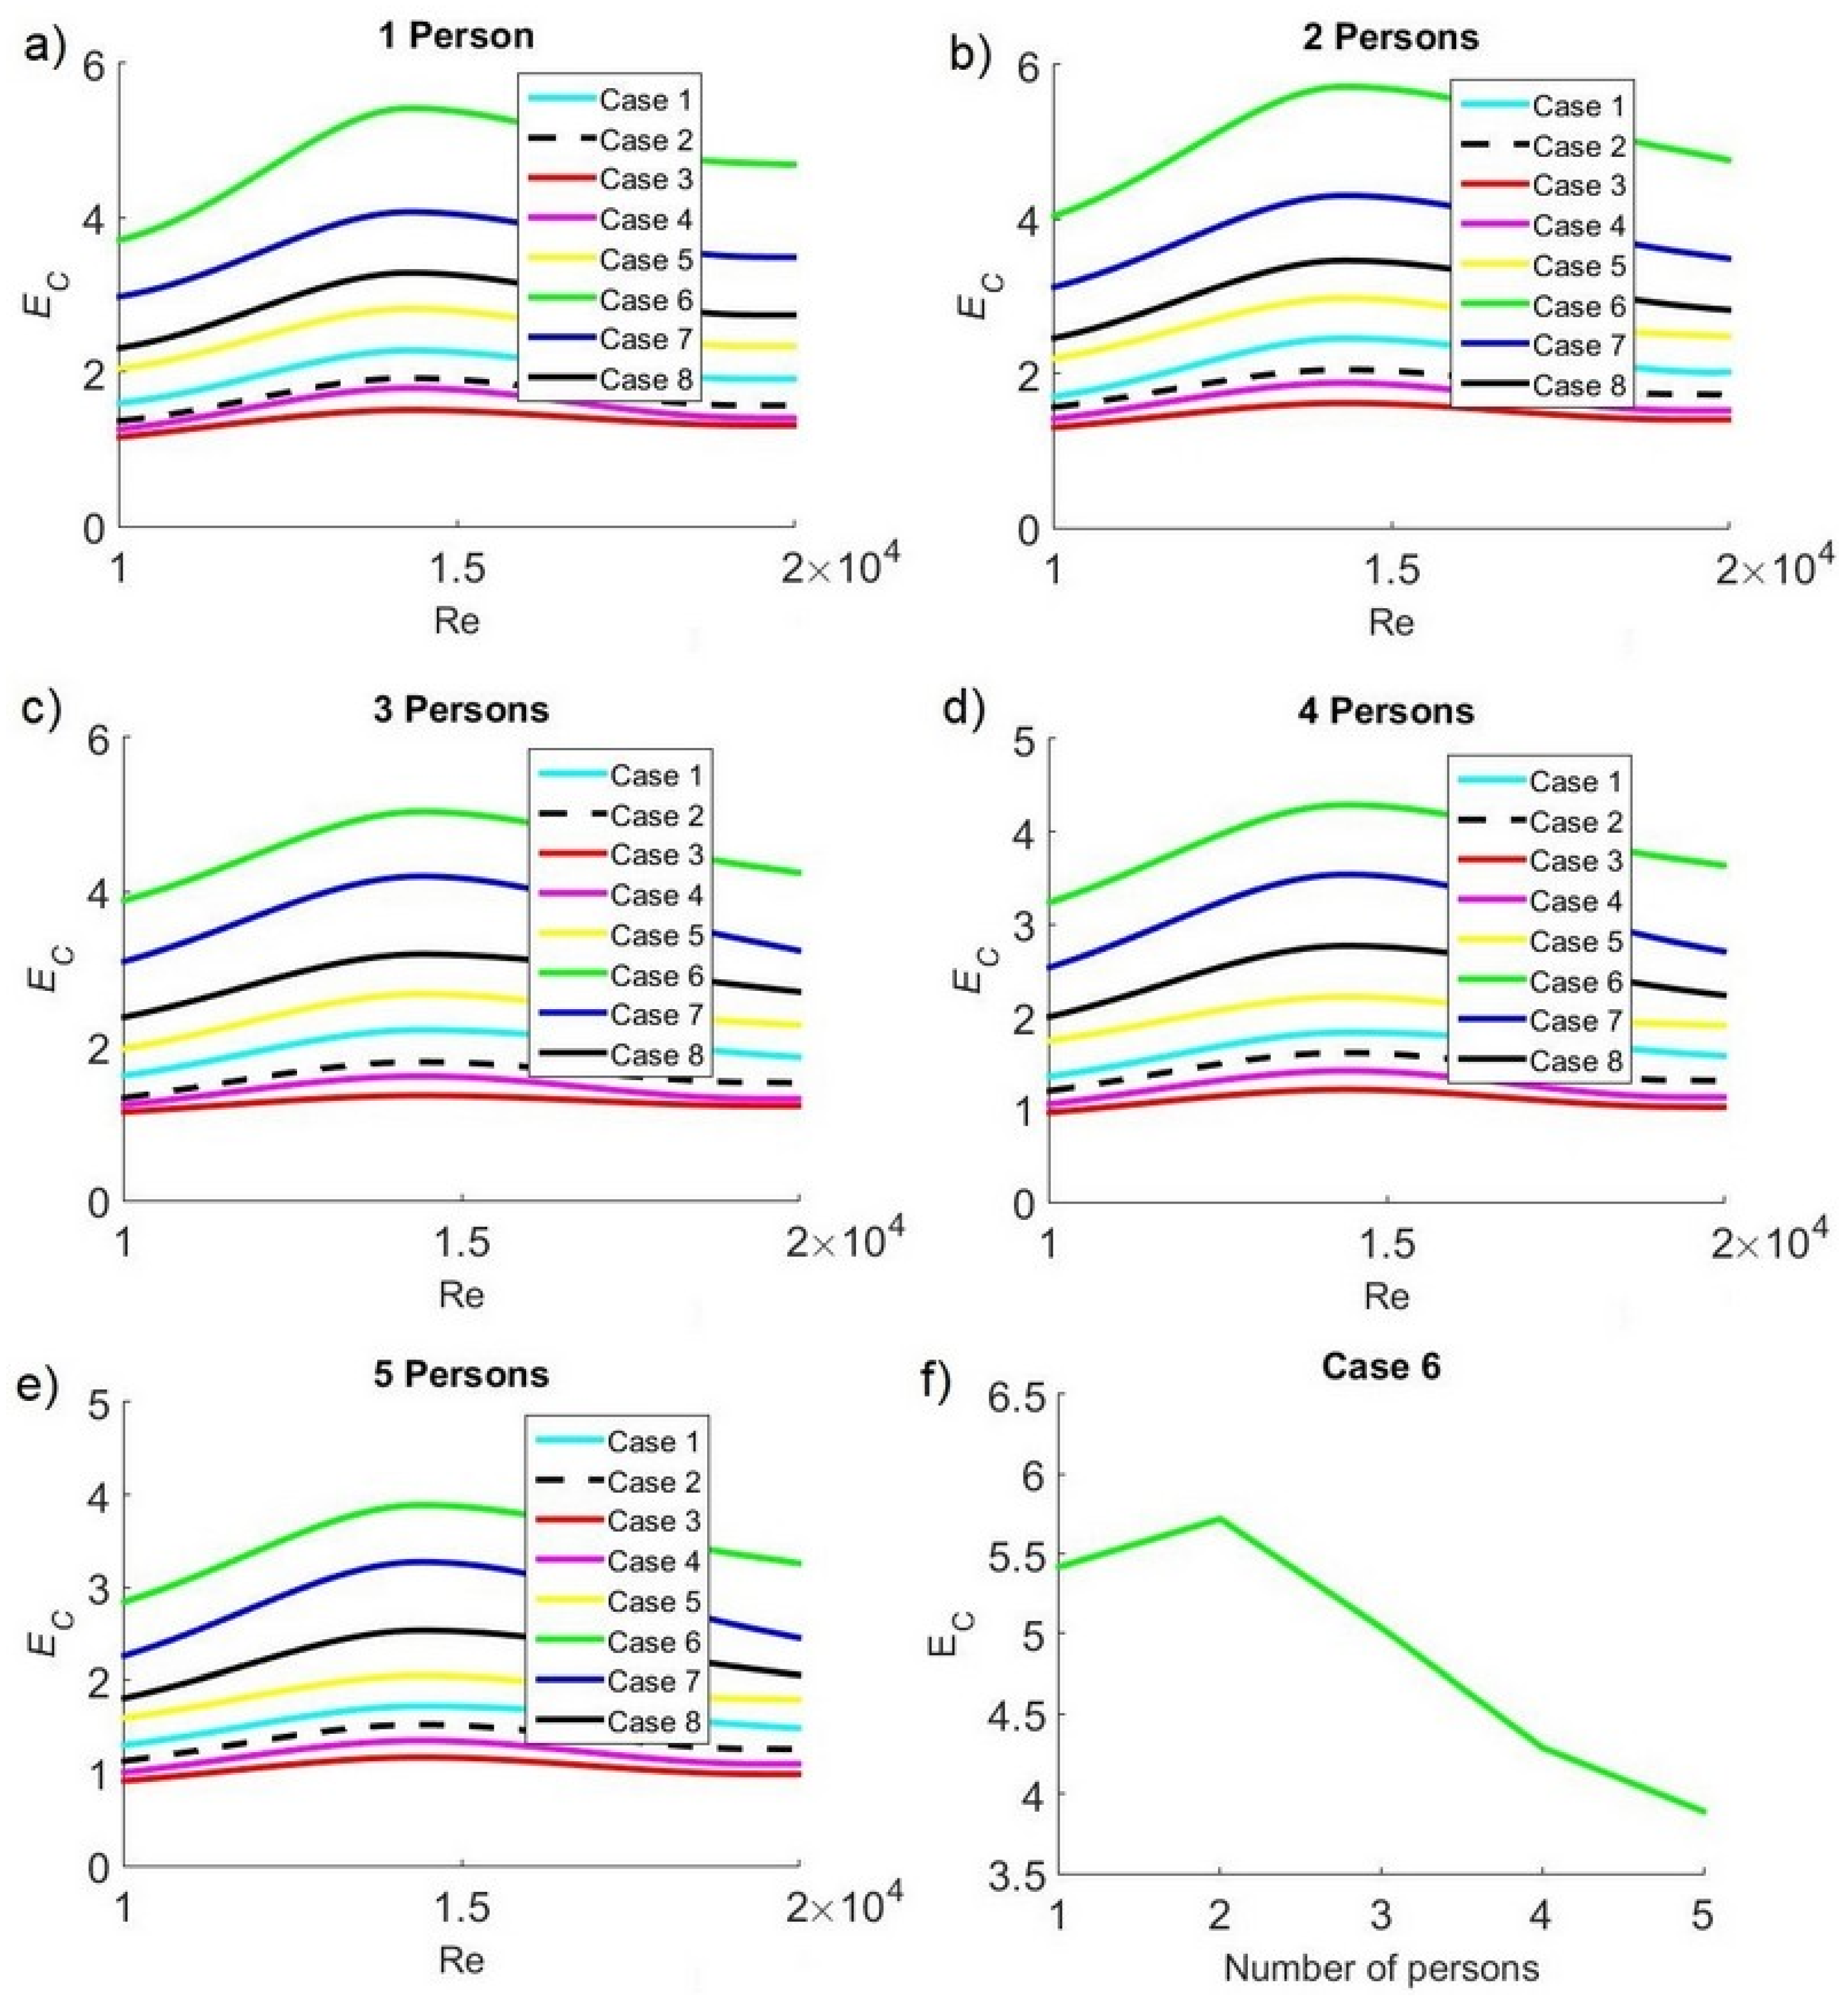
3.4. Ventilation Performance Analysis
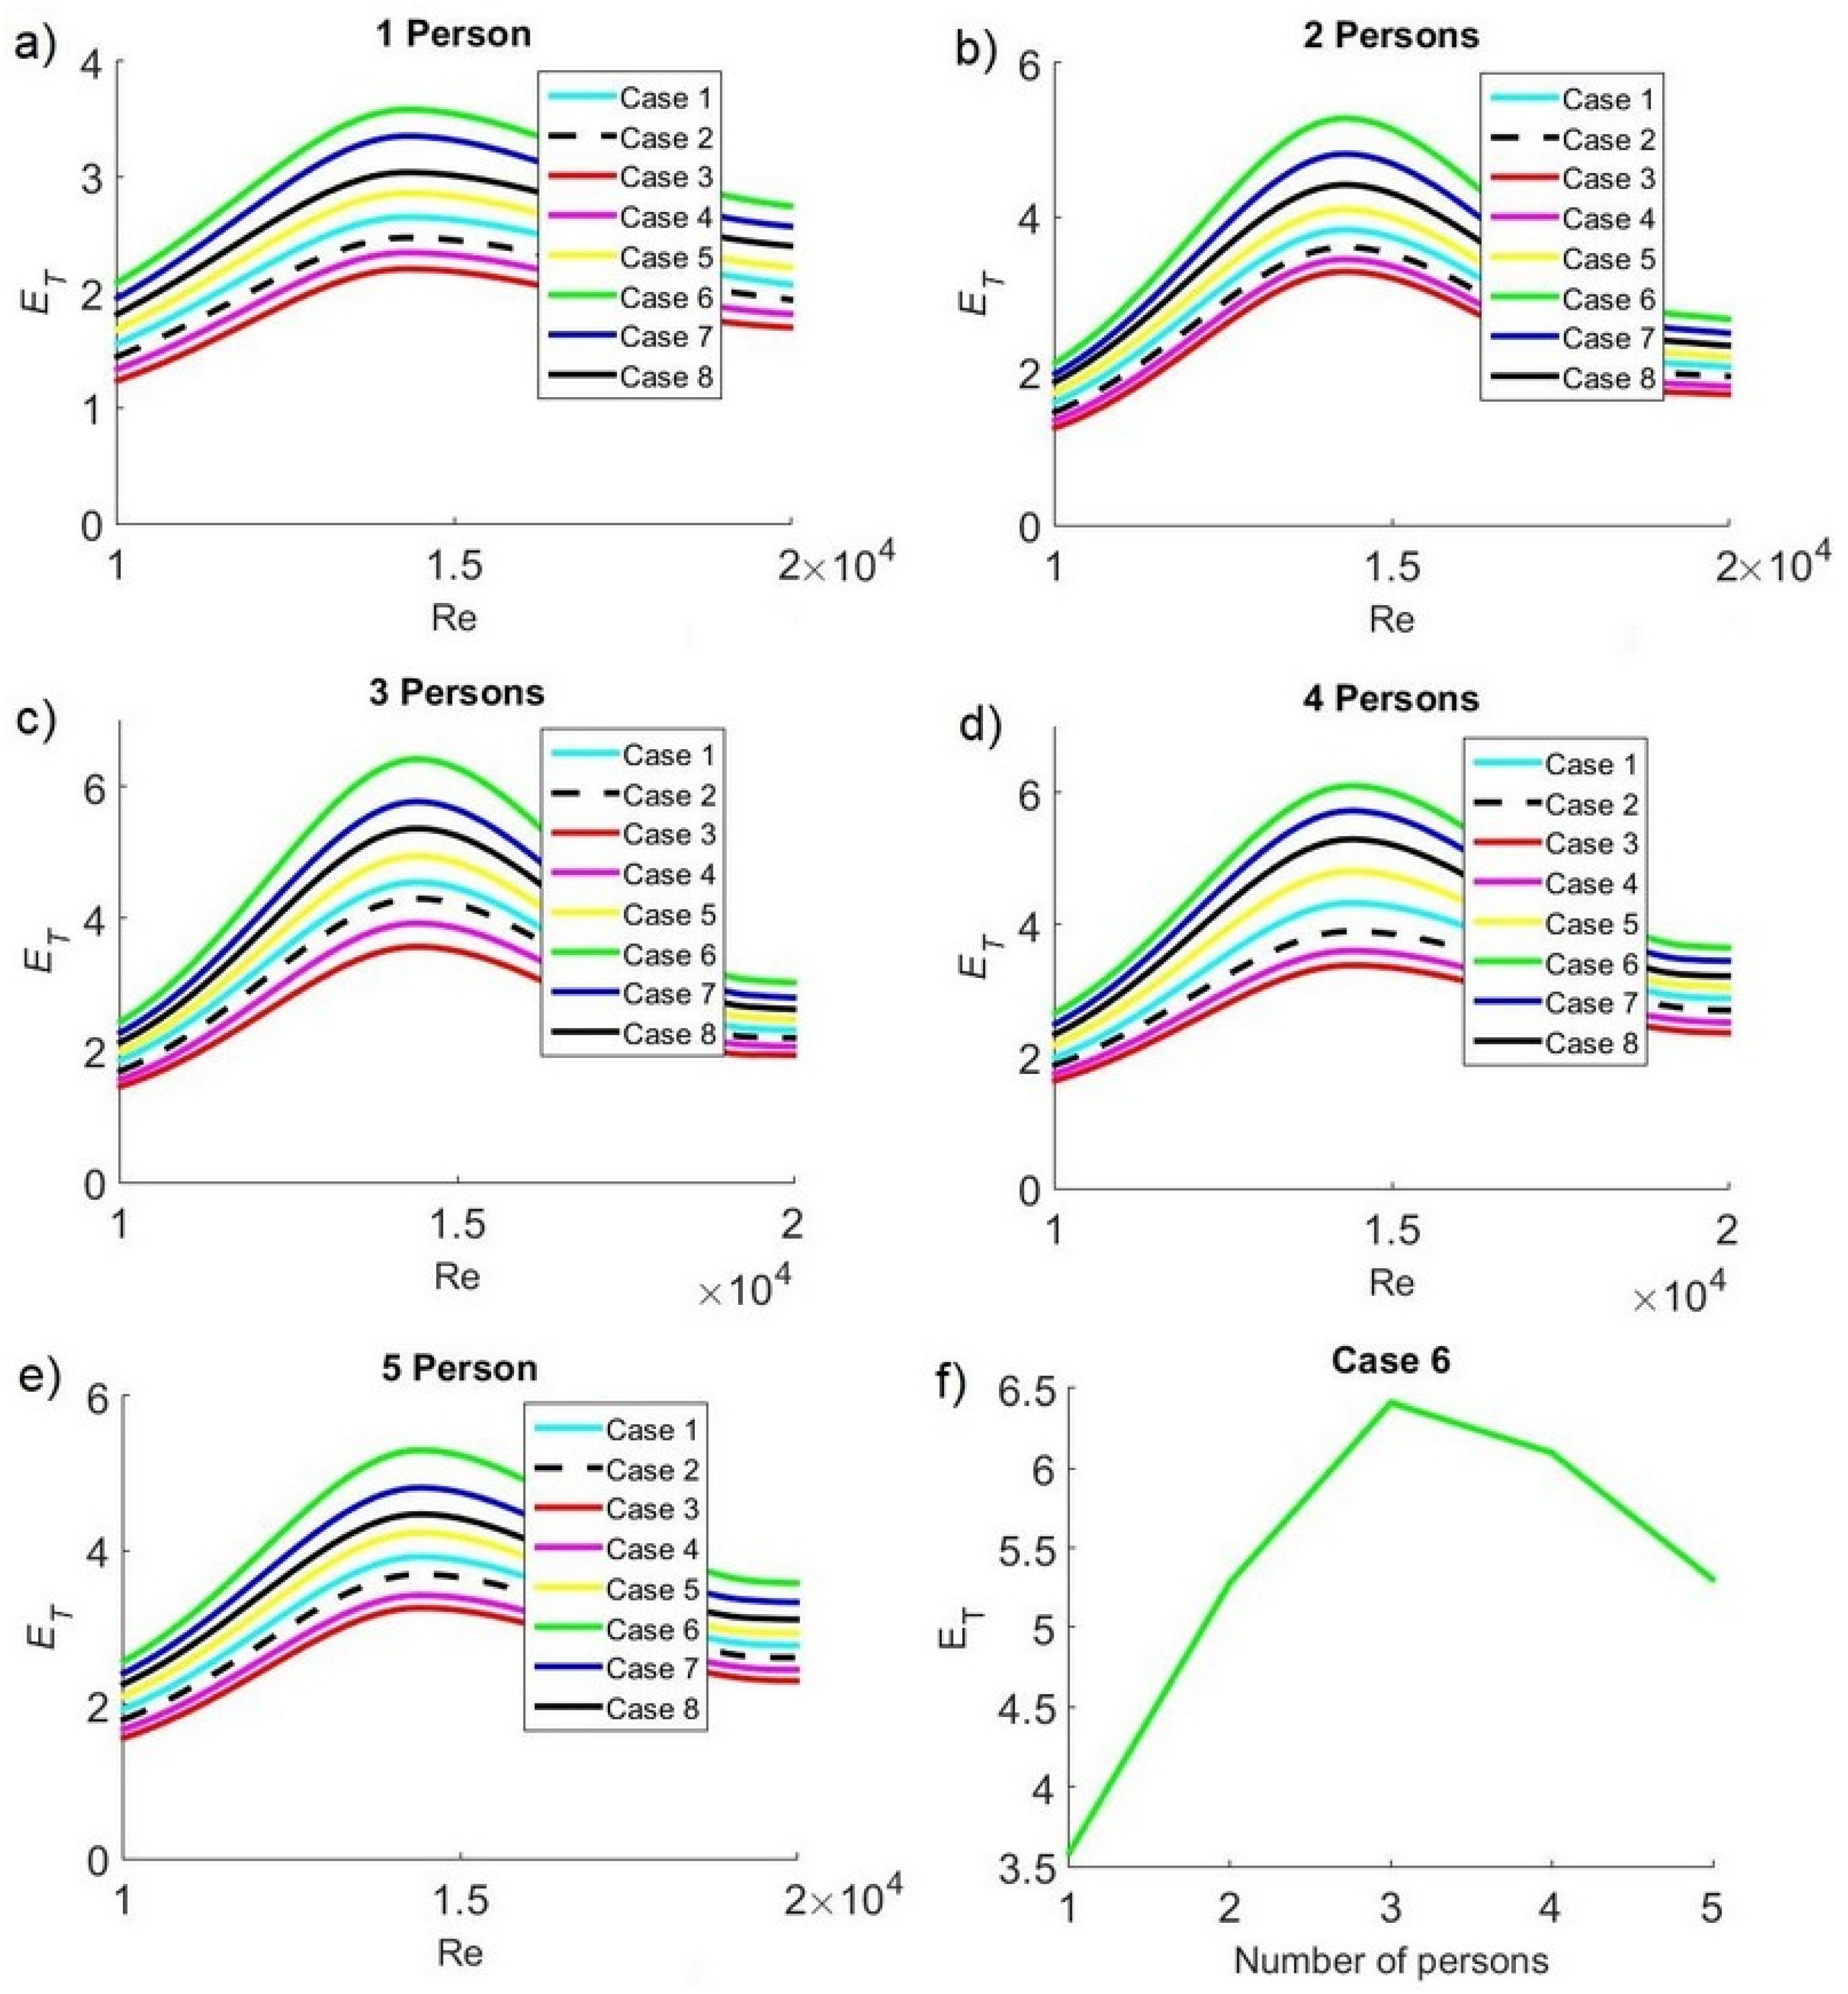
Figure 8 shows the temperature distribution effectiveness (E
T) for the different cases. This parameter indicates how uniform the temperature is inside the office. The higher the E
T, the more uniform the temperature distribution. For a particular number of people, effectiveness increases with the Reynolds number, reaches its maximum value, and then decreases. The highest effectiveness is obtained in case 6, while the lowest effectiveness occurs in case 3. Regarding the Reynolds number, the best temperature distribution inside the space is attained when Re = 14,300 for one and two people (see
Figure 8a,b). However, for three to five people, the most favorable temperature distribution occurs when Re = 14,400 (see
Figure 8c–e).
Figure 8f shows the temperature effectiveness values as a function of number of people. For the conditions under study, the maximum value is 6.41 for three people, case 6, when Re = 14,400.
It is not only important that the average CO
2 concentration inside a space be low, but it must also be guaranteed that this low pollutant concentration is uniform throughout the space, that is, that there are no areas with high CO
2 concentration peaks. The parameter that allows measuring the uniformity of the pollutant’s concentration value is concentration distribution effectiveness (E
C). As shown in
Figure 9, clean air is distributed more uniformly in case 6, while this uniformity is lost as the air conditioning supply is placed closer to the hot wall, reaching its worst value for case 3. Another parameter affecting air cleanliness inside the space is the velocity with which the conditioned air is supplied. Effectiveness increases after Re = 10,000 until a maximum value and then decreases. The increase in effectiveness is more intense when the cold air supply is placed opposite the hot wall. For one and two people (see
Figure 9a,b), the best clean air distribution is obtained with Re = 14,300. For three to five people (see
Figure 9c–e), clean air is more evenly distributed when Re = 14,400. The worst clean air distribution values occur when Re = 10,000, which is due to the fact that the air movement is not intense enough to guarantee uniformity. The behavior of maximum concentration effectiveness as a function of the number of people for case 6 is shown in
Figure 9f; for the operating conditions of the air conditioning system studied, the best contaminant distribution uniformities occur for one and two people. For larger numbers of people, E
C begins to decline.
The analysis of the average temperature and concentration profiles, as well as the temperature and concentration distribution effectiveness, shows that the velocity of the air conditioning inlet and its position have a decisive influence on achieving adequate ventilation conditions.
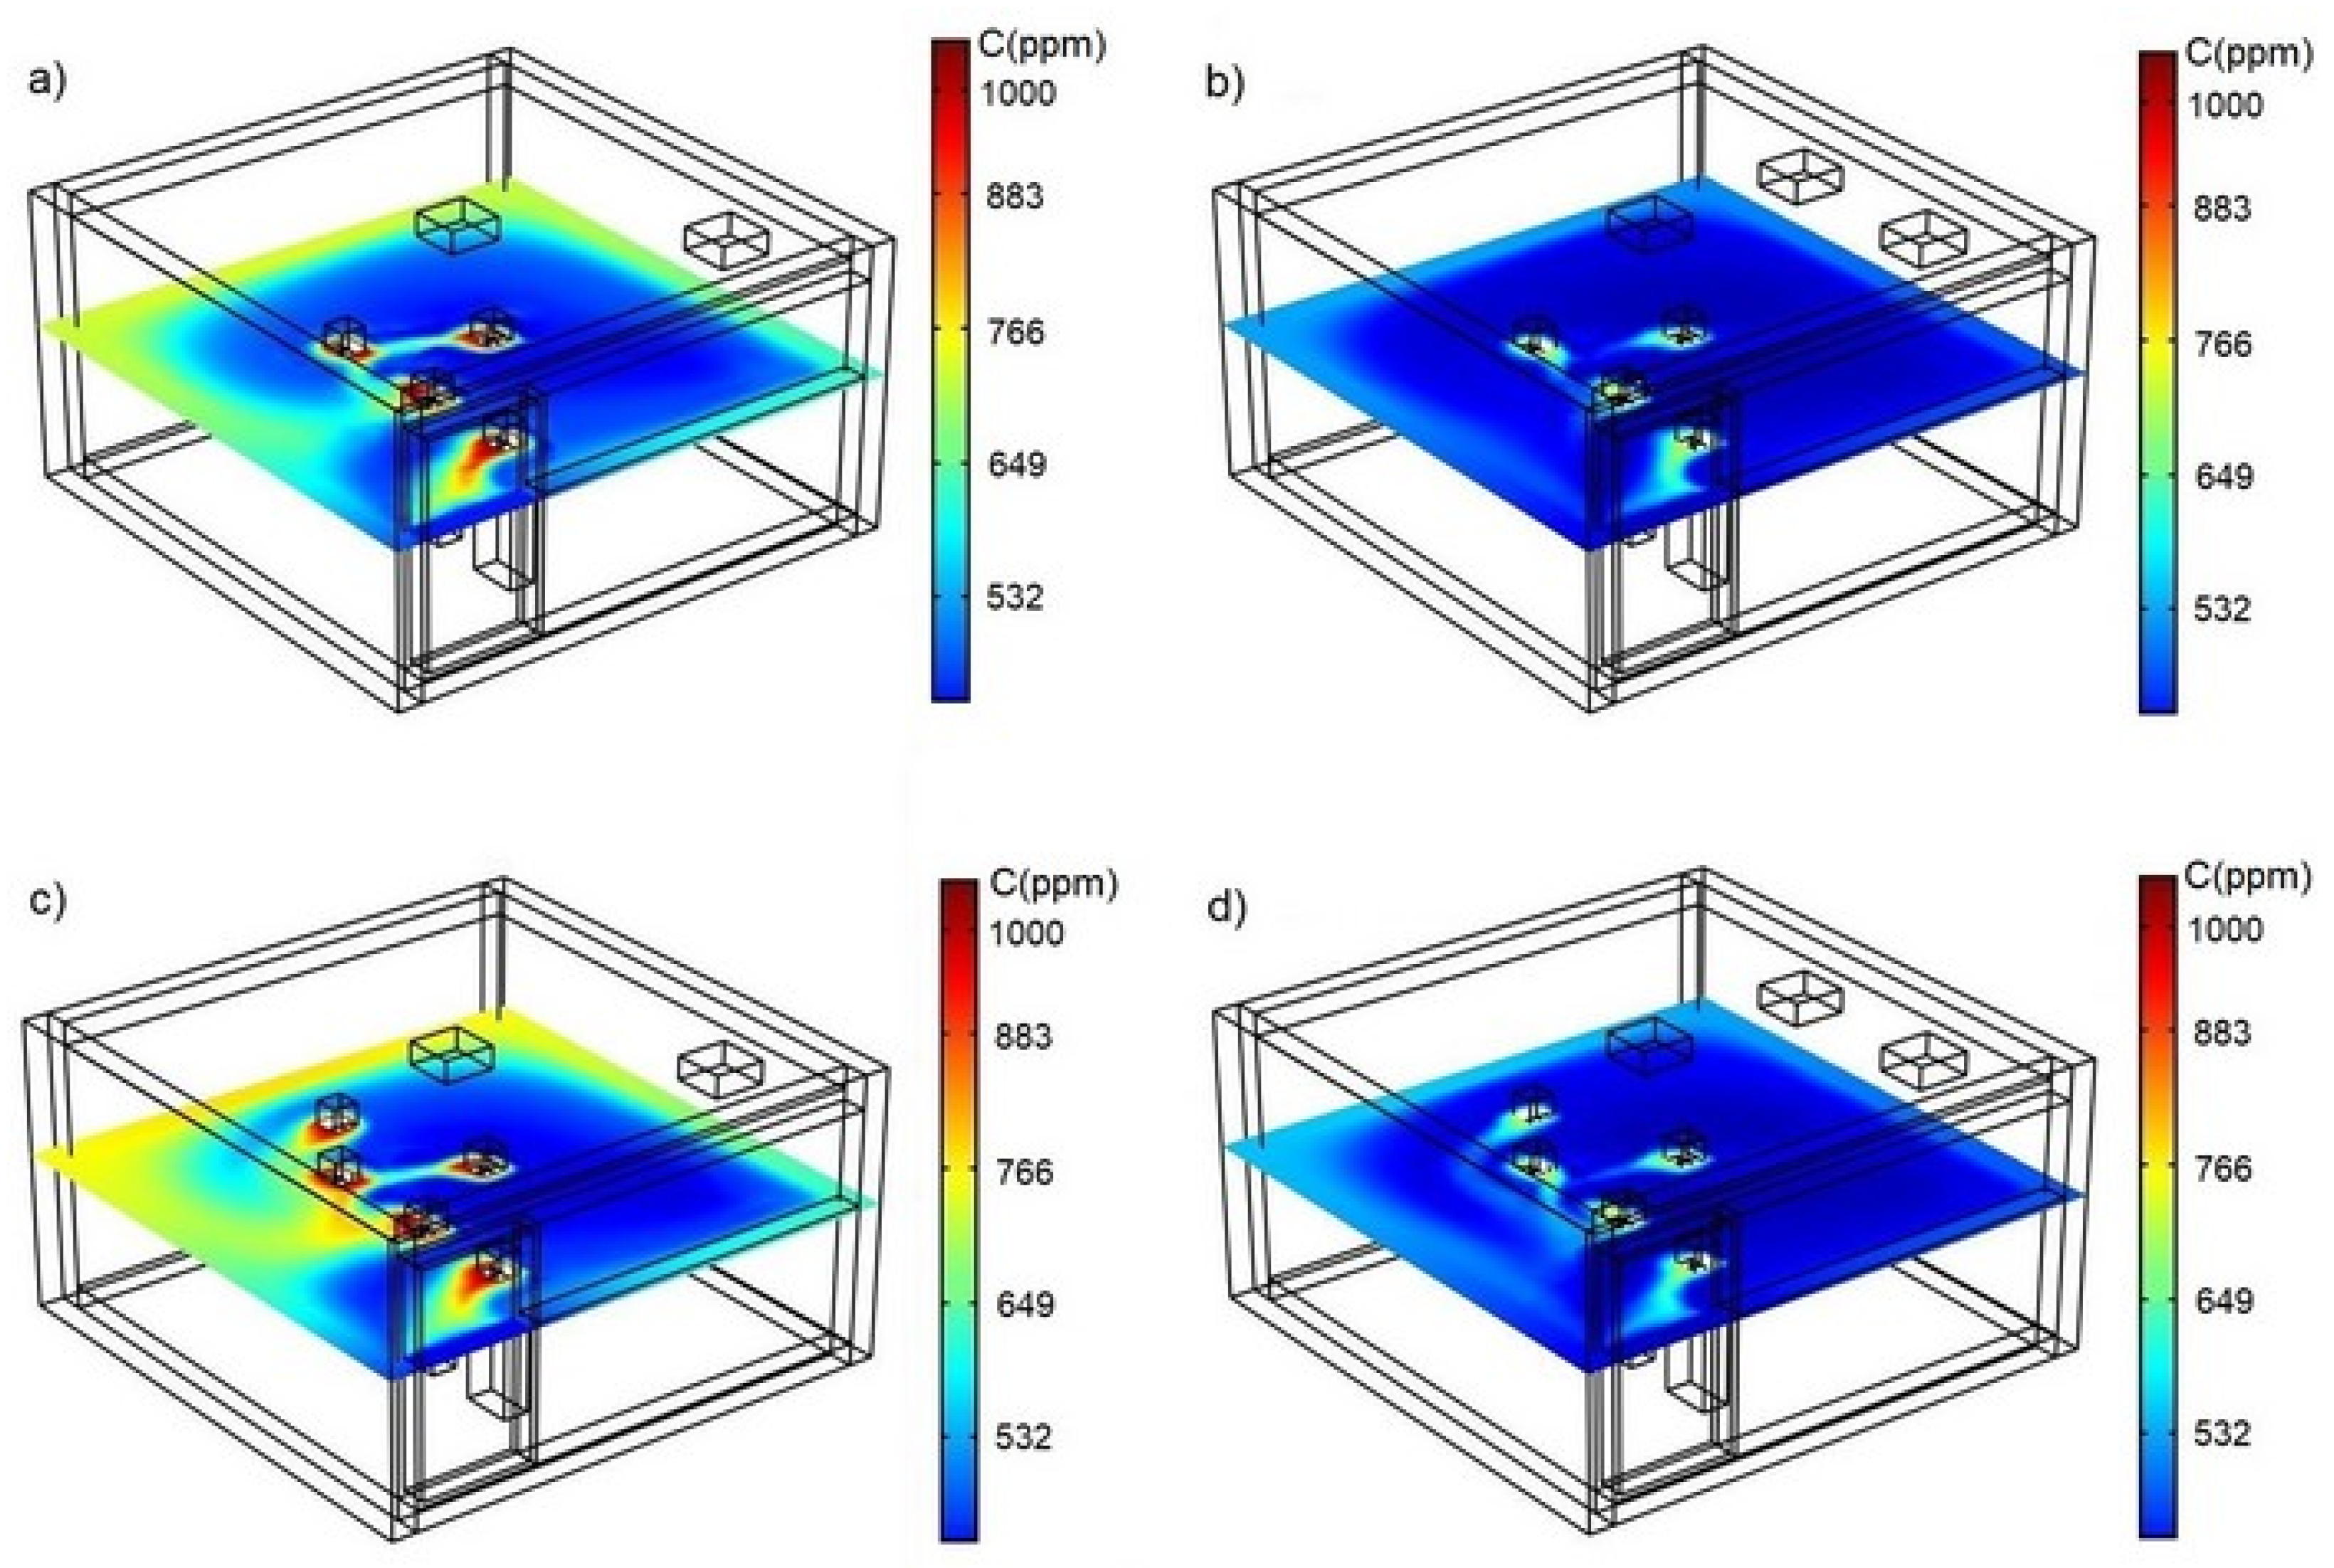
3.5. Effect of Two Air Conditioning Supply Inlets
For four and five people, the average CO
2 levels exceeded the maximum allowed value of 700 ppm. Therefore, this study proposed the addition of one additional air conditioning supply inlet to achieve a CO
2 concentration below the allowable value in these cases.
Figure 10 shows the CO
2 concentration fields for four and five people with one and two air conditioning inlets. When comparing the cases in the figure, it can be observed that a single air conditioning supply inlet (see
Figure 10a) is not enough to keep the air clean when there are four people inside the office and that high CO
2 concentrations occur near people. The office improves its ventilation conditions when the number of air conditioning supply inlets is increased to two (see
Figure 10b), achieving CO
2 concentration values below 700 ppm. Similar behavior can be observed with five people; with one air conditioning inlet (see
Figure 10c), high-CO
2 concentrations are observed, whereas extensive areas of clean air emerge when two air supply inlets are used (see
Figure 10d).
4. Discussion
In this paper, we discussed the flow, temperature, and CO2 concentration inside a professor’s air-conditioned office whose doors and windows remain closed when the space is being used. This office is located in the city of Veracruz, Mexico, where the weather is very hot throughout the year; therefore, it is necessary to cool the space with an air conditioning system throughout the day. The heat flux transmitted by a wall separating the office from the building’s exterior and those generated by people, as well as pollutant dispersion, result in thermal loads and CO2 concentrations not evenly distributed inside the space. The present study analyzes the effect of the position of the air conditioning supply, the Reynolds number, and the number of people inside the office on thermal comfort and air quality parameters. The published literature is scarce on data related to the study of CFD in closed spaces located in places with extremely hot climates cooled by air conditioning systems.
Unlike average temperature, which remains stable with small variations, average CO2 concentration experiences large fluctuations, in some cases exceeding the maximum allowable safety value. This is due to the fact that, in the case of temperature, an active mechanical element (the air conditioning unit) controls this variable directly, but in the case of the pollutant, there is no equipment controlling the CO2 concentration; therefore, its value is completely dependent on the airflow pattern inside the office.
Depending on the position of the air conditioning supply inlet, stagnant zones form as a result of the interaction of the turbulent flow with the hot wall of the office, which affects CO2 dispersion and results in pollutant accumulation inside the space because ventilation is deficient.
The effect of the position of the air conditioning system’s inlet, which provides clean, cool air, on thermal comfort and aeration in the office can be explained by the fact that the air stream injected into the space moves vertically downward, competing with the updrafts generated by the buoyancy of temperature gradients. In other words, the hot walls cause an upward air movement that opposes the air stream from the air conditioning inlet, thereby weakening air mobility.
The difference in optimal Reynolds numbers found for the different numbers of people is because the greater the density of occupants inside the space, the greater the intensity with which the air conditioning stream is injected in order to overcome friction and provide adequate ventilation.
The present analysis shows that the location of the air conditioning supply near a hot wall is associated with poor ventilation, which results in high CO2 concentrations. However, the CO2 values are significantly lower if the air conditioning inlet is placed away from the hot wall. On the other hand, there is an optimal Reynolds number with which contaminant removal improves significantly. Clearly, this result means that certain conditions promote ventilation while air is kept clean inside the space.
Given the negative effect that high CO
2 concentrations can have on people’s work and learning performance, it is important to understand fluid dynamics and heat and mass transfer mechanisms conducive to adequate ventilation in an enclosed space. This study is highly relevant because CO
2 concentrations in an office can be an indicator of the risk of transmission of infectious diseases that spread aerially, such as COVID-19, as suggested in [
26].
The present investigation is limited to determining the effect of the Reynolds number, air inlet position, and number of people on indoor air quality; behavior beyond these parameters will be addressed in a future study.
5. Conclusions
The results of this study show the effects of the position of the air conditioning supply, the Reynolds number, and the number of people on thermal comfort and CO2 levels inside a closed space. It is important to point out that the studied office’s door and window remain closed when in use because the weather outside is hot throughout the year. The most outstanding conclusions of this investigation are mentioned below:
Installing air conditioning supply inlets away from hot walls improves thermal comfort and air cleanliness inside a closed space.
Optimal Reynolds number values, those with which the lowest average temperatures and CO2 concentrations are obtained, are a function of the number of people inside the space.
For one and two people, the optimal Reynolds number value is 14,300.
For three to five people, the optimal Reynolds number value is 14,400.
When CO2 levels are greater than 700 ppm, increasing the number of air conditioning inlets to two is recommended.
Running air conditioning equipment at its optimal operating parameters saves energy, especially in hot regions where electrical energy consumption is high; in addition, adequate operation helps to safekeep the health of its users.
The study of thermal comfort and CO2 concentrations inside faculty workspaces is highly relevant, especially in extremely hot climates, because it can help the academic community to prevent adverse effects on the faculty’s activities and make it easier for students to pay attention.
When designing or improving air conditioning systems in closed spaces, to obtain good air quality and thermal comfort, it is recommended that both the air intake and its velocity be designed correctly according to the number of people. Specifically, the best results are obtained when the air inlet is away from hot walls and Re = 14,300–14,400.
This work shows that it is possible to carry out activities in small, closed spaces with good air quality and thermal comfort, as long as the optimal conditions of the air conditioning system can be achieved. The monitoring and comparison of new technologies, such as the use of filtration equipment to improve air quality, is beyond the scope of this article and will be addressed in future work; the main motivation of this research is to address existing spaces in public schools in developing countries where economic resources are limited.

 ,
, 


