1. Introduction
Since the revolution of Information and Communication Technology (ICTs), the internet has grown and changed many aspects of society, including international trade [
1,
2,
3]. With the integration of the internet and international trade, information as a primary resource flows freely on the virtual platform, forming new trade modes and connecting different markets, which could enhance the development of international trade. Generally, international trade and internet development appear to have a necessary linkage. There are several reasons for this: (1) The internet’s timeliness, sharing, and openness break the limitations of foreign trade caused by time and space; (2) The efficient and free dissemination of information resources through the internet reduces trade costs and enhances trade facilitation; (3) The popularity and application of the internet strengthen the cooperation and communication between various countries, making them more closely connected and expanding the international market boundary; (4) Finally, the spread of information will be accompanied by knowledge spillover, which is conducive to improving product innovation capacity and trade competitiveness of enterprises and provinces.
As mentioned earlier, internet development and foreign trade might have a significant relationship. Therefore, the role of the internet in foreign trade is emphasized in many developed and developing countries. Among all countries, China is actively developing information technology and trying to find a breakthrough to stimulate foreign trade. We would like to note that internet development in China is unique. Although the Chinese government has made significant efforts to promote the development of the internet in the country, it has also taken steps to control and regulate online content, particularly regarding political speech and criticism of the government. This has led to concerns about freedom of speech and censorship, as well as the potential for conflict between the government’s desire to control online discourse and the needs of businesses that rely on the internet for their operations and international trade. China’s import and export volumes significantly increased between 2015 and 2019, rising from 24.55 trillion yuan to 31.56 trillion yuan, as reported by the Ministry of Commerce of China [
4]. Furthermore, the total volume of imports and exports conducted through China Customs’ cross-border management platform has also experienced substantial growth during this period. Specifically, the total volume increased from 360.2 billion yuan in 2015 to 1862.1 billion yuan in 2019, resulting in an average annual growth rate of 50.8%. This impressive increase in cross-border e-commerce clearly indicates its strength and potential, in contrast with the relative weakness of traditional international trade. Sun [
5] and Zhang and Guo [
6] utilized the data of China at the provincial level and showed that the development of the internet could promote China’s foreign trade effectively. Besides China, evidence from Freund and Weinhold [
7], Vemuri and Siddiqi [
8], and Lin [
9] has also shown that the internet has affected foreign trade in many countries.
Although the internet is a critical factor in enhancing imports and exports, some previous studies still assumed that the internet and foreign trade are independent and often ignored the spatial effect of the variables [
10]. Chen and Ye [
11] argued that there might be spatial effects on the ICT variables. The reason is that the advanced knowledge and technology in one province could transfer to adjacent provinces through the channel of knowledge constructed by the ICT. If one province absorbs and adopts the new technology for economic development, it will attract more business-related internet from the neighboring provinces, thereby increasing their economic development but decreasing the neighboring province’s economic activity.
According to the literature, only a few scholars considered the spatial spillover effects of internet development and demonstrated their existence. For example, Yang and Chu [
12] used the spatial Durbin model (SDM) to examine the impact of the internet on China’s imports. They showed that internet development has significant adverse effects on local import trade but has a positive spatial impact on neighboring regions’ imports. In addition to the spatial spillover effects of ignorance, many studies usually select a single variable to measure internet development, e.g., Choi [
13] and Li and Lu [
14], which is not enough to measure overall internet development. In order to understand the impact of internet development on foreign trade, this study examines four key indicators: the number of websites, the proportion of internet users, the value-added of the tertiary industry, and the total social fixed asset investment in information transmission and computer services. Furthermore, this study also considers the potential spatial spillover effects of the internet on foreign trade across different provinces in China. In more detail, this study employs Moran’s I to check whether the internet has spatial autocorrelation among provinces and uses the SDM to estimate the direct and indirect (spatial spillover) effects of the internet on foreign trade. As a result, this study can better explore the relationship between the internet and foreign trade at the provincial level.
This study is structured as follows: In
Section 2, we present a brief literature review of the relationship between the internet and foreign trade.
Section 3 details our research methodology, including the econometric models employed and the data analysis conducted. The empirical findings are presented in
Section 4. Finally, in
Section 5 and
Section 6, we offer a conclusion and provide policy recommendations based on the study’s results.
2. Literature Review
The application of the internet in global trade has brought about significant changes in various aspects of international trade, including its form and content. Since Hamill’s 1997 article “The Internet and International Marketing,” the impact of the internet and related technologies on international trade has been a subject of increasing scholarly attention [
15]. According to cross-country level evidence, Freund and Weinhold [
7] collected data from 56 countries spanning the years 1995 to 1999 and utilized the gravity model in their analysis. They found a weak relationship between the internet and total trade in 1995 and 1996, but from 1997 onward, the internet had a positive impact on the global pattern of trade flow. In their study utilizing 2001 cross-sectional data, Clark and Wallsten [
16] examined the relationship between internet penetration and exports from a country, utilizing the internet host as the primary independent variable. Their research posits that a country’s exports are dependent on the internet penetration of that country alone rather than that of its importing partners. Despite the complexity of measuring internet usage in economic contexts during the early stages of internet development, previous research has also yielded positive associations between internet development and international trade. Lin [
9] employed a system–GMM estimation with an instrumental variable approach using bilateral trade data from nearly 200 countries spanning from 1990 to 2000 and found a positive impact of internet users on international trade.
In recent years, the growth of the internet has also had a positive impact on international trade in services. For instance, research by Choi [
13] found that the internet penetration rate of exporting countries can effectively enhance the export of services when it is used as an indicator. Similarly, Gnangnon [
17] utilized a panel dataset of 131 countries from 1995 to 2014 and employed a two-step system of the GMM approach to examine the effect of the internet on service export diversification. The study found that the internet has a positive association with service export and diversification, and this result holds true for many developing countries, including those of less developed countries (LDCs).
The role of China in global trade is undoubtedly admitted. It attracts many scholars to studies on China’s foreign trade in many aspects; however, the effect of internet development on China’s trade is relatively less. Li and Lu [
14] examined the effect of the internet on China’s imports and exports from both a general and regional perspective, utilizing panel data from 61 trading partners associated with the Belt and Road initiative, covering the period from 2007 to 2016. They measured the impact of the internet via internet penetration (the number of internet users per 100 individuals). The empirical results revealed that the internet has a significant positive effect on China’s trade with partners along the Belt and Road initiative as a whole. Still, there exist some different results at the regional level. Moreover, the effects are found to be different across time. According to the dynamic analysis, the impact is insignificant or even inhibitory from 2007 to 2011. However, the result shows a trend of promoting effect or becoming more vital from 2012 to 2016. Sun [
5] conducted a comprehensive study utilizing panel data from 31 provinces in China between 1999 and 2009 to investigate the relationship between internet penetration and the country’s trade flow. The study employed advanced econometric techniques, specifically fixed effect and random effect models, to control for unobserved heterogeneity and endogeneity. The study’s findings revealed that internet penetration has a statistically significant and positive impact on China’s overall foreign trade. However, the study also revealed that the magnitude of this impact varies by region, with the strongest impact observed in the eastern provinces and the weakest impact in the western provinces. Other researchers have also examined the topic from the perspective of enterprises. For example, Shi [
18] used the number of bilateral and bidirectional hyperlinks as a measure of internet usage and analyzed its impact on Chinese exports, finding that it significantly improved Chinese enterprises’ export value. More recently, Zhang and Guo [
6] emphasized the importance of considering multiple perspectives when assessing China’s current internet development. Rather than relying on a single variable, they proposed using the comprehensive “Internet plus” index calculated by Tencent Research Institute as the primary indicator of China’s internet progress. This index comprises four components: digital life, digital culture, digital economy, and digital government affairs. This index refers to the Chinese government’s strategy of integrating internet technologies with traditional industries to promote economic growth and modernization. The research conducted by Zhang and Guo [
6] revealed that the development of the internet in China, as measured by the Internet plus index, has had a significant positive impact on the growth of China’s foreign trade.
Previous research on the relationship between the internet and foreign trade in China has been primarily focused on non-spatial econometric models, with a limited number of studies incorporating the spatial dimension of this phenomenon. A notable exception is a study conducted by Yang and Chu [
12], which employed panel data from 30 provinces in China between 2002 and 2014 to analyze the impact of internet development and transportation on imports. Utilizing maximum likelihood estimation, the study estimated the spatial Durbin model (SDM) and investigated the direct and indirect effects of the internet on import values. The results of this study indicated that while internet development had a significant negative impact on local import trade, it had a positive effect on imports in surrounding regions.
In light of this, the present study aims to examine the spatial spillover effects of the internet on foreign trade in China at the provincial level. Furthermore, this study will adopt a holistic approach to measuring internet development by incorporating multiple indicators such as the number of websites, mobile phone subscribers, the proportion of internet users, total social fixed asset investment in information transmission, computer services, software industry, and the value-added of the tertiary industry. The ultimate objective of this study is to provide actionable recommendations and policies that can aid in the development of the new economy in the future.
3. Methodology
This study aims to conduct a comprehensive analysis of the impact of the internet on China’s foreign trade at the provincial level, utilizing advanced spatial econometric methods. We will examine the existence of spatial spillover effects between provinces, specifically investigating whether internet penetration in neighboring provinces has an impact on foreign trade in other provinces. To accomplish this, we will employ a range of spatial econometric techniques called the spatial Durbin model (SDM), which is suitable for detecting spatial dependencies among provinces. For more detail, the procedures for empirical analysis are explained as follows.
3.1. Spatial Weight Matrix
To account for spatial effects, we need to include the coordinates or distances between the Chinese provinces. The
matrix
, which is referred to as the spatial weights matrix (Equation (1)), was used to incorporate this information. This spatial weight matrix is referred to as the neighbor structure between the observations (provinces). Specifically,
expresses the degree of spatial relationship among the Chinese provinces and also how their values are related to each other [
19]. There are four types of spatial weight matrixes: the binary zero–one weight, the geographic distance matrix, the economic distance matrix, and the mixed economic–geographic matrix, which are normally used in the literature [
19,
20].
However, in this analysis, we consider the economic distance matrix due to the spatial spillover effects of internet development on foreign trade of the local province and its neighboring provinces. As internet development overcomes the limitation of geographical distance on spatial interaction, this study measures the economic distance matrix as the differences in the economies of neighboring provinces.
where
of
can be calculated by
where
denotes the economic output of province
. Thus,
can be viewed as the economic distance between province
and province
;
is the number of provinces.
3.2. Spatial Autocorrelation
Spatial autocorrelation (correlation) is normally used as the pre-analysis of the spatial panel model. This enables us to confirm the use of the model if there exists a correlation between the variables affected by attribute values and spatial correlation [
21]. In doing this spatial autocorrelation test, scholars have suggested using the global Moran’s I [
22], which detects the range and location of outliers or clusters. The global Moran’s I can be calculated as follows:
where
and
denote the internet development of province
and province
. The Moran’s I ranges between −1 and 1. The higher positive value of Moran’s I indicates higher positive spatial correlation between the internet development of province
and province
, while the higher negative value of Moran’s I indicates a higher negative spatial correlation between the internet development of province
and province
. In the case that we obtain Moran’s I close to zero, it implies that the spatial correlation between the internet development of province
and province
is completely random, scattered, and disordered.
3.3. Spatial Durbin Model (SDM)
The SDM is one of the most famous structures in spatial econometric models. It assumes that there are spatial effects on both dependent and independent variables. Therefore, it enables us to decompose the direct and indirect effects of the independent variables on the dependent variable. The structure of this model can be written as
where
is the
vector of the dependent variable,
is the
matrix of independent variables,
represents the individual effect of each province, and
is the
vector of the random error term which is assumed to have a normal distribution with mean zero and variance
. The spatial autoregression parameter
represents the relationship between the dependent variables of the local province and neighboring provinces. The spatial coefficient is denoted by
, and its value reflects the spillover effects of independent variables of local provinces on the dependent variable of neighboring provinces. Particularly, if
, it indicates that the dependent variable of neighboring provinces could be positively affected by the independent variables of local provinces. On the one hand,
indicates that the independent variables of local provinces have a negative impact on the dependent variable of the neighboring provinces. As we deal with the panel analysis, this study then eliminates
by demeaning the variables using the within transformation, namely entity-demeaned (individual fixed effect), time-demeaned (time fixed effect), and entity and time-demeaned (individual and time-fixed effect). Thus, we can rewrite Equation (4) as
where
and
are the demeaned variables. To estimate this model, the ridge penalized maximum likelihood estimator is used, as it could deal with multicollinearity problems which may occur in our empirical model.
3.4. Direct and Indirect Effects
The traditional spatial Durbin model (SDM) may not fully capture the spatial dependencies among provinces and the impact of independent spatial variables on the dependent variable due to bias presented in the parameters. To overcome this limitation, this study will apply the advanced econometric method, known as the partial differentiation method, proposed by LeSage and Pace [
23]. By using this approach, the direct and indirect (spatial spillover) effects of independent variables on the dependent variable can be decomposed, providing a more comprehensive and accurate understanding of the spatial dimension of the relationship between the internet and foreign trade in China. The calculation of these effects can be written as follows:
To simplify the formula, we can rewrite Equation (5) as
where
and
is the
identity matrix and
.
is the demeaned independent variable
k,
k = 1,…,
K. We then convert Equation (5) into the matrix form as
Hence, we can calculate the direct and indirect effects of each regressor on the dependent variable as follows:
4. Data and Variable Description
This study utilizes a robust panel dataset spanning from 2003 to 2016, collected from 31 provinces in China, to examine the relationship between the internet and foreign trade. To ensure the accuracy and reliability of the results, we employ multiple sources to gather the primary variable of interest, the total foreign trade volume (unit: million RMB) labeled as “Total”, as well as a range of internet proxies as explanatory variables, including data from China’s National Bureau of Statistics, provincial and municipal statistics bureaus, and the China Internet Network Information Center (CINIC). Additionally, control variables such as economic development, transportation infrastructure, foreign direct investment, and social education level will also be obtained from reputable sources such as the National Bureau of Statistics and the Statistical Yearbook.
The proxies for internet development used in this study are derived from three perspectives: infrastructure, popularity, and application of the internet. These perspectives are measured using the following indicators: the number of websites (unit: ten thousand) labeled as “Web”, the proportion of internet users aged six or above to the population (unit: percentage) labeled as “Users”, total social fixed asset investment in information transmission, computer service, and software industry (unit: one hundred million yuan) labeled as “Inv”, the value-added of tertiary industry labeled as “TER”, and the number of mobile phone subscribers (unit: ten thousand) labeled as “Mobile”. These indicators were chosen as they provide a comprehensive view of internet development. The number of websites reflects the richness of internet resources and is a crucial factor for generating value and economic effects through information dissemination. Additionally, the number of internet users represents internet popularity and is widely used as a measure of internet development [
13,
24]. Furthermore, internet infrastructure lays the foundation for internet popularity, and an increase in the number of internet users creates a conducive environment for internet applications in economic activities.
As mentioned earlier, this paper also considers four control variables on foreign trade, namely Gross Domestic Product per capita (unit: RMB) labeled as “GDP”, transportation infrastructure, the total length of the railway (unit: thousand kilometers) labeled as “Trans”, foreign direct investment measured by the number of foreign-invested enterprises (unit: enterprises) and labeled as “FDI”, and social education level, which is the average number of years of education per capita (unit: years), labeled as “EDU”. First, education as the human capital stock has been proven to play a crucial role in the open economy and helps enhance labor skills, which later determines a country’s comparative advantage. Furthermore, GDP reflects the size of the economy of each province, which in turn can affect the province’s foreign trade [
25]. In addition, transportation infrastructure is also one of the key factors that should not be ignored in international trade studies as it provides a good environment for foreign investment and trade and can help reduce trade costs. Lastly, FDI is conducive to the transformation and upgrading of enterprises’ production technology and product development, thus affecting the competitiveness of foreign trade. The descriptive statistics of considered variables are provided in
Table 1. The panel unit root test of Levin, Lin, and Chu [
26] are also reported in
Table A1 (
Appendix A). The results show that all variables are stationary at the level.
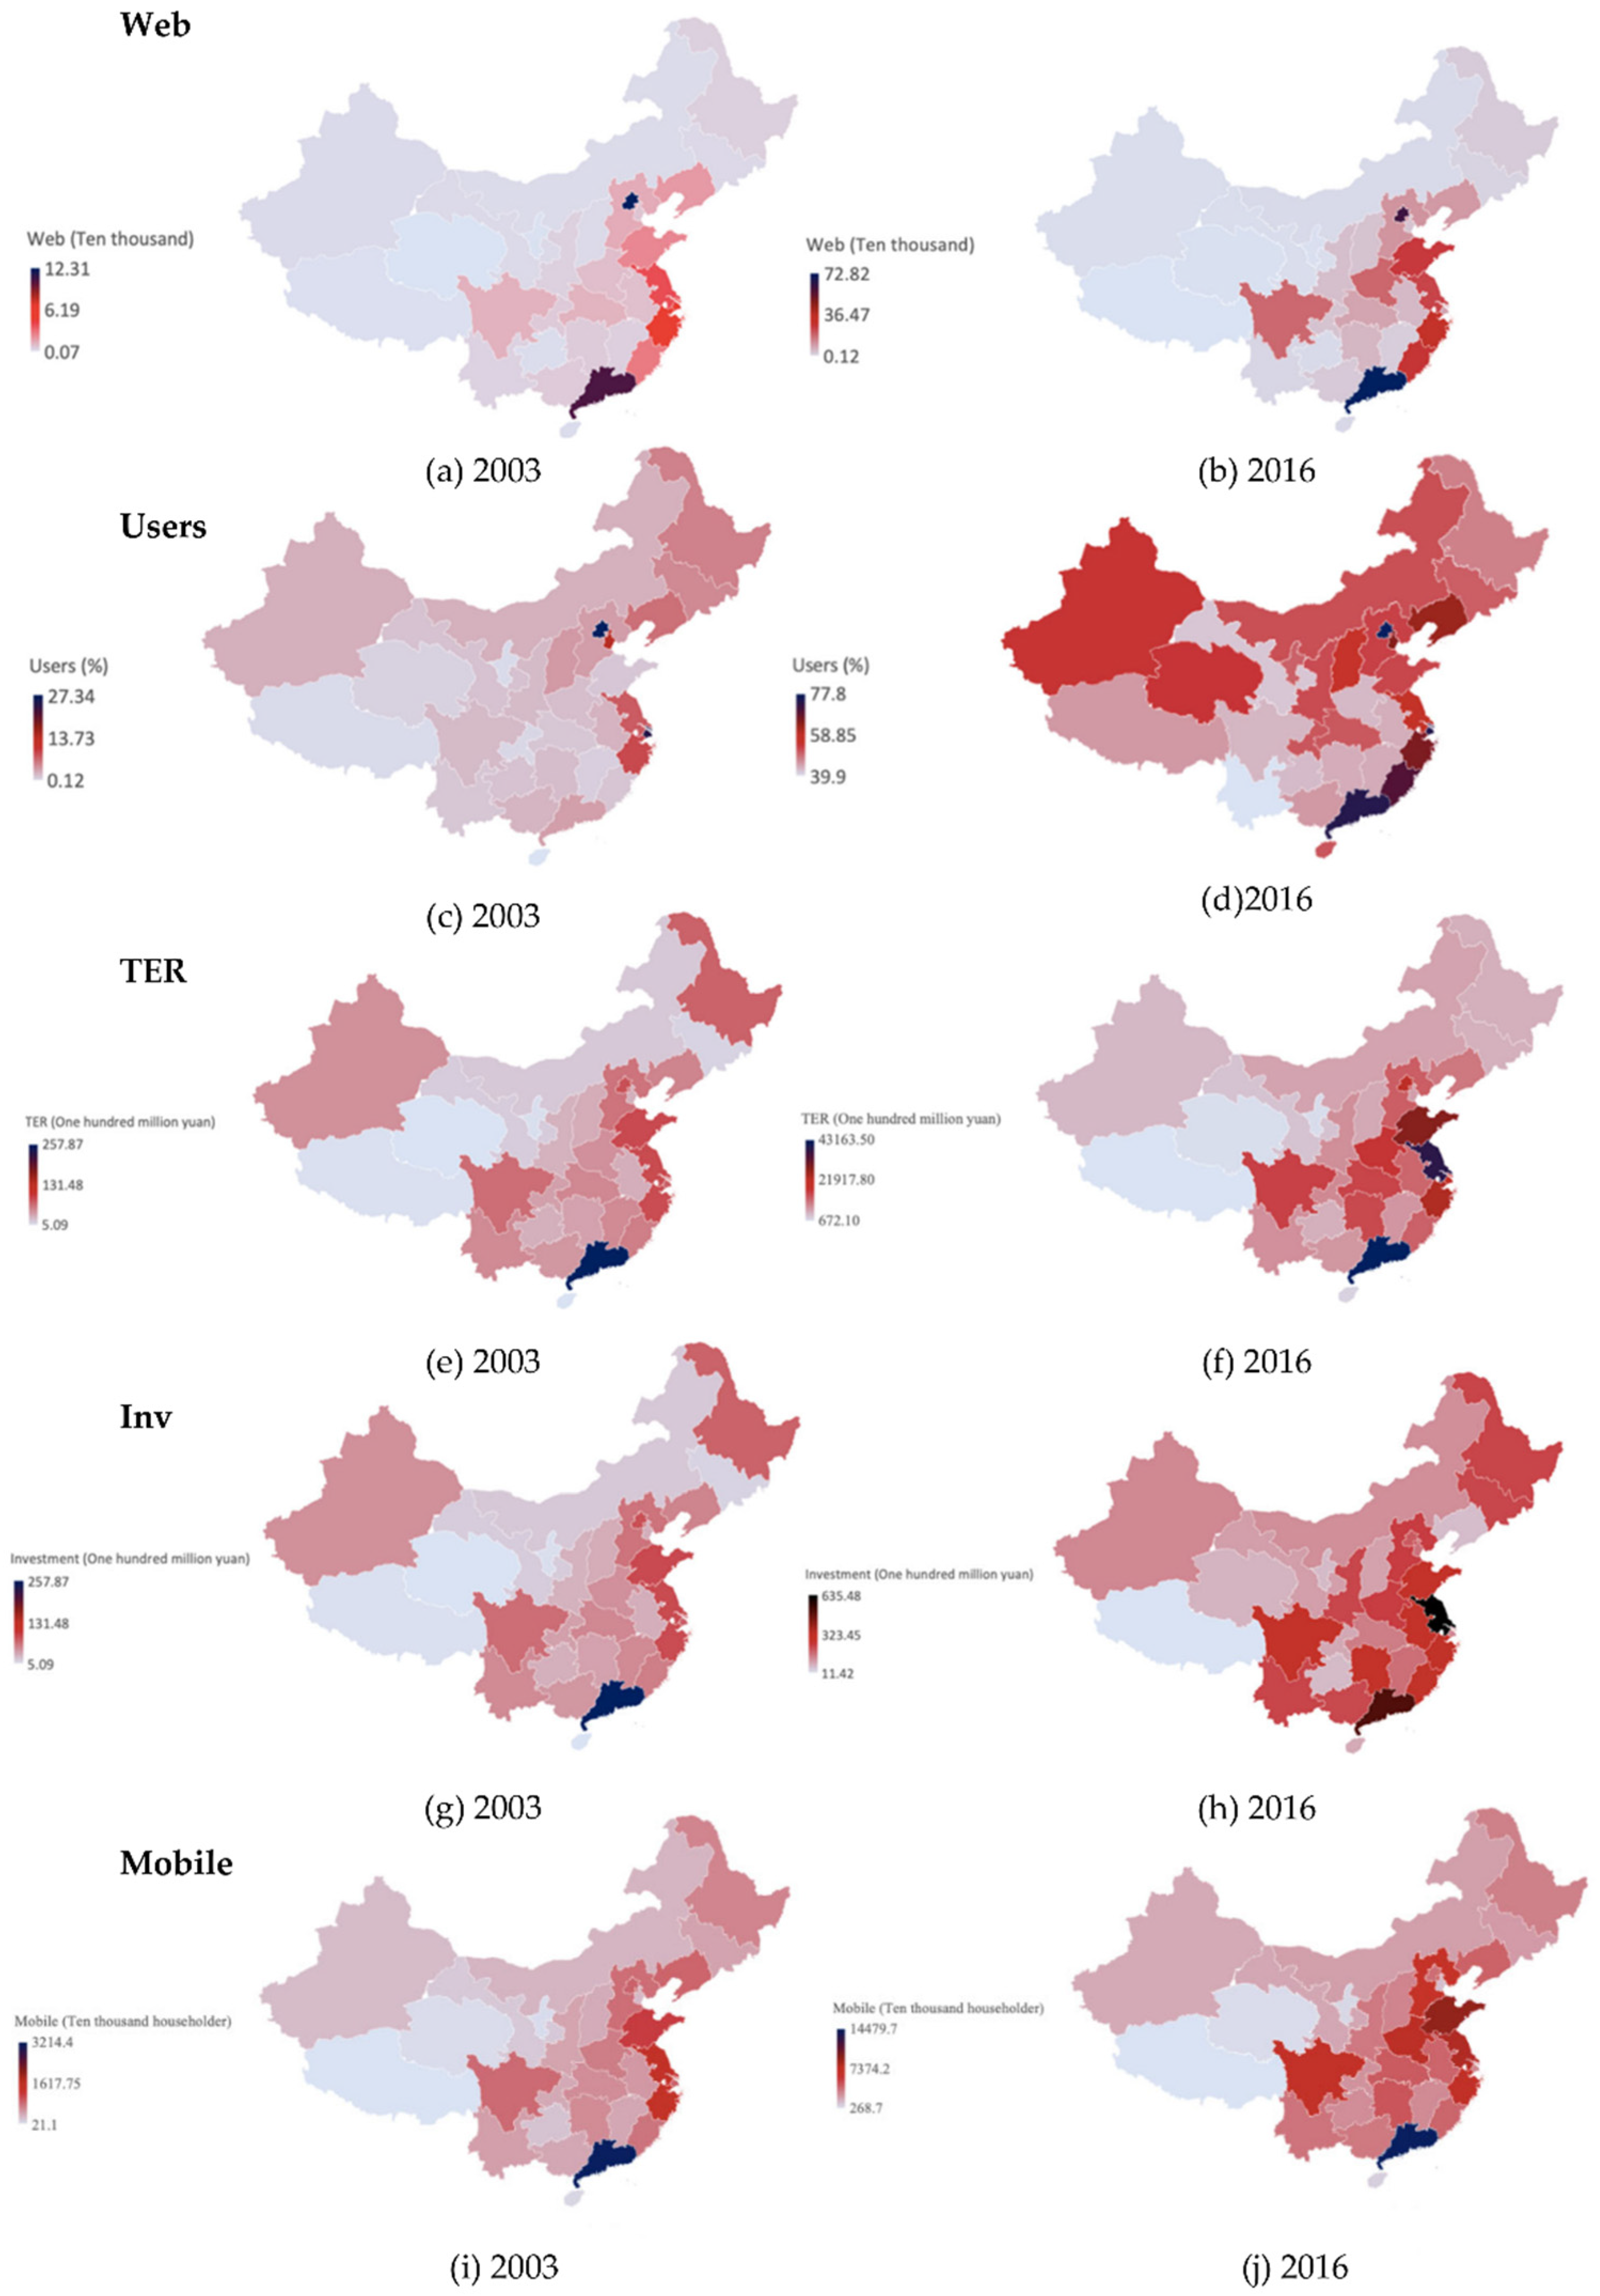
To have a clearer picture of the spatial correlation of internet development in China, we plot the distribution maps of Web, Users, TER, and Inv in 2003 and 2016 in
Figure 1.
As shown in
Figure 1, we can observe that the distribution and structure of internet development in 2003 and 2016 are not much different. However, the degree of development is obvious as the Web, Users, TER, Inv, and Mobile are higher in 2016 when compared to 2003.
Another issue that we could observe here is the digital divide. We could see that Web, Users, TER, Inv, and Mobile are not the same across the country, implying a gap between the provinces that have access to the internet and those that do not or have restricted access. Specifically, China’s eastern and coastal provinces have higher internet access than other provinces. As a result of high Web, Users, TER, Inv, and Mobile in eastern and coastal provinces, they stand out as high internet and technology development areas, while the middle and south of China stand out as moderate–low internet and technology areas.
The possible reason is that the strategic planning of the digital economy in these provinces has attempted to transform from e-commerce to intelligent manufacturing. Recently, large and high-technology companies (i.e., Alibaba, Baidu, Tencent) have been located in these areas. These companies have invented and attracted new communication, commercial, and manufacturing technologies, which could improve the internet infrastructure and attract large foreign investment and trade.
In terms of spatial correlation, we can observe that the Web, Users, TER, Inv, and Mobile distributions follow a west–east trend (i.e., high values appear clustered near the eastern end of the province, and low values seem clustered near the west). In other words, the Web, Users, TER, Inv, and Mobile levels are characteristically similar among provinces located adjacently or nearby that can be easily visualized as a cluster. Therefore, the spatial analysis of internet development on Chinese foreign trade should consider the distance between provinces. A province with high internet development can produce impacts on the foreign trade of its neighboring countries and perhaps beyond; this is known as spatial spillovers [
27].
However, this spatial correlation cannot be examined solely by this qualitative analysis; Moran’s I statistic will be used as the statistical tool for confirming this spatial correlation.
5. Empirical Results
This section will present the empirical results starting from the spatial autocorrelation test to check whether spatial autocorrelation exists in all internet proxies. Then the estimated results of the spatial Durbin model will be illustrated, followed by direct, indirect, and total effects.
5.1. Spatial Autocorrelation Test: Moran’s I
This study investigates the spatial spillover effects of the internet on China’s foreign trade in different provinces. First, we employ Moran’s I to test whether spatial autocorrelation exists in all internet proxies. The estimated results are shown in
Table 2. The Moran’s I index of lnWeb, lnUsers, lnInv, lnTER, and Mobile are all positive from 2003 to 2016. Moreover, most Moran’s I value can reject the null hypothesis of no spatial autocorrelation at the 1% significance level. This result means the internet development proxies have positive spatial autocorrelation in 31 provinces, implying that internet development in one province in China correlates with the development of nearby provinces in the same direction (or exhibits a similar feature). Moreover, a significant Moran’s I index also preliminarily proved that the spatial spillover effects model could better fit this dataset, and that spatial dependence should not be overlooked.
5.2. Analysis of the Spatial Regression Model
Before analyzing the spatial effect, we should test whether the spatial effect needs to be extended to the panel model. By doing this, we compare the non-spatial and spatial models using the Lagrange Multiplier (LM) and the Robust Lagrange Multiplier (R-LM). Note that the null hypothesis is that there are no spatial effects (lag or error) in the model, while the alternative hypothesis is that spatial effects exist in the model.
The testing results are provided in
Table 3. We find that the statistics of LM without spatial lag, R-LM without spatial lag, LM without spatial error, and R-LM without spatial error are 256.744, 59.288, 66.927, and 36.780, respectively; all of them are significant at 1% level (
p value < 0.01). This indicates that all tests reject the null hypothesis of the absence of a spatial effect. Therefore, it is appropriate to construct a spatial panel model.
Moreover, as there are various structures of the spatial panel model, we thus compared the performance of the SDM with the other two models, namely spatial lag and spatial autoregression models. This maximizes the internal validity of the results. To achieve this purpose, we conduct the Wald test and Likelihood Ratio (LR) test to confirm whether the SDM is the most appropriate for our analysis [
12,
28]. If the null hypothesis of the Wald test and LR test is rejected, this indicates the superiority of the SDM.
Table 4 shows the test results. The statistic values of the Wald test for spatial lag (SAR), the Wald test for spatial error (SEM), the LR test for spatial lag (SAR), and the LR test for spatial error (SEM) are quite high and reject the null hypothesis of the SEM and SAR structures. This indicates that the SDM is superior to other models.
5.2.1. Estimated Results of the Spatial Durbin Model
Because of the spatial dependence, which violates the principle of independent samples, the estimated coefficients are biased and inconsistent due to the endogeneity problem. Therefore, the maximum likelihood estimator (MLE) is used to estimate the SDM, and the results are shown in
Table 5. Before discussing the results, we also compare the performance of the individual and time-fixed effects model with the spatial fixed effect and the time-fixed effect models through log-likelihood, AIC, and BIC values. As shown at the bottom of
Table 5, the individual and time-fixed effects model has the lowest AIC and BIC values, indicating that it has superior performance to the other two models. Therefore, we will discuss the results obtained from this model. First, the spatial lag parameter (
) is −0.791 and significant at the 1% level. It indicates a significantly negative spatial autocorrelation between different provinces regarding foreign trade, meaning that the foreign trade of one province and its neighboring areas compete with each other.
According to the results shown in
Table 5, we will focus on the results obtained from the individual and time-fixed effect model (the rightmost column), which is the best fit for the data based on the AIC and BIC values. The estimated results of the first set of explanatory variables represent direct effects, which are the impacts on the foreign trade value of the originating province. On the other hand, the second half of the explanatory variables multiplied by W (the distance weight matrix) indicate the spillover effects (or indirect effects) on the foreign trade of the neighboring provinces. According to the results, two internet proxies (lnInv and lnTER) could significantly impact the foreign trade of the source province. These two variables also significantly impact the surrounding provinces’ foreign trade. Although these variables give the same sign in estimated direct and indirect effects, the effects on the neighboring provinces are much stronger than those of the former. However, we cannot interpret the estimated results of the spatial Durbin model directly. The estimated results must be decomposed into direct, indirect, and total effects, as shown in
Table 6.
5.2.2. Direct, Indirect, and the Total Effects of the Internet on China’s Foreign Trade
This section presents the direct, indirect, and total effects, which are decomposed from the results of the spatial Durbin model. Again, the direct effect is the influence of the explanatory variable on foreign trade in the source province. In contrast, the indirect effect is the influence of that variable on the foreign trade in the neighboring areas. Lastly, the total effect is the sum of the direct and indirect effects. The results are illustrated in
Table 6.
The results shown in
Table 6 indicate that fixed-asset investment in information transmission, computer services, software industry (lnInv), and the value-added of tertiary industry (lnTER) have significant direct and indirect effects on foreign trade in China. On the other hand, economic growth (lnGDP) and transportation infrastructure (lnTrans) as control variables have only a direct effect on the foreign trade in the source province, while foreign direct investment (lnFDI) has an indirect impact on foreign trade. According to the direct-effect results, the coefficient of fixed-asset investment is −0.039, meaning that when the level of fixed-asset investment increases by 1%, foreign trade in the source province will decrease by 0.039%. However, the impacts of this variable on foreign trade in neighboring provinces are much stronger than that. In essence, the coefficient is −0.285, indicating that when the source province has a higher level of fixed-asset investment by 1%, it will reduce foreign trade value in the surrounding provinces by 0.285%. This is probably because increases in the relevant investment also reflect the strengthening of internet technology and application in a province. Therefore, those provinces with a high level of fixed-asset investment can lead to a more significant gap between them and the relatively backward surrounding areas, which indirectly has a significant inhibiting effect on the foreign trade of the neighboring provinces.
The results also demonstrate that foreign trade strongly depends on the value-added of tertiary industry (lnTER). The estimated direct effect is 0.716, while the estimated indirect effect is 4.631. This result indicates that the value-added of the tertiary industry has played a significant role in promoting the foreign trade of the source province and the neighboring provinces. The tertiary industry or the service sector is one of the three primary industrial types of the economy, the other two being the primary and secondary industries. The tertiary industry includes a wide range of businesses, such as transportation, financial institutions, telecommunications, and others, which could directly support and strengthen international trade. In addition, the service sector is now tradable across different countries. Even though the trade volume is less than the trade in goods, China’s international trade in services has increased significantly. Therefore, the service industry and foreign trade links are undoubtedly substantial. Furthermore, our result also reveals that the indirect effect of the value-added tertiary industry on foreign trade in neighboring provinces is much stronger than the direct effect on the local province. A possible explanation is that China is a large country with significant regional disparities in economic development and foreign trade activities. China’s coastal provinces, such as Guangdong, Fujian, and Zhejiang, have historically been more developed in foreign trade and have benefited from their proximity to international trade routes. As a result, these provinces have developed more advanced infrastructure and a larger pool of skilled labor to support their foreign trade activities. This has created significant spillover effects on neighboring provinces with less developed foreign trade sectors. For example, neighboring provinces such as Hunan, Hubei, and Jiangxi may benefit from the spillover effects of the more advanced foreign trade activities in the coastal provinces through increased demand for goods and services and through the transfer of knowledge, skills, and technology. This can result in a situation where the indirect effect of the value-added tertiary industry on foreign trade in the neighboring provinces is much stronger than the direct effect on the local province. Moreover, the Chinese government has been promoting the development of regional economic clusters to enhance the competitiveness of local industries and promote inter-regional trade and investment. This has led to the creation of several regional economic zones, such as the Yangtze River Delta, the Pearl River Delta, and the Beijing-Tianjin-Hebei region, which are designed to promote regional economic integration and cooperation. In such cases, the indirect effects of the value-added tertiary industry on foreign trade in neighboring provinces could be further amplified, leading to a situation where the indirect effects are many times stronger than the direct effects.
In addition, among the control variables, economic development (lnGDP) and transportation infrastructure (lnTrans) significantly directly affect the foreign trade of the originating province with estimated coefficients of 0.525 and 0.187, respectively. This result indicates that the increase in economic growth (measured by GDP per capita) and the construction of transport networks have obviously promoted local foreign trade development. On the other hand, the foreign direct investment (lnFDI) in the source province appears to have adverse spillover effects on the international trade of the neighboring provinces, with a coefficient of −0.623. This finding appears the same for the total effects.
After conducting a thorough analysis of the internet proxies employed in the study, it has been determined that the two variables in question, namely the number of websites and the number of internet users, did not reveal a significant impact on foreign trade. This observation diverges from the existing body of literature, which extensively details the positive effects of the internet on trade operations through its ability to streamline information search and access, thereby promoting efficiency and convenience in trade [
7,
8,
9].
It is hypothesized that the unique nature of China’s internet policy, which is not entirely open, could have influenced the research outcomes. This conjecture is supported by the fact that China has implemented various internet policies and regulations that are distinct from those observed in other countries. For example, China’s “Great Firewall” mechanism restricts access to foreign websites and services while strictly regulating domestic internet content [
29]. Such exclusive internet policies and regulations in China could have hampered the impact of the internet on foreign trade. For example, if Chinese businesses and consumers are unable to access foreign websites or services due to government restrictions, it could impede their ability to engage in cross-border trade. Similarly, if foreign businesses cannot access Chinese websites or services due to government restrictions, it could limit their capacity to trade with Chinese businesses and consumers.
Additionally, the study reveals that the spatial distribution of internet development among provinces in China is uneven, as evidenced by the results of Moran’s I spatial autocorrelation statistic, which indicates the presence of high–high or low–low clusters of internet development among the 31 provinces. This implies that in provinces with lower levels of internet popularity, there is a correspondingly lower degree of network infrastructure development [
6]. Furthermore, the high costs associated with initial infrastructure investment contribute to the high prices of internet usage in these provinces, which in turn limits the impact of the internet on foreign trade in these areas. Moreover, Chao et al. [
30] argued that the impact of the internet on foreign trade is closely tied to geographical factors and natural endowments. For example, provinces that are geographically remote, such as Yunnan and Guizhou, tend to have slower internet development. However, the infrastructure and popularity of the internet affect the speed of information dissemination, and inefficient information flow negatively impacts foreign trade. Therefore, in the future, the improvement of internet infrastructure, popularity, and application will generate a more visual impact on China’s foreign trade development.
6. Conclusions
With the rapid development of Information and Communication Technology, the internet has played an essential role in enhancing the global economy, including international trade. The internet can overcome the limitations of foreign trade caused by time and space and also foster cooperation and communication between various countries. As a result, the impacts of the internet seem not only applicable to the specific country or area, but spatial spillover effects on the related areas also exist. Therefore, this study was conducted to examine this issue with particular emphasis on China, one of the largest economies with a high level of digitalization. This study uses the panel data of 31 provinces in China from 2003 to 2016 and employs the spatial Durbin model to explore the spatial spillover effects of the internet on China’s foreign trade at the provincial level.
According to the spatial autocorrelation test, positive spatial autocorrelation exists, which indicates that internet development in 31 provinces has a strong spatial agglomeration characteristic. Then, we explore the impacts of the internet on foreign trade through the spatial Durbin model. The results obtained from this study indicate a strong correlation between the growth of the internet and international trade. Specifically, the total fixed asset investment in information transmission, computer services, and software industries, as well as the value-added of the tertiary industry, are found to have both direct and indirect effects on foreign trade. These findings provide valuable insight into the relationship between the internet and international trade and underscore the importance of continued investment in the growth and development of the internet. The impact of fixed-asset investment is negative, while the impact of the tertiary industry is positive. Among the two significant variables, the tertiary industry and the service sector seems to have the most crucial role in promoting international trade in the source province, as well as in the surrounding areas, with the largest coefficient as compared to the others. In addition, economic growth (measured by GDP per capita) and transportation are also found to impact the local province’s foreign trade positively. However, the impact of FDI on the source province is found to be harmful to international trade in surrounding areas.
The research findings provide us with some policy suggestions. First, the government and policymakers in China should emphasize internet application in the tertiary industry to promote the development of foreign trade because this factor could positively contribute to promoting foreign trade in 31 provinces. Second, due to the differences among different provinces in developing the internet, spatial autocorrelation analysis also shows that the internet has high–high or low–low aggregation in provinces. Therefore, the state telecommunications administration department should strengthen cooperation between provinces, especially to allocate the total fixed social asset investment related to the internet. Furthermore, provinces that have better internet development can share resources to support the development of neighboring provinces. Therefore, it is crucial for all provinces to actively implement the “Internet plus” strategy and enhance their digitalization level to maximize the internet’s positive impact on foreign trade. Additionally, the study found that the effects of the number of internet users and websites on foreign trade were positive but not statistically significant during the research period. This finding implies that China’s state telecommunications administration department should improve the internet further, expand internet popularity, and adjust the uneven development among provinces to deeply integrate the internet and foreign trade in China.
It is crucial to acknowledge that the results of this study are subject to specific limitations. The primary constraint is the limited and outdated data on internet proxies available for the 31 provinces analyzed. For instance, the measure of the ultra-high-speed internet access used in this study was 5G penetration, which may not reflect the most recent advancements in internet technology. Moreover, the data used in this study was only accessible for the period from 2003 to 2016, which may not entirely capture the ongoing internet revolution and its impact on foreign trade in China. These limitations highlight the need for further research to obtain more current and comprehensive data on internet access in China and its impact on foreign trade. In addition, it is imperative that future research be conducted over a longer period and employ advanced econometric techniques such as dynamic spatial modeling to examine both short-term and long-term spillover effects. Additionally, it would be beneficial to divide the 31 provinces into different regions to gain a more nuanced understanding of variations in spatial effects across different areas. Furthermore, the use of panel data in future studies would allow for the control of unobserved heterogeneity and endogeneity, which would provide more robust results. By incorporating these elements, future studies would be able to provide a more comprehensive and convincing analysis of the relationship between the internet and foreign trade in China.


