
Optimal Design and Operation of an Off-Grid Hybrid Renewable Energy System in Nigeria’s Rural Residential Area, Using Fuzzy Logic and Optimization Techniques


Abstract
:1. Introduction
1.1. Background
1.2. Literature Review
1.3. Research Gap and Research Contribution
2. Size Optimization Model
2.1. System Structure
2.2. Solar PV Model
2.3. Wind Turbine Model
2.4. Battery Model
2.5. Power-Flow Strategy
2.6. Operating Cost of an HRES
2.6.1. Replacement Cost of Batteries
2.6.2. Operation Cost of the Diesel Generator
2.7. Particle Swarm Optimization (PSO) Model
3. Optimal Energy Management System Using a Fuzzy Logic Controller
3.1. Design of the Energy Management System
3.2. Formation of FLC1 Rules
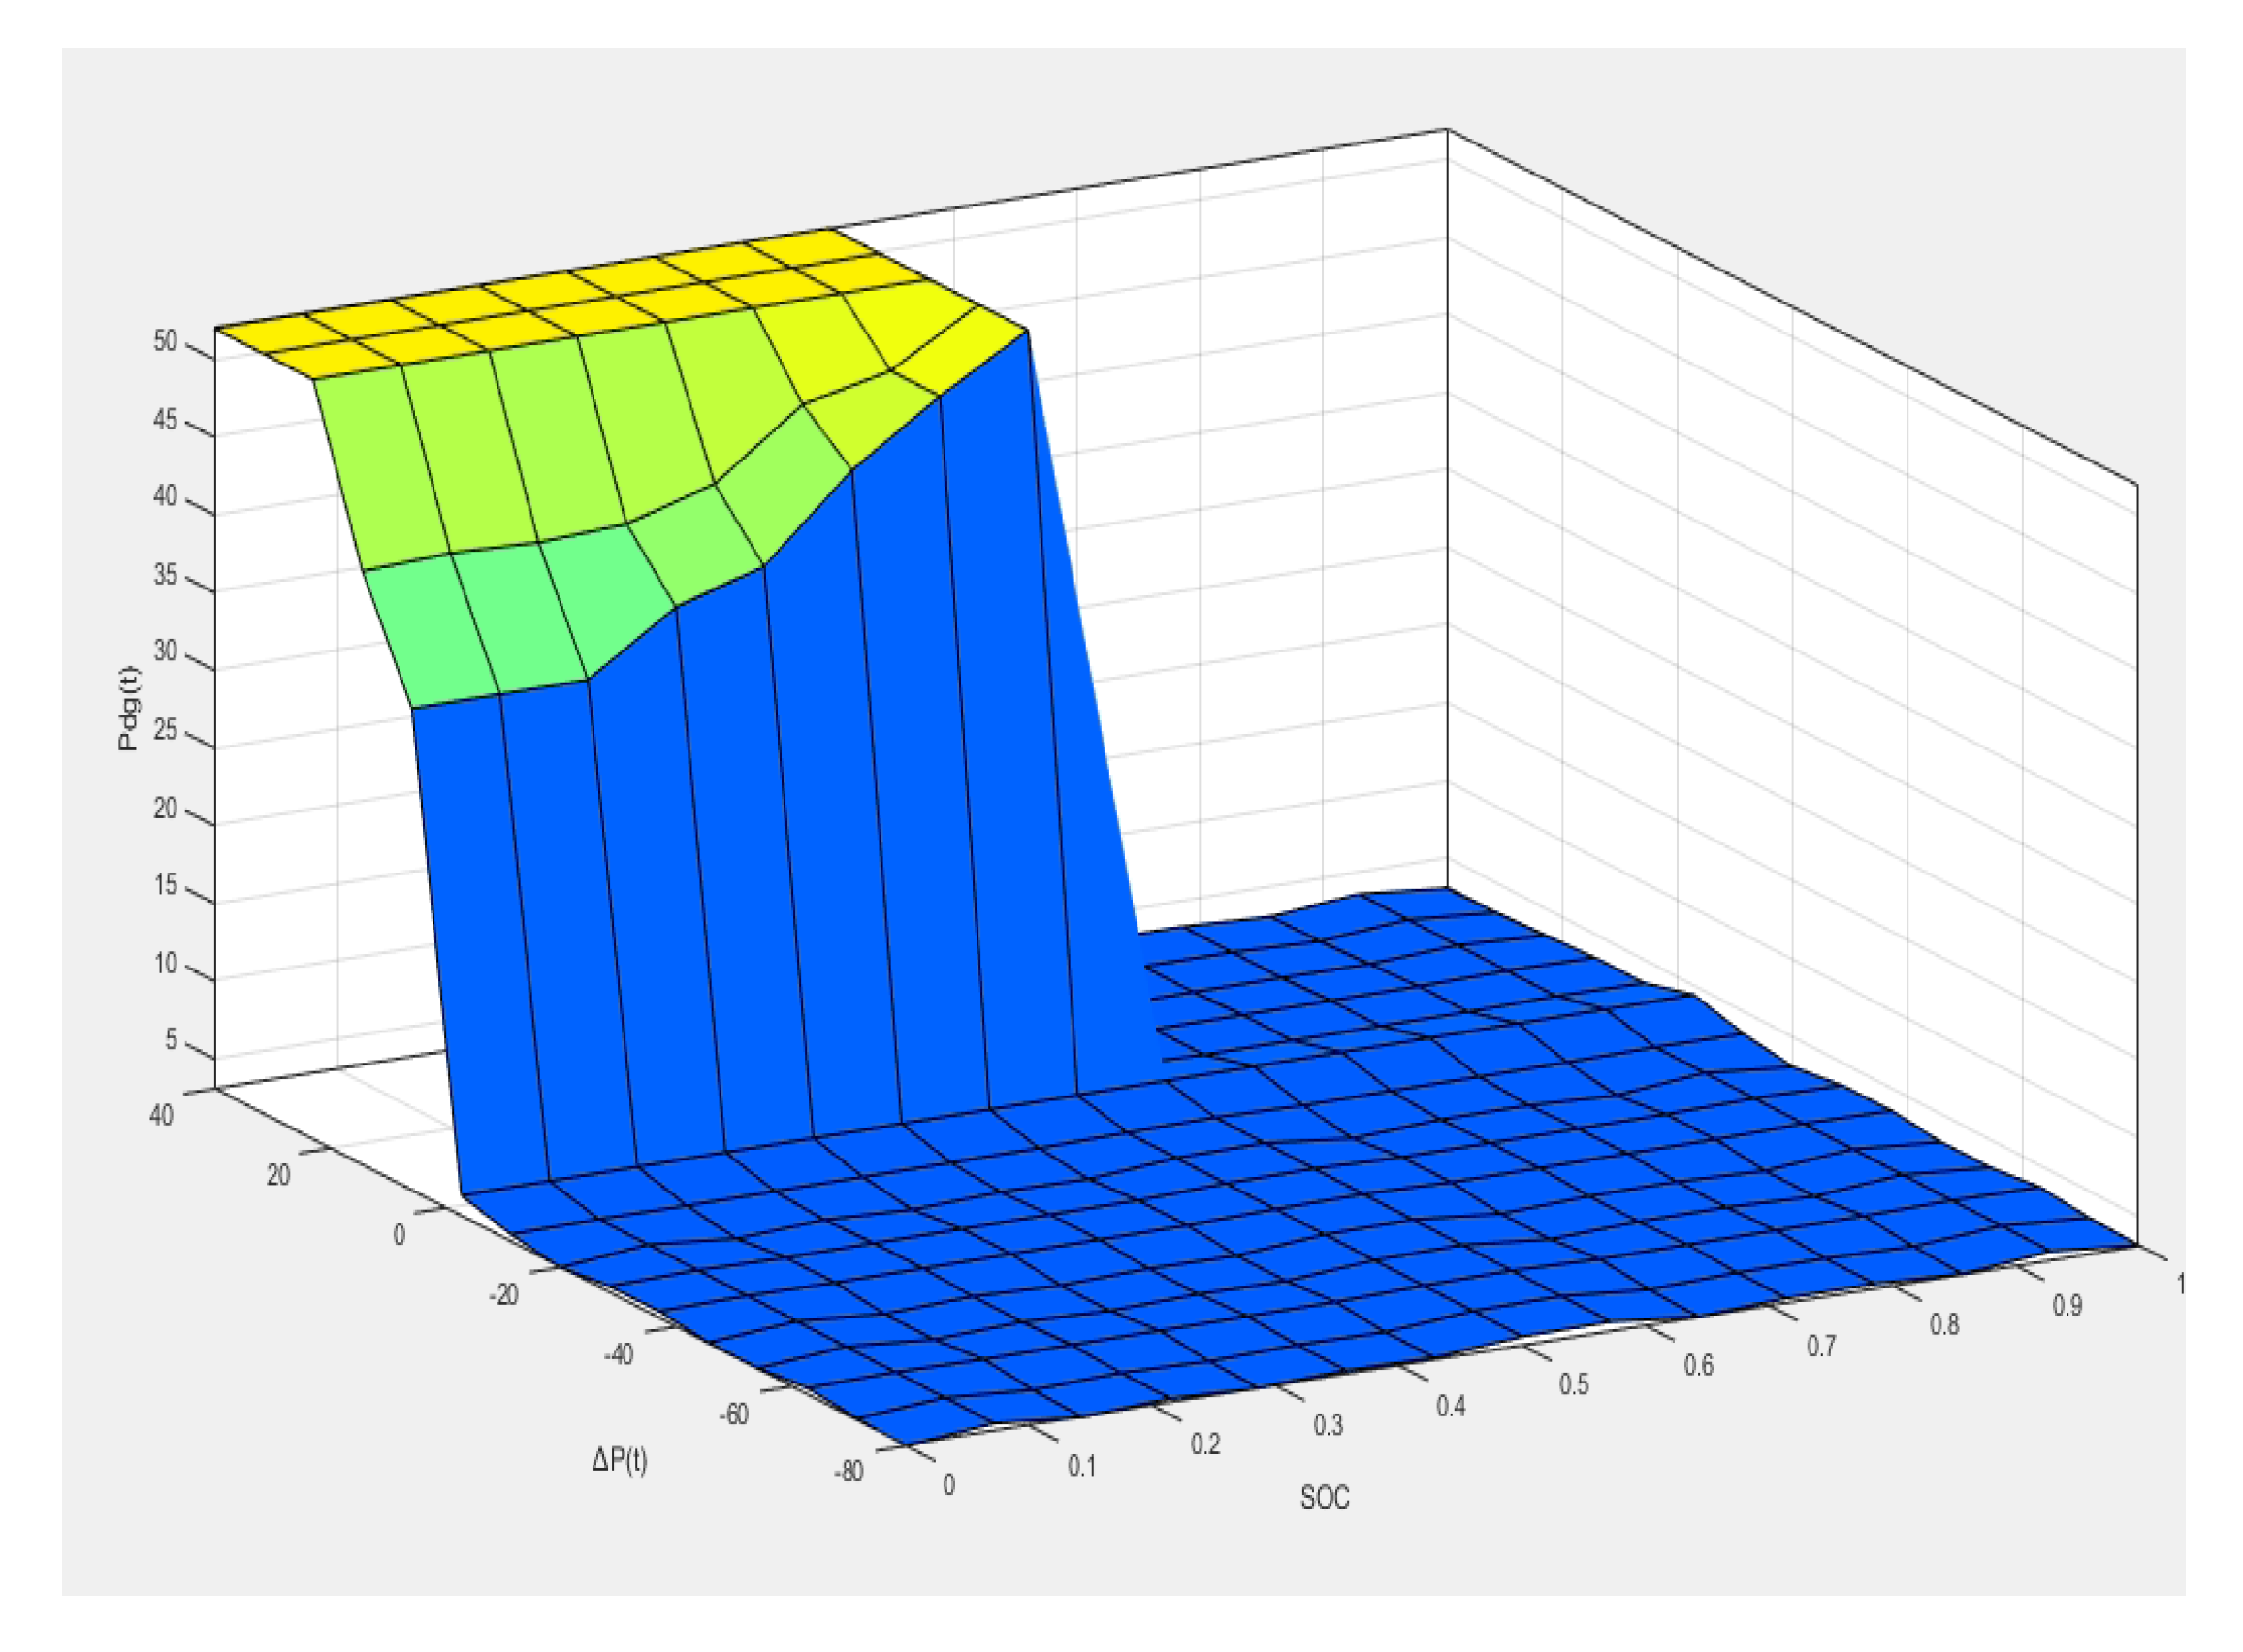
3.3. Formation of FLC2 Rules
4. Data and Case Study
4.1. Case Study
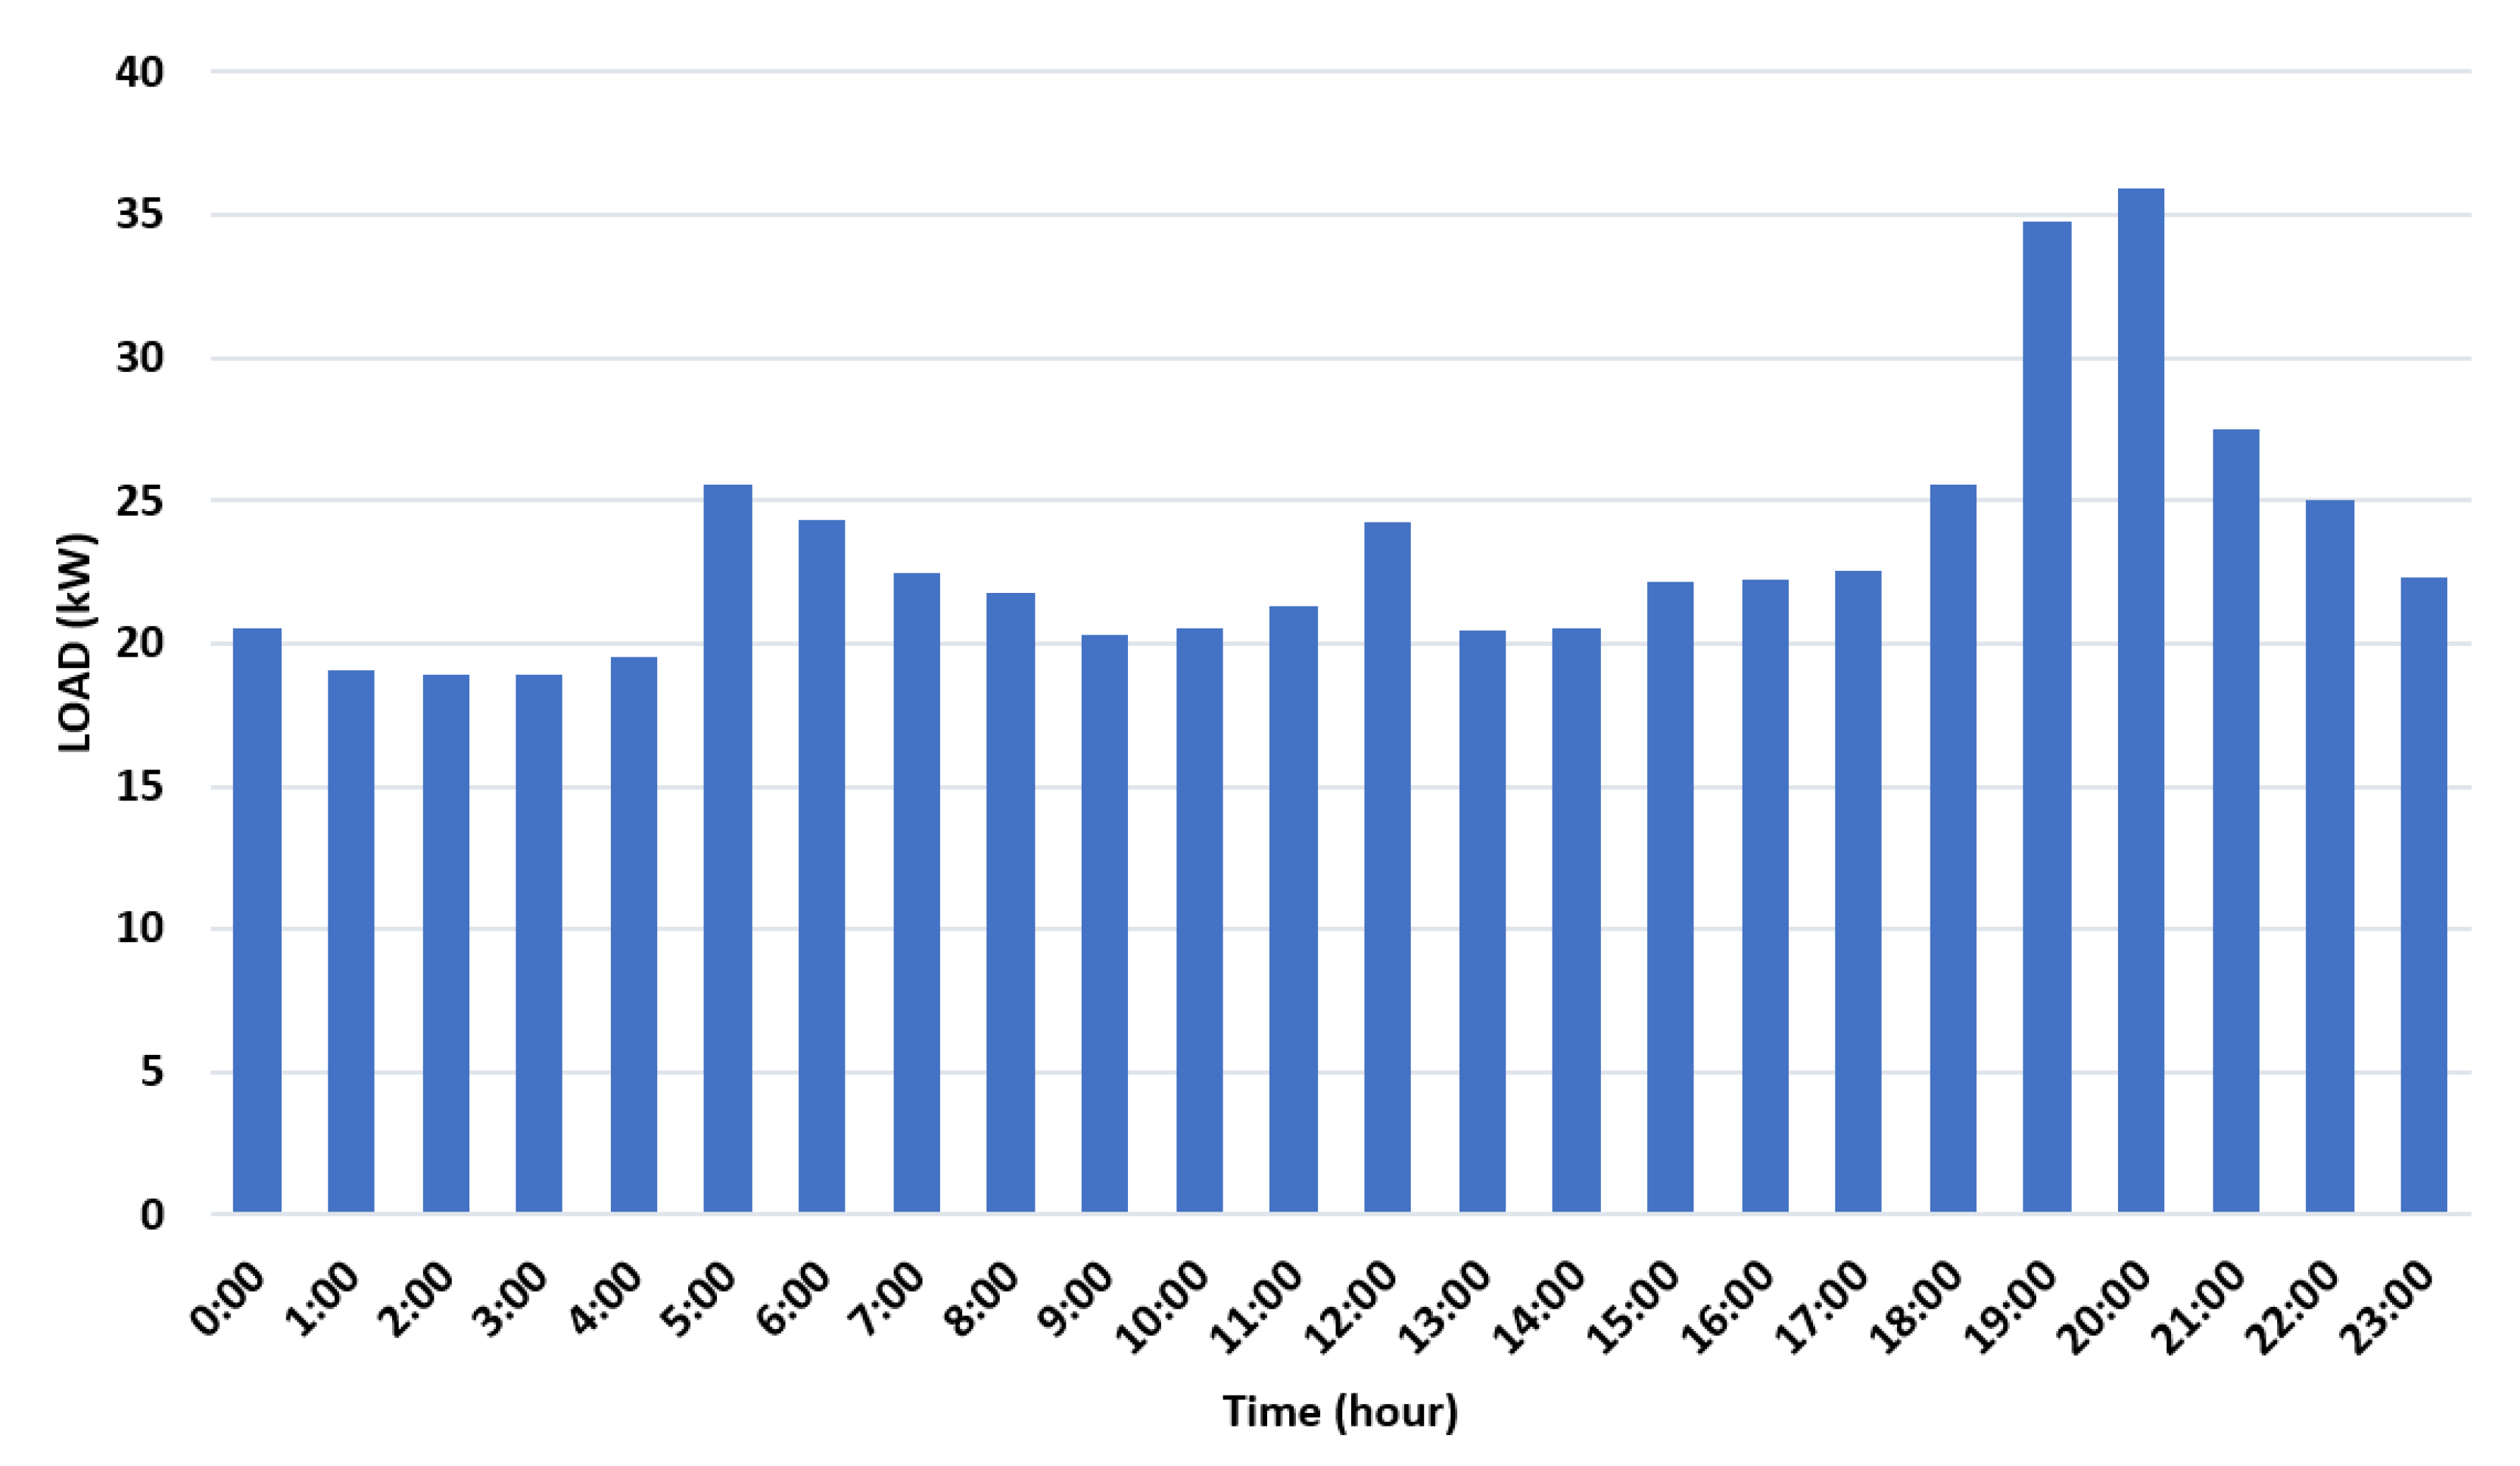
4.1.1. Load Profile
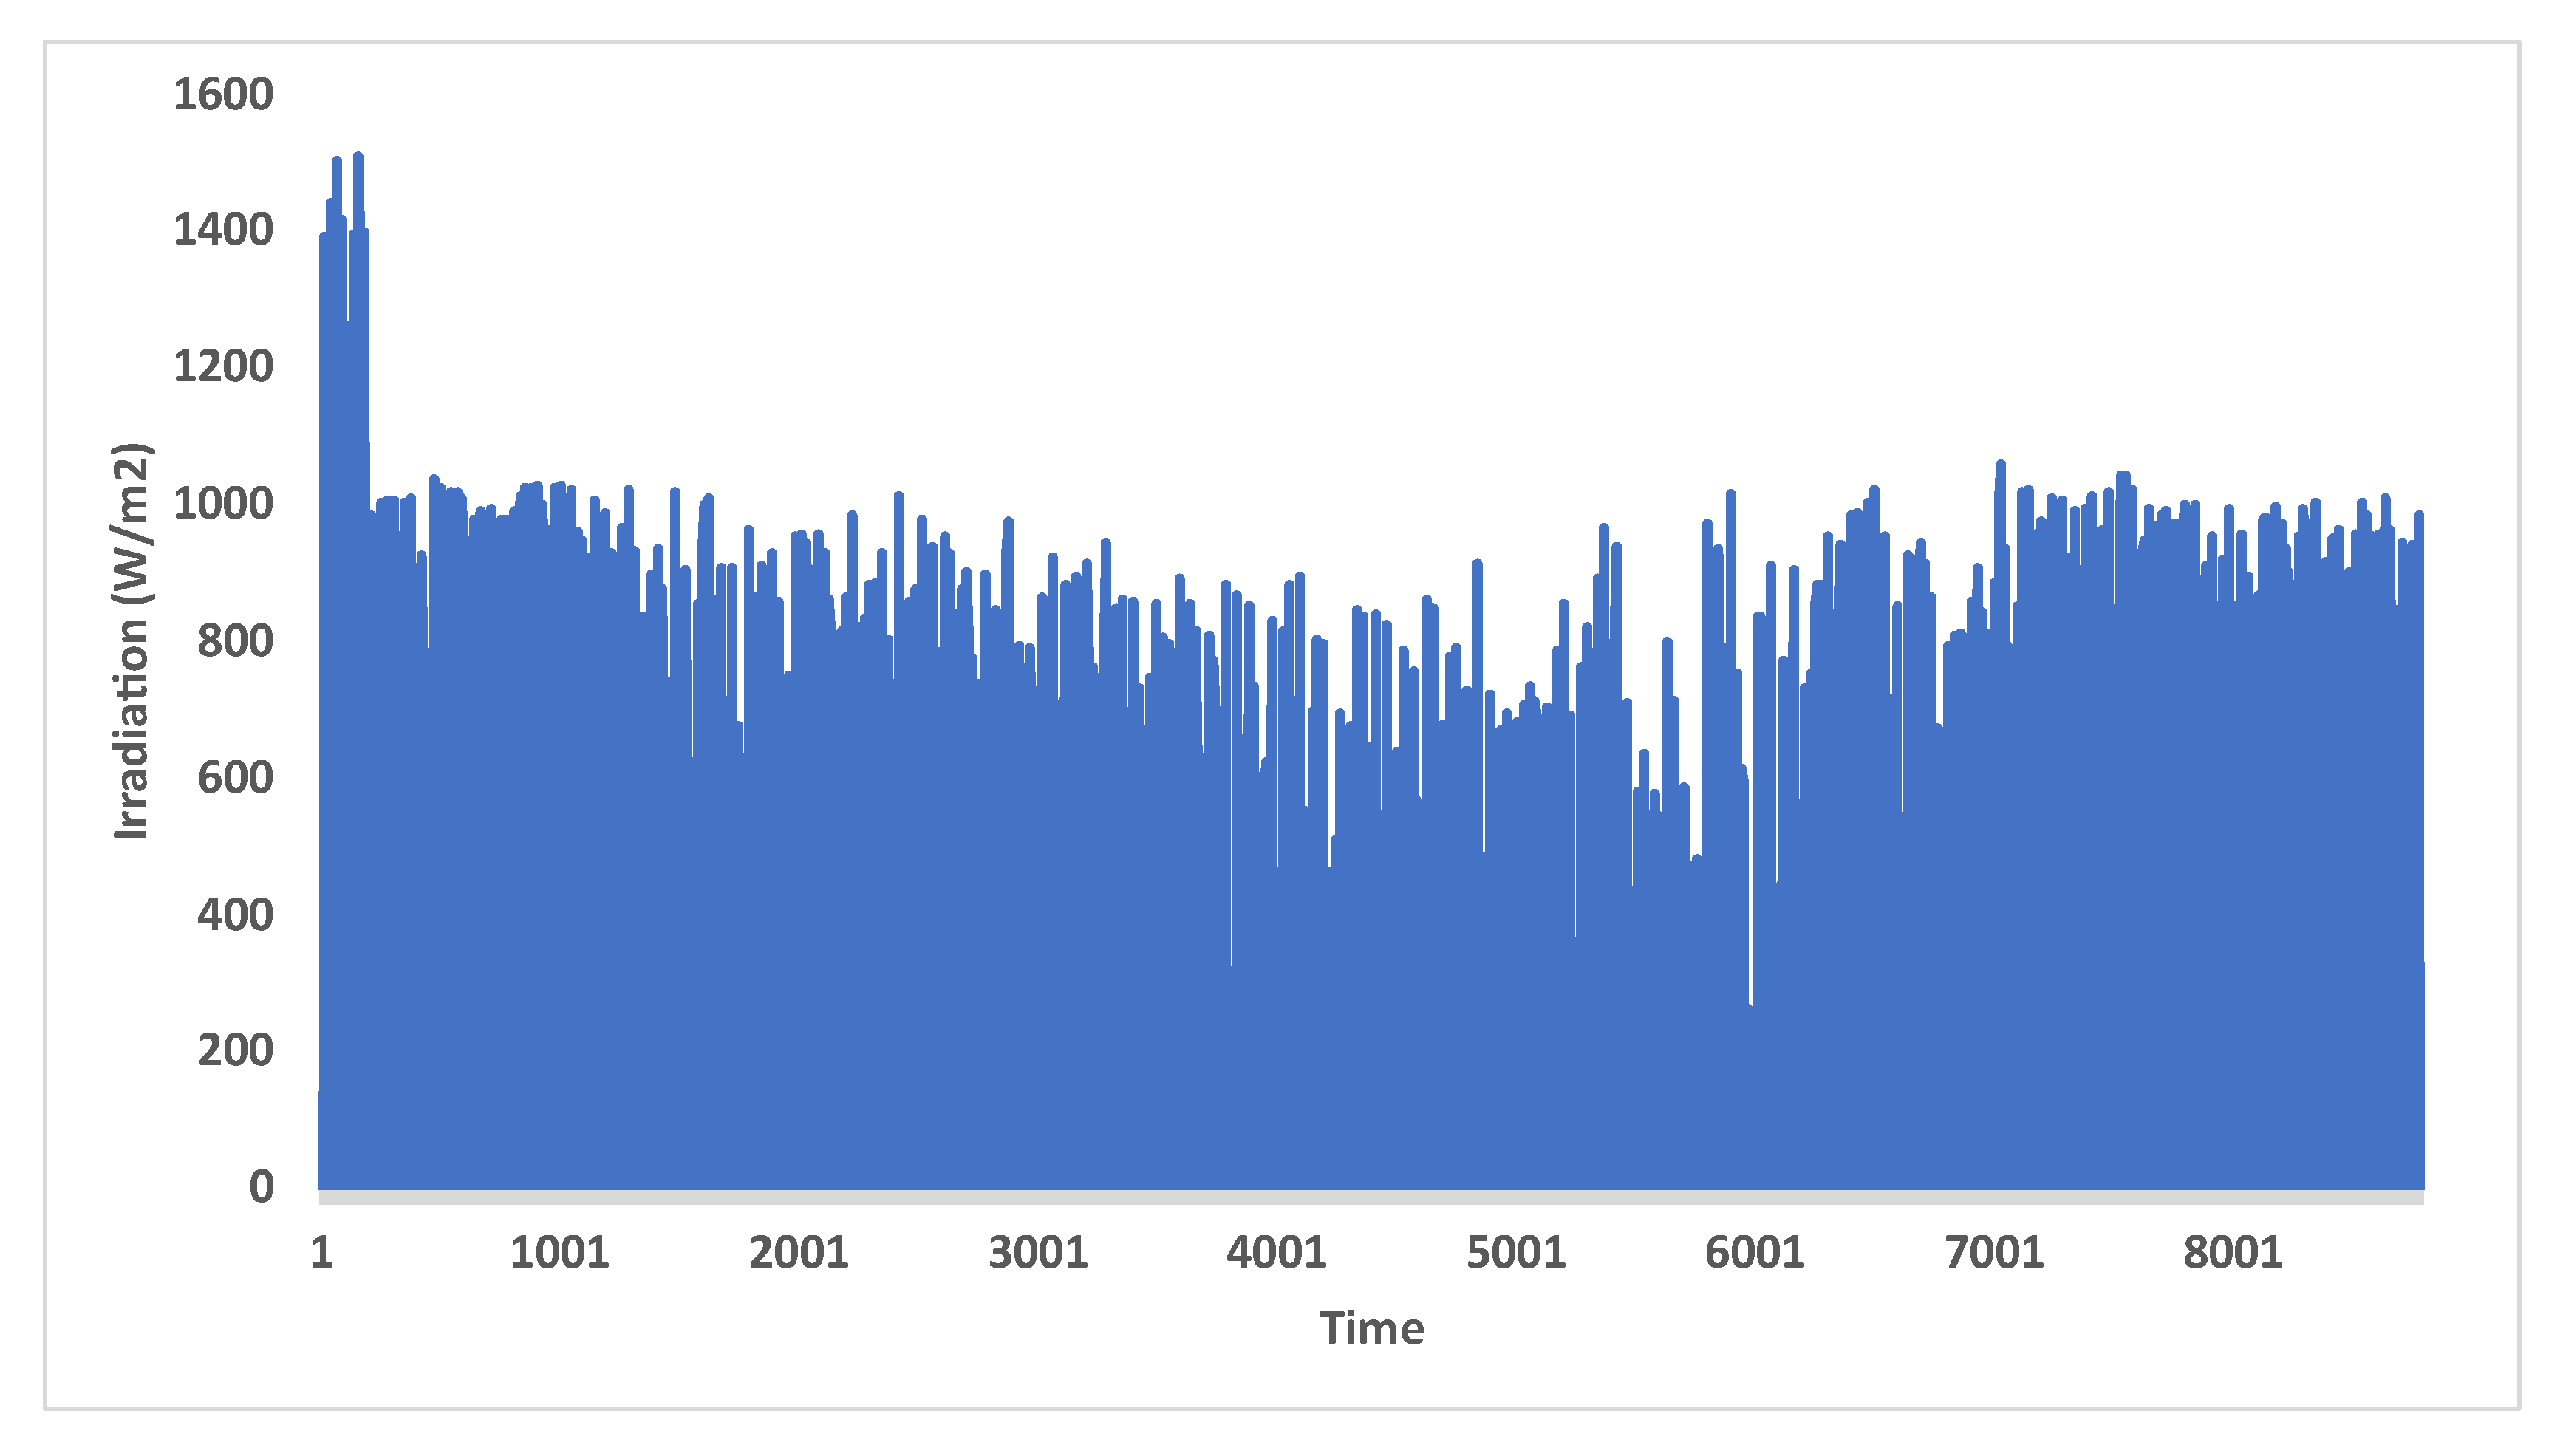
4.1.2. Solar Irradiance, Wind Speed, and Temperature Data
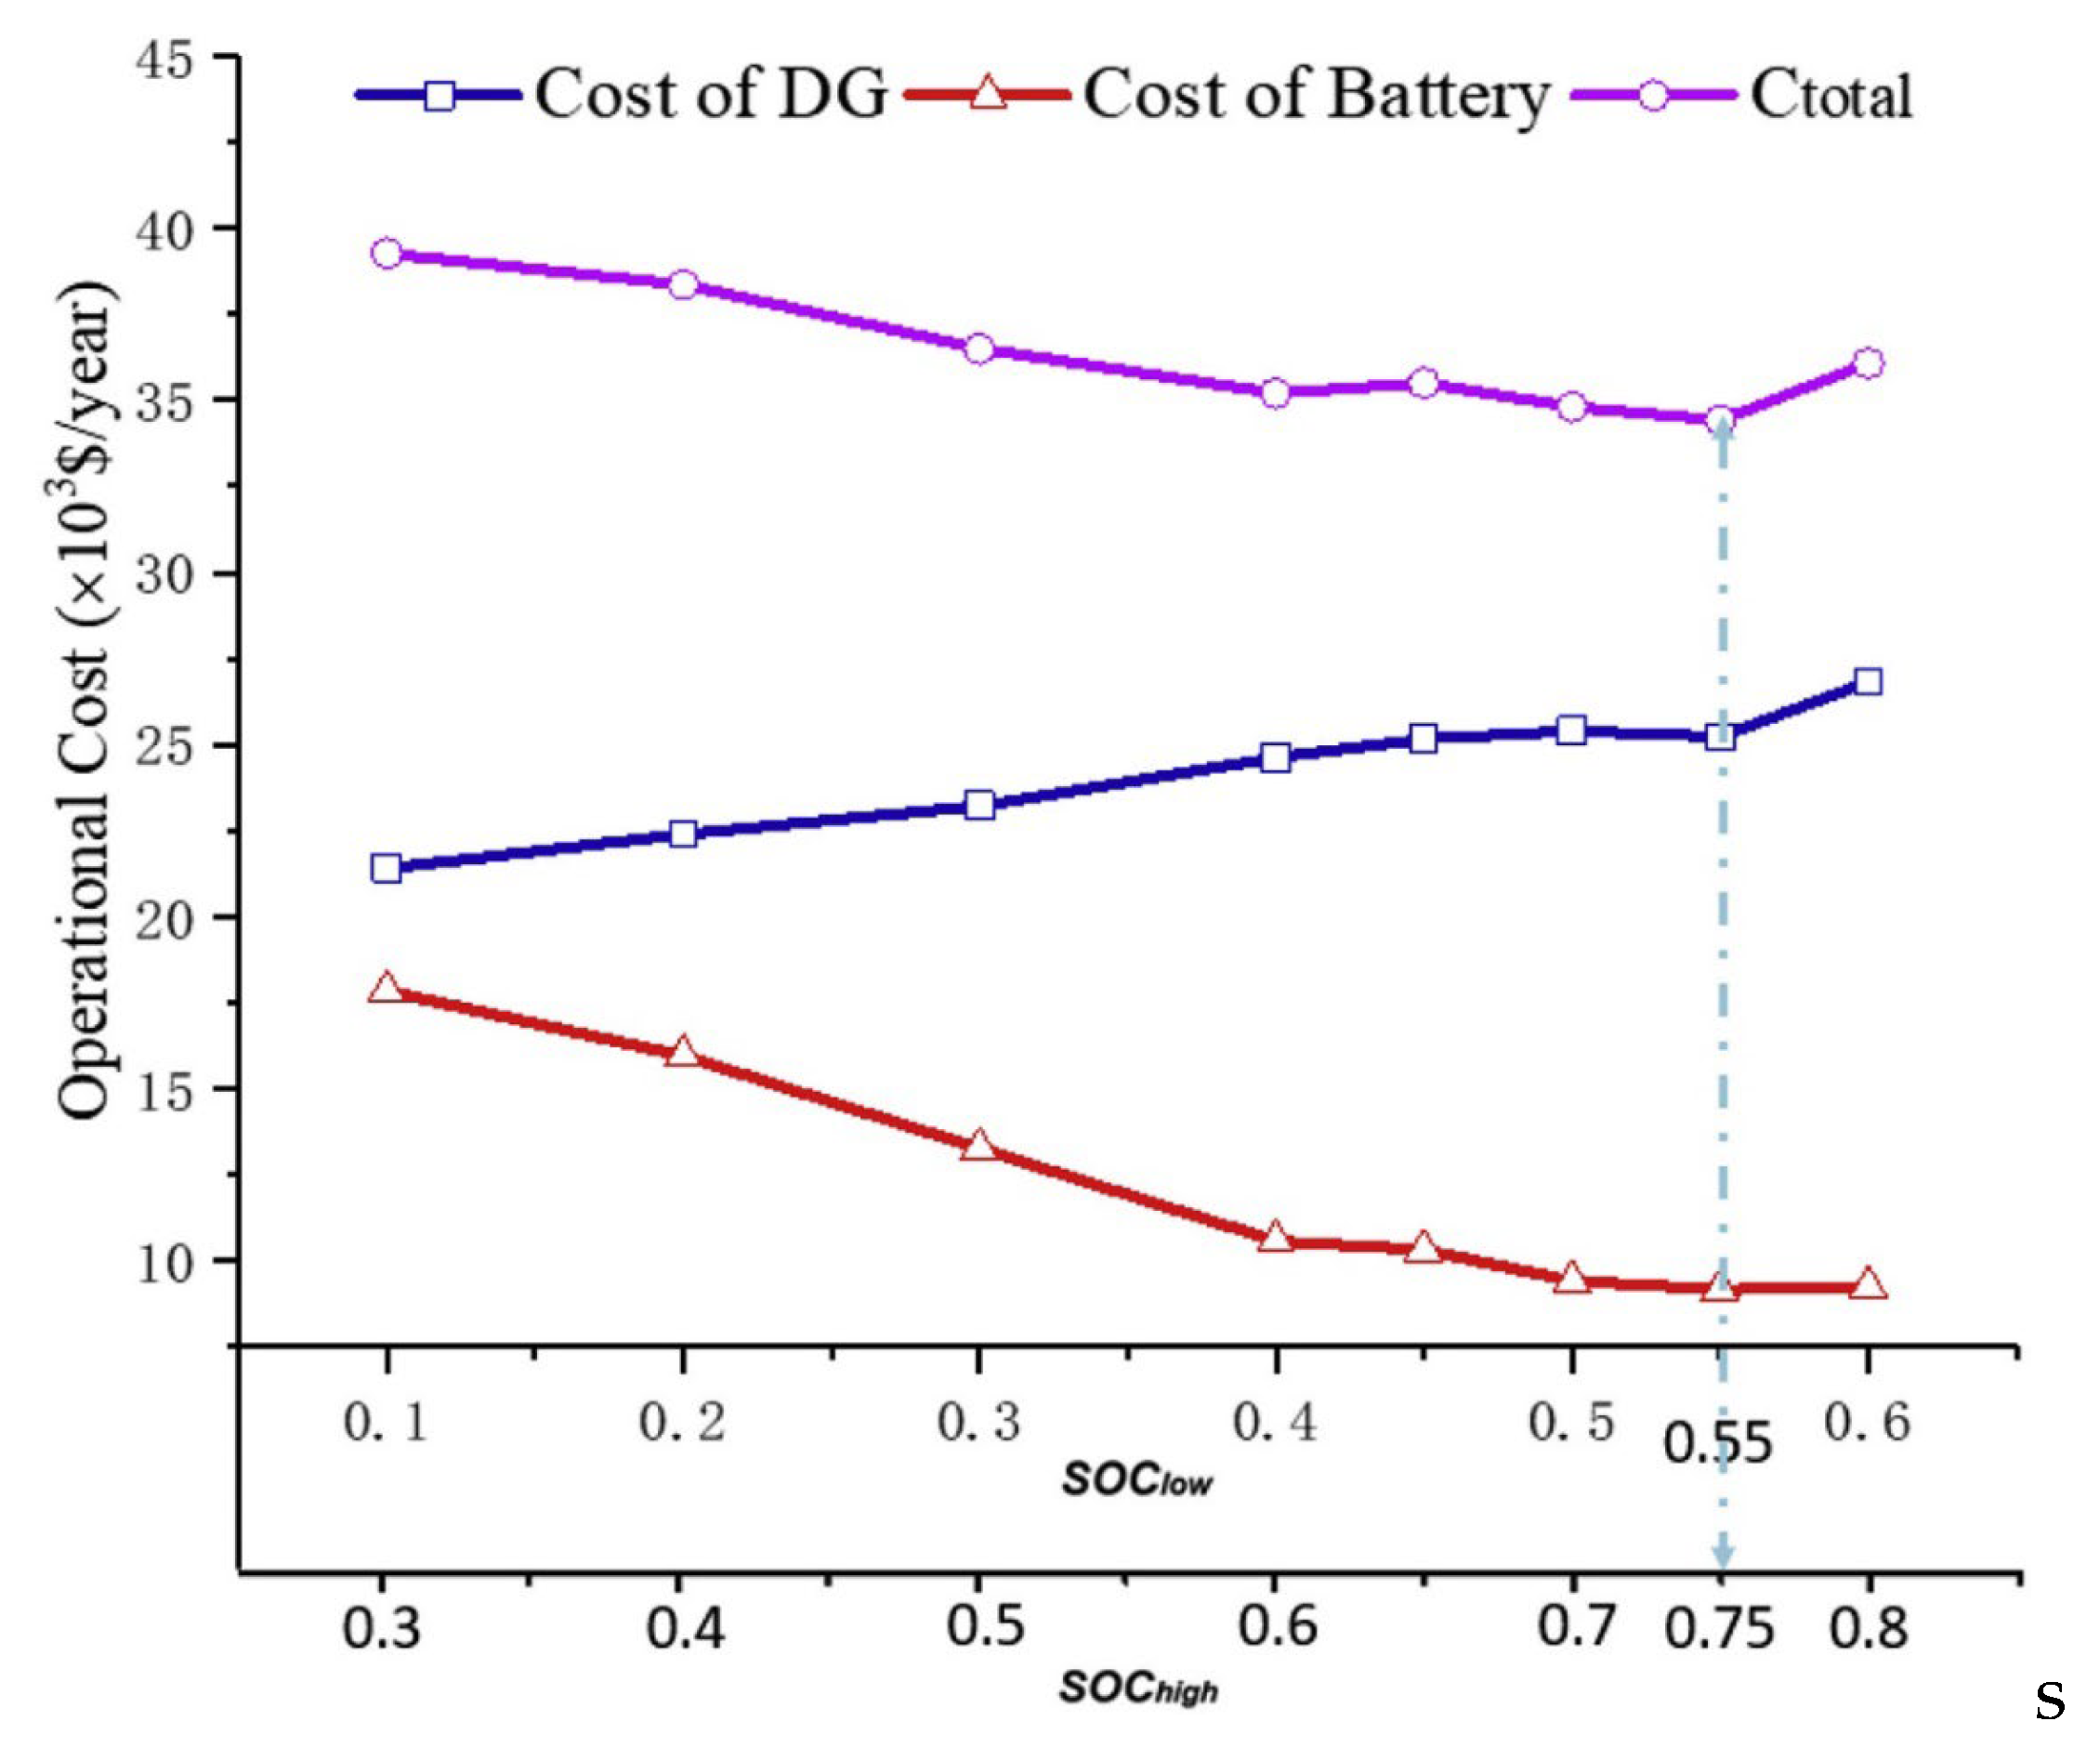
4.2. Battery Life Cycle
4.3. Investment Cost Analysis
- PV panels and accessories, including the PV cable and mounting accessories.
- Battery and battery accessories, including battery cable and battery rack.
- Diesel generator (DG) and DG accessories.
- Inverter and inverter accessories.
- Distribution costs, including erecting the electric poles, aluminum conductor steel-reinforced (ACSR) cable, recline cable, and stay wires.
- Metering, including the meter, protective circuit breaker (PCB), and data concentrator unit (DCU) to monitor consumer consumption.
- Development and installation costs, including the cost of the land acquisition, cost of land clearing and preparation, cost of feasibility studies, environmental impact assessment (EIA) cost, technical design cost, Nigerian Electricity Management Service Agency (NEMSA) permit cost, Nigeria Electricity Regulatory Commission (NERC) license cost, Rural Electrification Agency (REA) license cost, and cost of acquiring the land title/certificate of occupancy (C of O) by the state government.
- Wind turbines and accessories costs were collected from ATO, a manufacturer of wind turbines.
- Fuel cost was estimated at USD 1.57/L, the equivalent of NGN 700/L, the prevailing diesel price in Nigeria as of June 2022. The interest rate of 11.5% was Nigeria’s prevailing interest rate as of June 2022.
5. Results and Discussion
5.1. Size Optimization Results
5.2. Comparing This Paper’s LCOE Result with LCOE Values from Other Studies
5.3. Fuzzy Logic Controller Results
6. Conclusions
Author Contributions
Funding
Institutional Review Board Statement
Informed Consent Statement
Data Availability Statement
Acknowledgments
Conflicts of Interest
References
- Stears Data and Sterling. Nigeria’s State of Power ‘Electrifying the Nation’s Economy; Stears Data and Sterling: Lagos, Nigeria, 2022. [Google Scholar]
- Nigeria to Improve Electricity Access and Services to Citizens. Available online: https://www.worldbank.org/en/news/press-release/2021/02/05/nigeria-to-improve-electricity-access-and-services-to-citizens (accessed on 28 June 2022).
- Nigeria—Living Standards Survey 2018–2019. Available online: https://microdata.worldbank.org/index.php/catalog/3827 (accessed on 28 January 2023).
- Electric Power Sector Reform Act. The Federal Government Press: Lagos, Nigeria, 2005. Available online: https://rea.gov.ng/wp-content/uploads/2017/09/Electric-Power-Sector-Reform-Act-2005.pdf (accessed on 29 January 2023).
- Owebor, K.; Diemuodeke, E.O.; Briggs, T.A.; Imran, M. Power Situation and renewable energy potentials in Nigeria—A case for integrated multi-generation technology. Renew. Energy 2021, 177, 773–796. [Google Scholar] [CrossRef]
- Advisory PowerTeam, Office of the Vice President. Federal Government of Nigeria in Conjunction with the Power Africa “Nigeria Power Baseline Report, 2015”. Available online: https://www.yumpu.com/en/document/view/55374330/nigeria-power-baseline-report (accessed on 18 January 2023).
- The Challenges with Transforming the Nigerian Power Landscape. Available online: https://www.pwc.com/ng/en/assets/pdf/power-roundtable-2016.pdf (accessed on 28 January 2023).
- Data Catalog. Population Estimates and Projections. Nigeria Population 2021. Available online: https://datacatalog.worldbank.org/search/dataset/0037655/Population-Estimates-and-Projections (accessed on 29 January 2023).
- N. Enterprise Agency. Solar Report Nigeria Commissioned by The Netherlands Enterprise Agency, 2021; Netherlands Enterprise Agency: Hague, The Netherlands, 2021. [Google Scholar]
- Akhator, P.E.; Obanor, A.I.; Sadjere, E.G. Electricity situation and potential development in Nigeria using off-grid green energy solutions. J. Appl. Sci. Environ. Manag. 2019, 23, 527. [Google Scholar] [CrossRef]
- ESMAP Global Photovoltaic Power Potential by Country; World Bank: Washington, DC, USA, 2020.
- Ikeagwuani, I.; Bamisile, O.; Abbasoglu, S.; Julius, A. Performance Comparison of PV and Wind Farm in Four Different Regions of Nigeria. In Proceedings of the 1st Asup Unwana National Conference, Unwana, Nigeria, August 2016. [Google Scholar]
- Shaaban, M.; Petinrin, J.O. Renewable energy potentials in Nigeria: Meeting rural energy needs. Renew. Sustain. Energy Rev. 2014, 29, 72–84. [Google Scholar] [CrossRef]
- Relations, E.-I. Renewable Energy: Global Challenges. Available online: https://www.e-ir.info/2016/05/27/renewable-energy-global-challenges/ (accessed on 18 January 2023).
- Farzaneh, H. Design of a Hybrid Renewable Energy System Based on Supercritical Water Gasification of Biomass for Off-Grid Power Supply in Fukushima. Energies 2019, 12, 2708. [Google Scholar] [CrossRef] [Green Version]
- Shaqour, A.; Farzaneh, H.; Yoshida, Y.; Hinokuma, T. Power control and simulation of a building integrated stand-alone hybrid PV-wind-battery system in Kasuga City, Japan. Energy Rep. 2020, 6, 1528–1544. [Google Scholar] [CrossRef]
- Liu, Z.; Li, H.; Liu, K.; Yu, H.; Cheng, K. Design of high-performance water-in-glass evacuated tube solar water heaters by a high-throughput screening based on machine learning: A combined modeling and experimental study. Sol. Energy 2017, 142, 61–67. [Google Scholar] [CrossRef]
- Farzaneh, H. Energy Systems Modeling. In Energy Systems Modeling; Springer: Singapore, 2019. [Google Scholar] [CrossRef]
- Pelland, S.; Turcotte, D.; Colgate, G.; Swingler, A. Nemiah valley photovoltaic-diesel mini-grid: System performance and fuel saving based on one year of monitored data. IEEE Trans. Sustain. Energy 2012, 3, 167–175. [Google Scholar] [CrossRef]
- Yin, C.; Wu, H.; Locment, F.; Sechilariu, M. Energy management of DC microgrid based on photovoltaic combined with diesel generator and supercapacitor. Energy Convers. Manag. 2017, 132, 14–27. [Google Scholar] [CrossRef]
- Xu, L.; Wang, Z.; Liu, Y.; Xing, L. Energy allocation strategy based on fuzzy control considering optimal decision boundaries of standalone hybrid energy systems. J. Clean. Prod. 2021, 279, 123810. [Google Scholar] [CrossRef]
- Lian, J.; Zhang, Y.; Ma, C.; Yang, Y.; Chaima, E. A review on recent sizing methodologies of hybrid renewable energy systems. Energy Convers. Manag. 2019, 199, 112027. [Google Scholar] [CrossRef]
- Anoune, K.; Bouya, M.; Astito, A.; Abdellah, A. Ben Sizing methods and optimization techniques for PV-wind based hybrid renewable energy system: A review. Renew. Sustain. Energy Rev. 2018, 93, 652–673. [Google Scholar] [CrossRef]
- Liu, Z.; Chen, Y.; Zhuo, R.; Jia, H. Energy storage capacity optimization for autonomy microgrid considering CHP and EV scheduling. Appl. Energy 2018, 210, 1113–1125. [Google Scholar] [CrossRef]
- Amer, M.; Namaane, A.; M’Sirdi, N.K. Optimization of hybrid renewable energy systems (HRES) using PSO for cost reduction. Energy Procedia 2013, 42, 318–327. [Google Scholar] [CrossRef] [Green Version]
- Yoshida, Y.; Farzaneh, H. Optimal design of a stand-alone residential hybrid microgrid system for enhancing renewable energy deployment in Japan. Energies 2020, 13, 1737. [Google Scholar] [CrossRef] [Green Version]
- Mohammed, O.H.; Amirat, Y.; Benbouzid, M. Particle Swarm Optimization Of a Hybrid Wind/Tidal/PV/Battery Energy System. Application To a Remote Area In Bretagne, France. Energy Procedia 2019, 162, 87–96. [Google Scholar] [CrossRef]
- Takatsu, N.; Farzaneh, H. Techno-economic analysis of a novel hydrogen-based hybrid renewable energy system for both grid-tied and off-grid power supply in Japan: The case of Fukushima prefecture. Appl. Sci. 2020, 10, 4061. [Google Scholar] [CrossRef]
- Yuan, Y.; Zhang, T.; Shen, B.; Yan, X.; Long, T. A fuzzy logic energy management strategy for a photovoltaic/diesel/battery hybrid ship based on experimental database. Energies 2018, 11, 2211. [Google Scholar] [CrossRef] [Green Version]
- Althubaiti, M.; Bernard, M.; Musilek, P. Fuzzy logic controller for hybrid renewable energy system with multiple types of storage. In Proceedings of the 2017 IEEE 30th Canadian Conference on Electrical and Computer Engineering, Windsor, ON, Canada, 30 April–3 May 2017. [Google Scholar] [CrossRef]
- Chaurey, A.; Kandpal, T.C. A techno-economic comparison of rural electrification based on solar home systems and PV microgrids. Energy Policy 2010, 38, 3118–3129. [Google Scholar] [CrossRef]
- Lumpur, K. Techno Economic Analysis Of Stand-Alone Hybrid Renewable Energy System Hanieh Borhanazad Research Project. Master’s Thesis, Faculty of Engineering, University of Malaya, Kuala Lumpur, Malaysia, 2013. [Google Scholar]
- Hinokuma, T.; Farzaneh, H.; Shaqour, A. Techno-economic analysis of a fuzzy logic control based hybrid renewable energy system to power a university campus in Japan. Energies 2021, 14, 1960. [Google Scholar] [CrossRef]
- Berrazouane, S.; Mohammedi, K. Parameter optimization via cuckoo optimization algorithm of fuzzy controller for energy management of a hybrid power system. Energy Convers. Manag. 2014, 78, 652–660. [Google Scholar] [CrossRef]
- Goudarzi, A.; Li, Y.; Xiang, J. Efficient energy management of renewable resources in microgrids. In Renewable Energy Microgeneration Systems; Customer-Led Energy Transition to Make a Sustainable World; Academic Press: London, UK, 2021; pp. 285–321. [Google Scholar] [CrossRef]
- Mohamed, M.A.; Eltamaly, A.M.; Alolah, A.I. Sizing and techno-economic analysis of stand-alone hybrid photovoltaic/wind/diesel/battery power generation systems. J. Renew. Sustain. Energy 2015, 7, 063128. [Google Scholar] [CrossRef]
- Kennedy, J.; Eberhart, R. Particle Swarm Optimization. In Proceedings of the ICNN’95—International Conference on Neural Networks, Perth, WA, Australia, 27 November 1995; Available online: https://www.cs.tufts.edu/comp/150GA/homeworks/hw3/_reading6%201995%20particle%20swarming.pdf (accessed on 28 June 2022).
- Moghaddam, A.A.; Seifi, A.; Niknam, T.; Alizadeh Pahlavani, M.R. Multi-objective operation management of a renewable MG (micro-grid) with back-up micro-turbine/fuel cell/battery hybrid power source. Energy 2011, 36, 6490–6507. [Google Scholar] [CrossRef]
- Kashefi Kaviani, A.; Riahy, G.H.; Kouhsari, S.M. Optimal design of a reliable hydrogen-based stand-alone wind/PV generating system, considering component outages. Renew. Energy 2009, 34, 2380–2390. [Google Scholar] [CrossRef]
- Johnston, R. Fuzzy logic control. Microelectron. J. 1995, 26, 481–495. [Google Scholar] [CrossRef]
- Goguen, J.A.; Zadeh, L.A. Fuzzy sets. Inf. Control. 1965, 8, 338–353. [Google Scholar] [CrossRef] [Green Version]
- Bai, Y.; Wang, D. Fundamentals of fuzzy logic control—Fuzzy sets, fuzzy rules and defuzzifications. In Advances in Industrial Control; Springer: London, UK, 2006; pp. 17–36. [Google Scholar] [CrossRef]
- POWER. Data Access Viewer. Available online: https://power.larc.nasa.gov/data-access-viewer/ (accessed on 18 January 2023).
- Sun. Power VR L Valve Regulated Lead-Acid Batteries for Cyclic Applications. Available online: https://www.hoppecke.com (accessed on 18 January 2023).
- Amutha, W.M.; Rajini, V. Cost benefit and technical analysis of rural electrification alternatives in southern India using HOMER. Renew. Sustain. Energy Rev. 2016, 62, 236–246. [Google Scholar] [CrossRef]
- Hiendro, A.; Kurnianto, R.; Rajagukguk, M.; Simanjuntak, Y.M.; Junaidi. Techno-economic analysis of photovoltaic/wind hybrid system for onshore/remote area in Indonesia. Energy 2013, 59, 652–657. [Google Scholar] [CrossRef]
- Azimoh, C.L.; Klintenberg, P.; Wallin, F.; Karlsson, B.; Mbohwa, C. Electricity for development: Mini-grid solution for rural electrification in South Africa. Energy Convers. Manag. 2016, 110, 268–277. [Google Scholar] [CrossRef] [Green Version]
- Come Zebra, E.I.; van der Windt, H.J.; Nhumaio, G.; Faaij, A.P.C. A review of hybrid renewable energy systems in mini-grids for off-grid electrification in developing countries. Renew. Sustain. Energy Rev. 2021, 144, 111036. [Google Scholar] [CrossRef]


| Country | Research Goal | System Components | Objective Function | Optimization Method | Impact Category | Ref. |
|---|---|---|---|---|---|---|
| Japan | To design an optimal standalone microgrid for powering a residential area. | PV/wind/battery/DG | Total cost | PSO | Economic | [26] |
| France | To optimize the power generated by a hybrid renewable energy system | Wind turbine/tidal turbine/PV module/battery | Total net present cost | PSO | Economic | [27] |
| Australia | To control the power flow of an HRES with multiple renewable energy sources and multiple energy-storage systems | PV/wind/fuel cell/battery | EMS control | Fuzzy logic | Reliability | [30] |
| India | To make a technoeconomic comparison between an SHS and a microgrid | SHS/PV/wind/battery/DG | Annualized life-cycle costs (ALCCs) | HOMER | Economic | [31] |
| Malaysia | To investigate the technoeconomic analysis of an optimal standalone HRES in remote areas | PV/wind/battery/DG | COE LPSP | PSO | Economic, reliability | [32] |
| Japan | To reduce the load demand of buildings on an HRES | Grid-tied hybrid solar/wind/hydrogen | LCOE | Fuzzy logic | Economic | [33] |
| Algeria | To develop an optimal FLC for the operation of a standalone HRES that is based on a CSA | PV/battery/DG | LPSP, excess energy, LEC | Fuzzy logic | Economic, reliability | [34] |
| ∆P(t)/SOC | Multiplier | ||||||
|---|---|---|---|---|---|---|---|
| ML | L | SL | S | SH | H | MH | |
| NH | MH | MH | MH | MH | MH | MH | ML |
| NS | MH | MH | MH | MH | MH | MH | ML |
| NL | MH | MH | MH | MH | MH | MH | ML |
| PL | ML | ML | ML | ML | MH | MH | MH |
| PS | ML | ML | ML | ML | MH | MH | MH |
| PH | ML | ML | ML | ML | MH | MH | MH |
| ∆P(t)′/SOC | PDG(t) | ||||||
|---|---|---|---|---|---|---|---|
| ML | L | SL | S | SH | H | MH | |
| NH | VL | VL | VL | VL | VL | VL | VL |
| NL | VL | VL | VL | VL | VL | VL | VL |
| NS | VL | VL | VL | VL | VL | VL | VL |
| PL | VL | VL | VL | VL | VL | VL | VL |
| PS | S | S | S | VL | VL | VL | VL |
| PH | H | H | MH | MH | VL | VL | VL |
| PMH | VH | VH | VH | MH | VL | VL | VL |
| PVH | VH | VH | VH | MH | VL | VL | VL |
| PMVH | VH | VH | VH | MH | VL | VL | VL |
| Equipment | Initial Cost (USD/kW) | Lifetime (Years) | Efficiency |
|---|---|---|---|
| PV (including PV cable and PV mounting accessories) | 704.63 | 24 | |
| Wind turbine and wind-turbine-installation accessories | 1619.74 | 24 | |
| Battery (including battery cable and battery rack) | 188.17 | 16 | 0.85 |
| Diesel generator (DG accessories and ATS) | 156.13 | 24,000 h | |
| Inverter and accessories | 645.69 | 24 | 0.92 |
| PV controller (including accessories) | 102.09 | 24 | 0.95 |
| Wind turbine controller and accessories | 102.09 | 24 | 0.95 |
| Construction (including powerhouse, fencing, and PV array foundation) | 357.32 | ||
| Development and installation | 320.33 | ||
| Distribution and metering | 1063.70 | ||
| Fuel costs | USD 1.57 per liter | ||
| Interest rates | 11.5 | ||
| Project lifetime | 24 | ||
| Operation and maintenance costs | 20% of the initial cost |
| Equipment | 1st Scenario | 2nd Scenario | ||
|---|---|---|---|---|
| Minimum Capacity | Maximum Capacity | Minimum Capacity | Maximum Capacity | |
| PV | 0 kW | 150 kW | 0 kW | 100 kW |
| Wind Turbine | 0 kW | 100 kW | 0 kW | 100 kW |
| Battery | 0 kWh | 2000 kWh | 0 kWh | 700 kWh |
| Generator | 0 kW | 100 kW | 0 kW | 100 kW |
| Equipment Capacity | 1st Scenario | 2nd Scenario |
|---|---|---|
| PV | 130 kW | 100 kW |
| Wind Turbine | 0 kW | 0 kW |
| Battery | 1370 kWh | 700 kWh |
| Generator | 0 kW | 25 kW |
| LPSP | 0.20% | 0.05% |
| LCOE | 0.48 USD/kWh | 1.17 USD/kWh |
| System | Country | LCOE (USD/kWh) | Ref. |
|---|---|---|---|
| This study (PV/battery) | Nigeria | 0.48 | This study |
| This study (PV/battery/diesel) | Nigeria | 1.17 | This study |
| Hybrid wind/solar PV/diesel/battery, | India | 0.76 | [45] |
| Solar PV/wind/diesel | Indonesia | 1.06 | [46] |
| PV/wind/battery/diesel | Japan | 0.88 | [26] |
| Typical off-grid microgrid in Pacific Island: PV/diesel | Pacific Island | 1–1.7 | [26] |
| Solar PV/diesel/wind/battery | South Africa | 0.41 | [47] |
| Solar PV/diesel | Ecuador | 0.46 | [48] |
Disclaimer/Publisher’s Note: The statements, opinions and data contained in all publications are solely those of the individual author(s) and contributor(s) and not of MDPI and/or the editor(s). MDPI and/or the editor(s) disclaim responsibility for any injury to people or property resulting from any ideas, methods, instructions or products referred to in the content. |
© 2023 by the authors. Licensee MDPI, Basel, Switzerland. This article is an open access article distributed under the terms and conditions of the Creative Commons Attribution (CC BY) license (https://creativecommons.org/licenses/by/4.0/).
Share and Cite
Afolabi, T.; Farzaneh, H. Optimal Design and Operation of an Off-Grid Hybrid Renewable Energy System in Nigeria’s Rural Residential Area, Using Fuzzy Logic and Optimization Techniques. Sustainability 2023, 15, 3862. https://doi.org/10.3390/su15043862
Afolabi T, Farzaneh H. Optimal Design and Operation of an Off-Grid Hybrid Renewable Energy System in Nigeria’s Rural Residential Area, Using Fuzzy Logic and Optimization Techniques. Sustainability. 2023; 15(4):3862. https://doi.org/10.3390/su15043862
Chicago/Turabian StyleAfolabi, Taofeek, and Hooman Farzaneh. 2023. "Optimal Design and Operation of an Off-Grid Hybrid Renewable Energy System in Nigeria’s Rural Residential Area, Using Fuzzy Logic and Optimization Techniques" Sustainability 15, no. 4: 3862. https://doi.org/10.3390/su15043862