
Green Closed-Loop Supply Chain Networks’ Response to Various Carbon Policies during COVID-19

.jpg)
Abstract
:1. Introduction
1.1. Brief Description of the Problem
1.2. Research Gap and Contributions
- Designed the SC by all hygiene guidelines.
- Designed a GSC that considers COVID-19 from two pillars.
- Measured the effect of the three carbon rules on GCLSCN in the outbreak.
- Provided a Multi-Objective Mixed-Integer Programming (MOMIP) model for analyzing COVID-19 pandemic issues within the CLSC.
- Analyzed the mathematical model’s managerial implications.
2. Literature Review
2.1. Carbon Tax
2.2. Carbon CAP
2.3. Cap-and-Trade

| Author(s) | References | Year | Focused Carbon Tax | Focused Carbon Cap | Focused Cap-and-Trade | Focused COVID-19 |
|---|---|---|---|---|---|---|
| Waltho et al. | [111] | (2019) | * | * | * | |
| Zhang et al. | [42] | (2019) | * | |||
| Cadavid-Giraldo et al. | [44] | (2020) | * | * | ||
| Kuiti et al. | [84] | (2020) | * | |||
| Cao et al. | [20] | (2020) | * | |||
| Babagolzadeh et al. | [112] | (2020) | * | |||
| Bai et al. | [113] | (2020) | * | |||
| Zou et al. | [114] | (2020) | * | * | ||
| Kushwaha et al. | [46] | (2020) | * | |||
| Ghosh et al. | [50] | (2020,a) | * | |||
| Ghosh et al. | [51] | (2020,b) | * | |||
| Mishra et al. | [54] | (2020) | * | |||
| Tang & Yang | [55] | (2020) | * | |||
| Yang et al. | [67] | (2020) | * | |||
| Tong et al. | [85] | (2019) | * | |||
| Taleizadeh et al. | [82] | (2021) | * | |||
| Xu & Choi | [79] | (2021) | * | |||
| Li et al. | [80] | (2021) | * | |||
| Yang et al. | [53] | (2021) | * | |||
| Wang & Wu | [49] | (2021) | * | |||
| Lang et al. | [115] | (2021) | * | |||
| Liu et al. | [116] | (2021) | * | |||
| Zhang et al. | [117] | (2021) | * | |||
| Guo & Xi | [118] | (2022) | * | |||
| Meng et al. | [119] | (2022) | * | * | ||
| Zhu et al. | [120] | (2022) | * | |||
| Hu & Wang | [121] | (2022) | * | |||
| Zhang, Y. & Zhang, T. | [122] | (2022) | * | |||
| Paul et al. | [123] | (2022) | * | |||
| Shi & Liu | [124] | (2022) | * | |||
| Shen et al. | [125] | (2022) | * | * | ||
| Wu et al. | [74] | (2022) | * | |||
| Yu et al. | [126] | (2022) | * | |||
| Lyu et al. | [127] | (2022) | * | |||
| Cheng et al. | [21] | (2022) | * | * | ||
| Luo et al. | [102] | (2022) | * | |||
| Xu et al. | [22] | (2022) | * | |||
| Astanti et al. | [47] | (2022) | * | |||
| Wang et al. | [88] | (2022) | * | |||
| Chen et al. | [128] | (2022) | * | |||
| Wei & Huang | [129] | (2022) | * | |||
| Luo et al. | [130] | (2022) | * | |||
| Yi et al. | [131] | (2022) | * | |||
| This investigation | * | * | * | * |
3. Problem Statement, Assumptions, and Formulation
3.1. Problem Description
- Suppliers (S);
- Hybrid centers type one (M): (Manufacturing, Remanufacturing, Refurbishing, Recovering);
- Hybrid centers type two (J): (Collection, Distribution);
- Customers (C);
- Hybrid centers type three (D): (Recycling, Disposing);
3.2. Model Assumptions
- As part of social distancing during the COVID-19 pandemic, the manufacturing, remanufacturing, refurbishing, and recovering center has been merged, making hybrid centers type one. The collection and distribution centers have been connected, making hybrid centers type two. The recycling and disposal centers have been merged, making hybrid centers type three.
- A normal and hygiene cost is included in the model.
- Despite the COVID-19 pandemic and lockdowns, all customer demands were always met.
- Each returned product that enters the hybrid center’s type three disposal area is handled according to the COVID-19 hygiene protocol.
- There is certainty regarding customer demand and product returns.
- Potential locations include hybrid centers type one, two, and three
- The areas of suppliers and customers are known.
- For each node, there are various options for shipping.
- There is no limit to the capacity of any shipping alternative.
- Network nodes should be located at a feasible distance from each other.
- Supply chain networks are closed-loop systems.
- CO2 release for processing and transporting is determined and depends on the type of facilities and transportation mode used in the network.
3.3. Formulation Process of the Problems
3.3.1. Designing the CLSC Network without Taking into Consideration Carbon Emissions
Cost-Only Model during the COVID-19 Pandemic (M1)
3.3.2. Model Carbon Cap Policy (M2) Formulation
3.3.3. Model Formulation of Carbon Tax Policy (M3)
3.3.4. Model Formulation of Carbon Cap-and-Trade Policy (M4)
4. Computational Results and Case Study
4.1. Numerical Example
4.2. Case Study
5. Sensitivity Analysis
5.1. Sensitivity Analysis of the Second Model
5.2. Sensitivity Analysis of the Third Model
5.3. Sensitivity Analysis of the Fourth Model
6. Practical Ideas and Managerial Consequences
7. Conclusions and Remarkable Outcomes, Limitations, and Future Works
7.1. Conclusion and Remarkable Outcomes
- Keeping all hygiene guidelines in mind when designing a SC.
- Logistics networks should take both economic and environmental factors into account during the COVID-19 outbreak.
- An integrated GSC that addresses COVID-19 from two pillars.
- A study was conducted to measure the effect of the three carbon rules on GCLSCN during the outbreak.
- We analyzed COVID-19 pandemic issues within the CLSC using a Multi-Objective Mixed-Integer Programming (MOMIP) model.
- A study of the managerial implications of the mathematical model was conducted.
- When an outbreak occurs, making decisions about production locations, production technology, and transportation modes is crucial.
- A carbon cap, carbon tax, and carbon cap-and-trade policy framework will be used to evaluate SC operations as part of this project.
7.2. Limitations
7.3. Insights into Future Research Directions
Author Contributions
Funding
Institutional Review Board Statement
Informed Consent Statement
Data Availability Statement
Conflicts of Interest
References
- Poursoltan, L.; Seyed-Hosseini, S.M.; Jabbarzadeh, A. Green closed-loop supply chain network under the COVID-19 pandemic. Sustainability 2021, 13, 9407. [Google Scholar] [CrossRef]
- Zand, F.; Yaghoubi, S.; Sadjadi, S.J. Impacts of government direct limitation on pricing, greening activities and recycling management in an online to offline closed loop supply chain. J. Clean. Prod. 2019, 215, 1327–1340. [Google Scholar] [CrossRef]
- Su, J.; Li, C.; Zeng, Q.; Yang, J.; Zhang, J. A green closed-loop supply chain coordination mechanism based on third-party recycling. Sustainability 2019, 11, 5335. [Google Scholar] [CrossRef] [Green Version]
- Herrmann, F.F.; Barbosa-Povoa, A.P.; Butturi, M.A.; Marinelli, S.; Sellitto, M.A. Green supply chain management: Conceptual framework and models for analysis. Sustainability 2021, 13, 8127. [Google Scholar] [CrossRef]
- UNFCCC. Kyoto Protocol. 1997. Available online: http://unfccc.int/kyoto_protocol/items/2830.php/ (accessed on 20 December 2022).
- EU ETS. Emissions Trading System. 2009. Available online: http://ec.europa.eu/clima/policies/ets/index_en.htm (accessed on 18 December 2022).
- The Kyoto Protocol-Status of Ratification. Available online: http://unfccc.int/kyoto_protocol/status_of_ratification/items/2613.php (accessed on 12 December 2022).
- Farooq, M.U.; Hussain, A.; Masood, T.; Habib, M.S. Supply chain operations management in pandemics: A state-of-the-art review inspired by COVID-19. Sustainability 2021, 13, 2504. [Google Scholar] [CrossRef]
- Zhao, H.; Zhang, H.; Xu, Y.; Lu, J.; He, W. Relation between awe and environmentalism: The role of social dominance orientation. Front. Psychol. 2018, 9, 2367. [Google Scholar] [CrossRef] [Green Version]
- Myllyvirta, L. Coronavirus Has Temporarily Reduced China’s CO2 Emissions by a Quarter. Carbon Brief. Retrieved (2020). Available online: https://www.carbonbrief.org/analysis-coronavirus-hastempo-rarily-reduced-chinas-CO2-emissions-by-a-quarter (accessed on 21 December 2022).
- ECIU (2021), Net Zero Emissions Race-2021. Scorecard. Available online: https://eciu.net/netzerotracker (accessed on 19 August 2021).
- Towards a Sustainable Recovery? Carbon Pricing Policy Changes during COVID-19. Available online: https://www.oecd.org/coronavirus/policy-responses/towards-a-sustainable-recovery-carbon-pricing-policy-changes-during-covid-19-92464d20/ (accessed on 21 December 2022).
- Paksoy, T.; Bektaş, T.; Özceylan, E. Operational and environmental performance measures in a multi-product closed-loop supply chain. Transp. Res. Part E Logist. Transp. Rev. 2011, 47, 532–546. [Google Scholar] [CrossRef]
- Fahimnia, B.; Sarkis, J.; Boland, J.; Reisi, M.; Goh, M. Policy insights from a green supply chain optimization model. Int. J. Prod. Res. 2015, 53, 6522–6533. [Google Scholar] [CrossRef]
- Zakeri, A.; Dehghanian, F.; Fahimnia, B.; Sarkis, J. Carbon pricing versus emissions trading: A supply chain planning perspective. Int. J. Prod. Econ. 2015, 164, 197–205. [Google Scholar] [CrossRef] [Green Version]
- Marufuzzaman, M.; Ekşioğlu, S.D.; Hernandez, R. Environmentally friendly supply chain planning and design for biodiesel production via wastewater sludge. Transp. Sci. 2014, 48, 555–574. [Google Scholar] [CrossRef]
- Peng, Y.; Ablanedo-Rosas, J.H.; Fu, P. A multi-period supply chain network design considering carbon emissions. Math. Probl. Eng. 2016, 2016, 1581893. [Google Scholar] [CrossRef] [Green Version]
- Liu, Z.; Hu, B.; Zhao, Y.; Lang, L.; Guo, H.; Florence, K.; Zhang, S. Research on an intelligent decision of low carbon supply chain based on carbon tax constraints in human-driven edge computing. IEEE Access 2020, 8, 48264–48273. [Google Scholar] [CrossRef]
- Fahimnia, B.; Sarkis, J.; Choudhary, A.; Eshragh, A. Tactical supply chain planning under a carbon tax policy scheme: A case study. Int. J. Prod. Econ. 2015, 164, 206–215. [Google Scholar] [CrossRef] [Green Version]
- Cao, K.; He, P.; Liu, Z. Production and pricing decisions in a dual-channel supply chain under remanufacturing subsidy policy and carbon tax policy. J. Oper. Res. Soc. 2020, 71, 1199–1215. [Google Scholar] [CrossRef]
- Cheng, P.; Ji, G.; Zhang, G.; Shi, Y. A closed-loop supply chain network considering consumer’s low carbon preference and carbon tax under the cap-and-trade regulation. Sustain. Prod. Consum. 2022, 29, 614–635. [Google Scholar] [CrossRef]
- Xu, S.; Fang, L.; Govindan, K. Energy performance contracting in a supply chain with financially asymmetric manufacturers under carbon tax regulation for climate change mitigation. Omega 2022, 106, 102535. [Google Scholar] [CrossRef]
- Zhou, Y.; Hu, F.; Zhou, Z. Pricing decisions and social welfare in a supply chain with multiple competing retailers and carbon tax policy. J. Clean. Prod. 2018, 190, 752–777. [Google Scholar] [CrossRef]
- Wang, L.; Xu, T.; Qin, L. A Study on supply chain emission reduction level based on carbon tax and consumers’ Low-carbon preferences under stochastic demand. Math. Probl. Eng. 2019, 2019, 1621395. [Google Scholar] [CrossRef]
- Konstantaras, I.; Skouri, K.; Benkherouf, L. Optimizing inventory decisions for a closed–loop supply chain model under a carbon tax regulatory mechanism. Int. J. Prod. Econ. 2021, 239, 108185. [Google Scholar] [CrossRef]
- Government Canada. Turning the Corner: Regulatory Framework for Industrial Greenhouse Gas Emissions; Monograph, Environment Canada: Ottawa, ON, Canada, 2008.
- Zhou, Y.; Gong, D.C.; Huang, B.; Peters, B.A. The impacts of carbon tariff on green supply chain design. IEEE Trans. Autom. Sci. Eng. 2015, 14, 1542–1555. [Google Scholar] [CrossRef]
- Alkahtani, M.; Ziout, A.; Salah, B.; Alatefi, M.; Abd Elgawad AE, E.; Badwelan, A.; Syarif, U. An insight into reverse logistics with a focus on collection systems. Sustainability 2021, 13, 548. [Google Scholar] [CrossRef]
- Mirzapour Al-e-hashem, S.M.J.; Baboli, A.; Sazvar, Z. A stochastic aggregate production planning model in a green supply chain: Considering flexible lead times, nonlinear purchase and shortage cost functions. Eur. J. Oper. Res. 2013, 230, 26–41. [Google Scholar] [CrossRef]
- Choudhary, A.; Sarkar, S.; Settur, S.; Tiwari, M.K. A carbon market sensitive optimization model for integrated forward—Reverse logistics. Int. J. Prod. Econ. 2015, 164, 433–444. [Google Scholar] [CrossRef]
- Fareeduddin, M.; Hassan, A.; Syed, M.N.; Selim, S.Z. The impact of carbon policies on closed-loop supply chain network design. Procedia CIRP 2015, 26, 335–340. [Google Scholar] [CrossRef] [Green Version]
- Soleimani, H.; Govindan, K.; Saghafi, H.; Jafari, H. Fuzzy multi-objective sustainable and green closed-loop supply chain network design. Comput. Ind. Eng. 2017, 109, 191–203. [Google Scholar] [CrossRef]
- Martí, J.M.C.; Tancrez, J.S.; Seifert, R.W. Carbon footprint and responsiveness trade-offs in supply chain network design. Int. J. Prod. Econ. 2015, 166, 129–142. [Google Scholar] [CrossRef]
- Xu, Z.; Pokharel, S.; Elomri, A.; Mutlu, F. Emission policies and their analysis for the design of hybrid and dedicated closed-loop supply chains. J. Clean. Prod. 2017, 142, 4152–4168. [Google Scholar] [CrossRef]
- Benjaafar, S.; Li, Y.; Daskin, M. Carbon footprint and the management of supply chains: Insights from simple models. IEEE Trans. Autom. Sci. Eng. 2012, 10, 99–116. [Google Scholar] [CrossRef]
- Zhang, G.; Sun, H.; Hu, J.; Dai, G. The closed-loop supply chain network equilibrium with products lifetime and carbon emission constraints in multiperiod planning horizon. Discret. Dyn. Nat. Soc. 2014, 2014, 784637. [Google Scholar] [CrossRef] [Green Version]
- Hammami, R.; Nouira, I.; Frein, Y. Carbon emissions in a multi-echelon production-inventory model with lead time constraints. Int. J. Prod. Econ. 2015, 164, 292–307. [Google Scholar] [CrossRef]
- Tao, Z.G.; Guang, Z.Y.; Hao, S.; Song, H.J. Multi-period closed-loop supply chain network equilibrium with carbon emission constraints. Resour. Conserv. Recycl. 2015, 104, 354–365. [Google Scholar] [CrossRef]
- Ding, H.; Zhao, Q.; An, Z.; Tang, O. Collaborative mechanism of a sustainable supply chain with environmental constraints and carbon caps. Int. J. Prod. Econ. 2016, 181, 191–207. [Google Scholar] [CrossRef]
- Diabat, A.; Simchi-Levi, D. A carbon-capped supply chain network problem. In Proceedings of the 2009 IEEE International Conference on Industrial Engineering and Engineering Management; Hong Kong, China, 2009; pp. 523–527. [Google Scholar]
- Qi, Q.; Wang, J.; Bai, Q. Pricing decision of a two-echelon supply chain with one supplier and two retailers under a carbon cap regulation. J. Clean. Prod. 2017, 151, 286–302. [Google Scholar] [CrossRef]
- Zhang, S.; Wang, C.; Yu, C.; Ren, Y. Governmental cap regulation and manufacturer’s low carbon strategy in a supply chain with different power structures. Comput. Ind. Eng. 2019, 134, 27–36. [Google Scholar] [CrossRef]
- Ji, J.; Zhang, Z.; Yang, L. Comparisons of initial carbon allowance allocation rules in an O2O retail supply chain with the cap-and-trade regulation. Int. J. Prod. Econ. 2017, 187, 68–84. [Google Scholar] [CrossRef]
- Cadavid-Giraldo, N.; Velez-Gallego, M.C.; Restrepo-Boland, A. Carbon emissions reduction and financial effects of a cap and tax system on an operating supply chain in the cement sector. J. Clean. Prod. 2020, 275, 122583. [Google Scholar] [CrossRef]
- Wang, M.; Zhao, L.; Herty, M. Modelling carbon trading and refrigerated logistics services within a fresh food supply chain under carbon cap-and-trade regulation. Int. J. Prod. Res. 2018, 56, 4207–4225. [Google Scholar] [CrossRef]
- Kushwaha, S.; Ghosh, A.; Rao, A.K. Collection activity channels selection in a reverse supply chain under a carbon cap-and-trade regulation. J. Clean. Prod. 2020, 260, 121034. [Google Scholar] [CrossRef]
- Astanti, R.D.; Daryanto, Y.; Dewa, P.K. Low-carbon supply chain model under a vendor-managed inventory partnership and carbon cap-and-trade policy. J. Open Innov. Technol. Mark. Complex. 2022, 8, 30. [Google Scholar] [CrossRef]
- Xia, L.; Guo, T.; Qin, J.; Yue, X.; Zhu, N. Carbon emission reduction and pricing policies of a supply chain considering reciprocal preferences in cap-and-trade system. Ann. Oper. Res. 2018, 268, 149–175. [Google Scholar] [CrossRef]
- Wang, Z.; Wu, Q. Carbon emission reduction and product collection decisions in the closed-loop supply chain with cap-and-trade regulation. Int. J. Prod. Res. 2021, 59, 4359–4383. [Google Scholar] [CrossRef]
- Ghosh, A.; Sarmah, S.P.; Kanauzia, R.K. The effect of investment in green technology in a two echelon supply chain under strict carbon-cap policy. Benchmarking Int. J. 2020, 27, 1875–1891. [Google Scholar] [CrossRef]
- Ghosh, S.K.; Seikh, M.R.; Chakrabortty, M. Analyzing a stochastic dual-channel supply chain under consumers’ low carbon preferences and cap-and-trade regulation. Comput. Ind. Eng. 2020, 149, 106765. [Google Scholar] [CrossRef]
- Wang, X.; Xue, M.; Xing, L. Analysis of carbon emission reduction in a dual-channel supply chain with cap-and-trade regulation and low-carbon preference. Sustainability 2018, 10, 580. [Google Scholar] [CrossRef] [Green Version]
- Yang, Y.; Goodarzi, S.; Bozorgi, A.; Fahimnia, B. Carbon cap-and-trade schemes in closed-loop supply chains: Why firms do not comply? Transp. Res. Part E Logist. Transp. Rev. 2021, 156, 102486. [Google Scholar] [CrossRef]
- Mishra, M.; Hota, S.K.; Ghosh, S.K.; Sarkar, B. Controlling waste and carbon emission for a sustainable closed-loop supply chain management under a cap-and-trade strategy. Mathematics 2020, 8, 466. [Google Scholar] [CrossRef] [Green Version]
- Tang, R.; Yang, L. Impacts of financing mechanism and power structure on supply chains under cap-and-trade regulation. Transp. Res. Part E Logist. Transp. Rev. 2020, 139, 101957. [Google Scholar] [CrossRef]
- Office of Air Quality Planning and Standards, US Environmental Protection Agency. The Plain English Guide to the Clean Air Act; Publication No. EPA-456/K-07–001; Environmental Protection Agency: Washington, DC, USA, 2007.
- Palak, G. Optimization Models for Cost Efficient and Environmentally Friendly Supply Chain Management; Mississippi State University: Starkvill, MI, USA, 2013. [Google Scholar]
- US EPA. U.S. Transportation Sector Greenhouse Gas Emissions: 1990–2011; Office of Transportation and Air Quality: Washington, DC, USA, 2013.
- Xu, X.; Zhang, W.; He, P.; Xu, X. Production and pricing problems in make-to-order supply chain with cap-and-trade regulation. Omega 2017, 66, 248–257. [Google Scholar] [CrossRef]
- Wang, X.; Sethi, S.P.; Chang, S. Pollution abatement using cap-and-trade in a dynamic supply chain and its coordination. Transp. Res. Part E Logist. Transp. Rev. 2022, 158, 102592. [Google Scholar] [CrossRef]
- Rezaee, A.; Dehghanian, F.; Fahimnia, B.; Beamon, B. Green supply chain network design with stochastic demand and carbon price. Ann. Oper. Res. 2017, 250, 463–485. [Google Scholar] [CrossRef]
- Oh, J.; Jeong, B. Profit analysis and supply chain planning model for closed-loop supply chain in fashion industry. Sustainability 2014, 6, 9027–9056. [Google Scholar] [CrossRef] [Green Version]
- Kannegiesser, M.; Günther, H.O.; Gylfason, Ó. Sustainable development of global supply chains—Part 2: Investigation of the European automotive industry. Flex. Serv. Manuf. J. 2014, 26, 48–68. [Google Scholar] [CrossRef]
- Baud-Lavigne, B.; Agard, B.; Penz, B. Environmental constraints in joint product and supply chain design optimization. Comput. Ind. Eng. 2014, 76, 16–22. [Google Scholar] [CrossRef]
- Mohammed, F.; Selim, S.Z.; Hassan, A.; Syed, M.N. Multi-period planning of closed-loop supply chain with carbon policies under uncertainty. Transp. Res. Part D Transp. Environ. 2017, 51, 146–172. [Google Scholar] [CrossRef]
- Xu, X.; He, P.; Xu, H.; Zhang, Q. Supply chain coordination with green technology under cap-and-trade regulation. Int. J. Prod. Econ. 2017, 183, 433–442. [Google Scholar] [CrossRef]
- Yang, L.; Hu, Y.; Huang, L. Collecting mode selection in a remanufacturing supply chain under cap-and-trade regulation. Eur. J. Oper. Res. 2020, 287, 480–496. [Google Scholar] [CrossRef]
- Kannan, D.; Diabat, A.; Alrefaei, M.; Govindan, K.; Yong, G. A carbon footprint based reverse logistics network design model. Resour. Conserv. Recycl. 2012, 67, 75–79. [Google Scholar] [CrossRef]
- Diabat, A.; Abdallah, T.; Al-Refaie, A.; Svetinovic, D.; Govindan, K. Strategic closed-loop facility location problem with carbon market trading. IEEE Trans. Eng. Manag. 2012, 60, 398–408. [Google Scholar] [CrossRef]
- Chaabane, A.; Ramudhin, A.; Paquet, M. Designing supply chains with sustainability considerations. Prod. Plan. Control 2011, 22, 727–741. [Google Scholar] [CrossRef]
- Abdallah, T.; Diabat, A.; Rigter, J. Investigating the option of installing small-scale PVs on facility rooftops in a green supply chain. Int. J. Prod. Econ. 2013, 146, 465–477. [Google Scholar] [CrossRef]
- Lewczuk, K.; Kłodawski, M.; Gepner, P. Energy consumption in a distributional warehouse: A practical case study for different warehouse technologies. Energies 2021, 14, 2709. [Google Scholar] [CrossRef]
- He, B.; Wang, J.; Huang, S.; Wang, Y. Low-carbon product design for product life cycle. J. Eng. Des. 2015, 26, 321–339. [Google Scholar] [CrossRef]
- Wu, H.; Sun, Y.; Su, Y.; Chen, M.; Zhao, H.; Li, Q. Which Is the Best Supply Chain Policy: Carbon Tax, or a Low-Carbon Subsidy? Sustainability 2022, 14, 6312. [Google Scholar] [CrossRef]
- Mintz-Woo, K.; Dennig, F.; Liu, H.; Schinko, T. Carbon pricing and COVID-19. Clim. Policy 2021, 21, 1272–1280. [Google Scholar] [CrossRef]
- Entezaminia, A.; Heidari, M.; Rahmani, D. Robust aggregate production planning in a green supply chain under uncertainty considering reverse logistics: A case study. Int. J. Adv. Manuf. Technol. 2017, 90, 1507–1528. [Google Scholar] [CrossRef]
- Xu, L.; Wang, C.; Zhao, J. Decision and coordination in the dual-channel supply chain considering cap-and-trade regulation. J. Clean. Prod. 2018, 197, 551–561. [Google Scholar] [CrossRef]
- Du, S.; Zhu, L.; Liang, L.; Ma, F. Emission-dependent supply chain and environment-policy-making in the ‘cap-and-trade system. Energy Policy 2013, 57, 61–67. [Google Scholar] [CrossRef]
- Xu, X.; Choi, T.M. Supply chain operations with online platforms under the cap-and-trade regulation: Impacts of using blockchain technology. Transp. Res. Part E Logist. Transp. Rev. 2021, 155, 102491. [Google Scholar] [CrossRef]
- Li, Z.; Pan, Y.; Yang, W.; Ma, J.; Zhou, M. Effects of government subsidies on green technology investment and green marketing coordination of supply chain under the cap-and-trade mechanism. Energy Econ. 2021, 101, 105426. [Google Scholar] [CrossRef]
- Du, S.; Ma, F.; Fu, Z.; Zhu, L.; Zhang, J. Game-theoretic analysis for an emission-dependent supply chain in a ‘cap-and-trade system. Ann. Oper. Res. 2015, 228, 135–149. [Google Scholar] [CrossRef]
- Taleizadeh, A.A.; Shahriari, M.; Sana, S.S. Pricing and coordination strategies in a dual channel supply chain with green production under cap and trade regulation. Sustainability 2021, 13, 12232. [Google Scholar] [CrossRef]
- Bai, Q.; Xu, J.; Zhang, Y. Emission reduction decision and coordination of a make-to-order supply chain with two products under cap-and-trade regulation. Comput. Ind. Eng. 2018, 119, 131–145. [Google Scholar] [CrossRef]
- Kuiti, M.R.; Ghosh, D.; Basu, P.; Bisi, A. Do cap-and-trade policies drive environmental and social goals in supply chains: Strategic decisions, collaboration, and contract choices. Int. J. Prod. Econ. 2020, 223, 107537. [Google Scholar] [CrossRef]
- Tong, W.; Mu, D.; Zhao, F.; Mendis, G.P.; Sutherland, J.W. The impact of cap-and-trade mechanism and consumers’ environmental preferences on a retailer-led Supply Chain. Resour. Conserv. Recycl. 2019, 142, 88–100. [Google Scholar] [CrossRef]
- Golpîra, H.; Zandieh, M.; Najafi, E.; Sadi-Nezhad, S. A multi-objective multi-echelon green supply chain network design problem with risk-averse retailers in an uncertain environment. Sci. Iran. 2017, 24, 413–423. [Google Scholar] [CrossRef] [Green Version]
- Carmody, C. A guide to emissions trading under the Western Climate Initiative. Can.-USLJ 2019, 43, 148. [Google Scholar]
- Chaabane, A.; Ramudhin, A.; Paquet, M. Design of sustainable supply chains under the emission trading scheme. Int. J. Prod. Econ. 2012, 135, 37–49. [Google Scholar] [CrossRef]
- Xu, J.; Chen, Y.; Bai, Q. A two-echelon sustainable supply chain coordination under cap-and-trade regulation. J. Clean. Prod. 2016, 135, 42–56. [Google Scholar] [CrossRef]
- Shaw, K.; Irfan, M.; Shankar, R.; Yadav, S.S. Low carbon chance constrained supply chain network design problem: A Benders decomposition-based approach. Comput. Ind. Eng. 2016, 98, 483–497. [Google Scholar] [CrossRef]
- Arampantzi, C.; Minis, I. A new model for designing sustainable supply chain networks and its application to a global manufacturer. J. Clean. Prod. 2017, 156, 276–292. [Google Scholar] [CrossRef]
- Giarola, S.; Shah, N.; Bezzo, F. A comprehensive approach to the design of ethanol supply chains including carbon trading effects. Bioresour. Technol. 2012, 107, 175–185. [Google Scholar] [CrossRef] [PubMed]
- Abdallah, T.; Diabat, A.; Simchi-Levi, D. A carbon-sensitive supply chain network problem with green procurement. In Proceedings of the 40th International Conference on Computers & Industrial Engineering, Awaji, Japan, 25–28 July 2010; pp. 1–6. [Google Scholar]
- Memari, Y.; Memari, A.; Ebrahimnejad, S.; Ahmad, R. A mathematical model for optimizing a biofuel supply chain with outsourcing decisions under the carbon trading mechanism. Biomass Convers. Biorefinery 2021, 13, 1047–1070. [Google Scholar] [CrossRef]
- Abbasi, S.; Daneshmand-Mehr, M.; Ghane Kanafi, A. Designing Sustainable Recovery Network of End-of-Life Product during the COVID-19 Pandemic: A Real and Applied Case Study. Discret. Dyn. Nat. Soc. 2022, 2022, 6967088. [Google Scholar] [CrossRef]
- Abbasi, S.; Daneshmand-Mehr, M.; Ghane Kanafi, A. The sustainable supply chain of CO2 emissions during the coronavirus disease (COVID-19) pandemic. J. Ind. Eng. Int. 2021, 17, 83–108. [Google Scholar] [CrossRef]
- Abbasi, S.; Daneshmand-Mehr, M.; Ghane Kanafi, A. Green Closed-Loop Supply Chain Network Design During the Coronavirus (COVID-19) Pandemic: A Case Study in the Iranian Automotive Industry. Environ. Model Assess 2023, 28, 69–103. [Google Scholar] [CrossRef]
- Wang, Y.; Yu, Z.; Jin, M.; Mao, J. Decisions and coordination of retailer-led low-carbon supply chain under altruistic preference. Eur. J. Oper. Res. 2021, 293, 910–925. [Google Scholar] [CrossRef]
- Wang, Y.; Lv, L.; Shen, L.; Tang, R. Manufacturer’s decision-making model under carbon emission permits repurchase strategy and capital constraints. Int. J. Prod. Res. 2021, 1–19. [Google Scholar] [CrossRef]
- Abbasi, S.; Khalili, H.A.; Daneshmand-Mehr, M.; Hajiaghaei-Keshteli, M. Performance Measurement of the Sustainable Supply Chain During the COVID-19 Pandemic: A real-life case study. Found. Comput. Decis. Sci. 2022, 47, 327–358. [Google Scholar] [CrossRef]
- Abbasi, S.; Daneshmand-Mehr, M.; Ghane, K. Designing a Tri-Objective, Sustainable, Closed-Loop, and Multi-Echelon Supply Chain During the COVID-19 and Lockdowns. Found. Comput. Decis. Sci. 2023, 48. [Google Scholar]
- Luo, R.; Zhou, L.; Song, Y.; Fan, T. Evaluating the impact of carbon tax policy on manufacturing and remanufacturing decisions in a closed-loop supply chain. Int. J. Prod. Econ. 2022, 245, 108408. [Google Scholar] [CrossRef]
- Liu, C.; Chen, X. The Third Coming of China’s Special Economic Zones: The Rise and Regional Dimensions of Tianjin Binhai New Area. In Rethinking Global Urbanism; Routledge: London, UK, 2012; pp. 145–167. [Google Scholar]
- Pourmalek, F.; Rezaei Hemami, M.; Janani, L.; Moradi-Lakeh, M. Rapid review of COVID-19 epidemic estimation studies for Iran. BMC Public Health 2021, 21, 257. [Google Scholar] [CrossRef]
- Ayyoubzadeh, S.M.; Ayyoubzadeh, S.M.; Zahedi, H.; Ahmadi, M.; Kalhori, S.R.N. Predicting COVID-19 incidence through analysis of google trends data in Iran: Data mining and deep learning pilot study. JMIR Public Health Surveill. 2020, 6, e18828. [Google Scholar] [CrossRef]
- Gerard, D.; Lave, L.B. Implementing technology-forcing policies: The 1970 Clean Air Act Amendments and the introduction of advanced automotive emissions controls in the United States. Technol. Forecast. Soc. Chang. 2005, 72, 761–778. [Google Scholar] [CrossRef]
- Xiao, Y.; Raheem, A.; Ding, L.; Chen, W.H.; Chen, X.; Wang, F.; Lin, S.L. Pretreatment, modification and applications of sewage sludge-derived bio char for resource recovery-A review. Chemosphere 2022, 287, 131969. [Google Scholar] [CrossRef]
- Mishra, U.; Wu, J.Z.; Sarkar, B. Optimum sustainable inventory management with backorder and deterioration under controllable carbon emissions. J. Clean. Prod. 2021, 279, 123699. [Google Scholar] [CrossRef]
- Ghafari, M.; Hejazi, B.; Karshenas, A.; Dascalu, S.; Kadvidar, A.; Khosravi, M.A.; Katzourakis, A. Lessons for preparedness and reasons for concern from the early COVID-19 epidemic in Iran. Epidemics 2021, 36, 100472. [Google Scholar] [CrossRef]
- Hatamabadi, H.; Sabaghian, T.; Sadeghi, A.; Heidari, K.; Safavi-Naini SA, A.; Looha, M.A.; Sahebkar, A. Epidemiology of COVID-19 in Tehran, Iran: A Cohort Study of Clinical Profile, Risk Factors, and Outcomes. BioMed Res. Int. 2022, 2022, 2350063. [Google Scholar] [CrossRef]
- Waltho, C.; Elhedhli, S.; Gzara, F. Green supply chain network design: A review focused on policy adoption and emission quantification. Int. J. Prod. Econ. 2019, 208, 305–318. [Google Scholar] [CrossRef]
- Babagolzadeh, M.; Shrestha, A.; Abbasi, B.; Zhang, Y.; Woodhead, A.; Zhang, A. Sustainable cold supply chain management under demand uncertainty and carbon tax regulation. Transp. Res. Part D Transp. Environ. 2020, 80, 102245. [Google Scholar] [CrossRef]
- Bai, Q.; Xu, J.; Chauhan, S.S. Effects of sustainability investment and risk aversion on a two-stage supply chain coordination under a carbon tax policy. Comput. Ind. Eng. 2020, 142, 106324. [Google Scholar] [CrossRef]
- Zou, F.; Zhou, Y.; Yuan, C. The impact of retailers’ low-carbon investment on the supply chain under carbon tax and carbon trading policies. Sustainability 2020, 12, 3597. [Google Scholar] [CrossRef]
- Lang, L.; Liu, Z.; Hu, B. Optimization decision of cooperative emission reduction of clothing supply chain based on the carbon tax. J. Phys. Conf. Ser. 2021, 1790, 012092. [Google Scholar] [CrossRef]
- Liu, Z.; Lang, L.; Hu, B.; Shi, L.; Huang, B.; Zhao, Y. Emission reduction decision of agricultural supply chain considering carbon tax and investment cooperation. J. Clean. Prod. 2021, 294, 126305. [Google Scholar] [CrossRef]
- Zhang, H.; Li, P.; Zheng, H.; Zhang, Y. Impact of a carbon tax on enterprise operation and production strategy for low-carbon products in a co-opetition supply chain. J. Clean. Prod. 2021, 287, 125058. [Google Scholar] [CrossRef]
- Guo, J.; Xi, M. Greening, Pricing, and Marketing Coordination for a Complex Three-Level Supply Chain Under the Carbon Tax in China. IEEE Access 2022, 10, 76895–76905. [Google Scholar] [CrossRef]
- Meng, C.; Zhang, R.; Liu, B. Energy Performance Contracting in a Supply Chain under Cap-and-Trade Regulation and Carbon Tax Policy. Int. Trans. Elector. Energy Syst. 2022, 2022, 1716380. [Google Scholar] [CrossRef]
- Zhu, X.; Ding, L.; Guo, Y.; Zhu, H. Decisions and Coordination of Dual-Channel Supply Chain considering Retailers’ Bidirectional Fairness Concerns under Carbon Tax Policy. Math. Probl. Eng. 2022, 2022, 4139224. [Google Scholar] [CrossRef]
- Hu, Z.H.; Wang, S.W. An Evolutionary Game Model Between Governments and Manufacturers Considering Carbon Taxes, Subsidies, and Consumers’ Low-Carbon Preference. Dyn. Games Appl. 2022, 12, 513–551. [Google Scholar] [CrossRef]
- Zhang, Y.; Zhang, T. Dynamic analysis of a dual-channel closed-loop supply chain with fairness concerns under carbon tax regulation. Environ. Sci. Pollut. Res. 2022, 29, 57543–57565. [Google Scholar] [CrossRef]
- Paul, A.; Pervin, M.; Roy, S.K.; Maculan, N.; Weber, G.W. A green inventory model with the effect of carbon taxation. Ann. Oper. Res. 2022, 309, 233–248. [Google Scholar] [CrossRef]
- Shi, S.; Liu, G. Pricing and coordination decisions in a low-carbon supply chain with risk aversion under a carbon tax. Math. Probl. Eng. 2022, 2022, 7690136. [Google Scholar] [CrossRef]
- Shen, L.; Lin, F.; Cheng, T.C.E. Low-Carbon Transition Models of High Carbon Supply Chains under the Mixed Carbon Cap-and-Trade and Carbon Tax Policy in the Carbon Neutrality Era. Int. J. Environ. Res. Public Health 2022, 19, 11150. [Google Scholar] [CrossRef]
- Yu, W.; Wang, Y.; Feng, W.; Bao, L.; Han, R. Low carbon strategy analysis with two competing supply chain considering carbon taxation. Comput. Ind. Eng. 2022, 169, 108203. [Google Scholar] [CrossRef]
- Lyu, S.; Chen, Y.; Wang, L. Optimal Decisions in a Multi-Party Closed-Loop Supply Chain Considering Green Marketing and Carbon Tax Policy. Int. J. Environ. Res. Public Health 2022, 19, 9244. [Google Scholar] [CrossRef]
- Chen, L.; Zhao, J.; Zhao, J.; Li, F.; Yang, Y. A Supply Chain Model Based on Data-Driven Demand Uncertainty under the Influence of Carbon Tax Policy. Mob. Inf. Syst. 2022, 2022, 5960949. [Google Scholar] [CrossRef]
- Wei, Z.; Huang, Y. Supply Chain Coordination under Carbon Emission Tax Regulation Considering Greening Technology Investment. Int. J. Environ. Res. Public Health 2022, 19, 9232. [Google Scholar] [CrossRef]
- Luo, R.; Chang, H.; Zhang, D. Carbon Emission Reduction and Pricing Decisions of Dual-Channel Closed-Loop Supply Chain with Fairness Concern Under Carbon Tax Policy. Int. J. Econ. Financ. Manag. Sci. 2022, 10, 102. [Google Scholar] [CrossRef]
- Yi, Y.; Wang, Y.; Fu, C.; Li, Y. Taxes or subsidies to promote investment in green technologies for a supply chain considering consumer preferences for green products. Comput. Ind. Eng. 2022, 171, 108371. [Google Scholar] [CrossRef]
- Broomandi, P.; Karaca, F.; Nikfal, A.; Jahanbakhshi, A.; Tamjidi, M.; Kim, J.R. Impact of COVID-19 event on the air quality in Iran. Aerosol Air Qual. Res. 2020, 20, 1793–1804. [Google Scholar] [CrossRef]


| Parameter | Values |
|---|---|
| Uniform (5000; 6500) | |
| Uniform (25,000; 30,000) | |
| Uniform (45,000; 50,000) | |
| Uniform (30,000; 35,000) | |
| Uniform (15,000; 20,000) | |
| Uniform (0.1; 0.5) | |
| Uniform (0.1; 0.4) | |
| Uniform (18; 60) | |
| Uniform (18; 60) | |
| Uniform (18; 60) | |
| Uniform (18; 60) | |
| Uniform (18; 60) | |
| Uniform (18; 60) | |
| Uniform (18; 60) | |
| Uniform (10; 1000) | |
| Uniform (10; 1000) | |
| Uniform (10; 1000) | |
| Uniform (10; 1000) | |
| Uniform (10; 1000) | |
| Uniform (10; 1000) | |
| Uniform (10; 1000) | |
| Uniform (2,000,000,000; 9,000,000,000) | |
| Uniform (1,000,000,000; 7,000,000,000) | |
| Uniform (1,500,000,000; 6,500,000,000) | |
| Uniform (50,000; 150,000) | |
| Uniform (60,000; 200,000) | |
| Vj | Uniform (40,000; 130,000) |
| Vrj | Uniform (35,000; 120,000) |
| Uniform (40,000; 90,000) | |
| Uniform (20,000; 100,000) | |
| Uniform (75,000; 95,000) | |
| Uniform (80,000; 100,000) | |
| Uniform (50,000; 90,000) | |
| Uniform (40,000; 120,000) | |
| Uniform (60,000; 110,000) | |
| Uniform (70,000; 130,000) | |
| Uniform (85,000; 140,000) | |
| Uniform (20,000; 120,000) | |
| Uniform (15,000; 110,000) | |
| Uniform (10,000; 135,000) | |
| Uniform (12,000; 85,000) | |
| Uniform (17,000; 90,000) | |
| Uniform (20,000; 100,000) | |
| Uniform (89,000; 110,000) | |
| Uniform (110,000; 150,000) | |
| Uniform (88,000; 140,000) | |
| Uniform (77,000; 120,000) | |
| Uniform (55,000; 110,000) | |
| Uniform (66,000; 100,000) | |
| Uniform (30,000; 90,000) | |
| Uniform (10; 5000) | |
| Uniform (10; 6000) | |
| Uniform (10; 5500) | |
| Uniform (10; 7500) | |
| Uniform (10; 4500) | |
| Uniform (10; 3500) | |
| Uniform (10; 2500) | |
| Uniform (10; 350) | |
| Uniform (10; 200) | |
| Uniform (10; 100) | |
| Uniform (10; 300) | |
| Uniform (10; 100) | |
| Uniform (10; 550) |
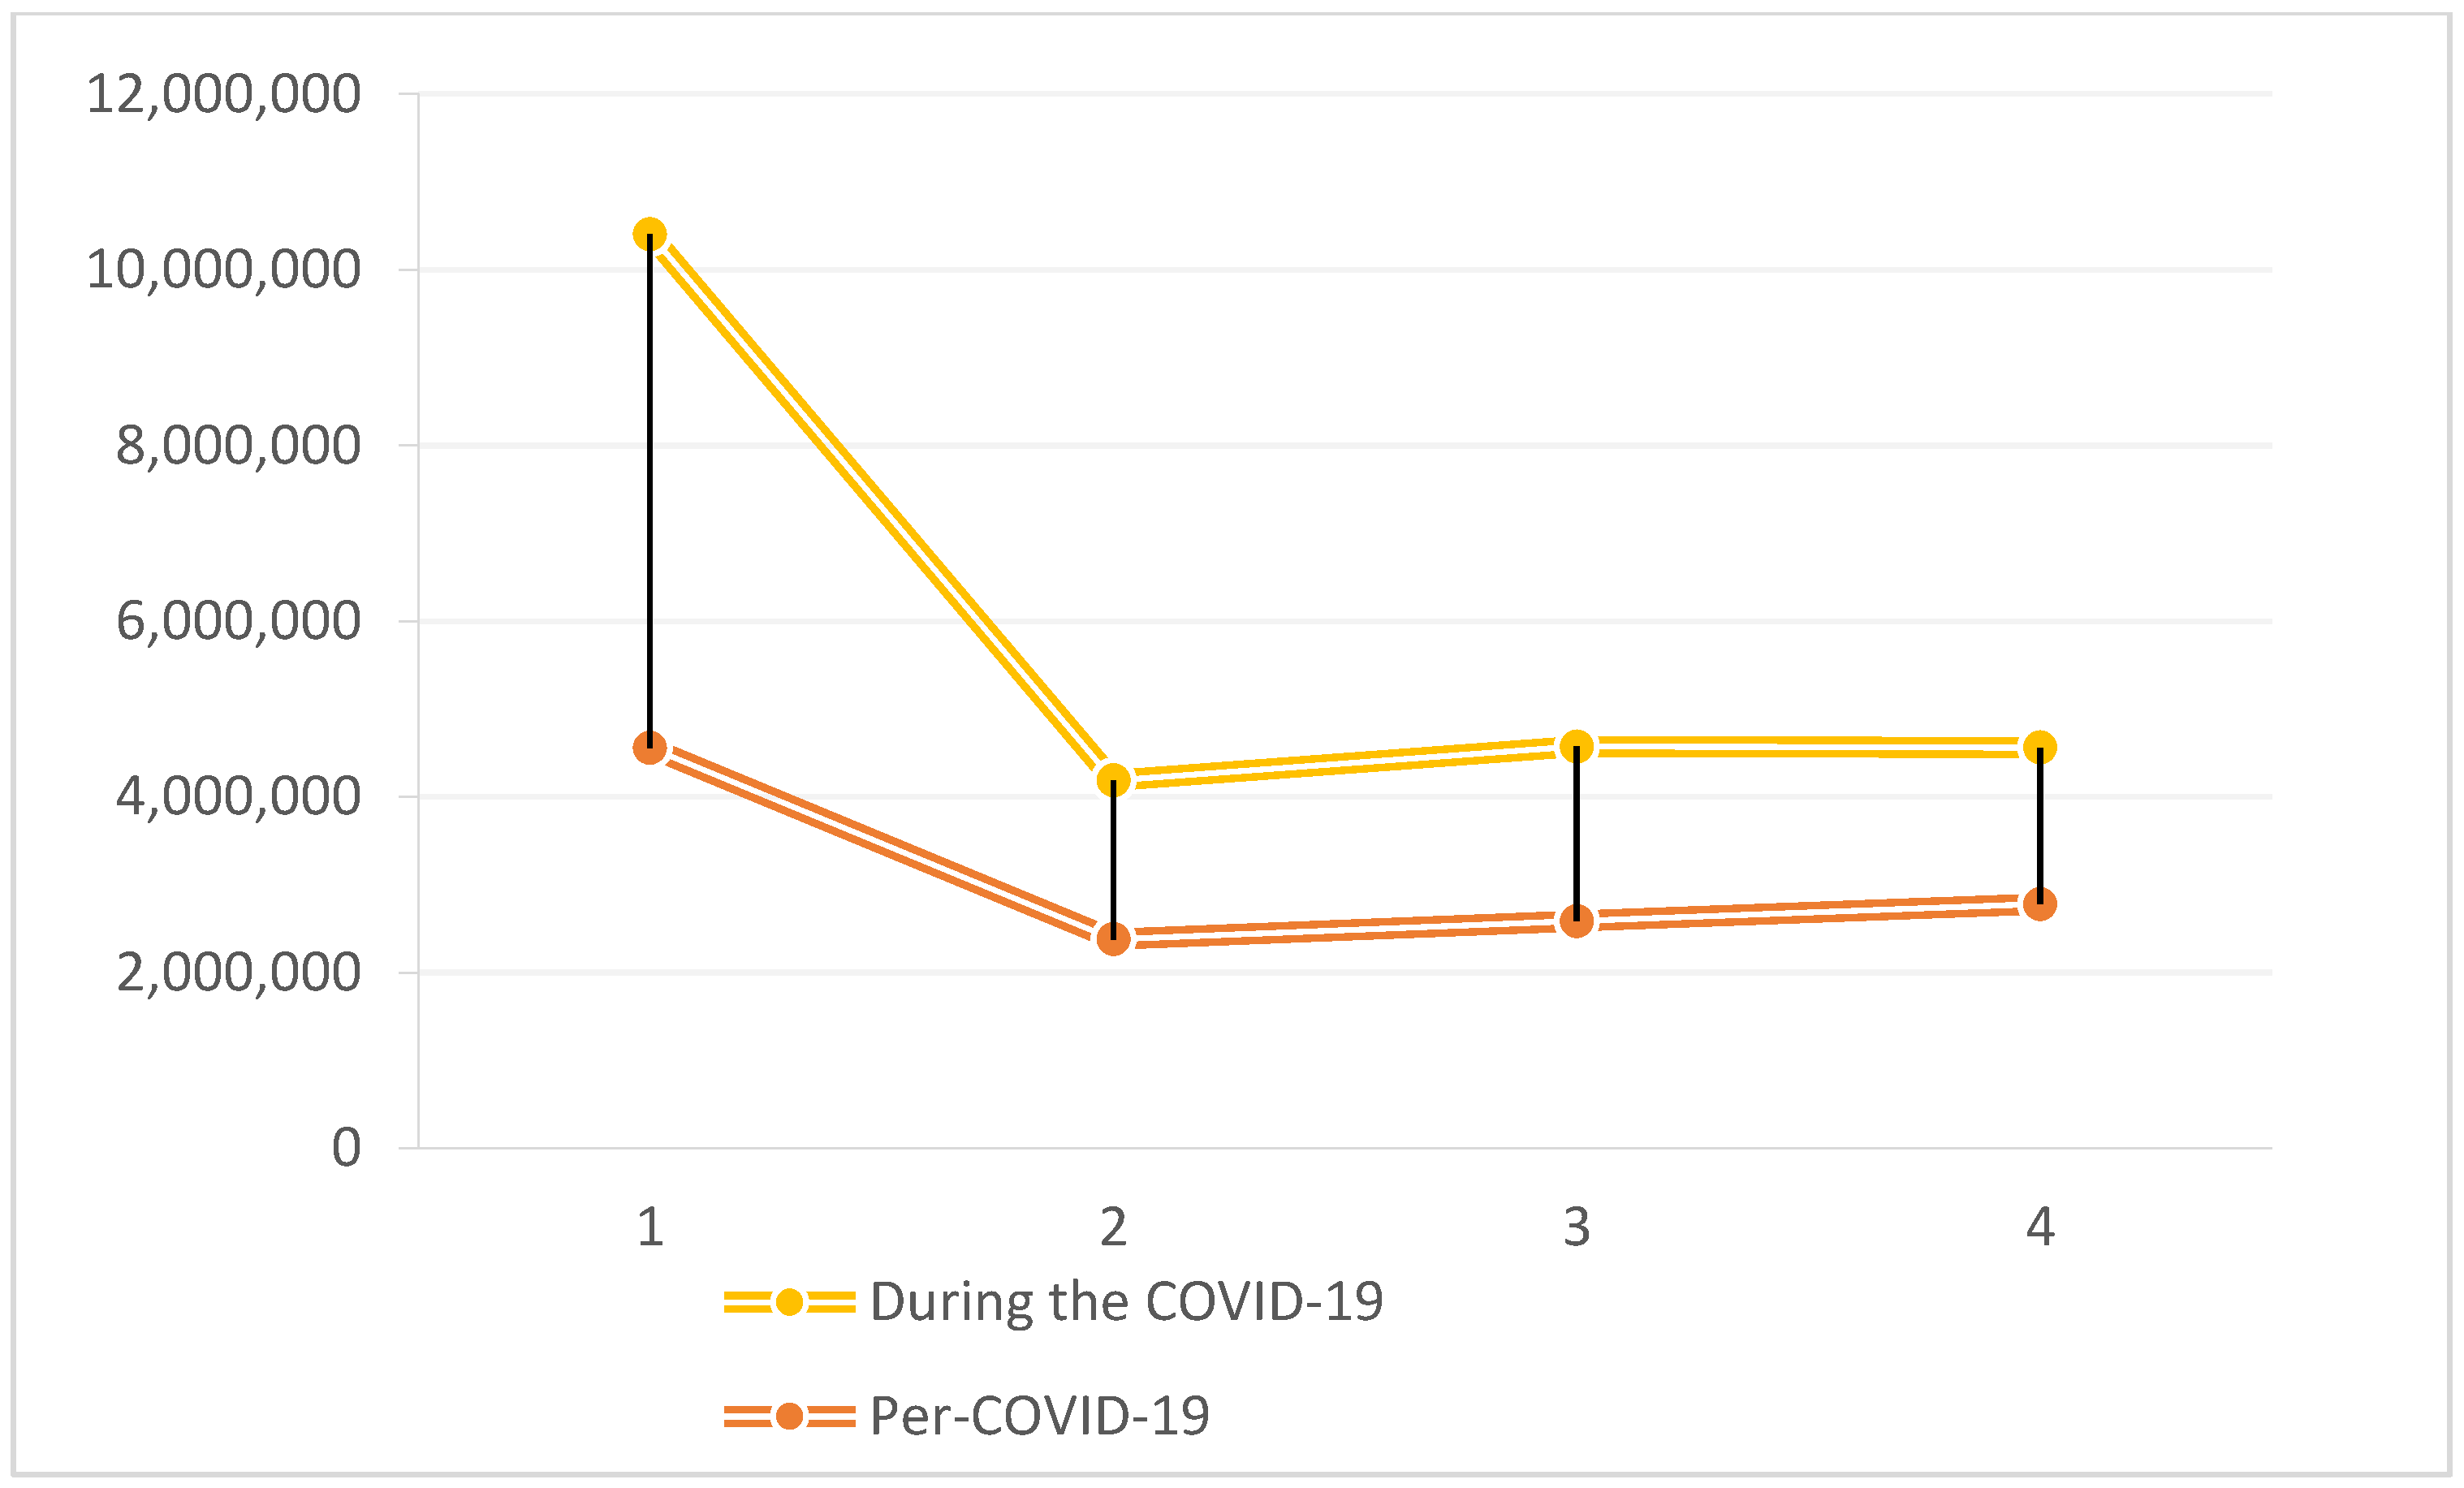
| No Carbon Policy (M1) | Carbon Cap Policy (M2) | Carbon Tax Policy (M3) | Cap-and Trade Policy (M4) | |
|---|---|---|---|---|
| Optimization value of objective function pre-COVID-19. | 4,560,141 | 2,380,049 | 2,586,517 | 2,780,070 |
| Optimization value of objective function during the COVID-19. | 5,844,481 | 1,807,612 | 1,986,001 | 1,782,229 |
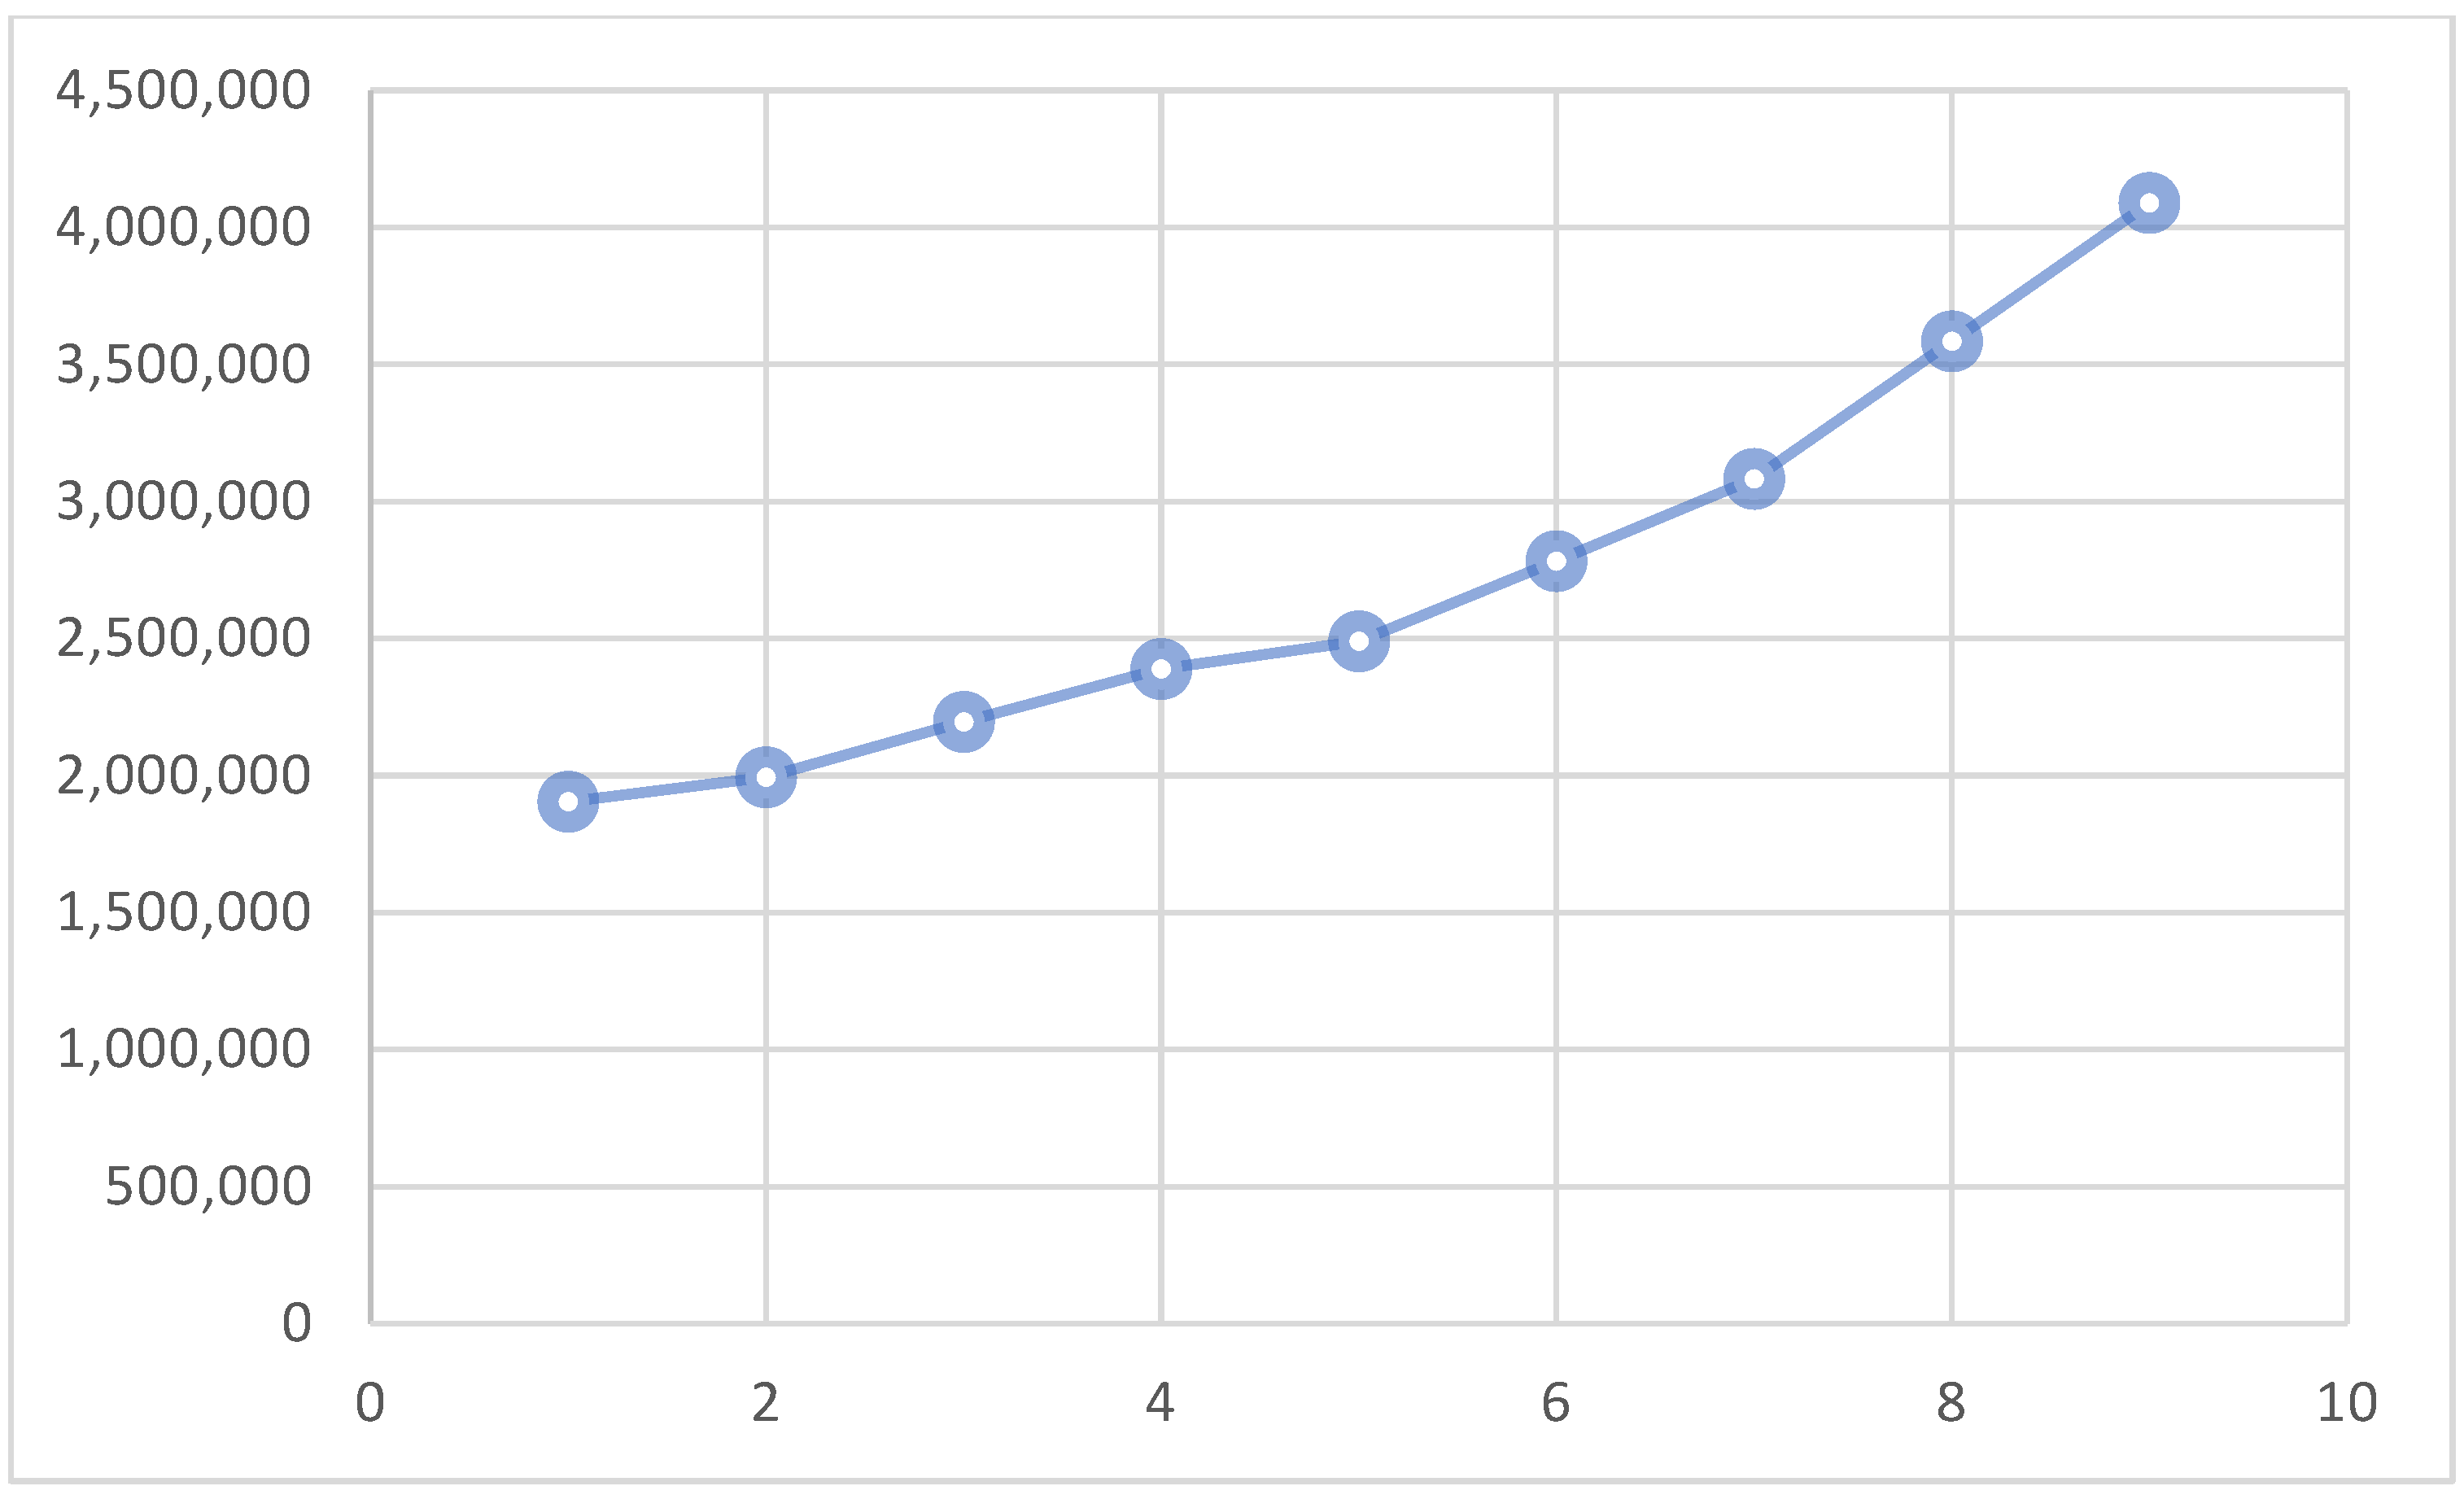
| The Optimization Value of the Second Objective Function | Increased Change in C cap % |
|---|---|
| 1,904,412 | 5% |
| 1,994,500 | 7% |
| 2,195,650 | 10% |
| 2,388,600 | 15% |
| 2,489,900 | 20% |
| 2,782,180 | 25% |
| 3,082,990 | 30% |
| 3,584,410 | 40% |
| 4,088,811 | 50% |
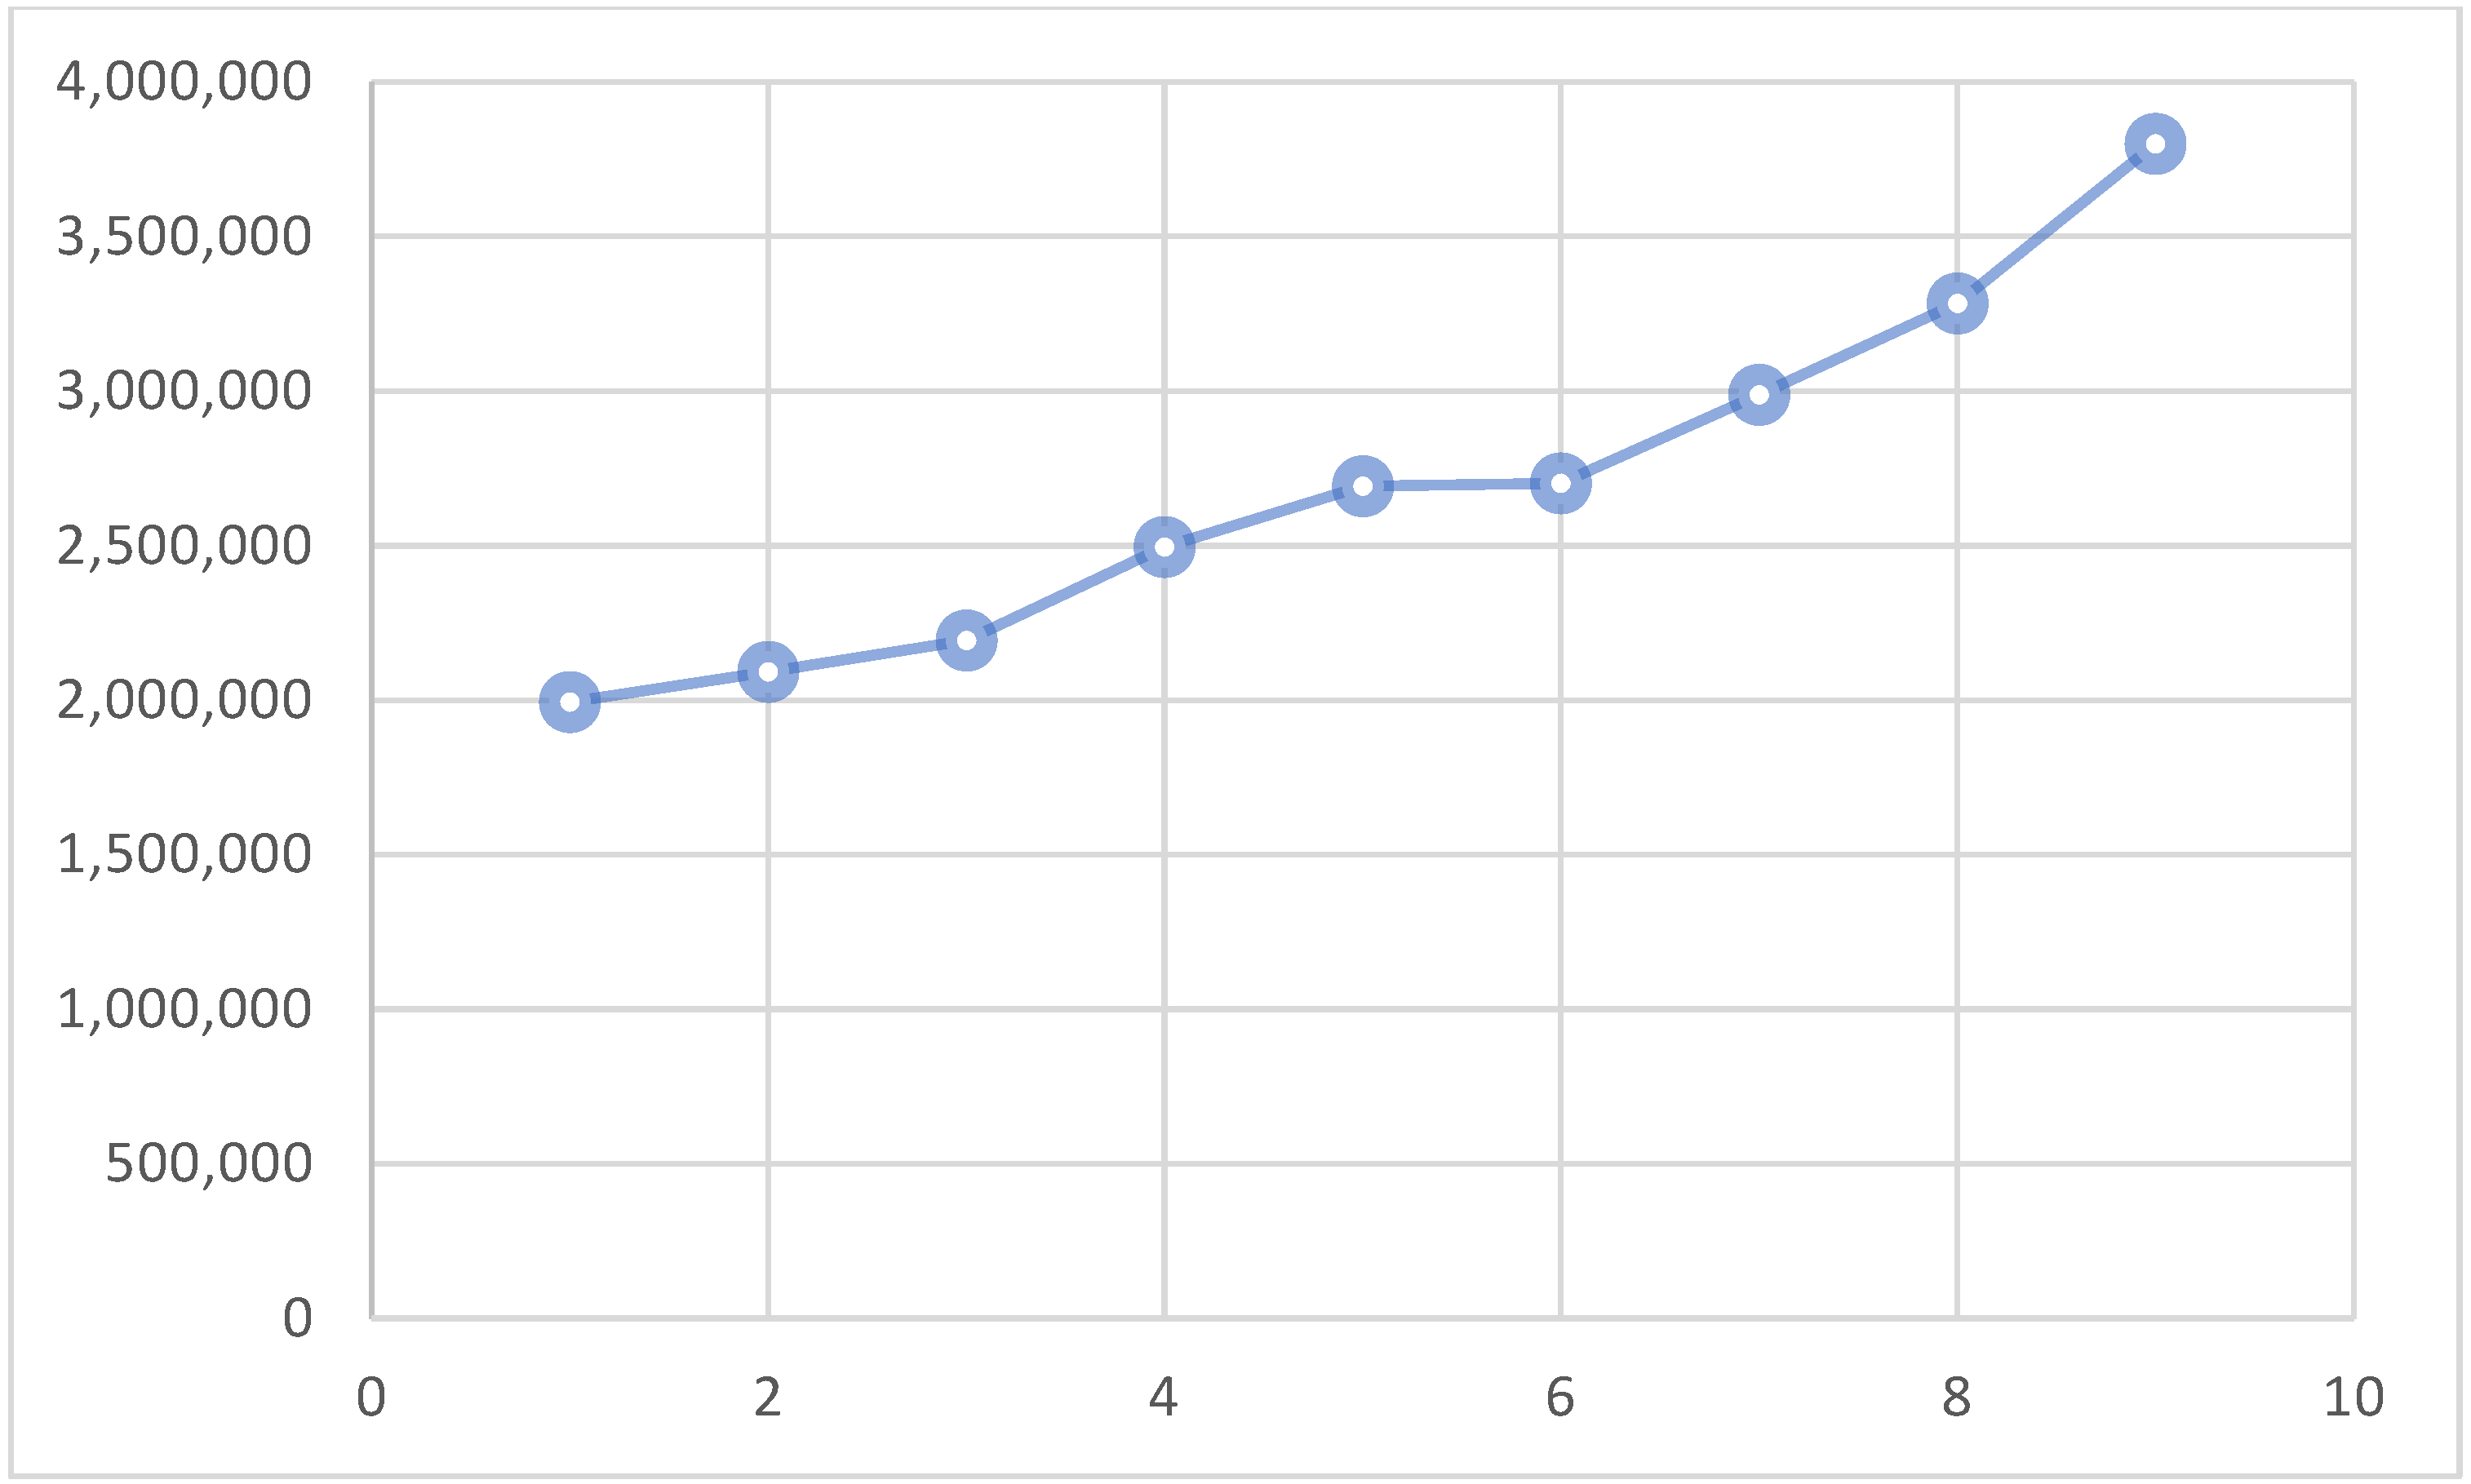
| The Optimization Value of the Third Objective Function | Increased Change in Carbon Tax % |
|---|---|
| 1,994,120 | 5% |
| 2,091,220 | 7% |
| 2,193,330 | 10% |
| 2,495,890 | 15% |
| 2,692,290 | 20% |
| 2,701,190 | 25% |
| 2,988,190 | 30% |
| 3,284,000 | 40% |
| 3,799,810 | 50% |
| The Optimization Value of the Third Objective Function | Increased Change in Cap-and-Trade % |
|---|---|
| 1,820,220 | 5% |
| 2,095,550 | 7% |
| 2,391,240 | 10% |
| 2,594,400 | 15% |
| 2,788,890 | 20% |
| 2,922,190 | 25% |
| 2,987,177 | 30% |
| 3,185,050 | 40% |
| 3,344,899 | 50% |
Disclaimer/Publisher’s Note: The statements, opinions and data contained in all publications are solely those of the individual author(s) and contributor(s) and not of MDPI and/or the editor(s). MDPI and/or the editor(s) disclaim responsibility for any injury to people or property resulting from any ideas, methods, instructions or products referred to in the content. |
© 2023 by the authors. Licensee MDPI, Basel, Switzerland. This article is an open access article distributed under the terms and conditions of the Creative Commons Attribution (CC BY) license (https://creativecommons.org/licenses/by/4.0/).
Share and Cite
Abbasi, S.; Erdebilli, B. Green Closed-Loop Supply Chain Networks’ Response to Various Carbon Policies during COVID-19. Sustainability 2023, 15, 3677. https://doi.org/10.3390/su15043677
Abbasi S, Erdebilli B. Green Closed-Loop Supply Chain Networks’ Response to Various Carbon Policies during COVID-19. Sustainability. 2023; 15(4):3677. https://doi.org/10.3390/su15043677
Chicago/Turabian StyleAbbasi, Sina, and Babek Erdebilli. 2023. "Green Closed-Loop Supply Chain Networks’ Response to Various Carbon Policies during COVID-19" Sustainability 15, no. 4: 3677. https://doi.org/10.3390/su15043677