


Integration between Sustainability and Value Engineering in the Production of Eco-Friendly Concrete


Abstract
:1. Introduction
1.1. Environmental Impact of Concrete
1.2. Fly Ash Concrete as a Solution
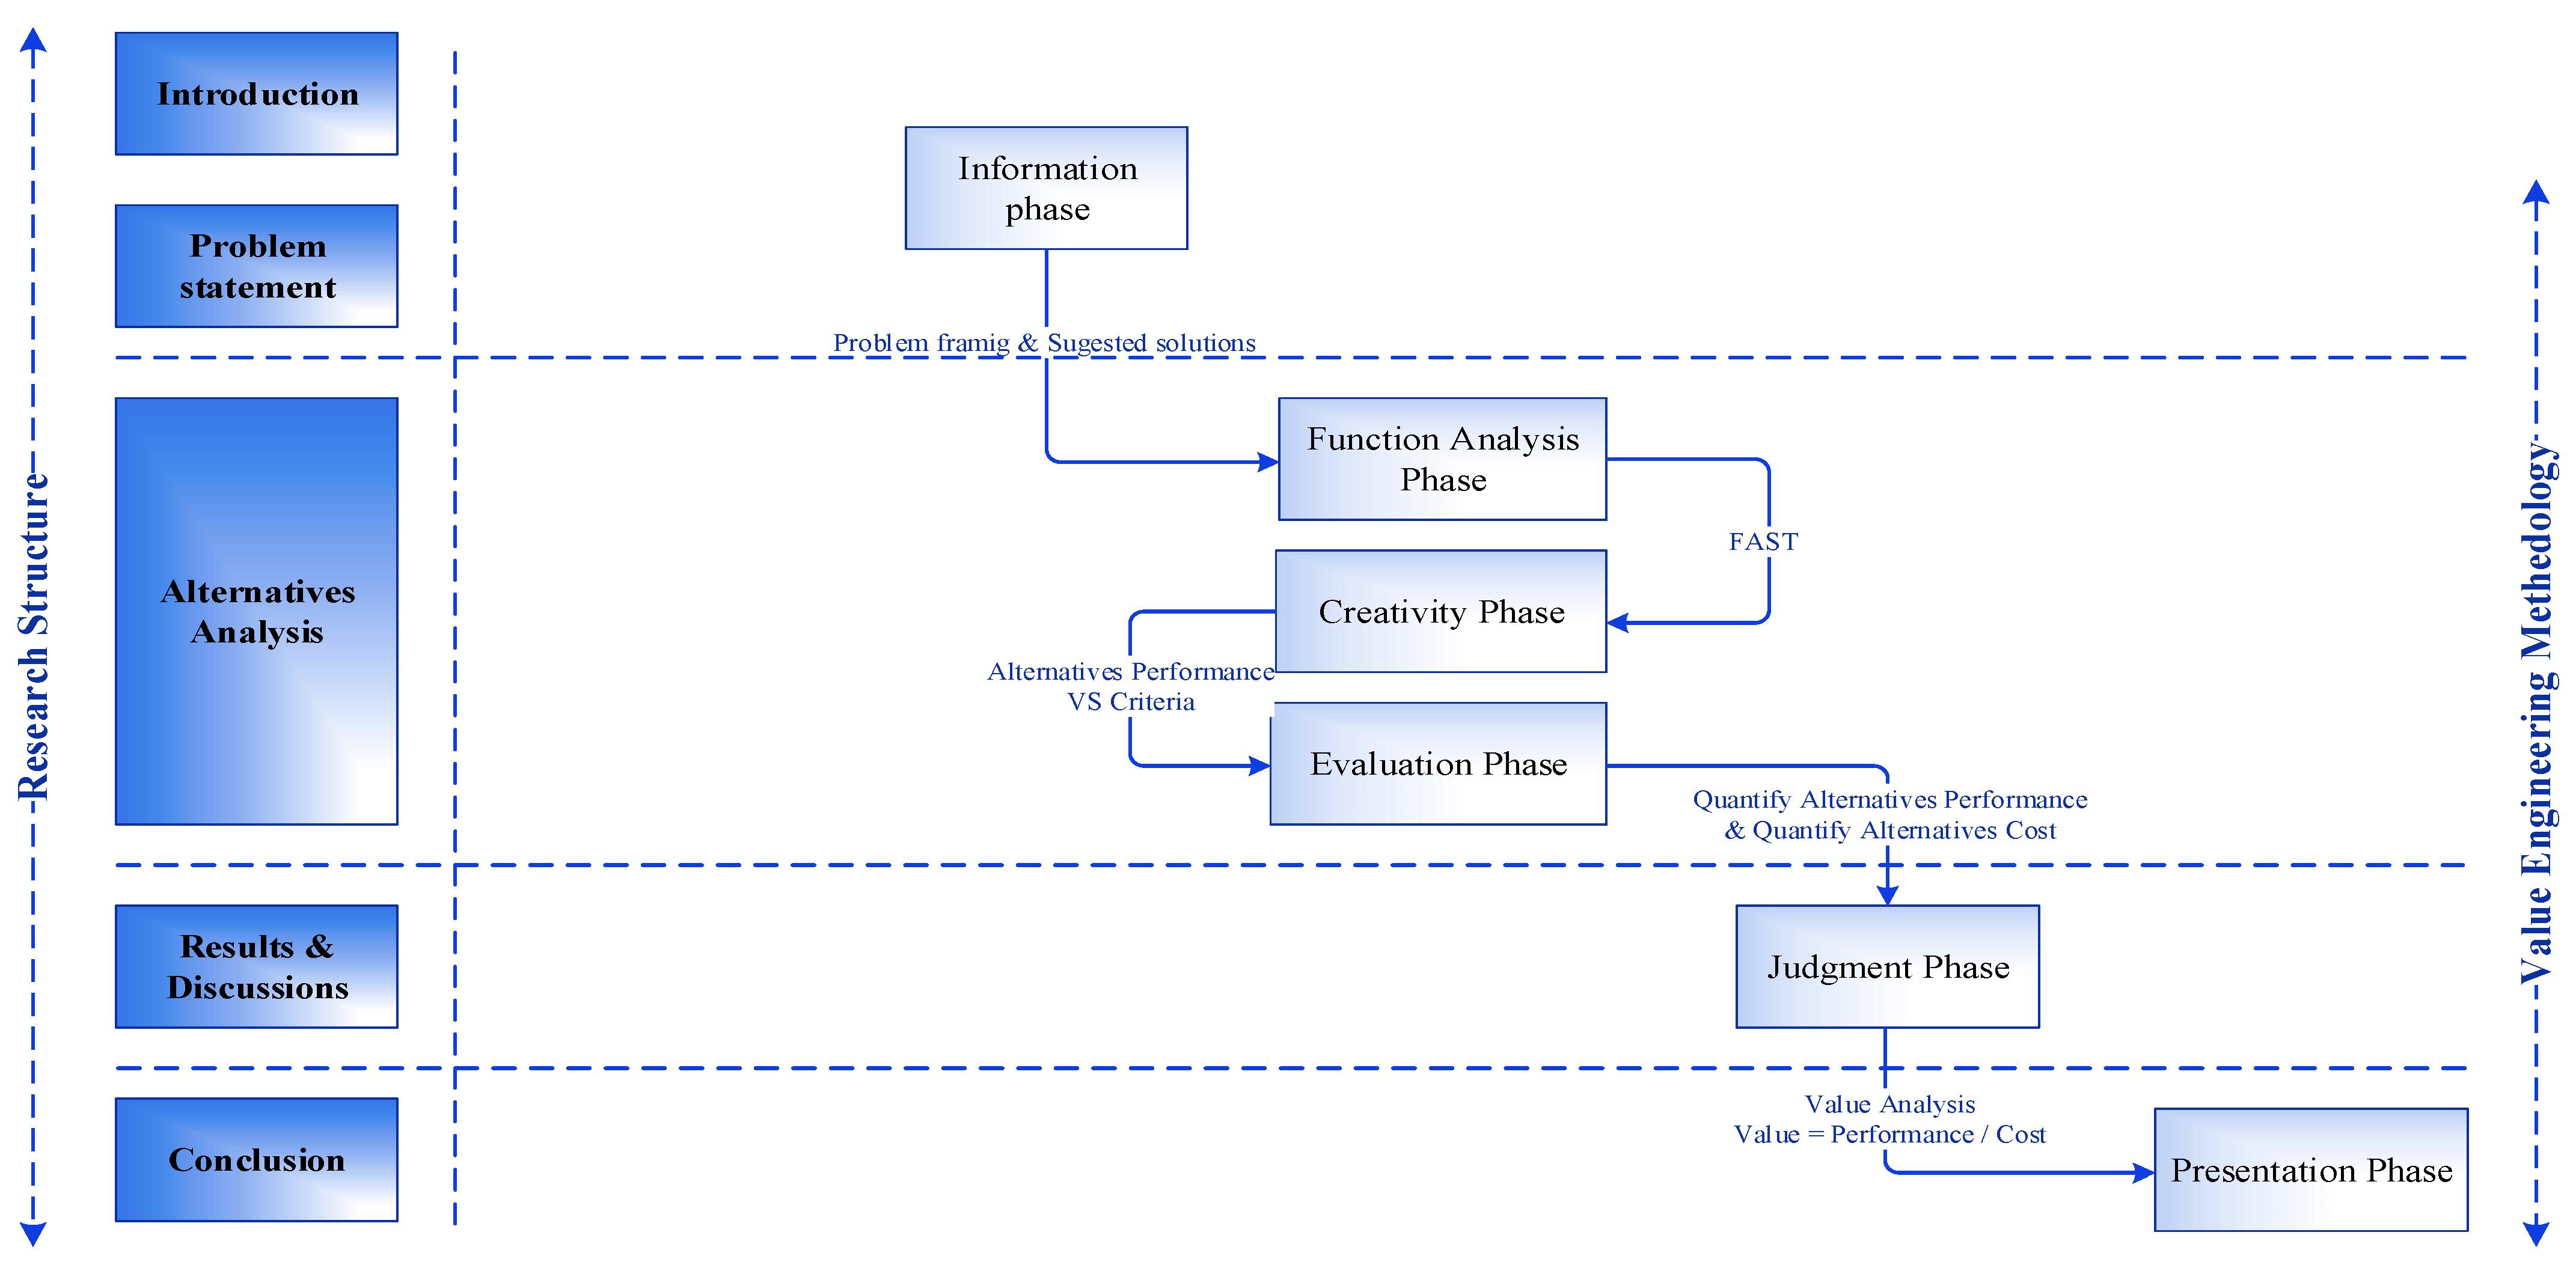
2. Methodology
3. Alternatives Analysis
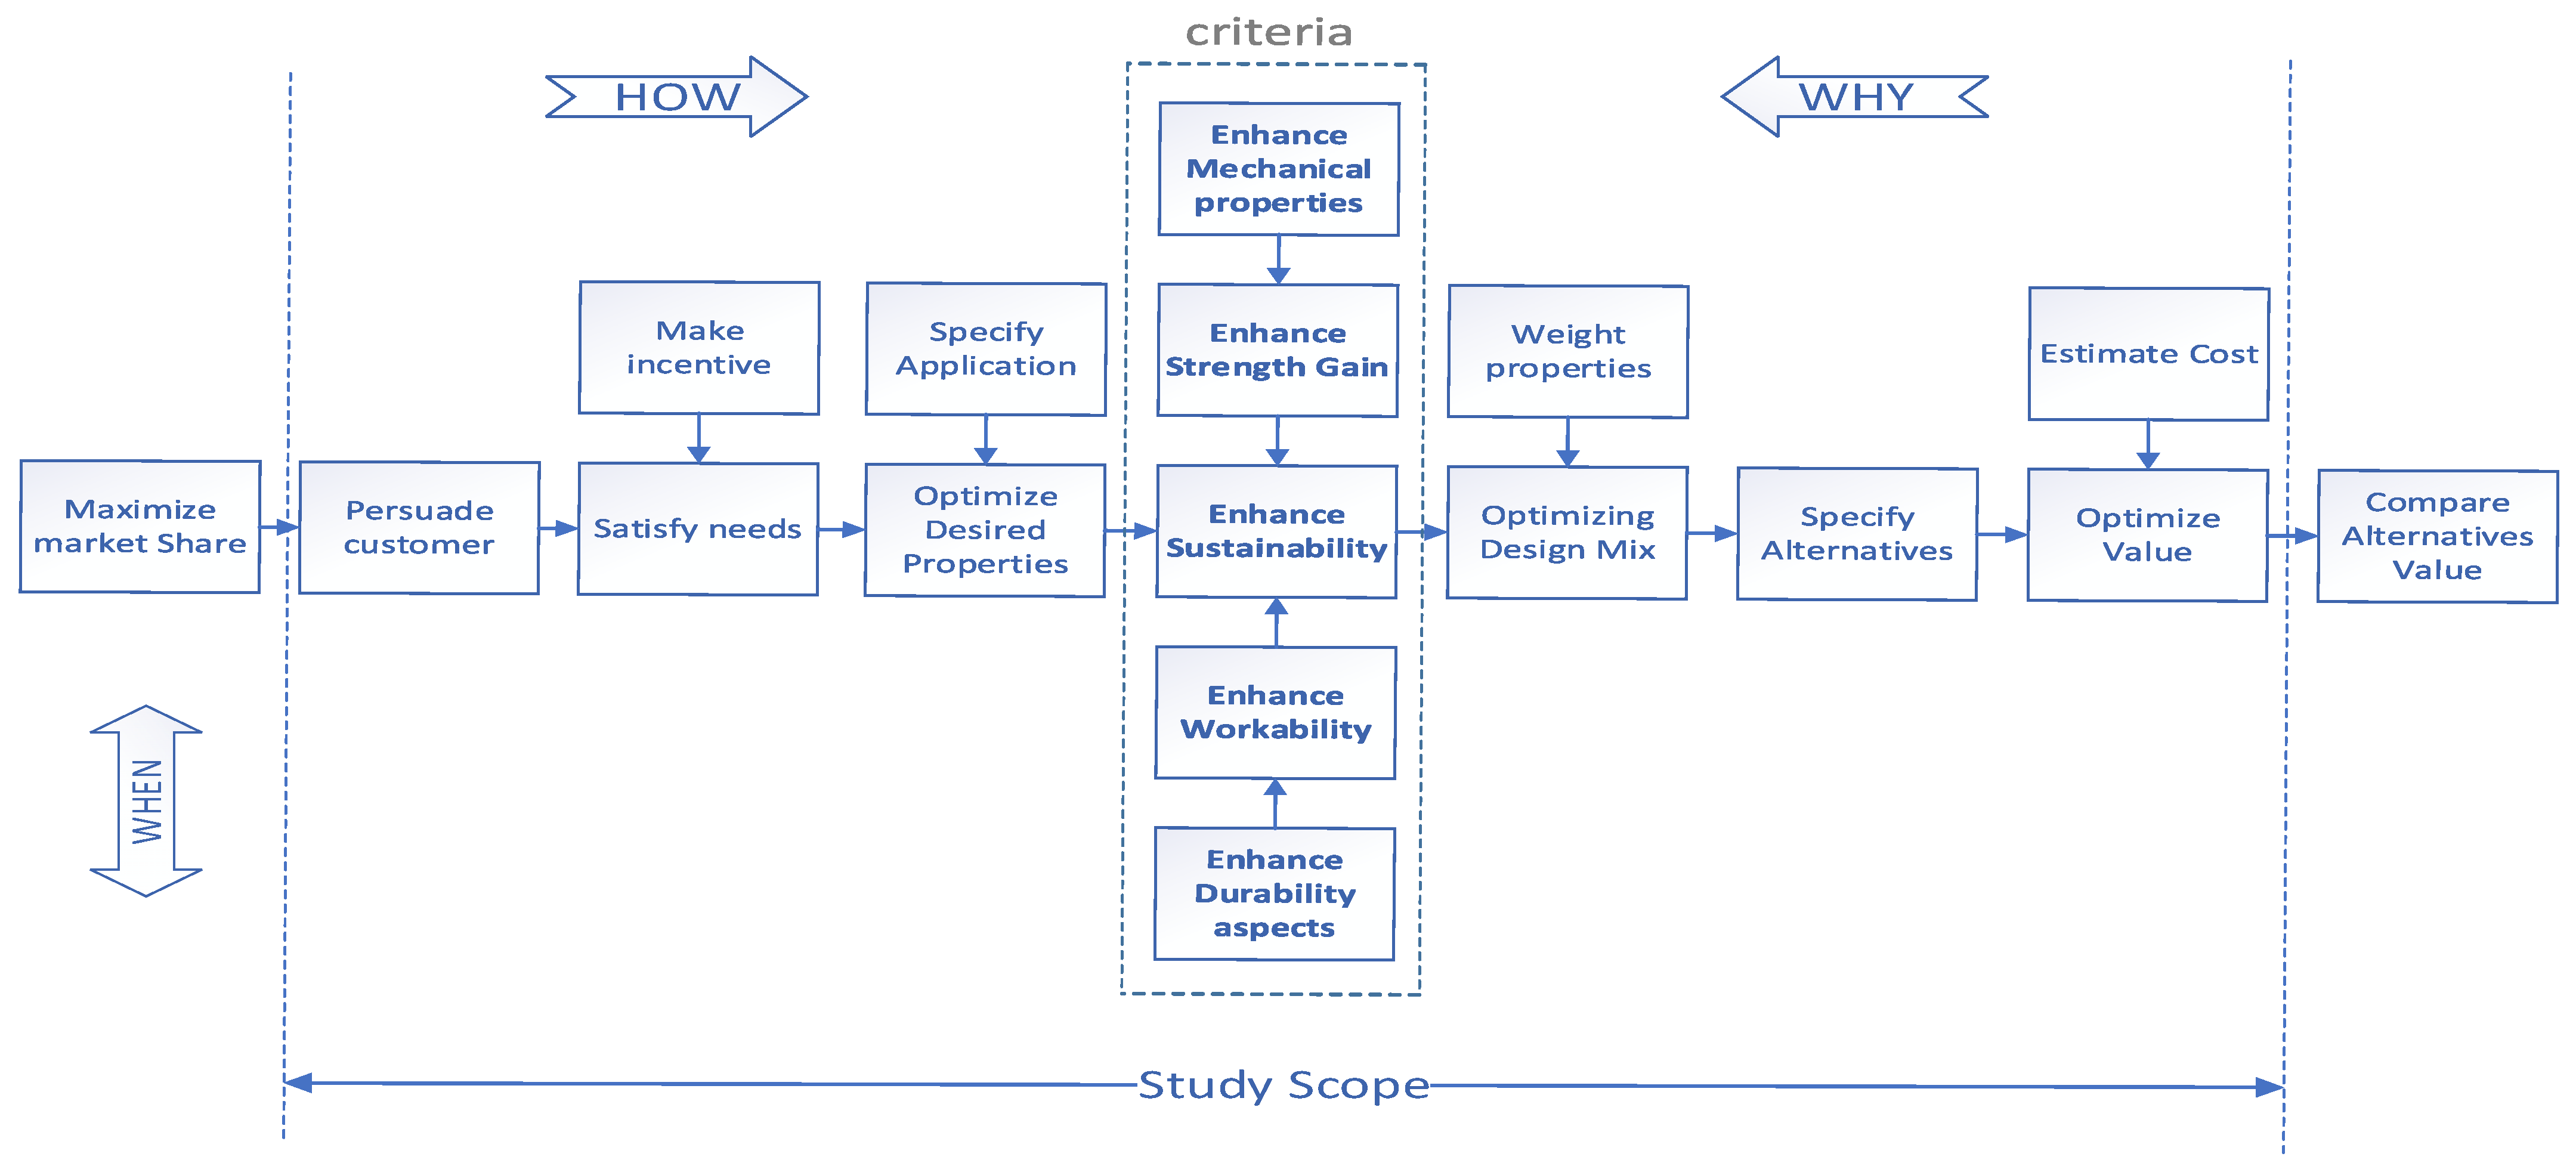
3.1. Function Analysis Phase
3.2. Creativity Phase
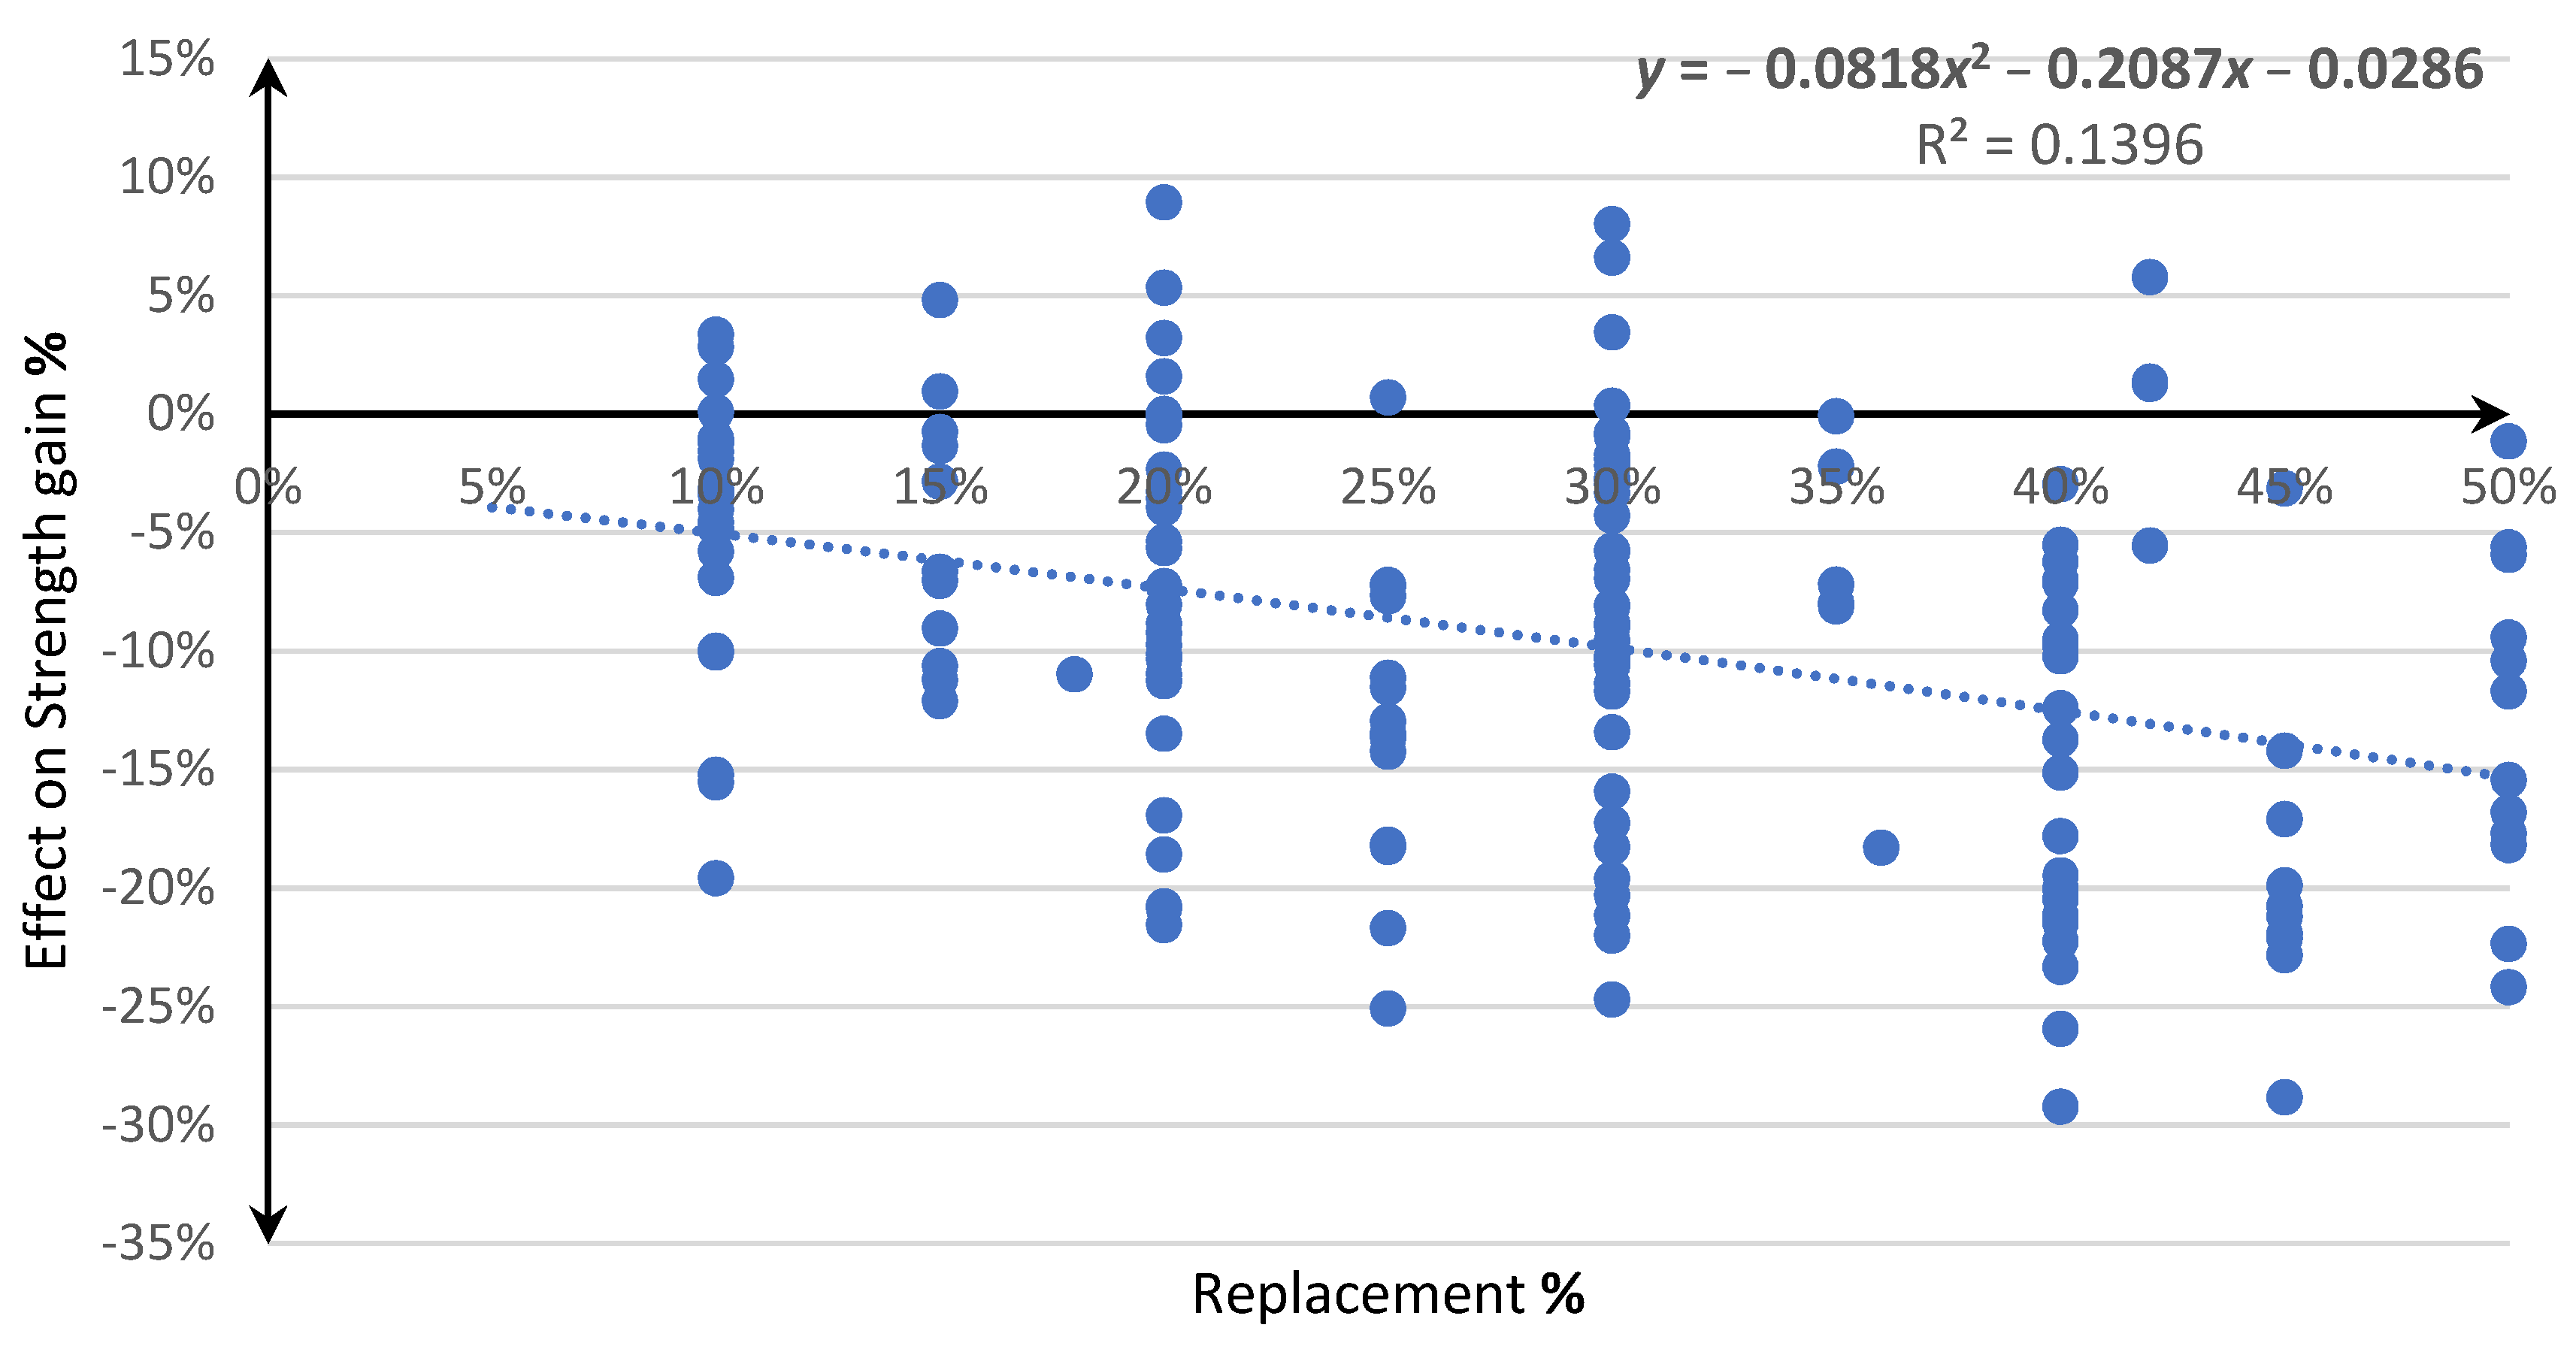
3.2.1. Strength Gain
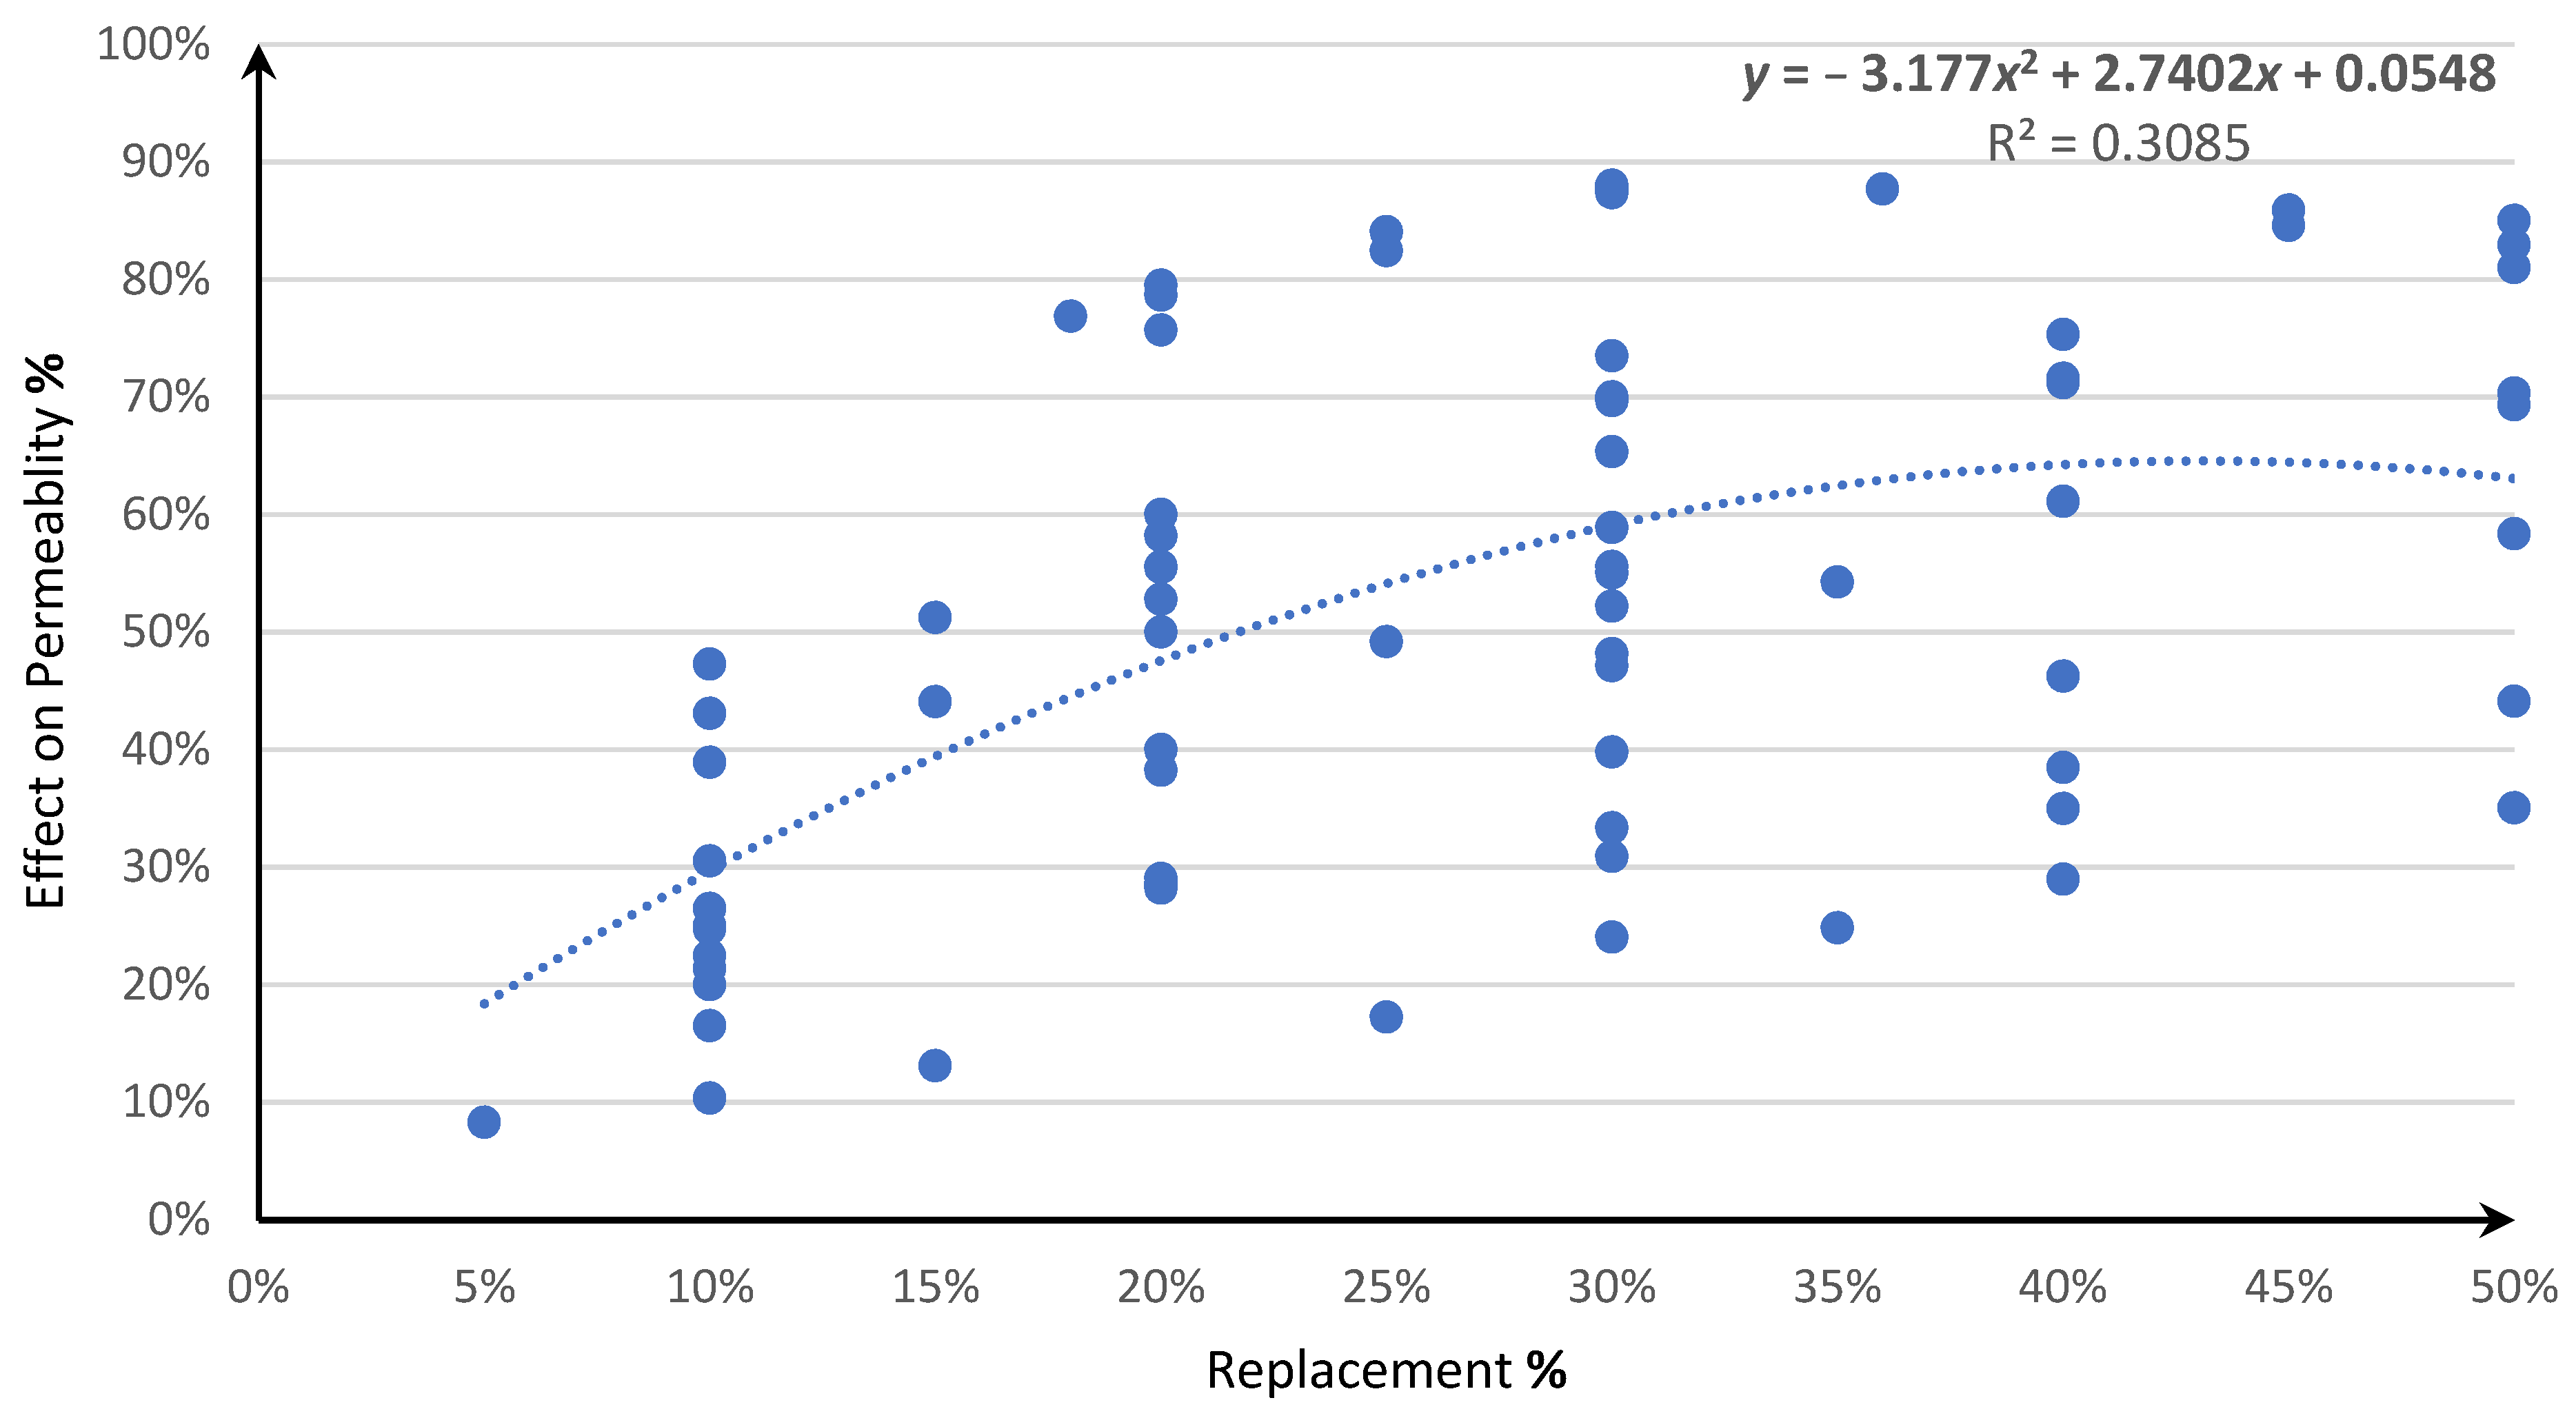
3.2.2. Durability
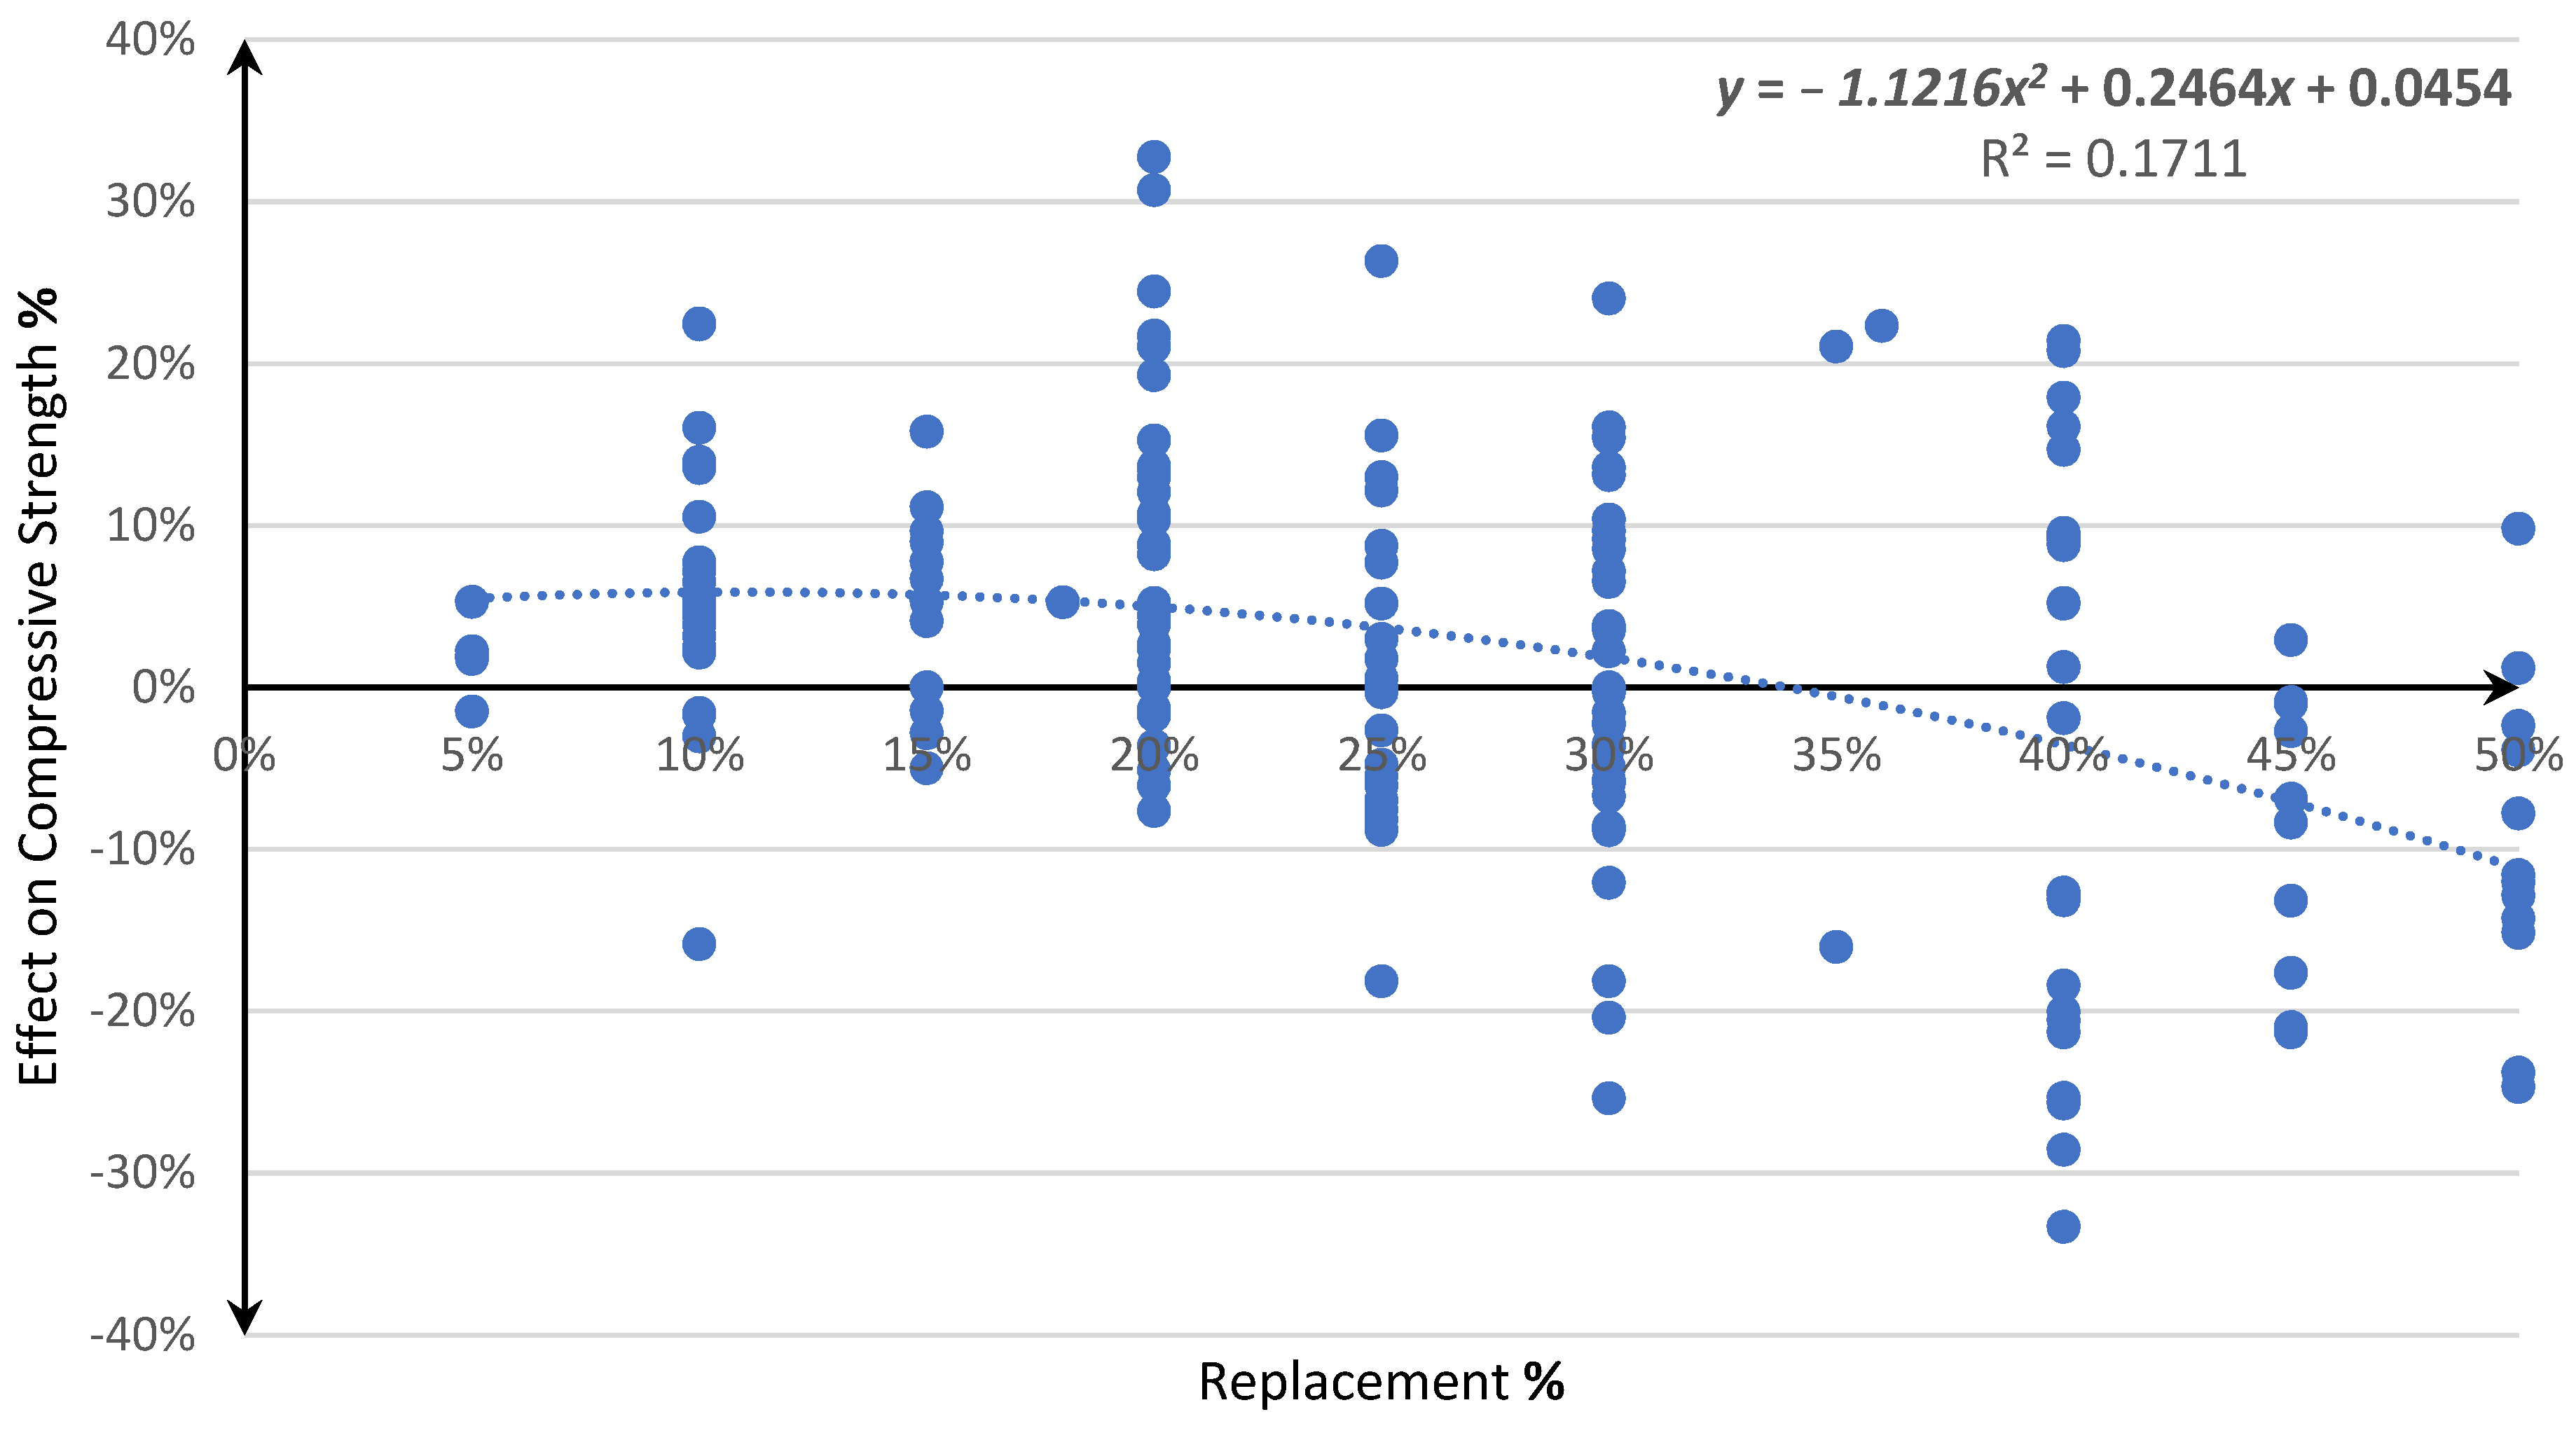
3.2.3. Compressive Strength
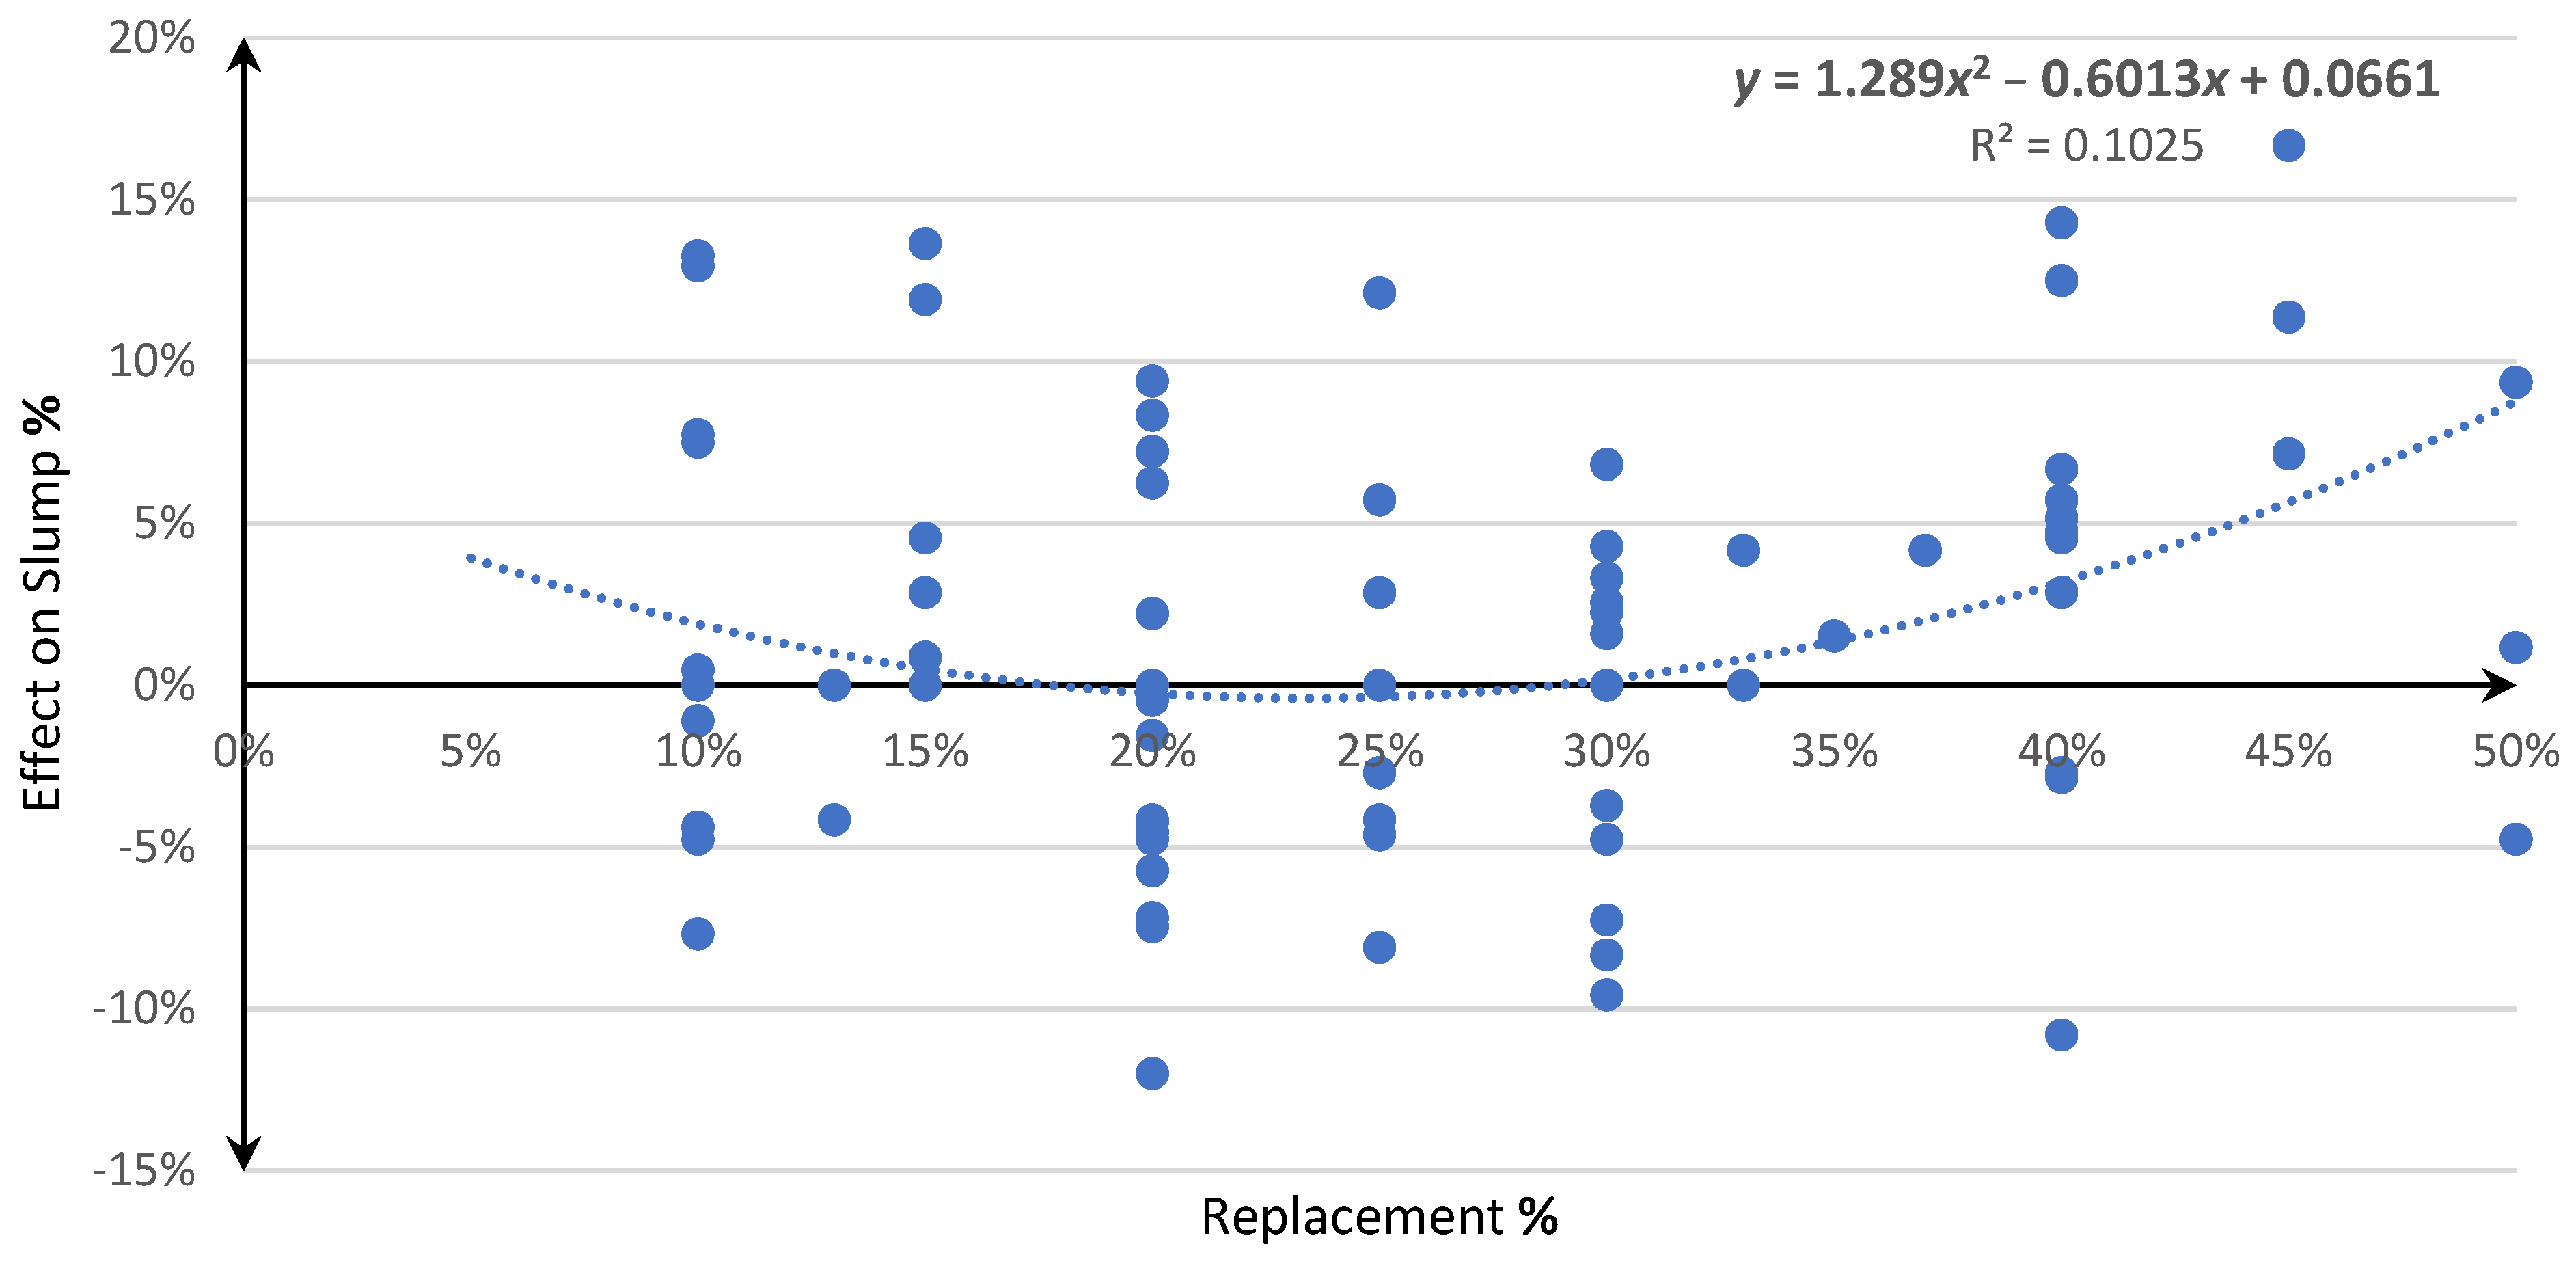
3.2.4. Workability
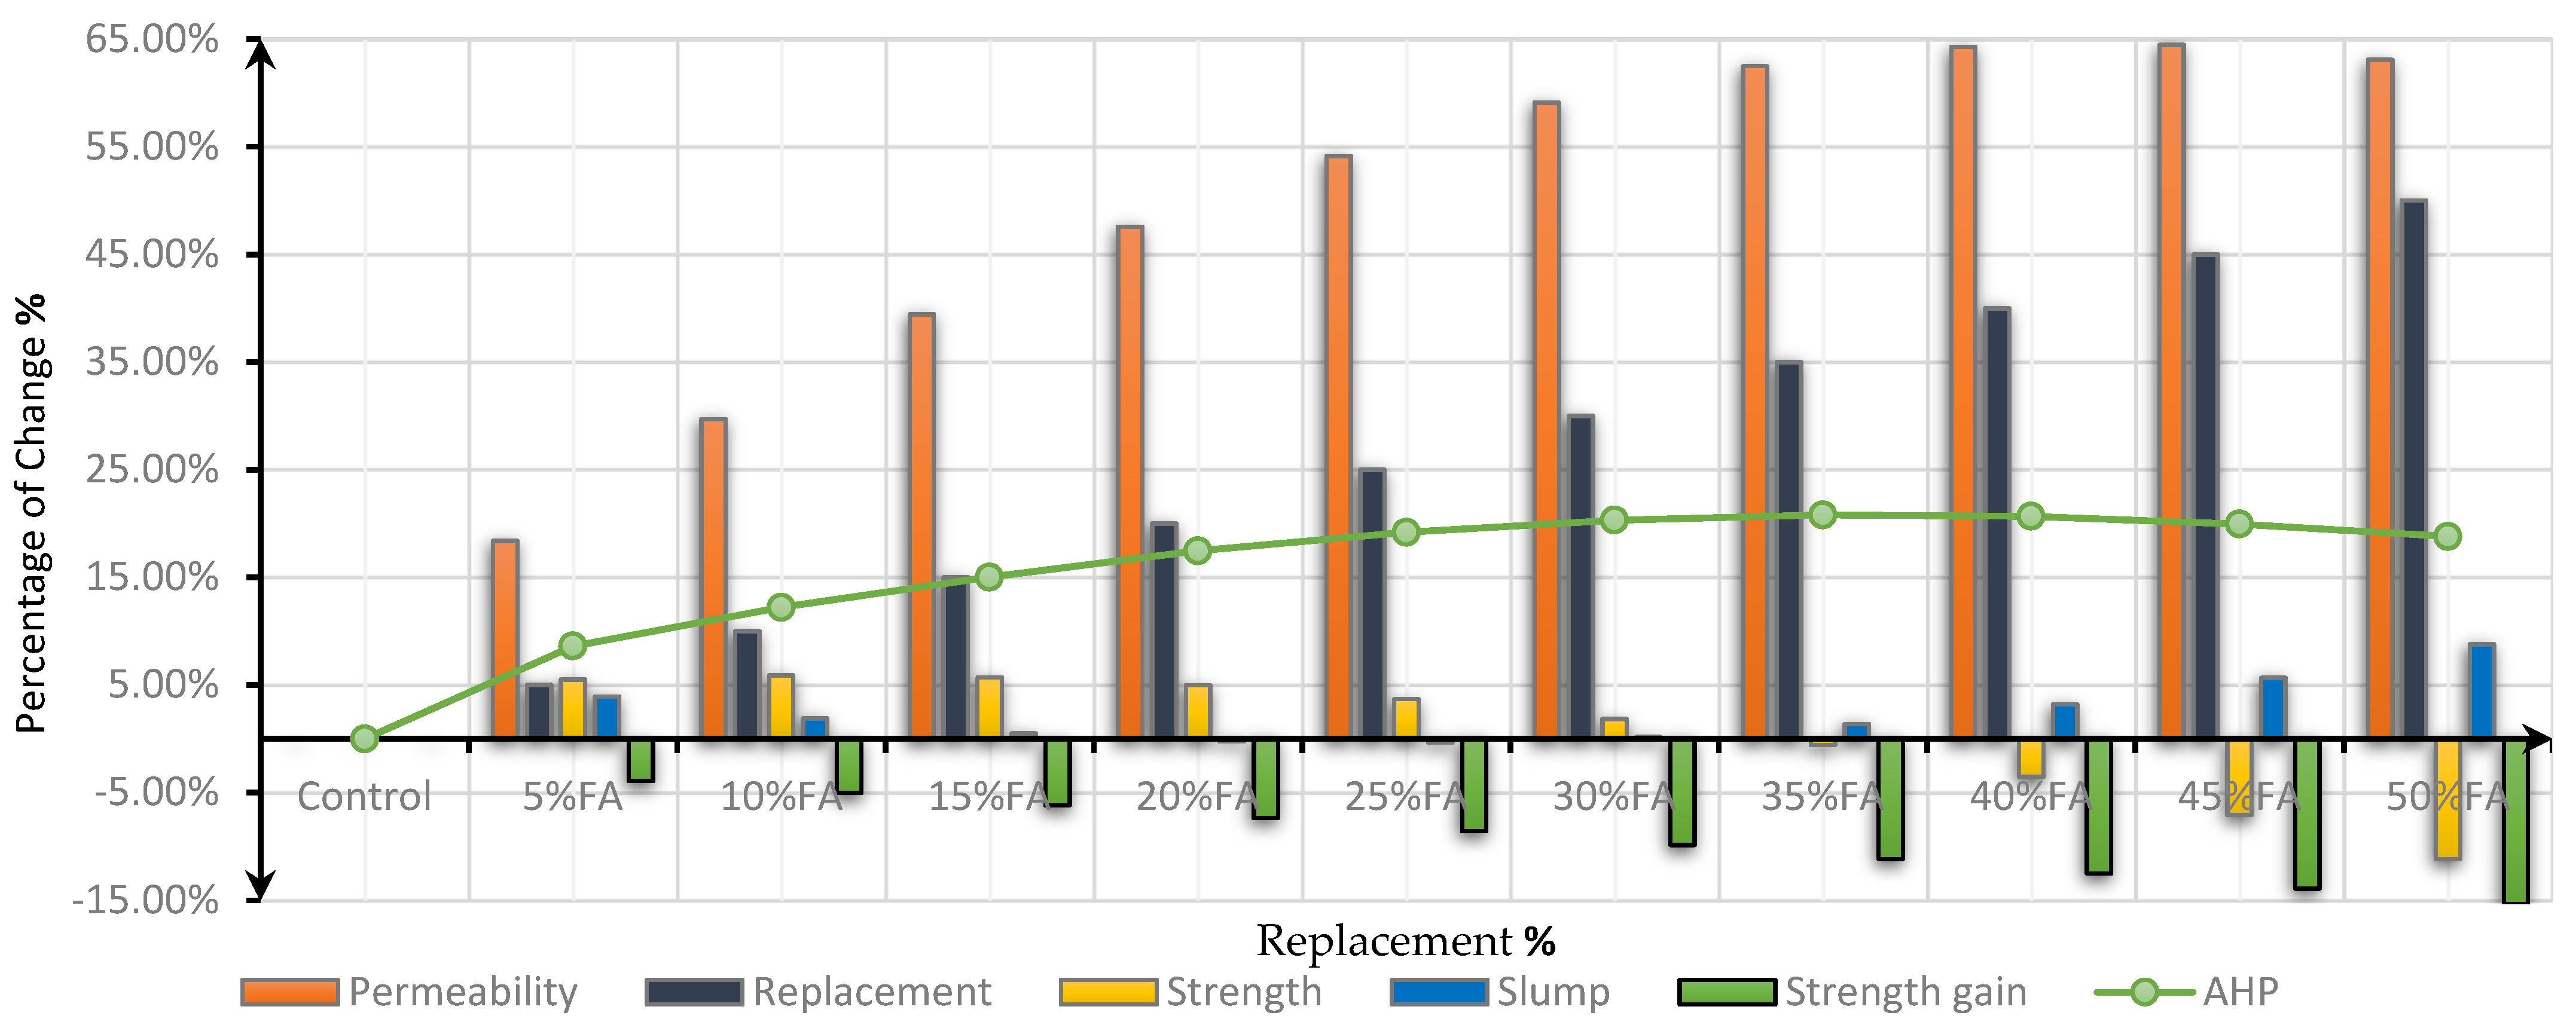
3.2.5. Results Overview
3.3. Evaluation Phase
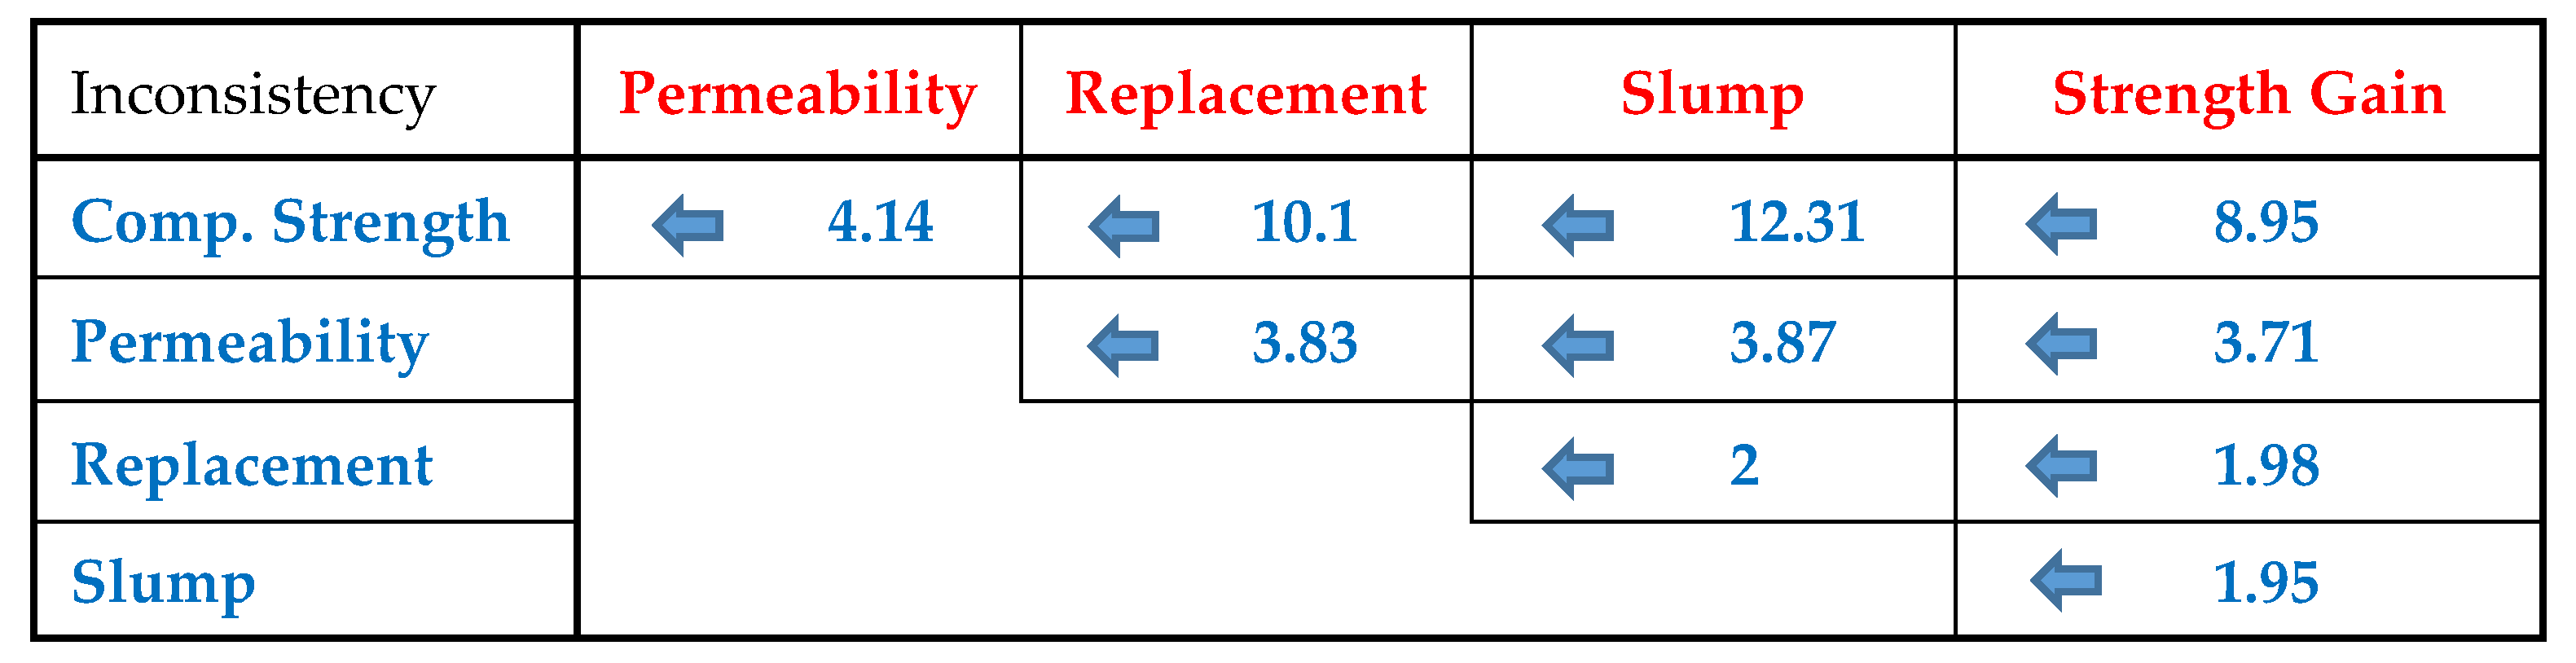
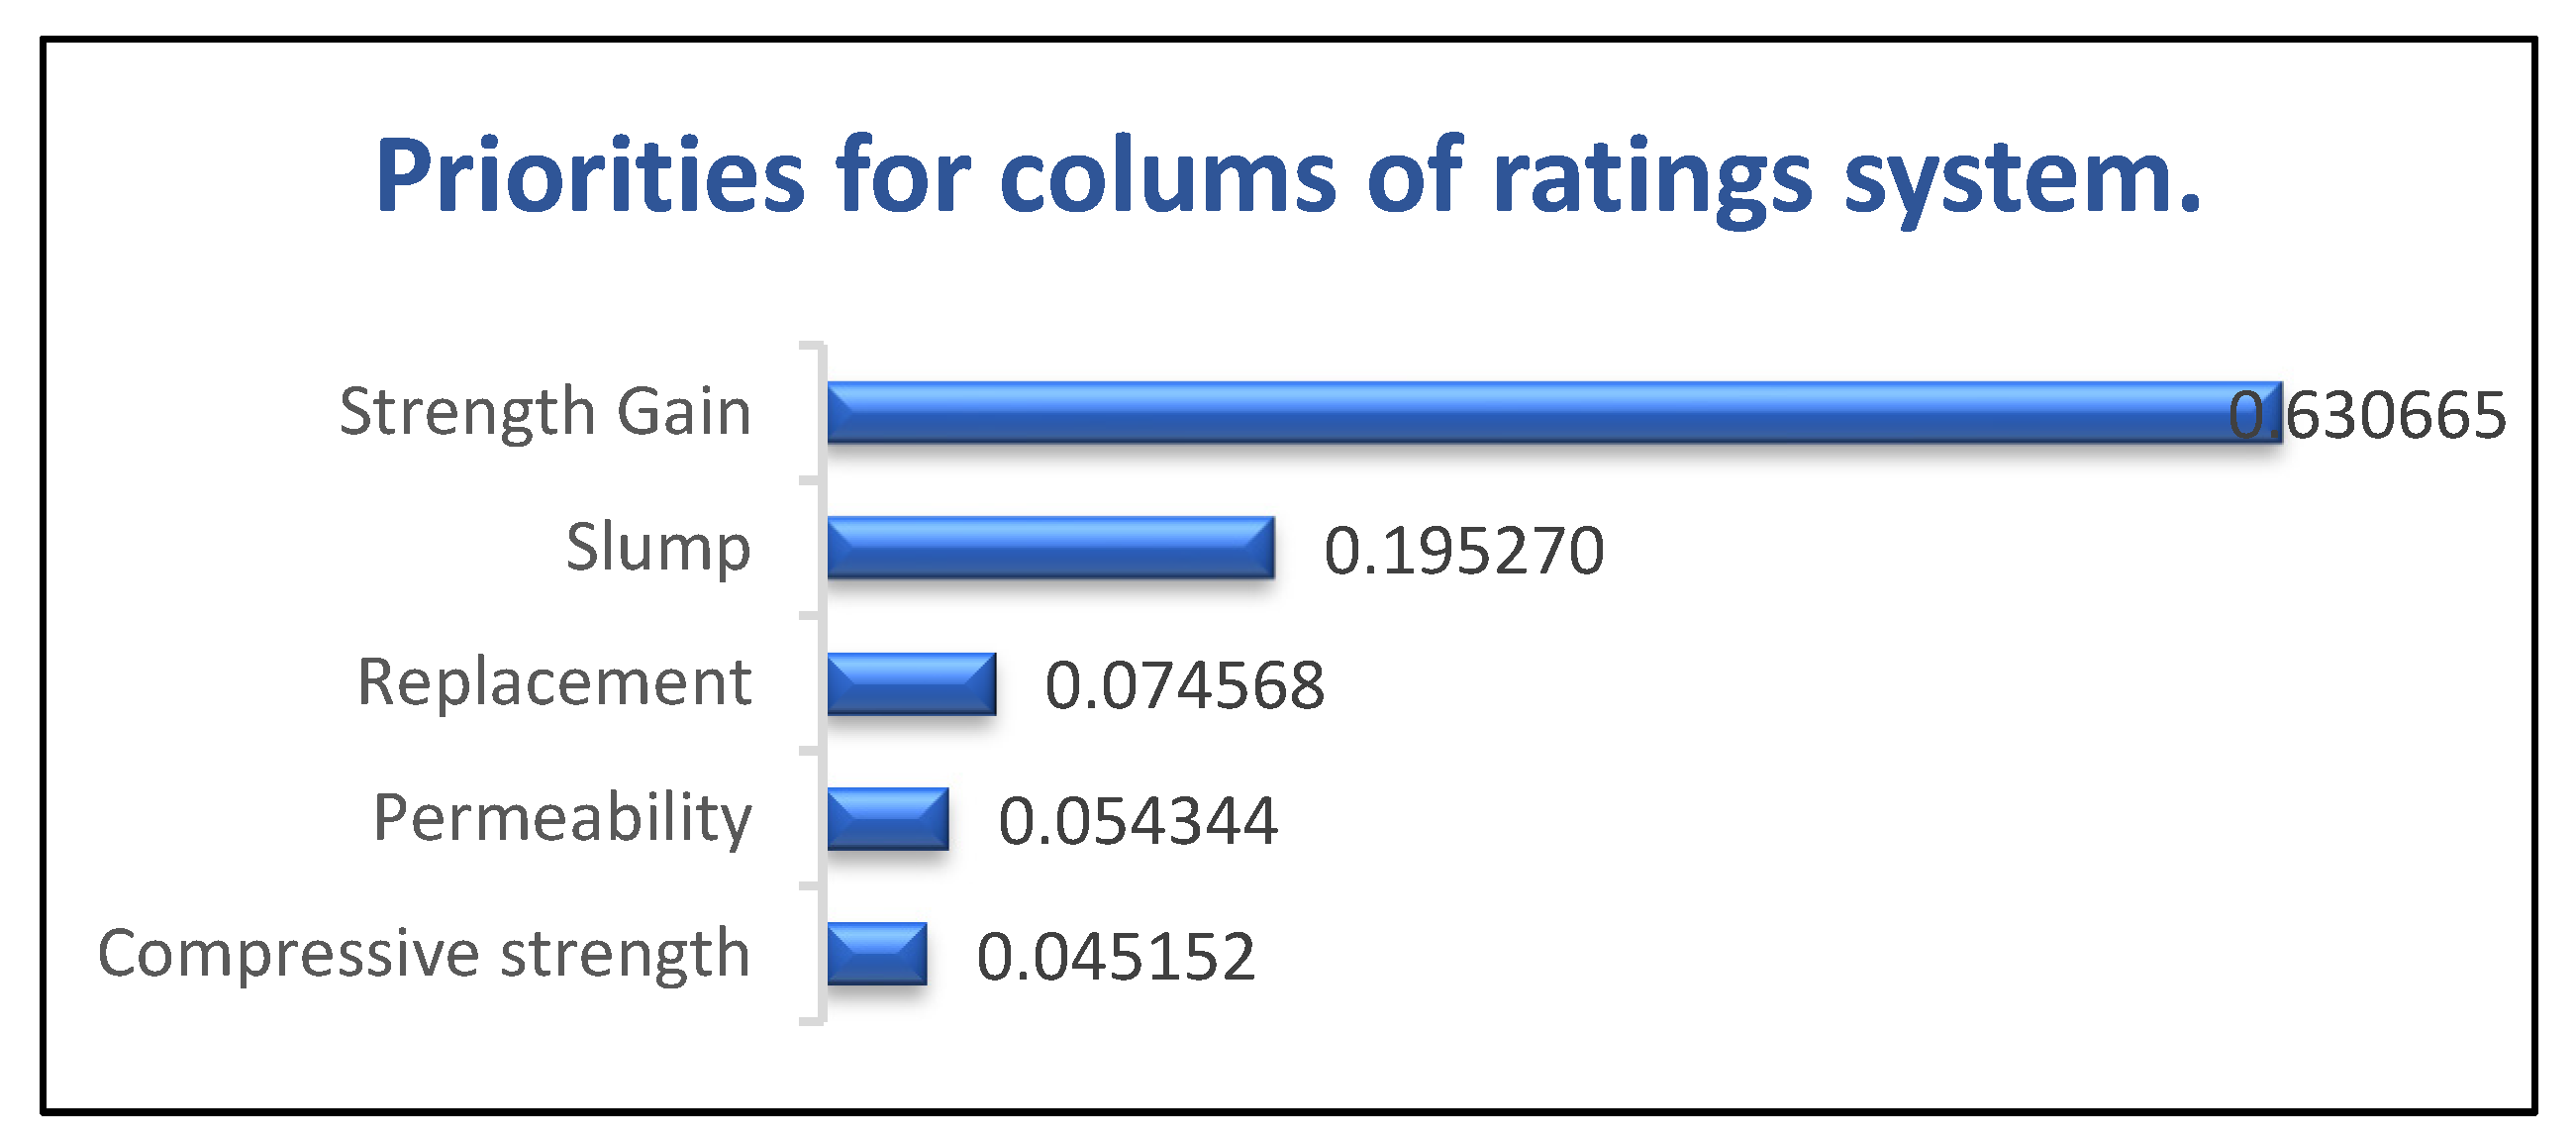
3.3.1. Quantify Alternatives’ Performance
3.3.2. Quantify Alternatives’ Life Cycle Costs (LCC)
4. Results and Discussion
5. Conclusions
- This research offered an applicable framework for evaluating concrete and determining the degree to which the market is willing to accept any change in the concrete components. The framework’s data are case-specific since the best and most sustainable solution in one case may not be the best in another. The average trend was evaluated from 42 previous studies instead of the best or worst results for the criteria. Thus, the sample’s quality can influence results and its corresponding value. Using high quality materials makes the product easier for buyers to accept.
- The desired outcome was achieved by replacing a portion of the Portland cement with FA. This showed that using sustainable materials increases the value of concrete, which makes these materials more appealing to buyers as they are worth more and give them the best return on their money. This grew concrete’s market and enabled us to reach the desired conclusion.
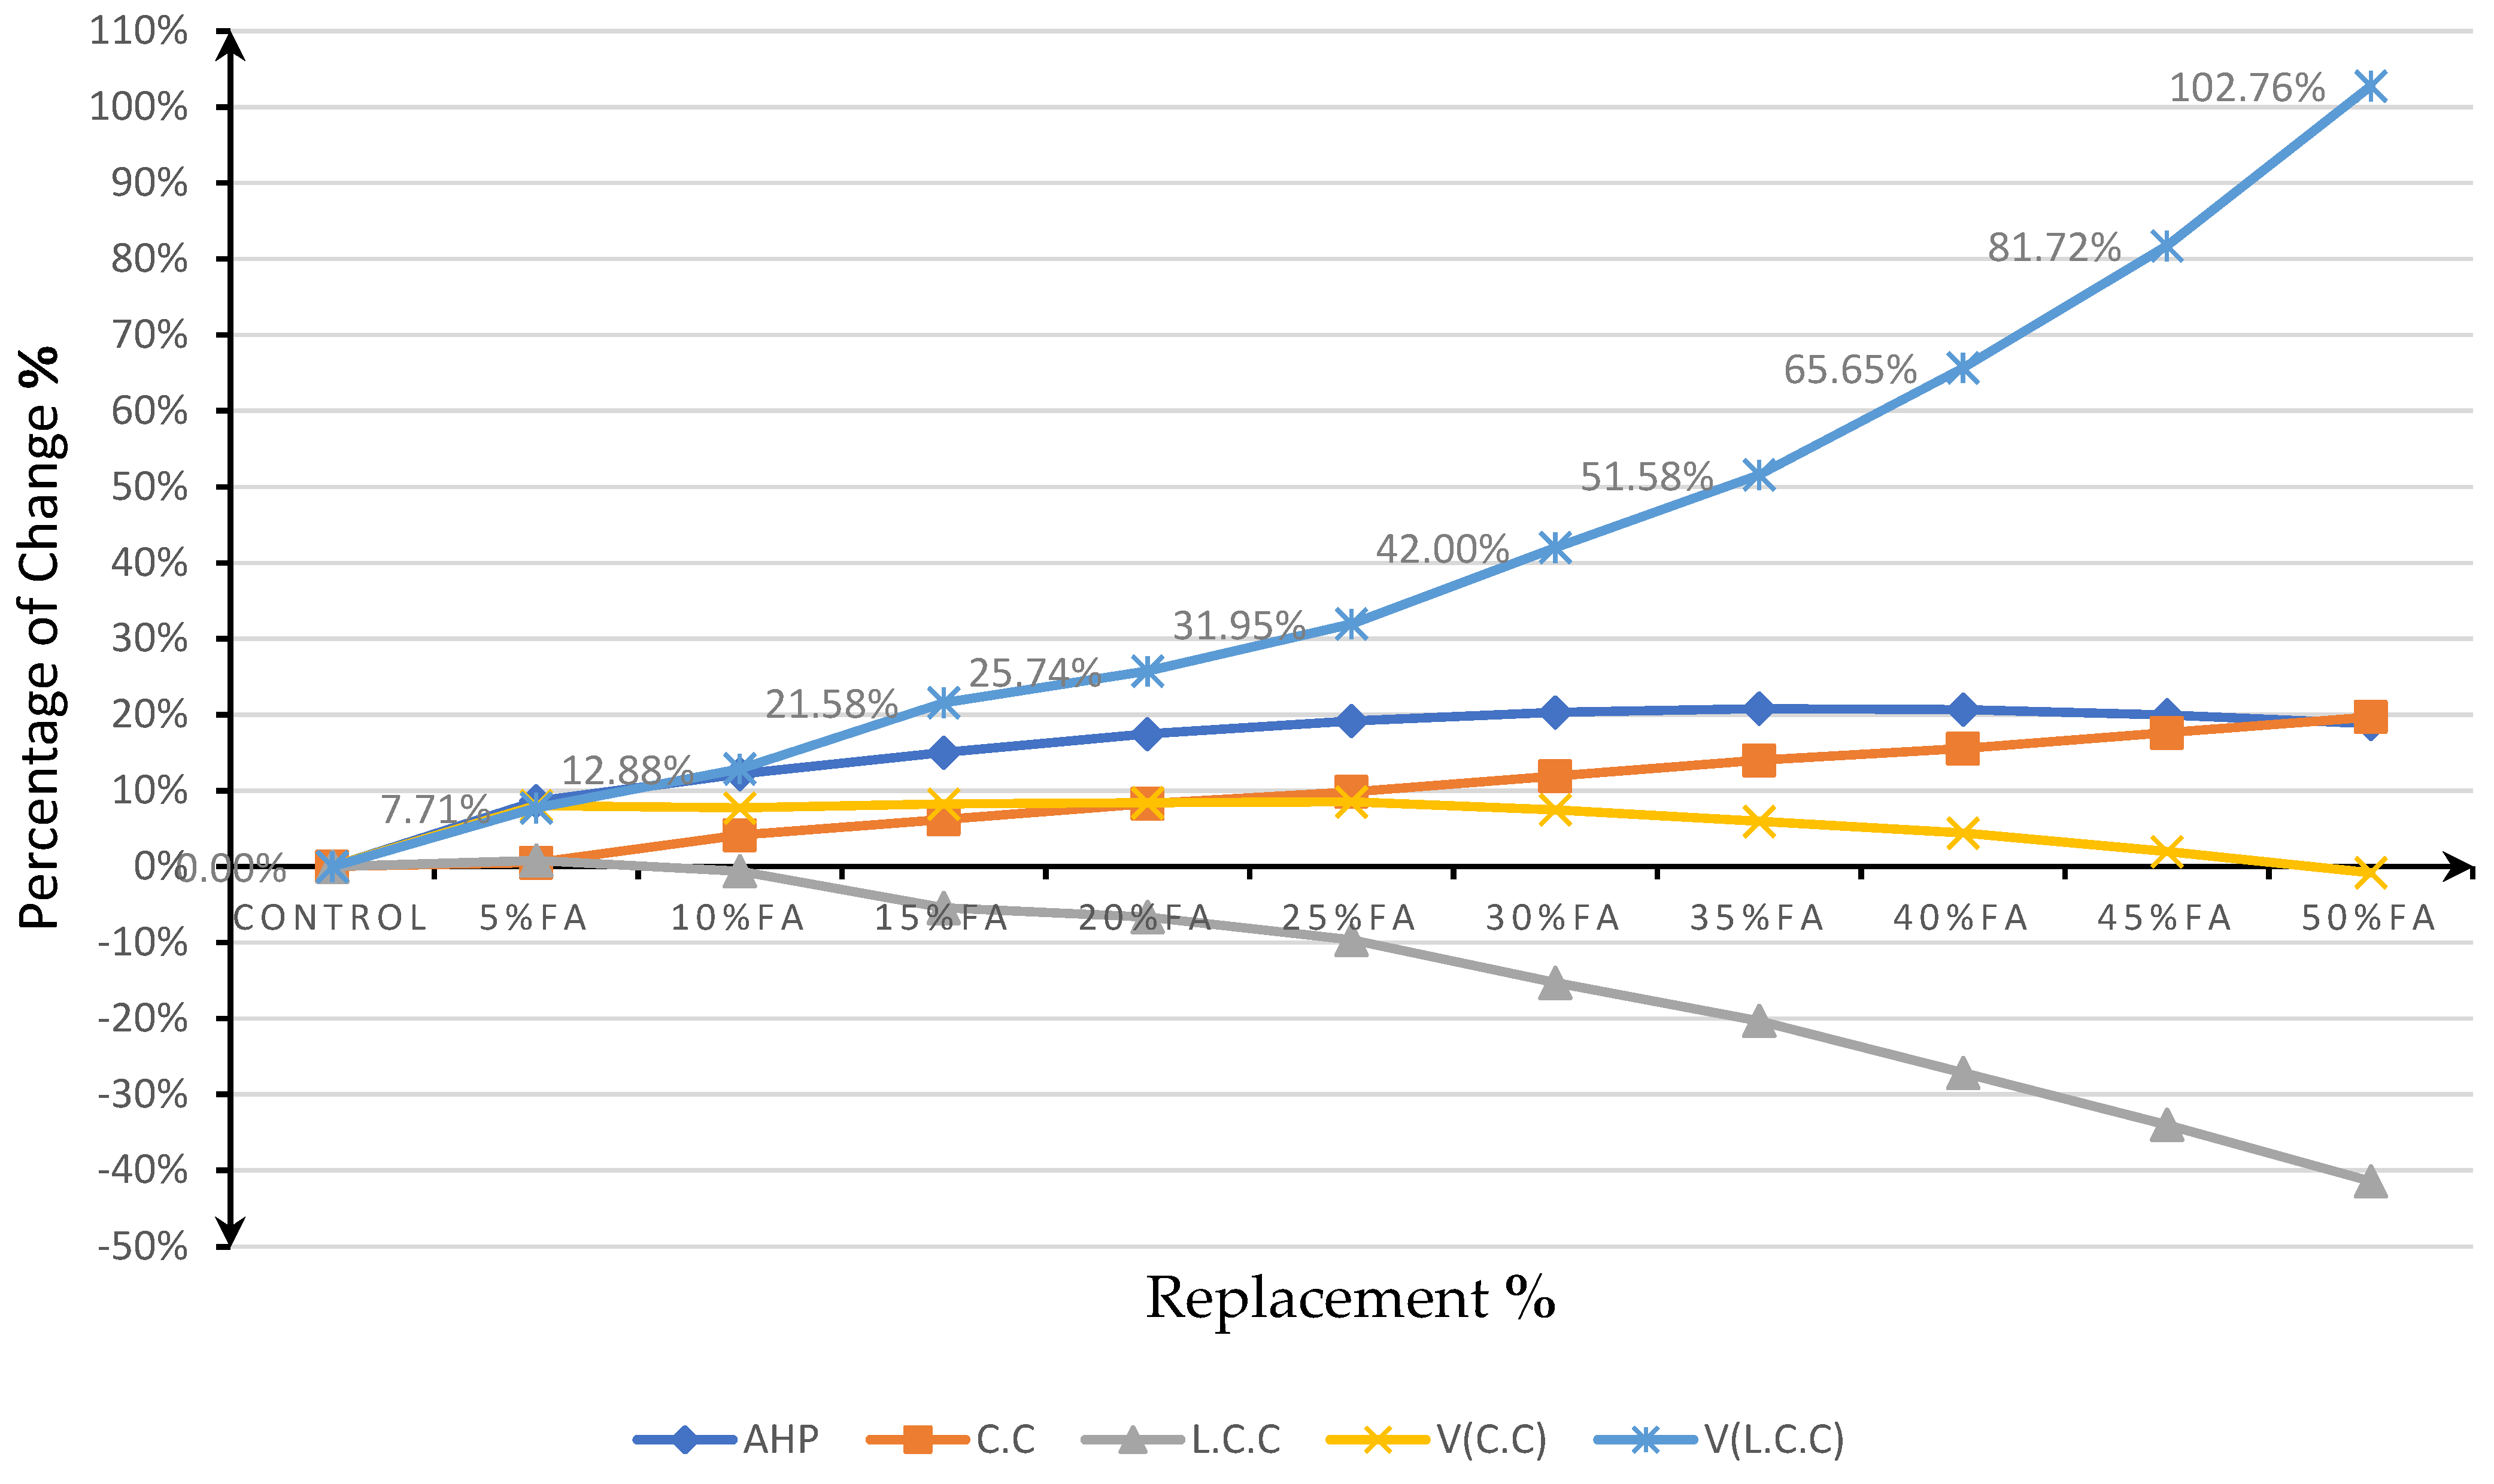
- Durable concrete saves money over its lifetime. There was a gradual increase in construction costs up to 20% at a percentage of replacement of 50%, but there was a significant reduction in life cycle costs down to a decrease of 41.45% compared to conventional concrete. The rationale behind this is lengthening the service life and reducing maintenance costs.
- The value increases two-fold when half of the Portland cement is replaced by fly ash, while the study of the corresponding value of the construction cost reveals that the growth is modest as it does not exceed 8.5% at a 25% replacement rate and then returns to zero. This clearly demonstrates that in order to obtain true and representative results, the study of value must consider the life cycle cost over the initial cost.
- It is important to ensure that the value study is not a technical study but rather a customer-oriented study in the first place, because the performance data generated by AHP analysis are not indicative of value as its curve has a different shape than the value curves generated when studying the cost of construction or life cycle. Furthermore, the best alternative according to AHP results (35% FA) was not the best alternative according to CC (25% FA) or LCC (50% FA) analysis.
- The small value of the regression coefficient between the FA percentage rate and the other criteria indicates that there is no stable relationship between the two variables. The wide range of results was attributed to the different compositions of FA and its source.
- Customer requirements are a direct indication of the relative weights of the various criteria. Marine concrete, for instance, needs to be impermeable and resistant to chlorides. Dams’ hydration temperature control is crucial. Thus, the same concrete mixture has different values depending on the purposes for which it is used. This opens the door for VE to be used as a tool to adjust components to fit specific needs according to customer preferences and give him or her the highest return on their investment in concrete.
- The framework presented in this study can be reused to evaluate concrete and figure out how much the market is willing to accept any changes to its components: not only fly ash, but also other supplementary cementitious materials, alternative aggregate, and any additives added to concrete or any change in the mix.
Author Contributions
Funding
Institutional Review Board Statement
Informed Consent Statement
Data Availability Statement
Conflicts of Interest
References
- de Brito, J.; Kurda, R. The past and future of sustainable concrete: A critical review and new strategies on cement-based materials. J. Clean. Prod. 2021, 281, 123558. [Google Scholar] [CrossRef]
- Aitcin, P.-C. Binders for Durable and Sustainable Concrete; CRC Press: London, UK, 2007. [Google Scholar] [CrossRef]
- Phair, J.W. Green chemistry for sustainable cement production and use. Green Chem. 2006, 8, 763–780. [Google Scholar] [CrossRef]
- Sato, Y.; Kaufman, J.J. Value Analysis Tear-Down: A New Process for Product Development and Innovation; Indus-trial Press Inc.: 2005. Available online: http://www.knovel.com/knovel2/Toc.jsp?BookID=3327 (accessed on 5 April 2022).
- Rachwan, R.; Abotaleb, I.; Elgazouli, M. The Influence of Value Engineering and Sustainability Considerations on the Project Value. Procedia Environ. Sci. 2016, 34, 431–438. [Google Scholar] [CrossRef] [Green Version]
- Yu, M.; Robati, M.; Oldfield, P.; Wiedmann, T.; Crawford, R.; Nezhad, A.A.; Carmichael, D. The impact of value engineering on embodied greenhouse gas emissions in the built environment: A hybrid life cycle assessment. Build. Environ. 2020, 168, 106452. [Google Scholar] [CrossRef]
- Tang, P.; Bittner, R.B. Use of Value Engineering to Develop Creative Design Solutions for Marine Construction Projects. Pr. Period. Struct. Des. Constr. 2014, 19, 129–136. [Google Scholar] [CrossRef]
- Rani, H.A. Optimization and Effectiveness of Bridge Construction Development Based on Value Engineering. Int. J. Civil, Struct. Environ. Infrastruct. Eng. Res. 2017, 7, 15–22. Available online: https://www.researchgate.net/publication/316082314 (accessed on 15 March 2021).
- Fang, J.; Qi, Y. Economic analysis of prefabricated buildings based on value engineering analysis. IOP Conf. Ser. Earth Environ. Sci. 2021, 634, 012127. [Google Scholar] [CrossRef]
- Glass, J.; Baiche, B.; Jenks, M. Assessing Concrete Technology Innovation Using Value Engineering (Active). In Challenges of Concrete Construction: Volume 5, Sustainable Concrete Construction: Proceedings of the International Conference Held at the University of Dundee, UK, 9–11 September 2002; Thomas Telford Publishing: London, UK, 2002; pp. 703–710. [Google Scholar] [CrossRef]
- Sarsembayeva, A.; Bovolenta, R. Value Engineering as a basis for safe, optimized and sustainable design of geotechnical structures. In Geotechnical Engineering for Infrastructure and Development; ICE Publishing: London, UK, 2015; pp. 601–606. [Google Scholar] [CrossRef]
- Elhegazy, H. State-of-the-art review on benefits of applying value engineering for multi-story buildings. Intell. Build. Int. 2020, 14, 544–563. [Google Scholar] [CrossRef]
- Mehta, C.S.; Mehta, E.P.; Pitroda, J. Application of value engineering in construction projects. Int. Res. J. Eng. Technol. 2020, 7. Available online: https://www.irjet.net/archives/V7/i7/IRJET-V7I775.pdf (accessed on 5 February 2022).
- El-Alfy, A.E.D. Design of sustainable buildings through Value Engineering. J. Build. Apprais. 2010, 6, 69–79. [Google Scholar] [CrossRef] [Green Version]
- Mahdi, I.; Heiza, K.; Elenen, N.A. Value engineering and value analysis of vertical slip form construction system. Int. J. Appl. Innov. Eng. Manag. 2015, 4. [Google Scholar] [CrossRef]
- Russell, J.S.; Member, A.; Swiggum, K.E.; Shapiro, J.M.; Alaydrus, A.F. Constructability related to TQM, value engineering, and cost/benefits. J. Perform. Constr. Facil. 1994, 8, 31–45. [Google Scholar] [CrossRef]
- El-Baghdady, A.M.; Abdulgalil, W.S.; Asran, A.; Nosier, I. Optimization of Cementitious Material Content for Sustainable Concrete Mixtures through Value Engineering Approach. 2019. SSRN 3375588. Available online: https://ssrn.com/abstract=3375588 (accessed on 9 October 2021).
- Huang, C.-F.; Lo, K.-L.; Wang, H.-Y.; Wu, Y.-W. Applying value engineering to evaluate the use of concrete in an underground railway construction project. In Proceedings of the 2011 International Conference on Consumer Electronics, Communications and Networks (CECNet), Xianning, China, 16–18 April 2011; pp. 4797–4800. [Google Scholar] [CrossRef]
- Komarudin, A.; Darjanto, H.; Santosa, R.E. Analysis Value Engineering Fly Ash Optimum for Mass Concrete. Int. J. Soc. Dev. Engagem. 2021, 5, 27–32. [Google Scholar] [CrossRef]
- Mohd, S.; Asif, T.; Wayal, A.S. Study on Properties of Lightweight Concrete Using Expanded Clay Aggregate and Its Value Engineering. In Advances in Civil Engineering and Infrastructural Development; Springer: Singapore, 2019; pp. 149–163. [Google Scholar] [CrossRef]
- Sudiarsa, M.; Suasira, I.W.; Sudiasa, I.W. Implementation of value engineering in design building for the construction of general hospitals in Jembrana Regency. J. Phys. Conf. Ser. 2020, 1450, 012017. [Google Scholar] [CrossRef]
- Miles, L.D. Techniques of Value Analysis and Engineering, 3rd ed.; Miles Value Foundation: San Pedro, CA, USA, 1989. [Google Scholar]
- Jahren, P.; Sui, T. Concrete and Sustainability; CRC Press: Boca Raton, FL, USA, 2013. [Google Scholar]
- Tahwia, A.M.; Elgendy, G.M.; Amin, M. Mechanical properties of affordable and sustainable ultra-high-performance concrete. Case Stud. Constr. Mater. 2022, 16, e01069. [Google Scholar] [CrossRef]
- Golewski, G.L. Energy Savings Associated with the Use of Fly Ash and Nanoadditives in the Cement Composition. Energies 2020, 13, 2184. [Google Scholar] [CrossRef]
- United Nations Environment Program. Global Status Report for Buildings and Construction: Towards a Zero-Emission, Efficient and Resilient Buildings and Construction Sector. 2021. Available online: https://globalabc.org/resources/publications/2021-global-status-report-buildings-and-construction (accessed on 10 September 2021).
- Krithika, J.; Kumar, G.R. Influence of fly ash on concrete—A systematic review. Mater. Today Proc. 2020, 33, 906–911. [Google Scholar] [CrossRef]
- Pacheco-Torgal, F.; Jalali, S.; Labrincha, J.; John, V.M. Eco-Efficient Concrete; Elsevier: Amsterdam, The Netherlands, 2013. [Google Scholar] [CrossRef]
- Sun, J.; Shen, X.; Tan, G.; Tanner, J.E. Compressive strength and hydration characteristics of high-volume fly ash concrete prepared from fly ash. J. Therm. Anal. Calorim. 2019, 136, 565–580. [Google Scholar] [CrossRef]
- Błaszczyński, T.; Król, M. Usage of Green Concrete Technology in Civil Engineering. Procedia Eng. 2015, 122, 296–301. [Google Scholar] [CrossRef] [Green Version]
- Matarul, J.; Mannan, M.A.; Yussop, N.; Endut, M.Z.; Ibrahim, A. Optimising concrete enhancement of local ready-mix concrete partially replaced with local fly-Ash. J. Phys. Conf. Ser. 2019, 1349, 012029. [Google Scholar] [CrossRef] [Green Version]
- Fasihihour, N.; Abad, J.M.N.; Karimipour, A.; Mohebbi, M.R. Experimental and numerical model for mechanical properties of concrete containing fly ash: Systematic review. Measurement 2022, 188, 110547. [Google Scholar] [CrossRef]
- Li, G.; Zhou, C.; Ahmad, W.; Usanova, K.I.; Karelina, M.; Mohamed, A.M.; Khallaf, R. Fly Ash Application as Supplementary Cementitious Material: A Review. Materials 2022, 15, 2664. [Google Scholar] [CrossRef]
- Xu, G.; Shi, X. Characteristics and applications of fly ash as a sustainable construction material: A state-of-the-art review. Resour. Conserv. Recycl. 2018, 136, 95–109. [Google Scholar] [CrossRef]
- Rivera, F.; Martínez, P.; Castro, J.; López, M.; Rivera, F.; Martínez, P.; Castro, J.; López, M. Massive volume fly-ash concrete: A more sustainable material with fly ash replacing cement and aggregates. Cem. Concr. Compos. 2015, 63, 104–112. [Google Scholar] [CrossRef] [Green Version]
- Bentz, D.P.; Ferraris, C.F.; Snyder, K.A. Best Practices Guide for High-Volume Fly Ash Concretes: Assuring Properties and Performance. Natl. Inst. Stand. Technol. Tech. Note 2013, 1812, 56. [Google Scholar] [CrossRef]
- Shmlls, M.; Bozsaky, D.; Horváth, T. Compressive, flexural and splitting strength of fly ash and silica fume concrete. Pollack Period. 2021, 17, 50–55. [Google Scholar] [CrossRef]
- Kaufman, J.J.; Woodhead, R. Stimulating Innovation in Products and Services: With Function Analysis and Mapping; John Wiley & Sons, Inc.: Hoboken, NJ, USA, 2006. [Google Scholar] [CrossRef]
- SAVE International. Value Standard and Body of Knowledge. June 2007. Available online: https://www.pinnacleresults.com/images/VE_Standard_from_SAVE.pdf (accessed on 7 October 2020).
- Brunelli, M. Introduction to the Analytic Hierarchy Process; Springer: Berlin/Heidelberg, Germany, 2014. [Google Scholar] [CrossRef] [Green Version]
- Siddique, R. Coal fly ash. In Waste Materials and By-Products in Concrete; Springer: Berlin/Heidelberg, Germany, 2008; pp. 117–234. [Google Scholar] [CrossRef]
- Rao, B.K.; Reddy, M.A.K.; Rao, A.V. Effect of flyash as cement replacement material and pore filling material in concrete. Mater. Today Proc. 2022, 52, 1775–1780. [Google Scholar] [CrossRef]
- Habert, G. Assessing the environmental impact of conventional and ‘green’ cement production. In Eco-Efficient Construction and Building Materials: Life Cycle Assessment (LCA), Eco-Labelling and Case Studies; Elsevier Inc.: Amsterdam, The Netherlands, 2013; pp. 199–238. [Google Scholar] [CrossRef]
- Han, S.-H.; Kim, J.-K.; Park, Y.-D. Estimation of compressive strength by a new apparent activation energy function. Cem. Concr. Res. 2001, 31, 217–225. [Google Scholar] [CrossRef]
- Hwang, K.; Noguchi, T.; Tomosawa, F. Prediction model of compressive strength development of fly-ash concrete. Cem. Concr. Res. 2004, 34, 2269–2276. [Google Scholar] [CrossRef]
- Lam, L.; Wong, Y.L.; Poon, C.S. Effict of fly ash and silica fume on compressive and fracture behaviors of concrete. Cem. Concr. Res. 1998, 28, 271–283. [Google Scholar] [CrossRef]
- Oner, A.; Akyuz, S.; Yildiz, R. An experimental study on strength development of concrete containing fly ash and optimum usage of fly ash in concrete. Cem. Concr. Res. 2005, 35, 1165–1171. [Google Scholar] [CrossRef]
- Ravina, D.; Mehta, P. Compressive strength of low cement/high fly ash concrete. Cem. Concr. Res. 1988, 18, 571–583. [Google Scholar] [CrossRef]
- Huang, C.-H.; Lin, S.-K.; Chang, C.-S.; Chen, H.-J. Mix proportions and mechanical properties of concrete containing very high-volume of Class F fly ash. Constr. Build. Mater. 2013, 46, 71–78. [Google Scholar] [CrossRef]
- Hannesson, G.M. Mechanical Properties of High-Volume SCM Concretes. Ph.D. Thesis, University of Washington, Washington, DC, USA, 2010. [Google Scholar]
- Wang, X.-Y.; Park, K.-B. Analysis of compressive strength development of concrete containing high volume fly ash. Constr. Build. Mater. 2015, 98, 810–819. [Google Scholar] [CrossRef]
- Susmitha, P.J.R.L.P.; Rao, M.K. Comparative study on strength and durability of concrete upon partial substitution of fly ash and bagasse ash in conventional concrete. IOP Conf. Ser. Earth Environ. Sci. 2022, 982, 012011. [Google Scholar] [CrossRef]
- Nath, P.; Sarker, P. Effect of Fly Ash on the Durability Properties of High Strength Concrete. Procedia Eng. 2011, 14, 1149–1156. [Google Scholar] [CrossRef] [Green Version]
- Haque, M.; Kayali, O. Properties of high-strength concrete using a fine fly ash. Cem. Concr. Res. 1998, 28, 1445–1452. [Google Scholar] [CrossRef]
- Saha, A.K. Effect of class F fly ash on the durability properties of concrete. Sustain. Environ. Res. 2018, 28, 25–31. [Google Scholar] [CrossRef]
- Wang, Z.-S. Influence of fly ash on the mechanical properties of frame concrete. Sustain. Cities Soc. 2011, 1, 164–169. [Google Scholar] [CrossRef]
- Durán-Herrera, A.; Juárez, C.; Valdez, P.; Bentz, D. Evaluation of sustainable high-volume fly ash concretes. Cem. Concr. Compos. 2011, 33, 39–45. [Google Scholar] [CrossRef]
- Poon, C.; Lam, L.; Wong, Y. A study on high strength concrete prepared with large volumes of low calcium fly ash. Cem. Concr. Res. 2000, 30, 447–455. [Google Scholar] [CrossRef]
- Quan, H.Z. Research on Durability of High Volume Fly Ash Concrete. Appl. Mech. Mater. 2012, 174–177, 380–383. [Google Scholar] [CrossRef]
- Chindaprasirt, P.; Chotithanorm, C.; Cao, H.; Sirivivatnanon, V. Influence of fly ash fineness on the chloride penetration of concrete. Constr. Build. Mater. 2007, 21, 356–361. [Google Scholar] [CrossRef]
- Sengul, O.; Tasdemir, C.; Tasdemir, M.A. Mechanical properties and rapid chloride permeability of concretes with ground fly ash. ACI Mater. J. 2005, 102, 414–421. [Google Scholar] [CrossRef]
- Çelik, Z.; Bingöl, A.F.; Ağsu, A.S. Fresh, mechanical, sorptivity and rapid chloride permeability properties of self-compacting concrete with silica fume and fly ash. Iran. J. Sci. Technol. Trans. Civ. Eng. 2022, 46, 789–799. [Google Scholar] [CrossRef]
- Atis, C. High-Volume Fly Ash Concrete with High Strength and Low Drying Shrinkage. J. Mater. Civ. Eng. 2003, 15, 153–156. [Google Scholar] [CrossRef]
- Kumar, B.; Tike, G.K.; Nanda, P.K. Evaluation of Properties of High-Volume Fly-Ash Concrete for Pavements. J. Mater. Civ. Eng. 2007, 19, 906–911. [Google Scholar] [CrossRef]
- Dhanya, B.S.; Santhanam, M. Performance evaluation of rapid chloride permeability test in concretes with supplementary cementitious materials. Mater. Struct. 2017, 50, 67. [Google Scholar] [CrossRef]
- Mohamed, O.; Al Hawat, W. Durability and Strength of Sustainable Self-Consolidating Concrete Containing Fly Ash. IOP Conf. Ser. Mater. Sci. Eng. 2018, 324, 012041. [Google Scholar] [CrossRef]
- Ali, B.; Yilmaz, E.; Tahir, A.R.; Gamaoun, F.; El Ouni, M.H.; Rizvi, S.M.M. The Durability of High-Strength Concrete Containing Waste Tire Steel Fiber and Coal Fly Ash. Adv. Mater. Sci. Eng. 2021, 2021, 7329685. [Google Scholar] [CrossRef]
- Sadrmomtazi, A.; Tahmouresi, B.; Khoshkbijari, R.K. Effect of fly ash and silica fume on transition zone, pore structure and permeability of concrete. Mag. Concr. Res. 2018, 70, 519–532. [Google Scholar] [CrossRef]
- Oh, B.H.; Cha, S.W.; Jang, B.S.; Jang, S.Y. Development of high-performance concrete having high resistance to chloride penetration. Nucl. Eng. Des. 2002, 212, 221–231. [Google Scholar] [CrossRef]
- Laskar, A.A.; Ghosh, P. Durability Assessment of Concrete by using Electrical Resistivity & Rapid Chloride Permeability Technique. Int. J. Eng. Adv. Technol. 2019, 9, 5175–5179. [Google Scholar] [CrossRef]
- Huang, K.-S.; Yang, C.-C. Using RCPT determine the migration coefficient to assess the durability of concrete. Constr. Build. Mater. 2018, 167, 822–830. [Google Scholar] [CrossRef]
- Kandil, U.; Erdogdu, S.; Kurbetci, S. Permeation properties of concretes incorporating fly ash and silica fume. Comput. Concr. 2017, 19, 357–363. [Google Scholar] [CrossRef]
- Şahmaran, M.; Keskin, S.B.; Ozerkan, G.; Yaman, I.O. Self-healing of mechanically-loaded self consolidating concretes with high volumes of fly ash. Cem. Concr. Compos. 2008, 30, 872–879. [Google Scholar] [CrossRef]
- Supit, S.W.M.; Shaikh, F.U.A. Durability properties of high volume fly ash concrete containing nano-silica. Mater. Struct. 2015, 48, 2431–2445. [Google Scholar] [CrossRef]
- Şahmaran, M.; Lachemi, M.; Erdem, T.; Yücel, H.E. Use of spent foundry sand and fly ash for the development of green self-consolidating concrete. Mater. Struct. 2011, 44, 1193–1204. [Google Scholar] [CrossRef] [Green Version]
- Pathak, N.; Siddique, R. Properties of self-compacting-concrete containing fly ash subjected to elevated temperatures. Constr. Build. Mater. 2012, 30, 274–280. [Google Scholar] [CrossRef]
- Shaikh, F.U.; Supit, S.W. Compressive strength and durability properties of high volume fly ash (HVFA) concretes containing ultrafine fly ash (UFFA). Constr. Build. Mater. 2015, 82, 192–205. [Google Scholar] [CrossRef]
- Haldive, S.A.; Kambekar, A.R. Experimental Study on Combined Effect of Fly Ash and Pond Ash on Strength and Durability of Concrete. Int. J. Sci. Eng. Res. 2013, 4, 81–86. [Google Scholar]
- Islam, M.; Islam, M. Strength and durability characteristics of concrete made with fly-ash blended cement. Aust. J. Struct. Eng. 2013, 14, 303–319. [Google Scholar] [CrossRef]
- Burden, D. The Durability of Concrete Containing High Levels of Fly Ash. Master’s Thesis, University of New Brunswick, Fredericton, NB, Canada, 2006. [Google Scholar]
- Thilgavathi, S.; Dhinakaran, G.; Venkataramana, J. Durability of Fly Ash Concrete to Chloride Ingress. IUP J. Struct. Eng. 2010, 3, 47–65. [Google Scholar]
- Ahari, R.S.; Erdem, T.K.; Ramyar, K. Permeability properties of self-consolidating concrete containing various supplementary cementitious materials. Constr. Build. Mater. 2015, 79, 326–336. [Google Scholar] [CrossRef]
- Madhavi, T.; Luther, S.M.; Velan, S.; Kumar, P.; Raju, S.; Mathur, D. Chloride penetration in fly ash concrete. Int. J. Res. Eng. Technol. 2014, 4, 134–140. [Google Scholar] [CrossRef]
- Güneyisi, E.; Gesoğlu, M.; Algın, Z.; Mermerdaş, K. Optimization of concrete mixture with hybrid blends of metakaolin and fly ash using response surface method. Compos. Part B Eng. 2014, 60, 707–715. [Google Scholar] [CrossRef]
- García, N.M.; Zapata, L.E.; Suarez, O.; Cabrera-Ríos, M. Effect of fly ash and nanosilica on compressive strength of concrete at early age. Adv. Appl. Ceram. 2015, 114, 99–106. [Google Scholar] [CrossRef]
- Zhang, W.B.; Yoshitake, I.; Saitoh, T. Proposal of a Simplified Prediction Formula for Compressive Strength of Fly Ash Concrete. Adv. Mater. Res. 2011, 287–290, 1201–1208. [Google Scholar] [CrossRef]
- Hela, R.; Ťažký, M. Development of Structural Concrete with Fly Ash. Adv. Mater. Res. 2014, 1054, 143–147. [Google Scholar] [CrossRef]
- Pati, S.L.; Kale, J.N.; Suman, S. Fly Ash Concrete: A Technical Analysis For compressive strength. Int. J. Adv. Eng. Res. Stud. 2012, 2, 128–129. [Google Scholar]
- Wang, X.-Y. Effect of fly ash on properties evolution of cement based materials. Constr. Build. Mater. 2014, 69, 32–40. [Google Scholar] [CrossRef]
- Han, Y.; Lin, R.-S.; Wang, X.-Y. Compressive Strength Estimation and CO2 Reduction Design of Fly Ash Composite Concrete. Buildings 2022, 12, 139. [Google Scholar] [CrossRef]
- Ahmaruzzaman, M. A review on the utilization of fly ash. Prog. Energy Combust. Sci. 2010, 36, 327–363. [Google Scholar] [CrossRef]
- Lindon, K.A.S.; Sear, A. Properties and Use of Coal Fly Ash: A Valuable Industrial By-Product; Tomas Telford: London, UK, 2001. [Google Scholar]
- Mehta, P.K. High-performance, high-volume fly ash concrete for sustainable development. In Proceedings of the International Workshop on Sustainable Development and Concrete Technology, Beijing, China, 20–21 May 2004; pp. 3–14. [Google Scholar]
- Shaikuthali, S.A.; Mannan, M.A.; Dawood, E.T.; Teo, D.C.L.; Ahmadi, R.; Ismail, I. Workability and compressive strength properties of normal weight concrete using high dosage of fly ash as cement replacement. J. Build. Pathol. Rehabil. 2019, 4, 26. [Google Scholar] [CrossRef]
- Case, R.J.; Duan, K.; Suntharavadivel, T.G. On Effects of Fly Ash as a Partial Replacement of Cement on Concrete Strength. Appl. Mech. Mater. 2012, 204–208, 3970–3973. [Google Scholar] [CrossRef]
- Mukesh, T.; Shobakiruthika, R.; Sowmini, S.; Subaash, M. Performance of Additive Blended High Volume Fly Ash Concrete—A Systematic Literature Study. Mater. Res. Proc. 2021, 19, 181–190. [Google Scholar] [CrossRef]
- Mu, E.; Pereyra-Rojas, M. Practical Decision Making an Introduction to the Analytic Hierarchy Process (AHP) Using Super Decisions v3: An Introduction to the Analytic Hierarchy Process; Springer: Berlin/Heidelberg, Germany, 2017. [Google Scholar] [CrossRef]
- Bentz, E.C.; Thomas, M.D.A. Life-365 Service Life Prediction Model and Computer Program for Predicting the Service Life and Life-Cycle Cost of Reinforced Concrete Exposed to Chlorides User Manual. Life-365TM Consortium III. pp. 1–87. Available online: http://www.life-365.org/download.html (accessed on 23 December 2022).


| FA Replacement (%) | W/B | Slump | Strength Gain (7/28 Days) | Comp. Strength (90 Days) | Durability (90 Days) | Ref. | Year |
|---|---|---|---|---|---|---|---|
| 0-10-20-30 | 0.27–0.60 | X | X | X | - | [46] | 2003 |
| 0-10-20-30 | 0.35–0.70 | X | X | X | - | [47] | 2004 |
| 0-15-25-45-55 | 0.30–0.50 | - | X | X | - | [48] | 1998 |
| 0-13-20-25-30-33-37 | 0.50–0.94 | X | - | - | - | [49] | 2005 |
| 0-35-42-50 | 0.47–0.77 | - | X | - | - | [50] | 1988 |
| 0-20-40-60-80 | 0.24–0.72 | X | X | X | - | [51] | 2013 |
| 0-20-40-60-80-100 | 0.35–0.40 | - | X | X | - | [52] | 2010 |
| 0-15-45-55 | 0.19–0.50 | - | X | X | - | [53] | 2015 |
| 0-5-10-15-20-2-30-35-40 | 0.40 | - | - | X | X | [54] | 2022 |
| 0-30-40 | 0.29–0.41 | X | X | X | - | [55] | 2011 |
| 0-10-15 | 0.25–0.38 | X | - | X | - | [56] | 1998 |
| 0-10-20-30-40 | 0.35 | - | X | X | - | [57] | 2018 |
| 05-10-15-20-25 | 0.30–0.42 | - | - | X | - | [58] | 2011 |
| 0-15-30-45-60-75 | 0.50–0.60 | X | X | - | - | [59] | 2011 |
| 0-40-60-80 | 0.42–0.89 | - | X | X | - | [38] | 2015 |
| 0-20-30-40-50-60 | 0.40–0.55 | X | X | X | - | [33] | 2019 |
| 0-25-45 | 0.19–0.24 | - | X | X | X | [60] | 2000 |
| 0-25-40 | 0.38–0.75 | X | X | X | - | [61] | 2012 |
| 0-30 | 0.21–0.54 | X | X | X | - | [62] | 2005 |
| 0-50 | 0.38–0.60 | X | - | X | X | [63] | 2005 |
| 0-15-30-45 | 0.35 | X | - | - | - | [64] | 2022 |
| 0-50-70 | 0.28–0.34 | - | X | X | - | [65] | 2003 |
| 0-20-30-40-50-60 | 0.30–0.40 | - | X | X | - | [66] | 2007 |
| 0-15-30-50 | 0.50 | - | - | - | X | [67] | 2017 |
| 0-10-20-25-30-40 | 0.36 | - | X | - | - | [68] | 2018 |
| 0-10-15-25-35 | 0.30–0.45 | - | - | X | X | [69] | 2021 |
| 0-10-20-30 | 0.45 | X | X | X | X | [70] | 2018 |
| 0-10-20 | 0.28–0.43 | X | - | - | - | [71] | 2002 |
| 0-10-15-20-25-30 | 0.40 | X | - | - | - | [72] | 2019 |
| 0-20-30 | 0.35–0.65 | - | - | - | X | [73] | 2018 |
| 0-10-20-30 | 0.50 | X | - | - | X | [74] | 2017 |
| 0-35-55 | 0.35 | X | - | - | - | [75] | 2008 |
| 0-40-60 | 0.40 | X | X | X | X | [76] | 2015 |
| 0-30-40-50 | 0.40 | X | - | X | X | [77] | 2012 |
| 0-40-60 | 0.40 | X | X | X | X | [78] | 2015 |
| 0-20-30-40 | 0.31–0.34 | - | - | - | - | [79] | 2013 |
| 0-10-20-30-40-50-60-70 | 0.43–0.50 | - | X | X | X | [80] | 2013 |
| 0-30-40-50 | 0.34–0.50 | - | X | - | X | [81] | 2006 |
| 0-10-20-30 | 0.32–0.50 | - | X | X | X | [82] | 2010 |
| 0-18-36 | 0.44 | - | X | X | X | [83] | 2015 |
| 0-30-40-50-60 | 0.36 | - | - | - | X | [84] | 2015 |
| 0-10-20 | 0.40 | - | X | X | X | [85] | 2014 |
| MIX | Strength (%) | Permeability (%) | Repl. (%) | Slump (%) | St. Gain (%) | |||||
|---|---|---|---|---|---|---|---|---|---|---|
| y = −1.1216x2 + 0.2464x + 0.0454 | y = −3.177x2 + 2.7402x + 0.0548 | y = x | y = 1.289x2 − 0.6013x + 0.0661 | y = −0.0818x2 − 0.2087x − 0.0286 | ||||||
| Change | Total | Change | Total | Change | Total | Change | Total | Change | Total | |
| Control | 0.00 | 100.00 | 0.00 | 100.00 | 0.00 | 0.00 | 0.00 | 100.00 | 0.00 | 100.00 |
| 5% FA | 5.49 | 105.49 | 18.39 | 118.39 | 5.00 | 5.00 | 3.93 | 103.93 | −3.92 | 96.08 |
| 10% FA | 5.88 | 105.88 | 29.71 | 129.71 | 10.00 | 10.00 | 1.89 | 101.89 | −5.03 | 94.97 |
| 15% FA | 5.71 | 105.71 | 39.43 | 139.43 | 15.00 | 15.00 | 0.49 | 100.49 | −6.17 | 93.83 |
| 20% FA | 4.98 | 104.98 | 47.58 | 147.58 | 20.00 | 20.00 | −0.26 | 99.74 | −7.36 | 92.64 |
| 25% FA | 3.69 | 103.69 | 54.13 | 154.13 | 25.00 | 25.00 | −0.37 | 99.63 | −8.59 | 91.41 |
| 30% FA | 1.84 | 101.84 | 59.09 | 159.09 | 30.00 | 30.00 | 0.17 | 100.17 | −9.86 | 90.14 |
| 35% FA | −0.58 | 99.42 | 62.47 | 162.47 | 35.00 | 35.00 | 1.35 | 101.35 | −11.17 | 88.83 |
| 40% FA | −3.55 | 96.45 | 64.26 | 164.26 | 40.00 | 40.00 | 3.18 | 103.18 | −12.52 | 87.48 |
| 45% FA | −7.08 | 92.92 | 64.45 | 164.45 | 45.00 | 45.00 | 5.65 | 105.65 | −13.91 | 86.09 |
| 50% FA | −11.18 | 88.82 | 63.07 | 163.07 | 50.00 | 50.00 | 8.77 | 108.77 | −15.34 | 84.66 |
| Criteria | Selection (%) | Criteria | ||||||||
|---|---|---|---|---|---|---|---|---|---|---|
| (A) | (1) | (2) | (3) | (4) | (5) | (6) | (7) | (8) | (9) | (B) |
| Comp. Strength | 14.0 | 21.5 | 19.4 | 5.4 | 22.6 | 5.4 | 4.3 | 4.3 | 3.2 | Permeability |
| Slump | 3.2 | 4.3 | 4.3 | 6.5 | 16.1 | 15.1 | 21.5 | 16.1 | 12.9 | Permeability |
| Replacement | 2.2 | 4.3 | 4.3 | 7.5 | 20.4 | 15.1 | 23.7 | 8.6 | 14.0 | Permeability |
| Strength gain | 2.2 | 6.5 | 5.4 | 6.5 | 12.9 | 12.9 | 24.7 | 10.8 | 18.3 | Permeability |
| Slump | 0.0 | 2.2 | 3.2 | 4.3 | 19.4 | 4.3 | 21.5 | 16.1 | 29.0 | Comp. strength |
| Replacement | 0.0 | 2.2 | 5.4 | 4.3 | 14.0 | 10.8 | 12.9 | 21.5 | 29.0 | Comp. strength |
| Strength gain | 1.1 | 2.2 | 3.2 | 5.4 | 19.4 | 8.6 | 16.1 | 15.1 | 29.0 | Comp. strength |
| Replacement | 9.7 | 7.5 | 17.2 | 16.1 | 24.7 | 8.6 | 6.5 | 4.3 | 5.4 | Slump |
| Strength gain | 4.3 | 5.4 | 9.7 | 7.5 | 24.7 | 5.4 | 23.7 | 12.9 | 6.5 | Slump |
| Strength gain | 3.2 | 7.5 | 7.5 | 12.9 | 21.5 | 7.5 | 12.9 | 15.1 | 11.8 | Replacement |
| Choice | Relative Importance | Difference | Choice Equivalent | |
|---|---|---|---|---|
| A | B | |||
| (1) | 100% | 0% | 100% | 1 A |
| (2) | 87.50% | 12.50% | 75% | 0.75 A |
| (3) | 75% | 25% | 50% | 0.5 A |
| (4) | 65.50% | 37.50% | 25% | 0.25 A |
| (5) | 50% | 50% | 0% | 0 |
| (6) | 37.50% | 62.50% | 25% | 0.25 B |
| (7) | 25% | 75% | 50% | 0.5 B |
| (8) | 12.50% | 87.50% | 75% | 0.75 B |
| (9) | 0% | 100% | 100% | 1 B |
| 0.630665 | 0.195271 | 0.074569 | 0.054343 | 0.045153 | |||
|---|---|---|---|---|---|---|---|
| Totals | Priorities | Comp. Strength | Permeability | Replacement. | Slump | Strength Gain | |
| Control | 0.078556 | 0.078555 | 0.090480 | 0.062346 | 0.000001 | 0.088900 | 0.099390 |
| 5% FA | 0.085320 | 0.085319 | 0.095450 | 0.073811 | 0.018460 | 0.092400 | 0.095490 |
| 10% FA | 0.088146 | 0.088145 | 0.095800 | 0.080869 | 0.036910 | 0.090580 | 0.094390 |
| 15% FA | 0.090349 | 0.090348 | 0.095650 | 0.086929 | 0.053450 | 0.089340 | 0.093260 |
| 20% FA | 0.092275 | 0.092274 | 0.094990 | 0.092010 | 0.072750 | 0.088670 | 0.092080 |
| 25% FA | 0.093630 | 0.093629 | 0.093820 | 0.096093 | 0.090940 | 0.088580 | 0.090850 |
| 30% FA | 0.094506 | 0.094505 | 0.092150 | 0.099186 | 0.109120 | 0.089060 | 0.089590 |
| 35% FA | 0.094890 | 0.094889 | 0.089960 | 0.101293 | 0.127310 | 0.090100 | 0.088290 |
| 40% FA | 0.094796 | 0.094795 | 0.087270 | 0.102409 | 0.145500 | 0.091730 | 0.086950 |
| 45% FA | 0.094221 | 0.094220 | 0.084080 | 0.102527 | 0.163690 | 0.093930 | 0.085570 |
| 50% FA | 0.093323 | 0.093322 | 0.080370 | 0.102527 | 0.181870 | 0.096700 | 0.084140 |
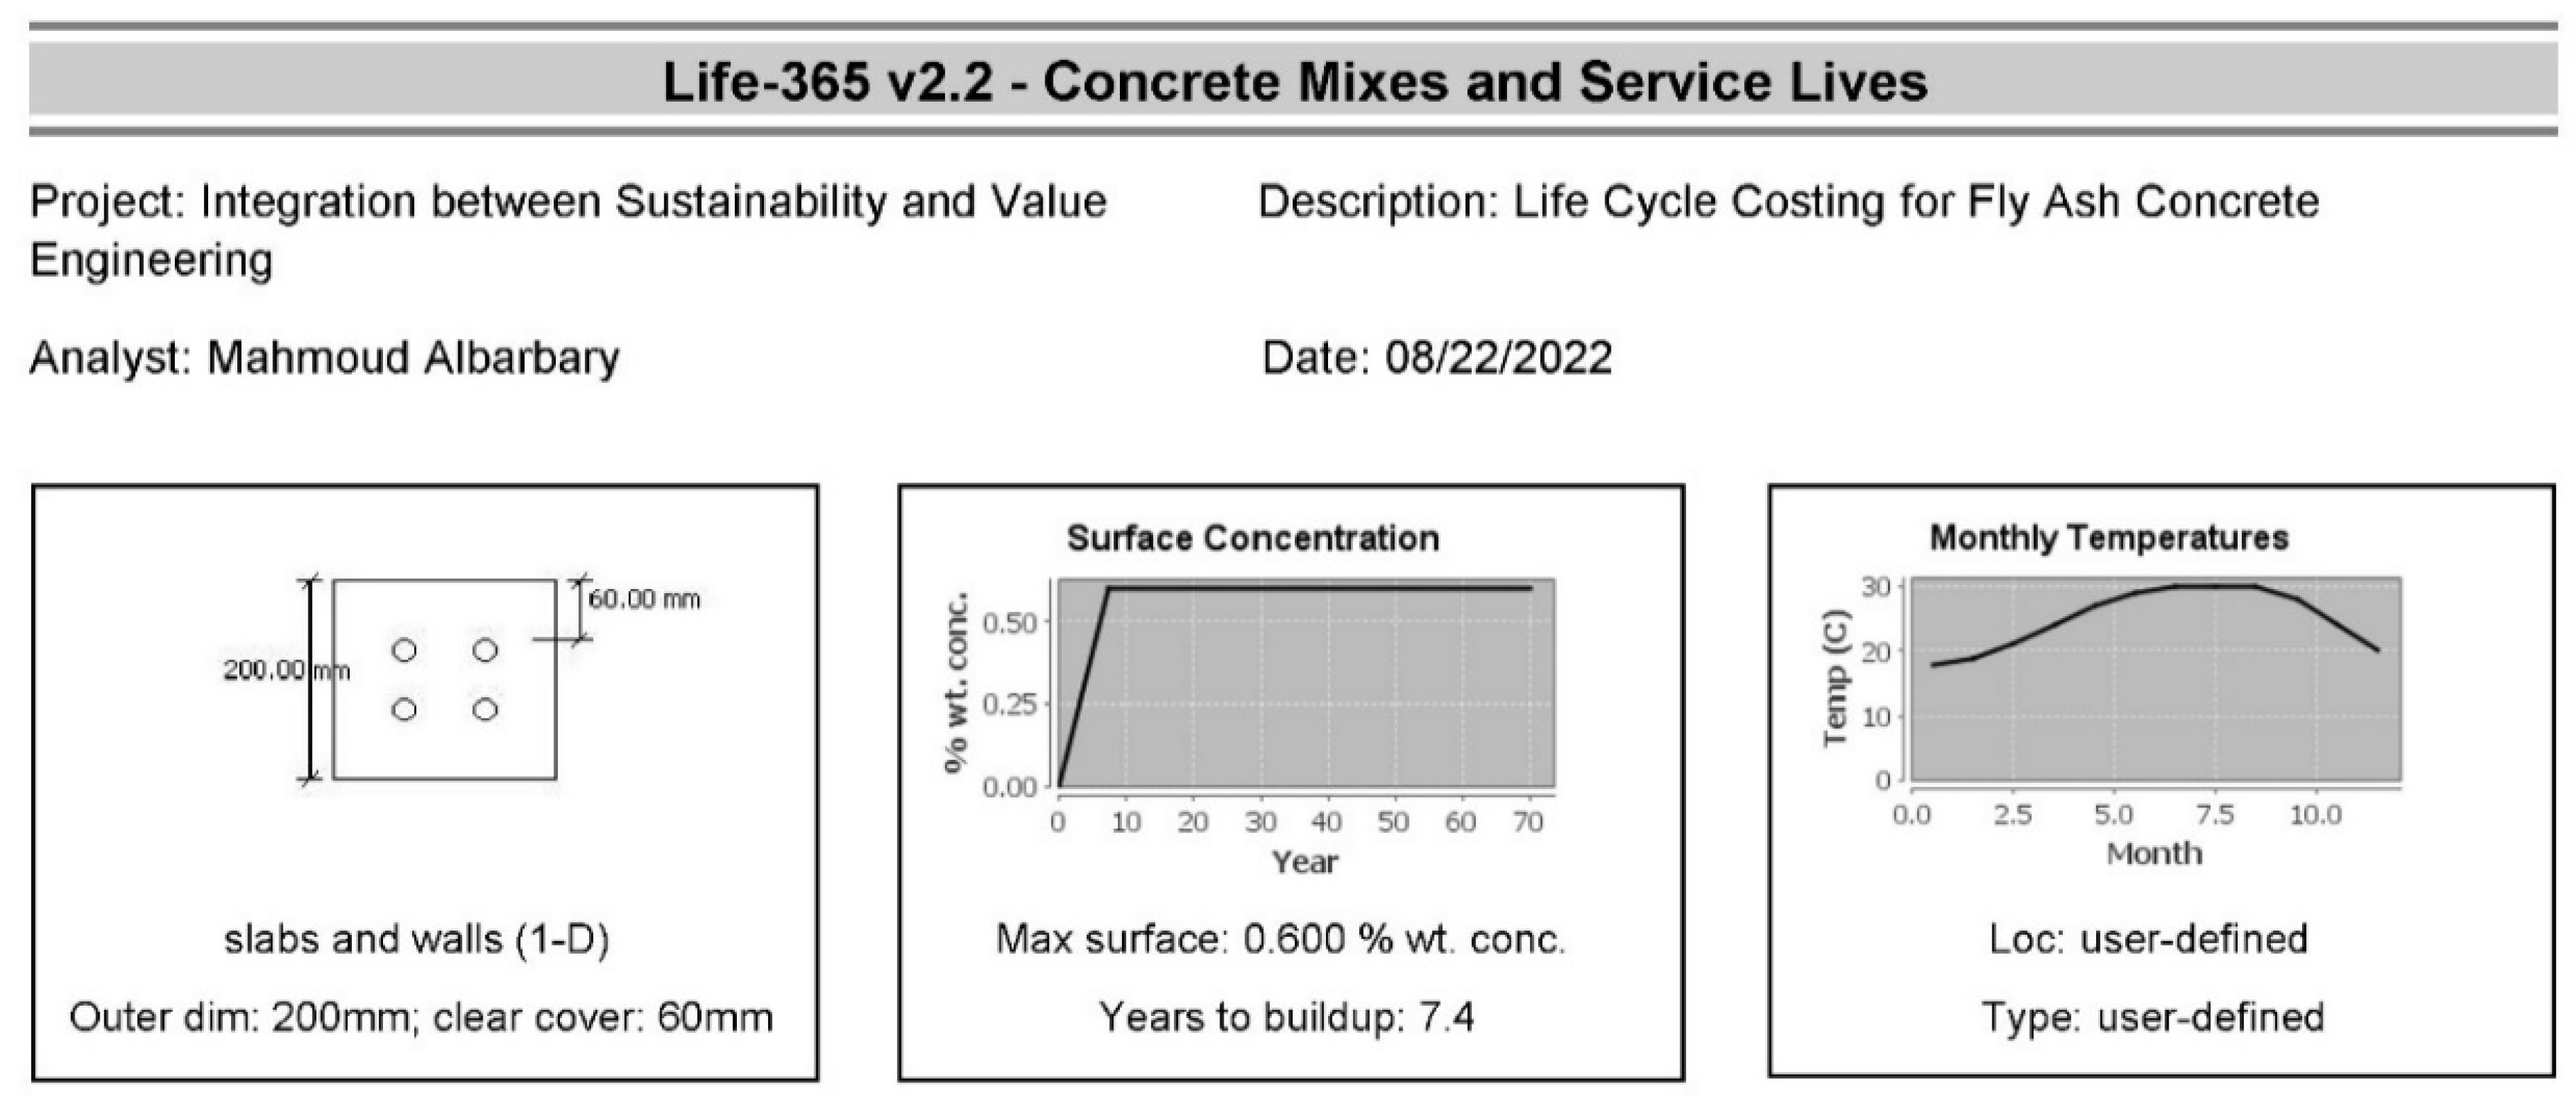
| Project Data | |||
|---|---|---|---|
| Name | Value | Name | Value |
| Date | 22 August 2022 | January Temp (°C) | 18.0 |
| Base Units | SI metric | February Temp (°C) | 19.0 |
| Concentration Units (% wt) | % wt. conc. | March Temp (°C) | 21.0 |
| Type of Structure | slabs and walls (1-D) | April Temp (°C) | 24.0 |
| True Depth (mm) | 200 | May Temp (°C) | 27.0 |
| Service Lile Depth (mm) | 200 | June Temp (°C) | 29.0 |
| Depth to Reinf. (mm) | 60 | July Temp (°C) | 30.0 |
| Third Dim (SQ.m.) | 5 | August Temp (°C) | 30.0 |
| Base Year | 2022 | September Temp (°C) | 30.0 |
| Study Period (years) | 70 | October Temp (°C) | 28.0 |
| Inflation Rate (%) | 13.639999999999999 | November Temp (°C) | 24.0 |
| Discount Rate (%) | 18.0 | December Temp (°C) | 20.0 |
| Location | <user defined> | Area to repair (%) | 10 |
| Sublocation | <user defined> | Repair cost ($/sq·m) | 190 |
| Exposure Type | <user defined> | Repair interval (yrs) | 5 |
| Max Surface Concentration | 0.6 | Base Mix Cost ($/cub·m) | 193.21 |
| Time o buildup (yrs) | 7.4 | ||
| Alternatives | |||||||||||
|---|---|---|---|---|---|---|---|---|---|---|---|
| Name | Control | 5% FA | 10% FA | 15% FA | 20% FA | 25% FA | 30% FA | 35% FA | 40% FA | 45% FA | 50% FA |
| All Description | A project that uses normal mix | A project that uses normal mix | a new description | a new description | a new description | a new description | A project that uses normal mix | a new description | a new description | a new description | a new description |
| Concrete Mix name | Control | 5% FA | 10% FA | 15% FA | 20% FA | 25% FA | 30% FA | 35% FA | 40% FA | 45% FA | 50% FA |
| w/cm | 0.42 | 0.42 | 0.42 | 0.42 | 0.42 | 0.42 | 0.42 | 0.42 | 0.42 | 0.42 | 0.42 |
| Slag (%) | 0.0 | 0.0 | 0.0 | 0.0 | 0.0 | 0.0 | 0.0 | 0.0 | 0.0 | 0.0 | 0.0 |
| Fly Ash (%) | 0.0 | 5.0 | 10.0 | 15.0 | 20.0 | 25.0 | 30.0 | 35.0 | 40.0 | 45.0 | 50.0 |
| Silica Fume (%) | 0.0 | 0.0 | 0.0 | 0.0 | 0.0 | 0.0 | 0.0 | 0.0 | 0.0 | 0.0 | 0.0 |
| Steel type | Black Steel | Black Steel | Black Steel | Black Steel | Black Steel | Black Steel | Black Steel | Black Steel | Black Steel | Black Steel | Black Steel |
| Steel % | 1.2 | 1.2 | 1.2 | 1.2 | 1.2 | 1.2 | 1.2 | 1.2 | 1.2 | 1.2 | 1.2 |
| Propagation (yrs) | 6 | 6 | 6 | 6 | 6 | 6 | 6 | 6 | 6 | 6 | 6 |
| Inhibitor | <none> | <none> | <none> | <none> | <none> | <none> | <none> | <none> | <none> | <none> | <none> |
| Barrier | <none> | <none> | <none> | <none> | <none> | <none> | <none> | <none> | <none> | <none> | <none> |
| D28 (m’misec) | 8.8716 × 10⁻¹² | 8.8716 × 10⁻¹² | 8.8716 × 10⁻¹² | 8.8716 × 10⁻¹² | 8.87 × 10⁻¹² | 8.87 × 10⁻¹² | 8.8716 × 10⁻¹² | 8.8716 × 10⁻¹² | 8.87 × 10⁻¹² | 8.87 × 10⁻¹² | 8.8716 × 10⁻¹² |
| m | 0.2 | 0.24 | 0.28 | 0.32 | 0.36 | 0.4 | 0.44 | 0.48 | 0.52 | 0.56 | 0.6 |
| Initiation(yrs) | 7.2 | 7.9 | 8.9 | 10.1 | 11.6 | 13.6 | 16.2 | 19.8 | 24.8 | 31.8 | 40.9 |
| Propagation (yrs) | 6.0 | 6.0 | 6.0 | 6.0 | 6.0 | 6.0 | 6.0 | 6.0 | 6.0 | 6.0 | 6.0 |
| Service Life (yrs) | 13.2 | 13.9 | 14.9 | 16.1 | 17.6 | 19.6 | 22.2 | 25.8 | 30.8 | 37.8 | 46.9 |
| Use user mix cost | false | true | true | true | true | true | true | true | true | true | true |
| User Mix Cost. | 193.211 | 197.04 | 200.89 | 204.73 | 208.56 | 212.0 | 216.0 | 220.0 | 223.0 | 227.0 | 231.0 |
| Repair interval | 5 | 5 | 5 | 5 | 5 | 5 | 5 | 5 | 5 | 5 | 5 |
| Base Cost ($) | $193 | $197 | $201 | $205 | $209 | $212 | $216 | $220 | $223 | $227 | $231 |
| Barrier Cost ($) | $0 | $0 | $0 | $0 | 0% | 0% | 0% | 0% | 0% | 0% | 0% |
| Repair Cost ($) | $304 | $304 | $293 | $265 | $255 | $237 | $205 | $176 | $139 | $101 | $60 |
| Life-Cycle Cost ($) | $497 | $501 | $494 | $470 | $464 | 449 | $421 | $396 | $362 | $328 | $291 |
| Life-Cycle Costs | ||||
|---|---|---|---|---|
| Name | Construction Cost | Barrier Cost | Repair Cost | Life-Cycle Cost |
| Control | $193 | $0 | $304 | $497 |
| 5% FA | $197 | $0 | $304 | $501 |
| 10% FA | $201 | $0 | $293 | $494 |
| 15% FA | $205 | $0 | $265 | $470 |
| 20% FA | $209 | $0 | $255 | $464 |
| 25% FA | $212 | $0 | $237 | $449 |
| 30% FA | $216 | $0 | $205 | $421 |
| 35% FA | $220 | $0 | $176 | $396 |
| 40% FA | $223 | $0 | $139 | $362 |
| 45% FA | $227 | $0 | $101 | $328 |
| 50% FA | $231 | $0 | $60 | $291 |
| Alternatives | According to the AHP Results | According to the Construction Cost | According to the Life Cycle Cost | ||||||||
|---|---|---|---|---|---|---|---|---|---|---|---|
| AHP Results | Change in AHP Results (%) | Rank | Cost (CC) | Value (V.CC) | Change in Value (%) | Rank | Cost (LCC) | Value (V.LCC) | Change in Value (%) | Rank | |
| Control | 0.828 | 0.00% | 11 | 193 | 0.004 | 0.00% | 11 | 497 | 0.002 | 0.00% | 11 |
| 5% FA | 0.899 | 8.57% | 10 | 194 | 0.005 | 8.02% | 9 | 501 | 0.002 | 7.71% | 10 |
| 10% FA | 0.929 | 12.20% | 9 | 201 | 0.005 | 7.73% | 7 | 494 | 0.002 | 12.88% | 9 |
| 15% FA | 0.952 | 14.98% | 8 | 205 | 0.005 | 8.25% | 5 | 470 | 0.002 | 21.58% | 8 |
| 20% FA | 0.972 | 17.39% | 7 | 209 | 0.005 | 8.40% | 3 | 464 | 0.002 | 25.74% | 7 |
| 25% FA | 0.987 | 19.20% | 5 | 212 | 0.005 | 8.52% | 1 | 449 | 0.002 | 31.95% | 6 |
| 30% FA | 0.996 | 20.29% | 3 | 216 | 0.005 | 7.48% | 2 | 421 | 0.002 | 42.00% | 5 |
| 35% FA | 1 | 20.77% | 1 | 220 | 0.005 | 5.95% | 4 | 396 | 0.003 | 51.58% | 4 |
| 40% FA | 0.999 | 20.65% | 2 | 223 | 0.005 | 4.42% | 6 | 362 | 0.003 | 65.65% | 3 |
| 45% FA | 0.993 | 19.93% | 4 | 227 | 0.004 | 1.96% | 8 | 328 | 0.003 | 81.72% | 2 |
| 50% FA | 0.983 | 18.72% | 6 | 231 | 0.004 | -0.81% | 10 | 291 | 0.003 | 102.76% | 1 |
Disclaimer/Publisher’s Note: The statements, opinions and data contained in all publications are solely those of the individual author(s) and contributor(s) and not of MDPI and/or the editor(s). MDPI and/or the editor(s) disclaim responsibility for any injury to people or property resulting from any ideas, methods, instructions or products referred to in the content. |
© 2023 by the authors. Licensee MDPI, Basel, Switzerland. This article is an open access article distributed under the terms and conditions of the Creative Commons Attribution (CC BY) license (https://creativecommons.org/licenses/by/4.0/).
Share and Cite
Albarbary, M.M.; Tahwia, A.M.; Elmasoudi, I. Integration between Sustainability and Value Engineering in the Production of Eco-Friendly Concrete. Sustainability 2023, 15, 3565. https://doi.org/10.3390/su15043565
Albarbary MM, Tahwia AM, Elmasoudi I. Integration between Sustainability and Value Engineering in the Production of Eco-Friendly Concrete. Sustainability. 2023; 15(4):3565. https://doi.org/10.3390/su15043565
Chicago/Turabian StyleAlbarbary, Mahmoud M., Ahmed M. Tahwia, and Islam Elmasoudi. 2023. "Integration between Sustainability and Value Engineering in the Production of Eco-Friendly Concrete" Sustainability 15, no. 4: 3565. https://doi.org/10.3390/su15043565