
Holistic Framework to Data-Driven Sustainability Assessment

 , ,
, ,  ,
,  , , and
Abstract
:1. Introduction
2. Literature Review on Sustainability Assessments
2.1. Need for Sustainability Assessment
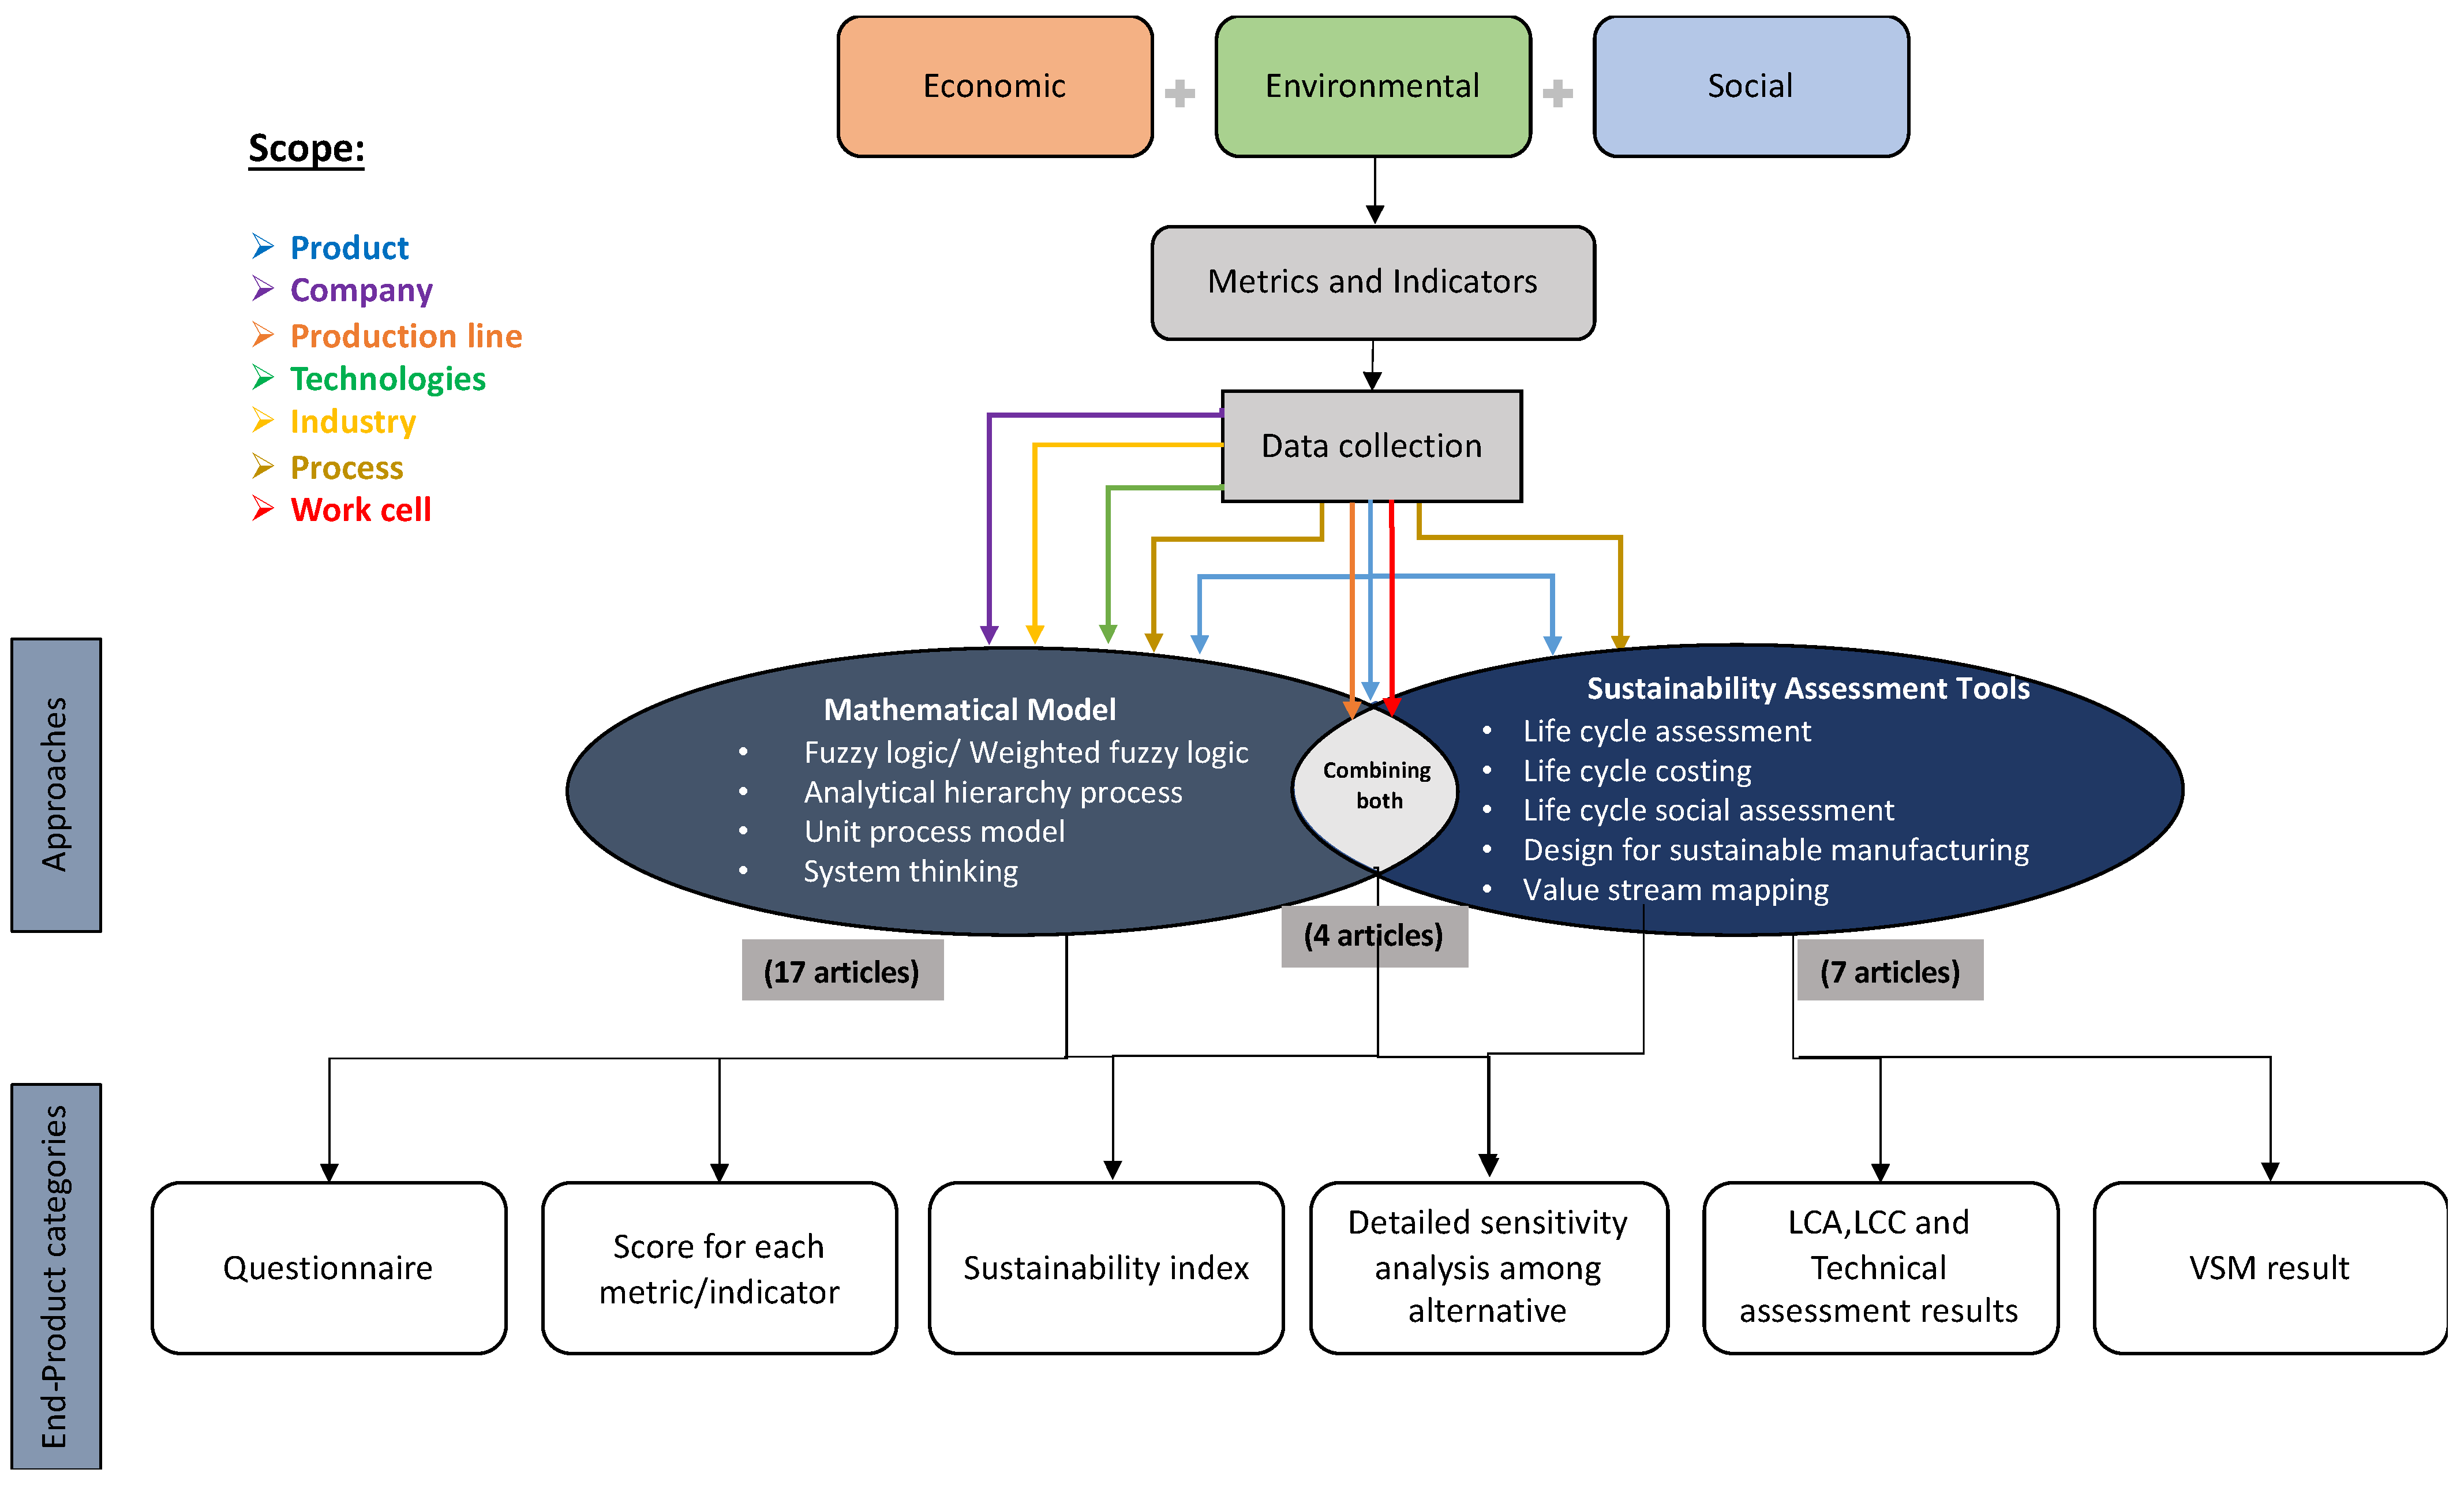
2.2. Sustainability Assessment Approaches

| Nº | Scope | Methodology | Indicators and Metrics | Outcome | Refs |
|---|---|---|---|---|---|
| 1 | Company | Based on fuzzy logic and specialists | Five metrics are considered for the environmental dimension, three for the social dimension and four for the economic dimension, covering all three dimensions of sustainability. | Sustainability assessment questionnaire | [9] |
| 2 | Product | Weighted Fuzzy Logic (WFAM) | The indicators cover the three dimensions of sustainability and are divided into a hierarchical structure of 4 levels: level 0—overall index; level 1—elements (Ex environmental); level 2—sub-elements (Ex greenhouse effect); level 4—influencing factors (e.g., carbon dioxide emissions). | Table with scores for each level of indicators except for influence factors | [13] |
| 3 | Company | Fuzzy multiple criteria methodology | Thirteen sustainability metrics are used, divided by the environmental (4), social (4) and economic (5) dimensions. | Final sustainability score | [4] |
| 4 | Process | Multi-criteria approach based on AHP | The environmental social, economic and technical dimensions of sustainability are considered. Twelve environmental metrics are used; however, it is not clear which metrics are used for the remaining dimensions. | Sustainability performance table with values for each step and scores | [14] |
| 5 | Company | Holistic sustainability index based on the AHP method | In total, 14 social indicators, 10 economic indicators, 13 environmental indicators and 7 production indicators are used to characterize the sustainability of an industry. These indicators characterize sub-indices that in turn determine an overall index. | Scoring of the sub-indices and the global sustainability index, allowing comparison between companies | [6] |
| 6 | Product | Based on LCA and LCC tools and metrics for assessing technical and social | There is no evidence of great comprehensiveness in the sustainability metrics. Seven indicators were chosen, divided into the technical (1), environmental (2), social (2) and economic (2). | Comparison between metrics from LCA, LCC, the social assessment and the technical assessment | [22] |
| 7 | Product | Combining the AHP method with LCSA | The environmental component includes 12 indicators, mostly quantitative, 5 social indicators and 1 economic indicator. They are hierarchical, corresponding to the building’s overall sustainability. | Comparative table of total sustainability indexes | [23] |
| 8 | Company | Indicator-based rapid assessment tool | The authors refer to the use of 133 indicators divided into 7 management areas, without specifying them. | Sustainability assessment questionnaire | [11] |
| 9 | Work cell | Based on the combination of AHP and MCDM with LCA, SLCA, and cost analysis | We use 17 environmental impact metrics obtained through ReCiPe, 3 social impact metrics and the total cost for the economic aspect. | Table with a ranking for production alternatives, with a sensitivity analysis being carried out | [24] |
| 10 | Product | Based on LCA, LCC and injury risk analysis tools | Six environmental metrics and one economic (cost) metric were chosen. | Comparison between the results of the sustainability analysis for differentproductions | [12] |
| 11 | Product | Based on metrics organized hierarchically with an indexglobal (ProdSI) | The metrics are divided by a 5-level hierarchical structure: an overall aggregate index (ProdSI), 3 sub-indices (environmental social and economic), 13 clusters (Exo waste and emissions), 45 sub-clusters (Exo gaseous emissions) and 45 individual metrics (Exo greenhouse gases). | Comparing metrics for two generations of products through bar charts and spider graphs | [15] |
| 12 | Process | Based on metrics organized hierarchically with an indexglobal | The metrics are divided by a 5-level hierarchical structure: an overall aggregate index, named ProcSI, 6 clusters (Exo environmental impact), 25 sub-clusters (Exo water) and 89 individual metrics (Exo total water consumption). | Summary table for comparison between metrics for various machine operating parameters | [18] |
| 13 | Company | Based on metrics organised hierarchically with an indexglobal | The metrics are divided by a 5-level hierarchical structure: one overall aggregate index, 3 sub-indices (environmental social and economic), 9 clusters (Exo net profit), 22 sub-clusters (e.g., profit from operations) and 49 individual metrics (e.g., material costs). | Comparison of metrics obtained in certain years of activity | [25] |
| 14 | Production line | Value Stream Mapping with sustainability indicators, named Sus-VSM | For the environmental dimension, 3 metrics related to water, materials and energy consumption are considered. The consumption of materials is related to the economic component. For the social dimension, we consider metrics related to physical work and the dangers existing in the working environment. | VSM with the addition of water, material and energy consumption indicators and social indicators (risk) | [26] |
| 15 | Production line | Value Stream Mapping with indicators of sustainability | In total, 4 environmental metrics, 4 economic metrics and 4 social metrics are considered to assess sustainability. | VSM with the addition of environmental, economic and social metrics | [17] |
| 16 | Process | Unit Process Model with supporting software | Eight metrics were selected to assess environmental, social and economic aspects of sustainability. | Supporting IT tool with metrics results table and a radar chart | [12,19] |
| 17 | Process | Unit Process Model | In total, 1 economic performance metric, 7 environmental performance metrics and 3 social performance metrics were selected. | Table with metric results for 3 design alternatives of a component | [10] |
| 18 | Process | Fuzzy logic combined with the AHP method | The indicators cover the three dimensions of sustainability and are divided into a hierarchical structure of 4 levels: level 0—overall index; level 1—elements (Ex environmental); level 2—sub-elements (Ex emissions); level 4—influencing factors (e.g., carbon dioxide). | Table of environmental, social, economic and total sustainability scores for 4process alternatives | [27] |
| 19 | Product | Combining the AHP method with LCSA | The authors do not clearly express the indicators relevant to the study. | Table with ranking among waste disposal alternatives | [16] |
| 20 | Product | Based on LCSA (LCA, SLCA, LCC) | In total, 18 environmental impact metrics obtained through ReCiPe are used. Consumer and manufacturer costs are considered. Social impacts are analyzed qualitatively through 9 indicators. | Comparison of metrics obtained from assessment tools | [28] |
| 21 | Product | Integrated modelling and simulation | In total, 7 environmental metrics, 7 economic metrics and 6 social metrics are considered. | Results of sustainability assessment and simulation | [29] |
| 22 | Industry | System Thinking | In total, 25 environmental metrics, 20 economic metrics and 15 social metrics are considered. | Sustainability index | [30] |
| 23 | Company | System dynamics | In total, 11 environmental metrics, 10 economic metrics and 9 social metrics are considered. | Complete stock and flow model and metrics | [31] |
| 24 | Company | Design for sustainable manufacturing enterprise | Metrics covering several global aspects are used, but the use of environmental and social metrics is not clear. | Sustainability index | [7] |
| 25 | Company | Graph theory-based modelling | It considers 5 business metrics, 6 environmental metrics, 4 economic metrics and 5 social metrics. | Scorecards for best and worst cases | [32] |
| 26 | Product | Based on LCSA | As this is a general approach, environmental and economic sustainability metrics are not indicated. However, social indicators are provided. | Sustainability indices | [33] |
| 27 | Technologies | Based on the extended LCA | As this is a general approach, no sustainability metrics are indicated. | Impact display | [34] |
| 28 | Process | LCSA-based method | In total, 6 metrics relating to technology, 13 environmental metrics, 13 economic metrics and 5 social metrics are used. | Metrics for each alternative with colors representing the range to the benchmark | [35] |
2.2.1. Definition of Goal/Scope
2.2.2. Indicators
2.2.3. Subjective/Objective Data
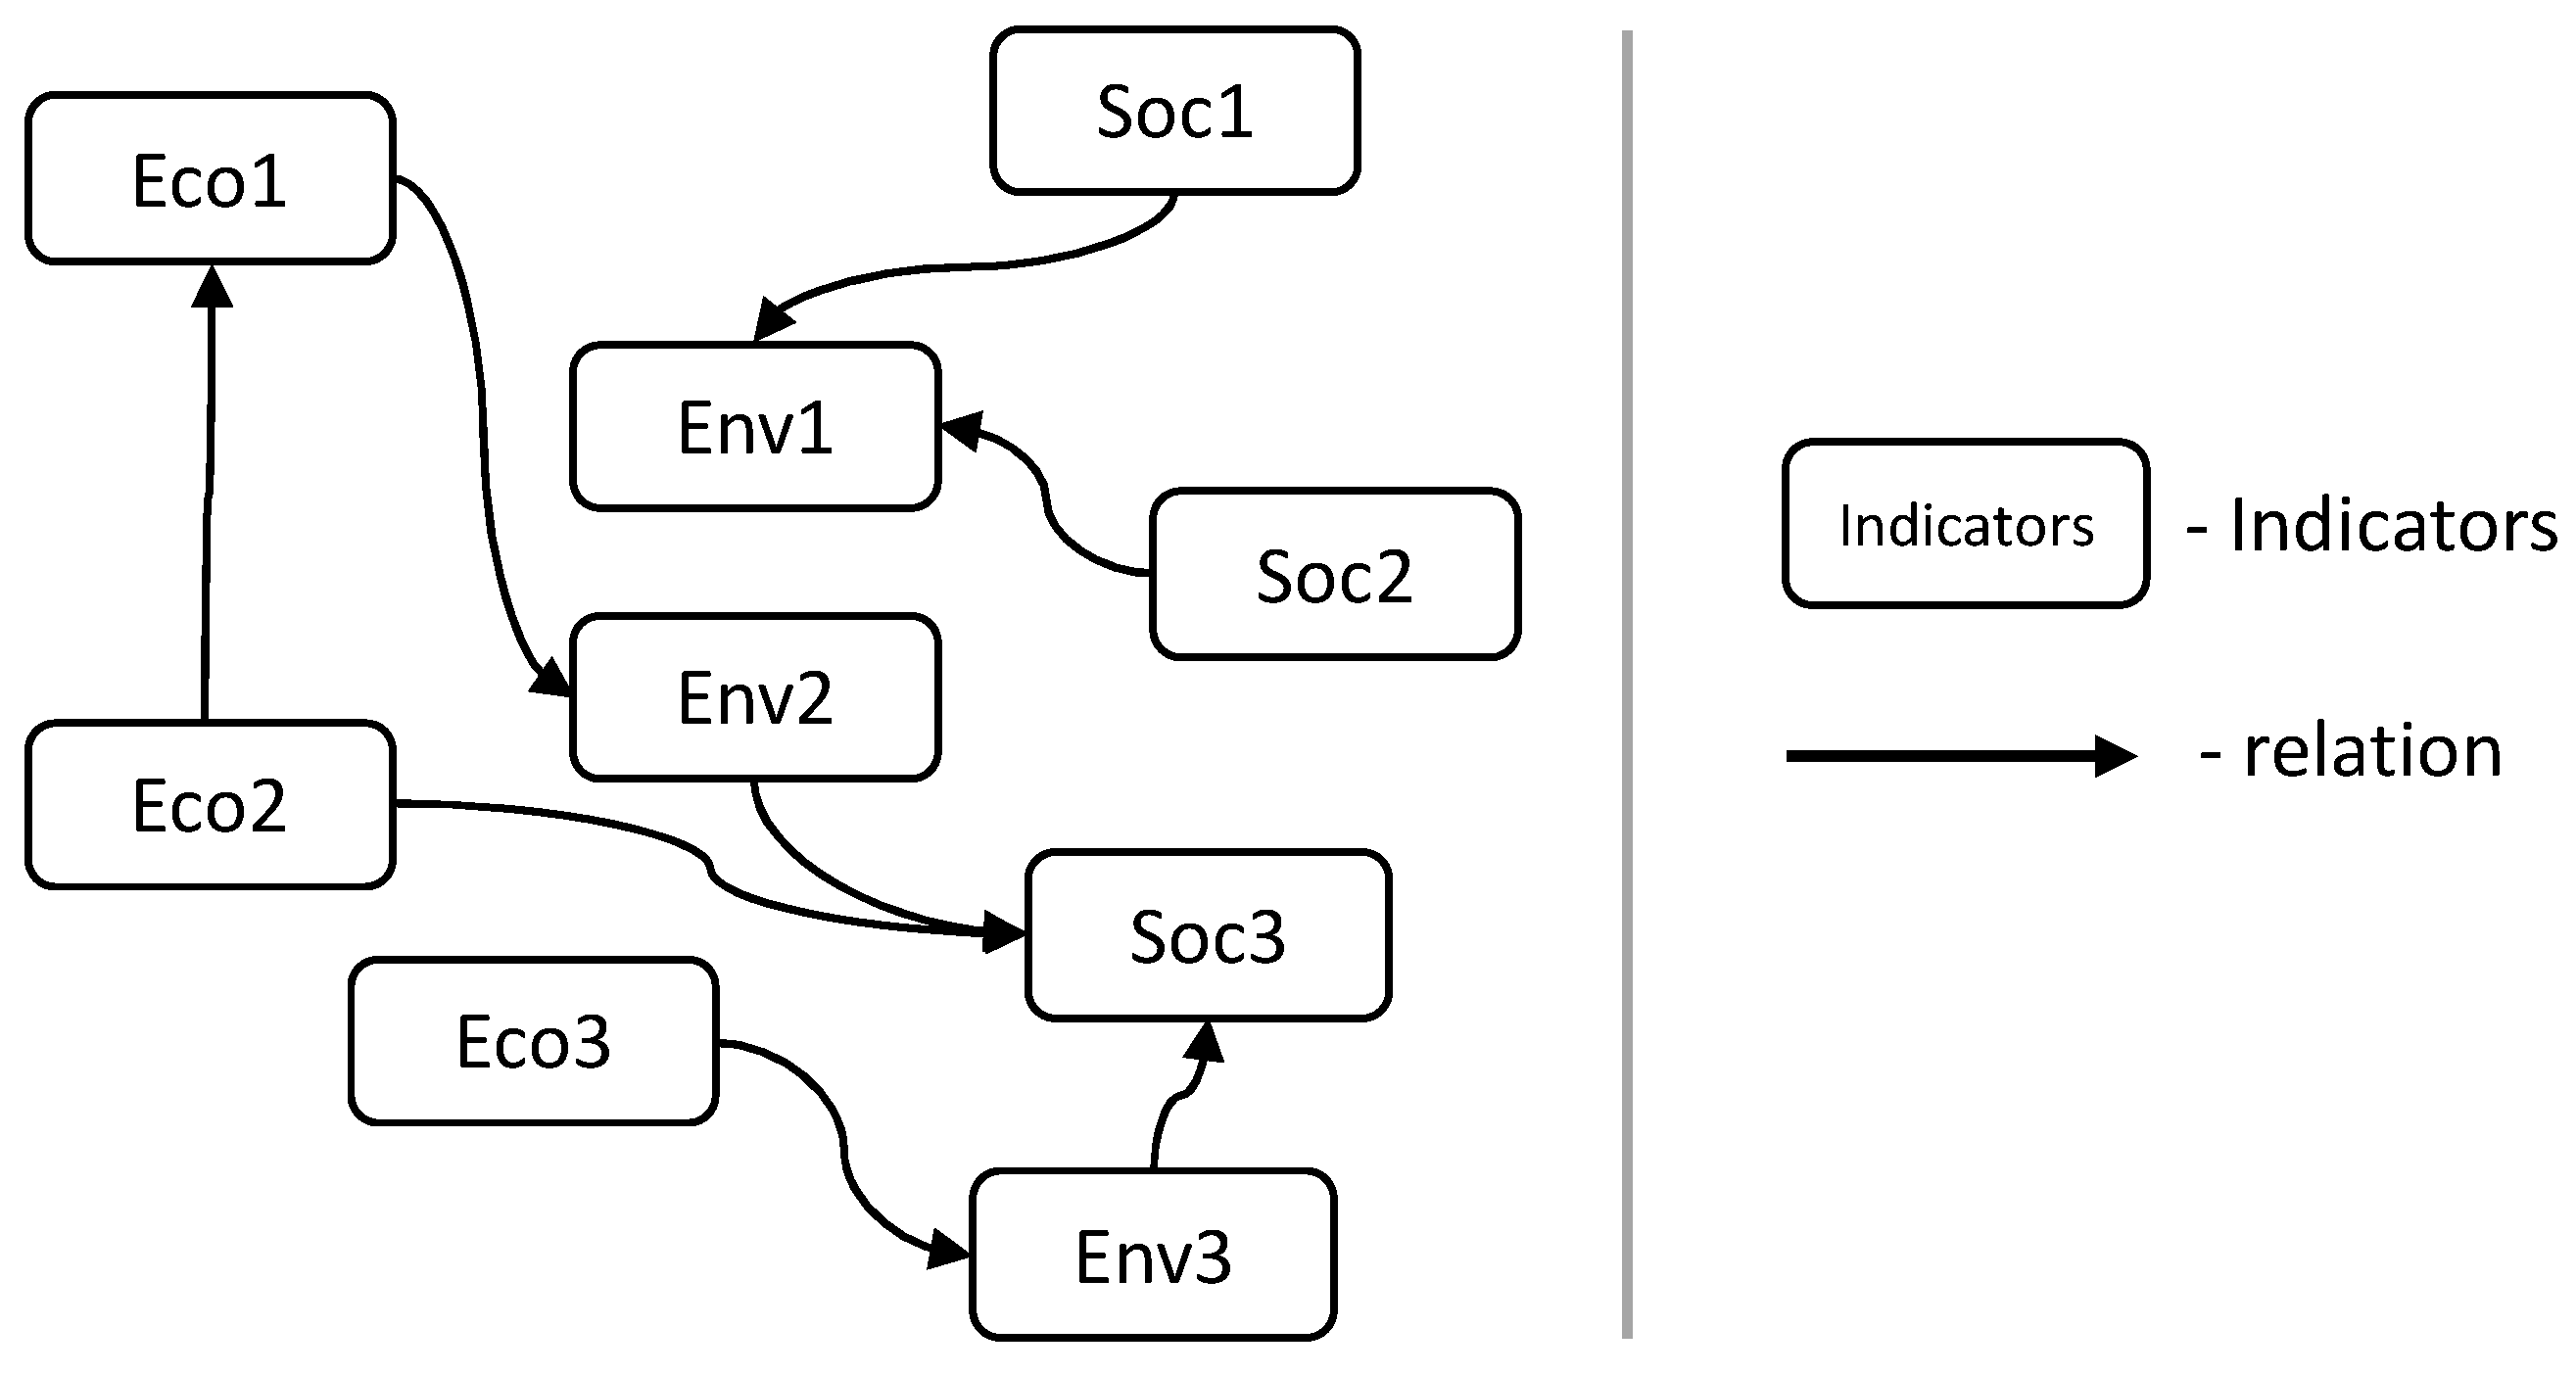
2.2.4. Relation between Indicators
2.2.5. Assigning Weightage for Indicators
2.3. Data in sustainability Assessment
2.4. Indicators in Sustainability Assessment
2.5. Tools in Sustainability Assessment
3. Framework
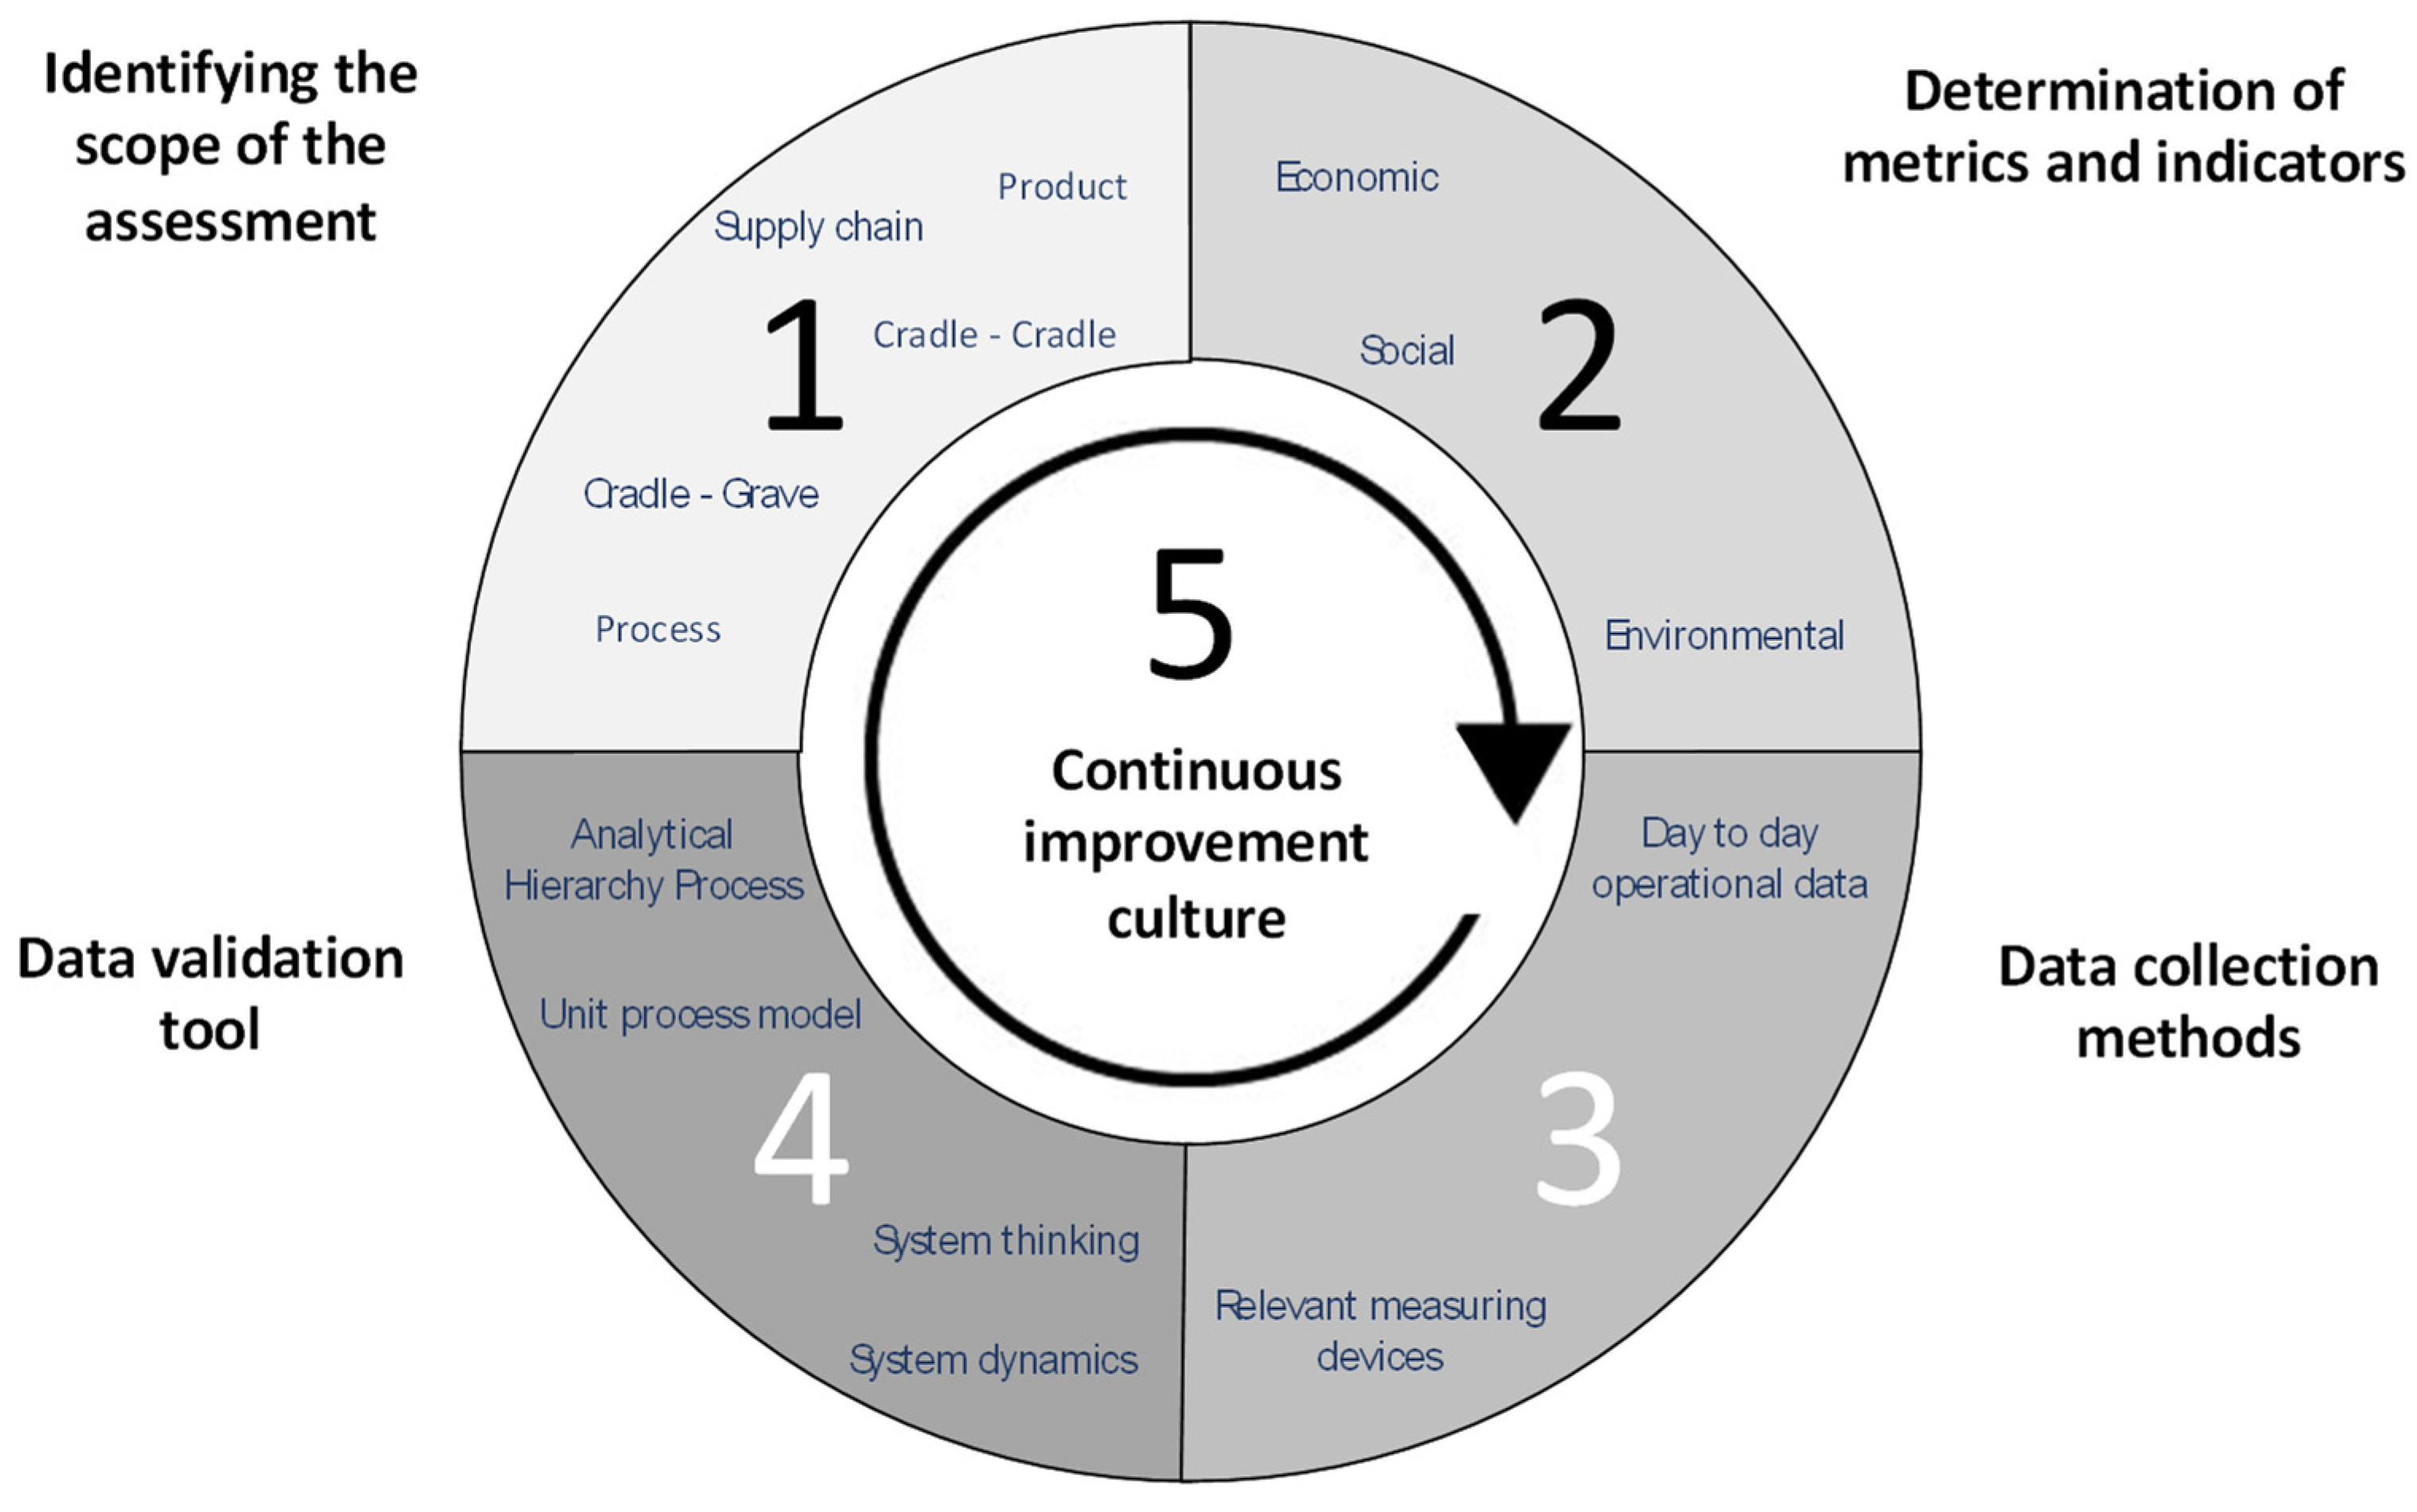
- Step 1.
- Identifying the scope of the assessment
- Step 2.
- Determination of metrics and indicators
- Step 3.
- Data collection methods
- Step 4.
- Data validation
- Step 5.
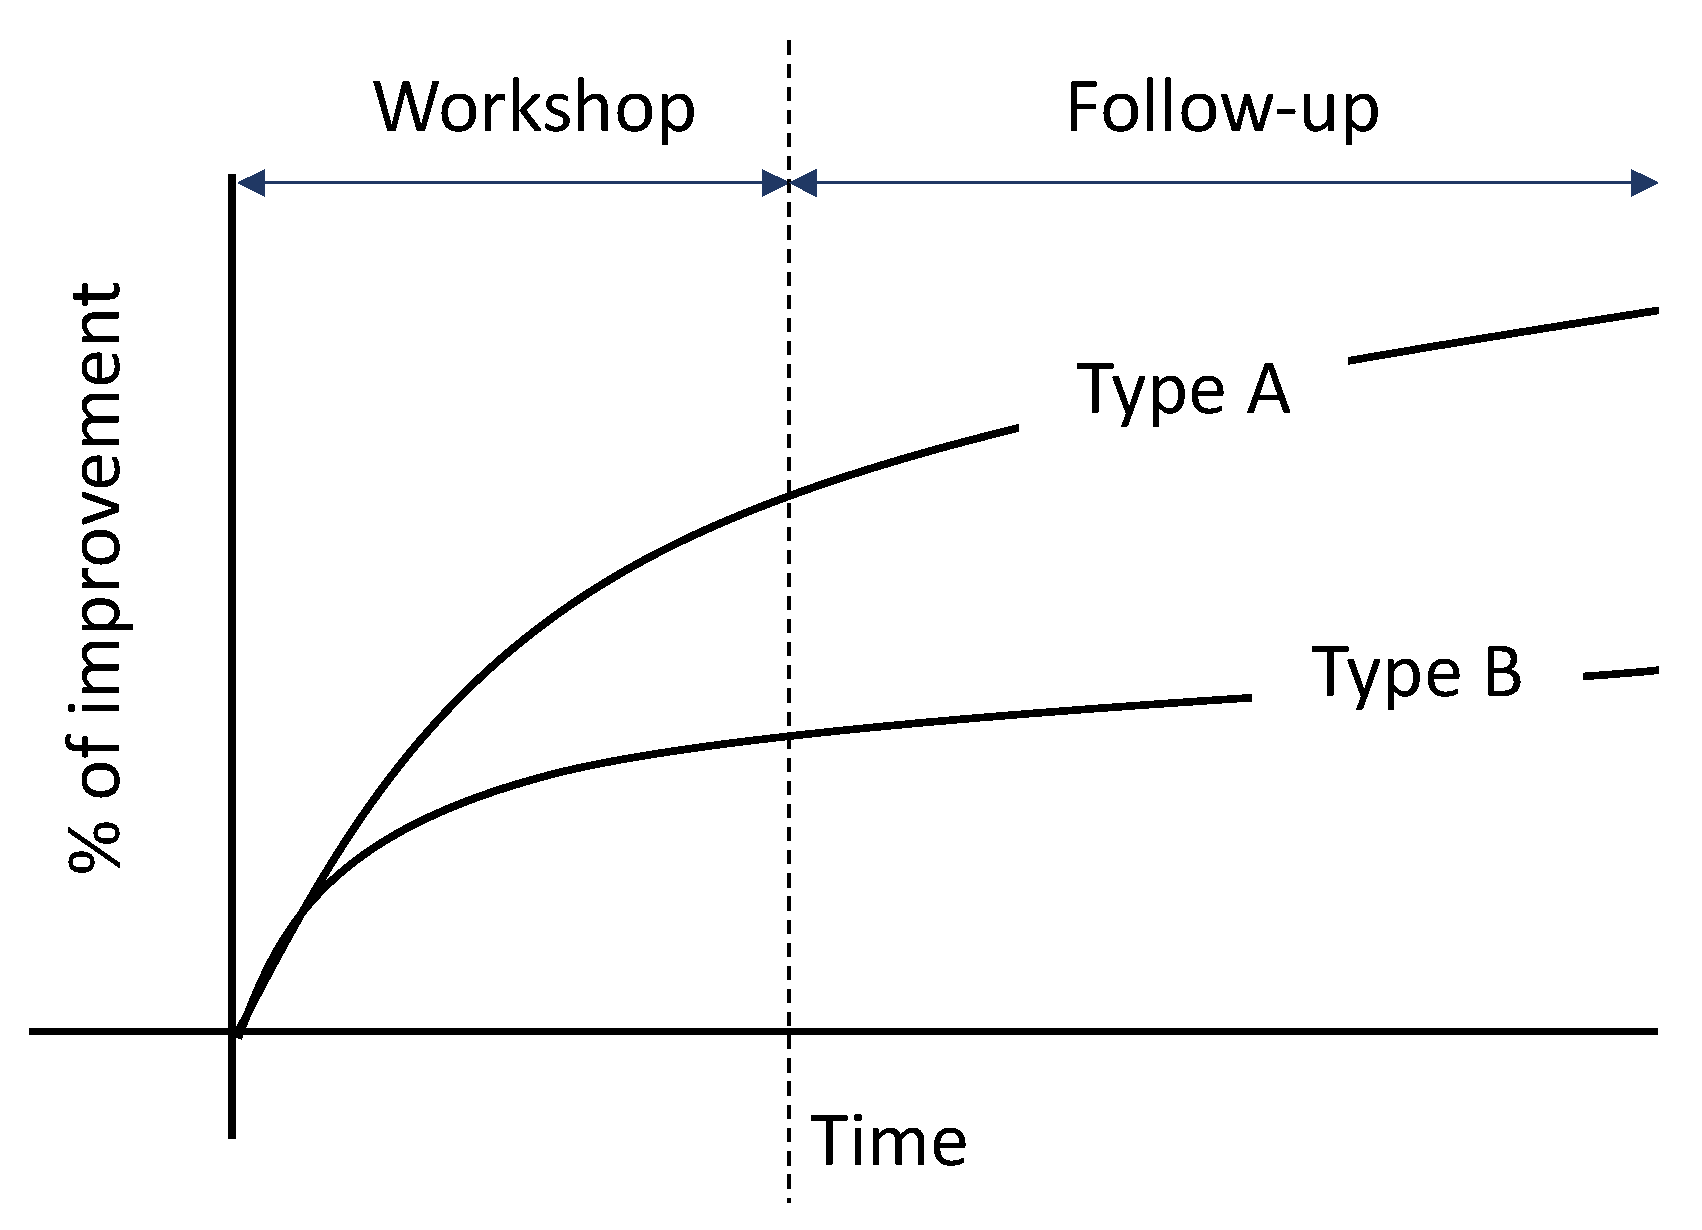
- Continuous Improvement
4. Discussion and Conclusions
Author Contributions
Funding
Institutional Review Board Statement
Informed Consent Statement
Data Availability Statement
Conflicts of Interest
Abbreviations
| AHP | Analytic Hierarchy Process |
| KPI | Key Performance Indicator |
| LCA | Life Cycle Assessment |
| LCSA | Life Cycle Sustainability Assessment |
| LCC | Life Cycle Cost |
| MCDM | Multi-Criteria Decision-Making |
| MSM | Multi-Layer Stream Mapping |
| NVA | Non Added Value |
| NPV | Net-Present Value |
| ProdSI | Product Sustainability Index |
| VA | Added Value |
| S-LCA | Social Life Cycle Assessment |
| TEI | Total Efficiency Index |
| TBL | Triple Bottom Line |
| VSM | Value Stream Mapping |
| WFAM | Weighted Fuzzy Assessment Method |
References
- Seliger, G.; Kim, H.J.; Kernbaum, S.; Zettl, M. Approaches to sustainable manufacturing. Int. J. Sustain. Manuf. 2008, 1, 58. [Google Scholar] [CrossRef]
- Elkington, J. 25 Years Ago I Coined the Phrase ‘Triple Bottom Line.’ Here’s Why It’s Time to Rethink It. Harvard Bus. Rev. Digit. Artic. 2018. Available online: https://hbr.org/2018/06/25-years-ago-i-coined-the-phrase-triple-bottom-line-heres-why-im-giving-up-on-it (accessed on 6 February 2023).
- Elkington, J. The Tripple Bottom Line of 21st Century Business; Springer: Berlin/Heidelberg, Germany, 1997. [Google Scholar]
- Amrina, E.; Ramadhani, C.; Vilsi, A.L. A Fuzzy Multi Criteria Approach for Sustainable Manufacturing Evaluation in Cement Industry. Procedia CIRP 2016, 40, 619–624. [Google Scholar] [CrossRef] [Green Version]
- Henriques, A.; Richardson, J. The Triple Bottom Line: Does It All Add Up? Routledge: Oxford, UK, 2004; Volume 16. [Google Scholar]
- Harik, R.; EL Hachem, W.; Medini, K.; Bernard, A. Towards a holistic sustainability index for measuring sustainability of manufacturing companies. Int. J. Prod. Res. 2015, 53, 4117–4139. [Google Scholar] [CrossRef]
- Garbie, I.H. An analytical technique to model and assess sustainable development index in manufacturing enterprises. Int. J. Prod. Res. 2014, 52, 4876–4915. [Google Scholar] [CrossRef]
- Shokouhyar, S.; Seddigh, M.R.; Panahifar, F. Impact of big data analytics capabilities on supply chain sustainability. World J. Sci. Technol. Sustain. Dev. 2020, 17, 33–57. [Google Scholar] [CrossRef]
- Singh, S.; Olugu, E.U.; Musa, S.N. Development of Sustainable Manufacturing Performance Evaluation Expert System for Small and Medium Enterprises. Procedia CIRP 2016, 40, 608–613. [Google Scholar] [CrossRef] [Green Version]
- Eastwood, M.D.; Haapala, K.R. A unit process model based methodology to assist product sustainability assessment during design for manufacturing. J. Clean. Prod. 2015, 108, 54–64. [Google Scholar] [CrossRef]
- Chen, D.; Thiede, S.; Schudeleit, T.; Herrmann, C. A holistic and rapid sustainability assessment tool for manufacturing SMEs. CIRP Ann. 2014, 63, 437–440. [Google Scholar] [CrossRef]
- Armstrong, J.L.; Garretson, I.C.; Haapala, K.R. Gate-to-gate sustainability assessment for small-scale manufacturing businesses: Caddisfly jewelry production. In Proceedings of the ASME Design Engineering Technical Conference, Buffalo, NY, USA, 17–20 August 2014; Volume 4. [Google Scholar] [CrossRef]
- Ghadimi, P.; Azadnia, A.H.; Yusof, N.M.; Saman, M.Z.M. A weighted fuzzy approach for product sustainability assessment: A case study in automotive industry. J. Clean. Prod. 2012, 33, 10–21. [Google Scholar] [CrossRef]
- Kluczek, A. Application of Multi-criteria Approach for Sustainability Assessment of Manufacturing Processes. Manag. Prod. Eng. Rev. 2016, 7, 62–78. [Google Scholar] [CrossRef] [Green Version]
- Shuaib, M.; Seevers, D.; Zhang, X.; Badurdeen, F.; Rouch, K.E.; Jawahir, I. Product sustainability index (ProdSI): A metrics-based framework to evaluate the total life cycle sustainability of manufactured products shuaib et al. prodsi framework to evaluate product sustainability. J. Ind. Ecol. 2014, 18, 491–507. [Google Scholar] [CrossRef]
- Foolmaun, R.K.; Ramjeawon, T. Life cycle sustainability assessments (LCSA) of four disposal scenarios for used polyethylene terephthalate (PET) bottles in Mauritius. Environ. Dev. Sustain. 2013, 15, 783–806. [Google Scholar] [CrossRef]
- Hartini, S.; Ciptomulyono, U.; Anityasari, M.; Sriyanto; Pudjotomo, D. Sustainable-value stream mapping to evaluate sustainability performance: Case study in an Indonesian furniture company. MATEC Web Conf. 2018, 154, 01055. [Google Scholar] [CrossRef] [Green Version]
- Lu, T.; Jawahir, I. Metrics-based Sustainability Evaluation of Cryogenic Machining. Procedia CIRP 2015, 29, 520–525. [Google Scholar] [CrossRef]
- Linke, B.S.; Garcia, D.R.; Kamath, A.; Garretson, I.C. Data-driven Sustainability in Manufacturing: Selected Examples. Procedia Manuf. 2019, 33, 602–609. [Google Scholar] [CrossRef]
- Rocha, M. Contribuição Para o Estudo da Implementação de Sistemas de Gestão Ambiental na Perspetiva do Desenvolvimento Sustentável. Masters’s Thesis, Faculdade de Ciências e Tecnologia da Universidade Nova de Lisboa, Lisbon, Portugal, 2006. [Google Scholar]
- Bateman, N. Sustainability: The elusive element of process improvement. Int. J. Oper. Prod. Manag. 2005, 25, 261–276. [Google Scholar] [CrossRef]
- Fatimah, Y.A.; Biswas, W.; Mazhar, M.; Islam, M.N. Sustainable manufacturing for Indonesian small- and medium-sized enterprises (SMEs): The case of remanufactured alternators. J. Remanuf. 2013, 3, 6. [Google Scholar] [CrossRef] [Green Version]
- Hossaini, N.; Reza, B.; Akhtar, S.; Sadiq, R.; Hewage, K. AHP based life cycle sustainability assessment (LCSA) framework: A case study of six storey wood frame and concrete frame buildings in Vancouver. J. Environ. Plan. Manag. 2015, 58, 1217–1241. [Google Scholar] [CrossRef]
- Zhang, H.; Haapala, K.R. Integrating sustainable manufacturing assessment into decision making for a production work cell. J. Clean. Prod. 2015, 105, 52–63. [Google Scholar] [CrossRef]
- Huang, A.; Badurdeen, F. Sustainable Manufacturing Performance Evaluation: Integrating Product and Process Metrics for Systems Level Assessment. Procedia Manuf. 2017, 8, 563–570. [Google Scholar] [CrossRef]
- Faulkner, W.; Templeton, W.; Gullett, D.; Badurdeen, F. Visualizing sustainability performance of manufacturing systems using sustainable value stream mapping (Sus-VSM). In Proceedings of the International Conference on Industrial Engineering and Operations Management, Istanbul, Turkey, 3–6 July 2012. [Google Scholar]
- Rezvan, P.; Azadnia, A.H.; Noordin, M.Y.; Seyedi, S.N. Sustainability Assessment Methodology for Concrete Manufacturing Process: A Fuzzy Inference System Approach. Adv. Mater. Res. 2014, 845, 814–818. [Google Scholar] [CrossRef]
- Moullin, J.C.; Dickson, K.S.; Stadnick, N.A.; Albers, B.; Nilsen, P.; Broder-Fingert, S.; Mukasa, B.; Aarons, G.A. Ten recommendations for using implementation frameworks in research and practice. Implement. Sci. Commun. 2020, 1, 42. [Google Scholar] [CrossRef]
- Lee, J.Y.; Kang, H.S.; Do Noh, S. MAS2: An integrated modeling and simulation-based life cycle evaluation approach for sustainable manufacturing. J. Clean. Prod. 2014, 66, 146–163. [Google Scholar] [CrossRef]
- Talukder, B.; Blay-palmer, A. Incorporating System Thinking in Assessments of Food and Agriculture System Sustainability. Grad. Student Work. Waterloo Food Issues Gr. 2013. Available online: https://www.researchgate.net/publication/272892312_Incorporating_system_thinking_in_assessments_of_food_and_agriculture_system_sustainability (accessed on 6 February 2023).
- Thirupathi, R.M.; Vinodh, S.; Dhanasekaran, S. Application of system dynamics modelling for a sustainable manufacturing system of an Indian automotive component manufacturing organisation: A case study. Clean Technol. Environ. Policy 2019, 21, 1055–1071. [Google Scholar] [CrossRef]
- Vimal, K.E.K.; Vinodh, S.; Anand, G. Modelling and analysis of sustainable manufacturing system using a digraph-based approach. Int. J. Sustain. Eng. 2017, 11, 397–411. [Google Scholar] [CrossRef]
- Grießhammer, R.; Buchert, M.; Gensch, C.-O.; Hochfeld, C.; Reisch, L.; Rüdenauer, I. PROSA–Product Sustainability Assessment Guideline; Institute for Applied Ecology: Corvallis, OR, USA, 2007. [Google Scholar]
- Gaasbeek, A.; Meijer, E. Handbook on a Novel Methodology for the Sustainability Impact Assessment of New Technologies; Springer: Berlin/Heidelberg, Germany, 2013. [Google Scholar]
- Keller, H.; Rettenmaier, N.; Reinhardt, G.A. Integrated life cycle sustainability assessment—A practical approach applied to biorefineries. Appl. Energy 2015, 154, 1072–1081. [Google Scholar] [CrossRef]
- UNE-EN ISO 14040; Environmental Management—Life Cycle Assessment—Principles and Framework. International Organization of Standardization: Geneva, Switzerland, 2006.
- Veleva, V.; Ellenbecker, M. Indicators of sustainable production: Framework and methodology. J. Clean. Prod. 2001, 9, 519–549. [Google Scholar] [CrossRef]
- Wanner, J.; Janiesch, C. Big data analytics in sustainability reports: An analysis based on the perceived credibility of corporate published information. Bus. Res. 2019, 12, 143–173. [Google Scholar] [CrossRef] [Green Version]
- Silva, A.J.; Cortez, P.; Pereira, C.; Pilastri, A. Business analytics in Industry 4.0: A systematic review. Expert Syst. 2021, 38, e12741. [Google Scholar] [CrossRef]
- Li, Y.; Zhang, H.; Roy, U.; Lee, Y.T. A data-driven approach for improving sustainability assessment in advanced manufacturing. In Proceedings of the 2017 IEEE International Conference on Big Data (Big Data), Boston, MA, USA, 11–14 December 2018. [Google Scholar] [CrossRef]
- Chen, C.L.P.; Zhang, C.-Y. Data-intensive applications, challenges, techniques and technologies: A survey on Big Data. Inf. Sci. 2014, 275, 314–347. [Google Scholar] [CrossRef]
- Niloofar, P.; Francis, D.P.; Lazarova-Molnar, S.; Vulpe, A.; Vochin, M.-C.; Suciu, G.; Balanescu, M.; Anestis, V.; Bartzanas, T. Data-driven decision support in livestock farming for improved animal health, welfare and greenhouse gas emissions: Overview and challenges. Comput. Electron. Agric. 2021, 190, 106406. [Google Scholar] [CrossRef]
- Ramos, T. Development of regional sustainability indicators and the role of academia in this process: The Portuguese practice. J. Clean. Prod. 2009, 17, 1101–1115. [Google Scholar] [CrossRef]
- Seager, T. Understanding industrial ecology and the multiple dimensions of sustainability. In Strategic Environmental Management for Engineers; John and Wiley and Sons: Hoboken, NJ, USA, 2004. [Google Scholar]
- Ramos, T.; Pires, S.M. Sustainability assessment: The role of indicators. In Sustainability Assessment Tools in Higher Education Institutions: Mapping Trends and Good Practices Around the World; Springer: Berlin/Heidelberg, Germany, 2013. [Google Scholar]
- Jørgensen, A.; Lai, L.C.H.; Hauschild, M.Z. Assessing the validity of impact pathways for child labour and well-being in social life cycle assessment. Int. J. Life Cycle Assess. 2010, 15, 5–16. [Google Scholar] [CrossRef]
- Sanyé-Mengual, E.; Secchi, M.; Corrado, S.; Beylot, A.; Sala, S. Assessing the decoupling of economic growth from environmental impacts in the European Union: A consumption-based approach. J. Clean. Prod. 2019, 236, 117535. [Google Scholar] [CrossRef]
- Haberl, H.; Wiedenhofer, D.; Virág, D.; Kalt, G.; Plank, B.; Brockway, P.; Fishman, T.; Hausknost, D.; Krausmann, F.; Leon-Gruchalski, B.; et al. A systematic review of the evidence on decoupling of GDP, resource use and GHG emissions, part II: Synthesizing the insights. Environ. Res. Lett. 2020, 15, 065003. [Google Scholar] [CrossRef]
- Baptista, A.; Lourenço, E.; Silva, E.; Estrela, M.; Peças, P. MAESTRI Efficiency Framework: The Concept Supporting the Total Efficiency Index. Application Case Study in the Metalworking Sector. Procedia CIRP 2018, 69, 318–323. [Google Scholar] [CrossRef]
- Haefner, B.; Kraemer, A.; Stauss, T.; Lanza, G. Quality Value Stream Mapping. Procedia CIRP 2014, 17, 254–259. [Google Scholar] [CrossRef] [Green Version]
- Rother, M.; Shook, J. Learning to See: Value Stream Mapping to Add Value and Eliminate Muda; Lean Enterprise Institute: Cambridge, MA, USA, 2003. [Google Scholar]
- Lourenço, E.; Pereira, J.; Barbosa, R.; Baptista, A. Using Multi-layer Stream Mapping to Assess the Overall Efficiency and Waste of a Production System: A Case Study from the Plywood Industry. Procedia CIRP 2016, 48, 128–133. [Google Scholar] [CrossRef]
- Lourenço, E.J.; Baptista, A.J.; Pereira, J.P.; Dias-Ferreira, C. Multi-Layer Stream Mapping as a Combined Approach for Industrial Processes Eco-Efficiency Assessment. In Re-engineering Manufacturing for Sustainability: Proceedings of the 20th CIRP International Conference on Life Cycle Engineering; Springer: Singapore, 2013. [Google Scholar] [CrossRef]
- Peças, P.; Gonçalves, B.; Rocha, B.; Jorge, D.; Baptista, A. Optimization Techniques to Support Decision-Making Processes Via The MSM—A Industry 4.0 Approach. In Advances in Mathematics for Industry 4.0; Ram, M., Ed.; Elsevier Science: Amsterdam, The Netherlands; Academic Press: New York, NY, USA, 2020; pp. 23–60. [Google Scholar]
- Moreira, J. Indicadores de Eco-Eficiência Como Parte do Sistema de Gestão Ambiental da Águas do Ave, S.A: Aplicação às ETAR de S.Gonçalo, Esposende e Vila Meã. Master’s Thesis, Faculdade de Engenharia da Universidade do Porto, Porto, Portugal, 2009. [Google Scholar]
- Pereira, C. Desenvolvimento de indicadores de eco-eficiência: Aplicação à indústria Metalomecânica. Master’s Thesis, Faculdade de Engenharia da Universidade do Porto, Porto, Portugal, 2011. [Google Scholar]
- Henriques, J.; Ferrão, P.; Castro, R.; Azevedo, J. Industrial Symbiosis: A Sectoral Analysis on Enablers and Barriers. Sustainability 2021, 13, 1723. [Google Scholar] [CrossRef]
- Neves, A.; Godina, R.; Azevedo, S.G.; Pimentel, C.; Matias, J.C.O. The Potential of Industrial Symbiosis: Case Analysis and Main Drivers and Barriers to Its Implementation. Sustainability 2019, 11, 7095. [Google Scholar] [CrossRef] [Green Version]
- Holgado, M.; Benedetti, M.; Evans, S.; Baptista, A.; Lourenço, E. Industrial Symbiosis Implementation by Leveraging on Process Efficiency Methodologies. Procedia CIRP 2018, 69, 872–877. [Google Scholar] [CrossRef]
- Golev, A.; Corder, G.D.; Giurco, D.P. Barriers to Industrial Symbiosis: Insights from the Use of a Maturity Grid. J. Ind. Ecol. 2015, 19, 141–153. [Google Scholar] [CrossRef]
- Ghazinoory, S.; Abdi, M.; Azadegan-Mehr, M. Swot Methodology: A State-of-the-Art Review for the Past, A Framework for the Future. J. Bus. Econ. Manag. 2011, 12, 24–48. [Google Scholar] [CrossRef] [Green Version]
- Toniolo, S.; Tosato, R.C.; Gambaro, F.; Ren, J. Life cycle thinking tools: Life cycle assessment, life cycle costing and social life cycle assessment. In Life Cycle Sustainability Assessment for Decision-Making: Methodologies and Case Studies; Elseviser: Amsterdam, The Netherlands, 2019. [Google Scholar]
- Huarachi, D.A.R.; Piekarski, C.M.; Puglieri, F.N.; de Francisco, A.C. Past and future of Social Life Cycle Assessment: Historical evolution and research trends. J. Clean. Prod. 2020, 264, 121506. [Google Scholar] [CrossRef]
- Ramos, T.B. Sustainability Assessment: Exploring the Frontiers and Paradigms of Indicator Approaches. Sustainability 2019, 11, 824. [Google Scholar] [CrossRef] [Green Version]
- Ramos, T.B.; Martins, I.P.; Martinho, A.P.; Douglas, C.H.; Painho, M.; Caeiro, S. An open participatory conceptual framework to support State of the Environment and Sustainability Reports. J. Clean. Prod. 2014, 64, 158–172. [Google Scholar] [CrossRef]
- Patgiri, R.; Ahmed, A. Big Data: The V’s of the Game Changer Paradigm. In Proceedings of the 2016 IEEE 18th International Conference on High Performance Computing and Communications; IEEE 14th International Conference on Smart City; IEEE 2nd International Conference on Data Science and Systems (HPCC/SmartCity/DSS), Sydney, NSW, Australia, 12–14 December 2016. [Google Scholar] [CrossRef]
- Breque, M.; De Nul, L.; Petridis, A. Industry 5.0: Towards a Sustainable, Human-Centric and Resilient European Industry; European Commission, Publications Office, Directorate-General for Research and Innovation: Berlin/Heidelberg, Germany, 2021. [Google Scholar]


| Requirements | Explanation | Refs |
|---|---|---|
| Goal/Scope | To define the goal and area of scope that needs to be assessed | [7,10,30,35,11,12,13,14,15,23,27,29] |
| Indicators | To identify the indicators that can help to convert the current scenario into a quantifiable value | [4,6,17,22,23,25,26,27,29,30,31,35,7,9,10,11,12,14,15,16] |
| Subjective/objective data | To collect relevant data for all the identified indicators | [7,9,22,23,25,26,27,29,30,31,35,10,11,12,13,14,15,16,17] |
| Relation between indicators | To address the trade-offs and interdependencies between indicators | [4,6,7,14,23,25,27,30,31] |
| Assigning weightage for indicators | To assign weights for all indicators to overcome trade-offs | [5,7,13,14,23,27] |
Disclaimer/Publisher’s Note: The statements, opinions and data contained in all publications are solely those of the individual author(s) and contributor(s) and not of MDPI and/or the editor(s). MDPI and/or the editor(s) disclaim responsibility for any injury to people or property resulting from any ideas, methods, instructions or products referred to in the content. |
© 2023 by the authors. Licensee MDPI, Basel, Switzerland. This article is an open access article distributed under the terms and conditions of the Creative Commons Attribution (CC BY) license (https://creativecommons.org/licenses/by/4.0/).
Share and Cite
Peças, P.; John, L.; Ribeiro, I.; Baptista, A.J.; Pinto, S.M.; Dias, R.; Henriques, J.; Estrela, M.; Pilastri, A.; Cunha, F. Holistic Framework to Data-Driven Sustainability Assessment. Sustainability 2023, 15, 3562. https://doi.org/10.3390/su15043562
Peças P, John L, Ribeiro I, Baptista AJ, Pinto SM, Dias R, Henriques J, Estrela M, Pilastri A, Cunha F. Holistic Framework to Data-Driven Sustainability Assessment. Sustainability. 2023; 15(4):3562. https://doi.org/10.3390/su15043562
Chicago/Turabian StylePeças, Paulo, Lenin John, Inês Ribeiro, António J. Baptista, Sara M. Pinto, Rui Dias, Juan Henriques, Marco Estrela, André Pilastri, and Fernando Cunha. 2023. "Holistic Framework to Data-Driven Sustainability Assessment" Sustainability 15, no. 4: 3562. https://doi.org/10.3390/su15043562