Article

Sustainable Analysis of Insulator Fault Detection Based on Fine-Grained Visual Optimization

1
School of Railway Transportation, Shanghai Institute of Technology, Shanghai 201418, China
2
School of Electrical Engineering, Southwest Jiaotong University, Chengdu 611756, China
*
Author to whom correspondence should be addressed.
Sustainability 2023, 15(4), 3456; https://doi.org/10.3390/su15043456
Submission received: 4 December 2022 / Revised: 29 January 2023 / Accepted: 10 February 2023 / Published: 14 February 2023

Abstract

:
Insulators of the kind used for overhead transmission lines institute important kinds of insulation control, namely, electrical insulation and mechanical fixing. Because of their large exposure to the environment, they are affected by factors such as climate, temperature, durability, the easy occurrence of explosions, damage, the threat of going missing, and other faults. These seriously influence the safety of the power transmission, so insulation monitoring must be conducted. With the development of unmanned technology, the staff used unmanned aircraft to take aerial photos of the detected insulators, and the insulator images were obtained by naked eye observation. Although this method looks very reliable, in practice, due to the large quantity of insulator-collected seismic data, and the complex background, workers are usually relying on their experience to make judgements, so it is easy for mistakes to appear. In recent years, with the rapid development of computer technology, more and more attention has been paid to fault detection and identification in insulators by computer-aided workers. In order to improve the detection accuracy of self-exploding insulators, especially in bad weather environments, and to overcome the influence of fog on target detection, a regression attention convolutional neural network is used for optimization. Through the recursive operation of multi-scale attention, multi-scale feature information is connected in series, the regional focus is recursively generated from coarse to fine, and the target region is detected to achieve optimal results. The experimental results show that the proposed method can effectively improve the fault diagnosis ability of insulators. Compared with the accuracy of other basic models, such as FCAN and MG-CNN, the accuracy of RA-CNN in multi-layer cascade optimization is higher than that in the previous two models, which is 74.9% and 75.6%, respectively. In addition, the results of the ablation experiments at different scales showed that the identification results of different two-level combinations were 78.2%, 81.4%, and 83.6%, and the accuracy of selecting three-level combinations was up to 85.3%, which was significantly higher than the other models.

1. Introduction

Over the past decade, much research has been based on the traditional machine vision algorithm for fault detection. Some researchers consider the color characteristics of insulators. Zhang [1] converts the image from RGB color space to HIS color space and uses morphological algorithms in HIS space to locate the insulator target and realize fault detection. Li [2] applies the OTSU threshold segmentation algorithm to extract the insulator in the RGB space target. Han [3] identifies the insulator object according to the image color transformation and OTSU algorithm and uses the spatial sequence relationship between insulators to construct a feature for fault diagnosis. Some scholars make fault diagnoses according to insulator morphology characteristics. For Wu [4], fault diagnoses are made according to the membership function of the difference degree of measurement, the standard difference matrix of insulator failure, and, on the basis of an improved SIFT algorithm, he takes advantage of the differences between the insulators to extract the feature points, which established fixed detection templates. The failure of insulators is effectively detected by using contrast and template difference. Zhang [5] divides insulators into blocks and judges insulator failure according to the similarity of block structure. Zhao [6] using an OAD–BSPK algorithm, divides insulators according to angle of insulator shape and the size of accurate positioning. Other researchers have used feature point matching algorithms to extract insulator targets. Reddy MJB [7] extracted insulator characteristics using discrete S transform and applied it to SVM classifier recognition. Jiang [8] used OTSU and SIFT methods to generate insulator feature vectors, separate insulators one by one, and calculate Euclidean spacing between adjacent insulators so as to determine the fault free insulator sheet. Zhang [9] combines corner matching and spectrum clustering to diagnose insulator faults. Shang [10] uses AdaBoost classifier to identify insulators and calculate the Euclidean distance between the insulators, thus realizing fault detection. On this basis, the insulator fault diagnosis method based on the combination of image processing and machine learning classifier is proposed. First, the characteristics of the insulator are designed, and the insulator is classified by the machine learning classifier so as to achieve the purpose of positioning and fault recognition of the insulator. However, due to the influence of illumination, angle, complexity, and other factors, the characterization ability of the feature information is not strong, and the recognition effect of the model is poor. At the same time, because a characteristic of manual design is the identification of specific targets, its generalization performance is very low, and it is difficult to accurately detect insulator failure in complex environments.
Therefore, insulator defect detection technology based on deep learning technology has attracted more and more scholars’ attention. Feng [11] et al. combine stochastic forest classification with a convolutional neural network and applied it in the identification of insulator defects. They use stochastic forest classification to segment the original image and determine the location of insulators, and then apply convolutional neural network to the fault classification of insulators so as to locate faulty insulators. Wang [12] et al. propose an improved optimization model based on the full convolutional network to identify insulators and defects. In this model, the full connection layer is removed, multi-scale pooling and hole convolution are added, and two objective optimization functions are used to optimize the model. Finally, the correctness of the model are proved through experiments. Qiu [13] et al. propose a two-stage target detection technology based on Faster-RCNN+ FPN framework, carry out image acquisition by UAV, optimize the anchor size by a clustering algorithm according to the structural characteristics and defect types of the insulators, and improve the target positioning by using the IoU threshold cascade structure and overall RoI. In addition, Soft-NMS+ voting is used to optimize the transmission line so as to achieve the purpose of detecting insulator defects. Zeng Weiyun [14] propose to improve the positioning algorithm of YOLO (You Only Look Once) v3 insulators combined with the bottle layer design-level multi-scale network to improve the positioning degree in one step and introduce K-means clustering algorithm to fit the prior knowledge of insulators to improve the accuracy of the positioning algorithm. Ricardo, M. Prates et al. [15] establish a classification model that can automatically identify the compatibility of insulators by collecting more than 2500 images. The model can obtain benefits from photos and realize the prediction of insulator types by strengthening real details so as to improve the effect of fault detection. Zhao et al. [16] propose a new insulator detection algorithm based on the fast regional convolutional neural network. The detection data of insulation devices are established, and the Faster-CNN model are fine-tuned. The anchor generation of Faster-CNN model and the NMS in region proposal network (RPN) are improved to make the detection of insulators more effective. However, the current method based on deep learning still has many difficulties in insulator fault diagnosis. First of all, the data are insufficient; the existing aerial photographic data are often very unbalanced, and the number of typical insulator samples is large, but the number of fault samples is small, so it is difficult to carry out feature learning. In addition, in order to ensure safety, a strict safety distance must be observed when the UAV is used for electric patrol, which is generally not within five meters. However, in some areas with strict control, the distance will become further because it is too far away. Therefore, the volume of the insulator is usually very small in the pictures taken from the air (even less than 1%) so it is difficult to detect such a small object. At the same time, there is a lot of fog and other complex external meteorological conditions in the collected images, which will also have a great impact on the detection of faults. Aiming at the problem of positioning and fault detection of insulators of overhead transmission lines, insulation image data obtained from the actual and research entry points are different, and the methods adopted are also different. From the current research situation, the research on insulator location is the most commonly used and effective method at present, but there are few studies on insulator fault diagnosis. In this paper, based on the popular deep learning technology, a cascade insulator detection system of “positioning + recognition” is established, which can realize the comprehensive and effective detection of insulators and their faults in overhead transmission lines.

2. Methods

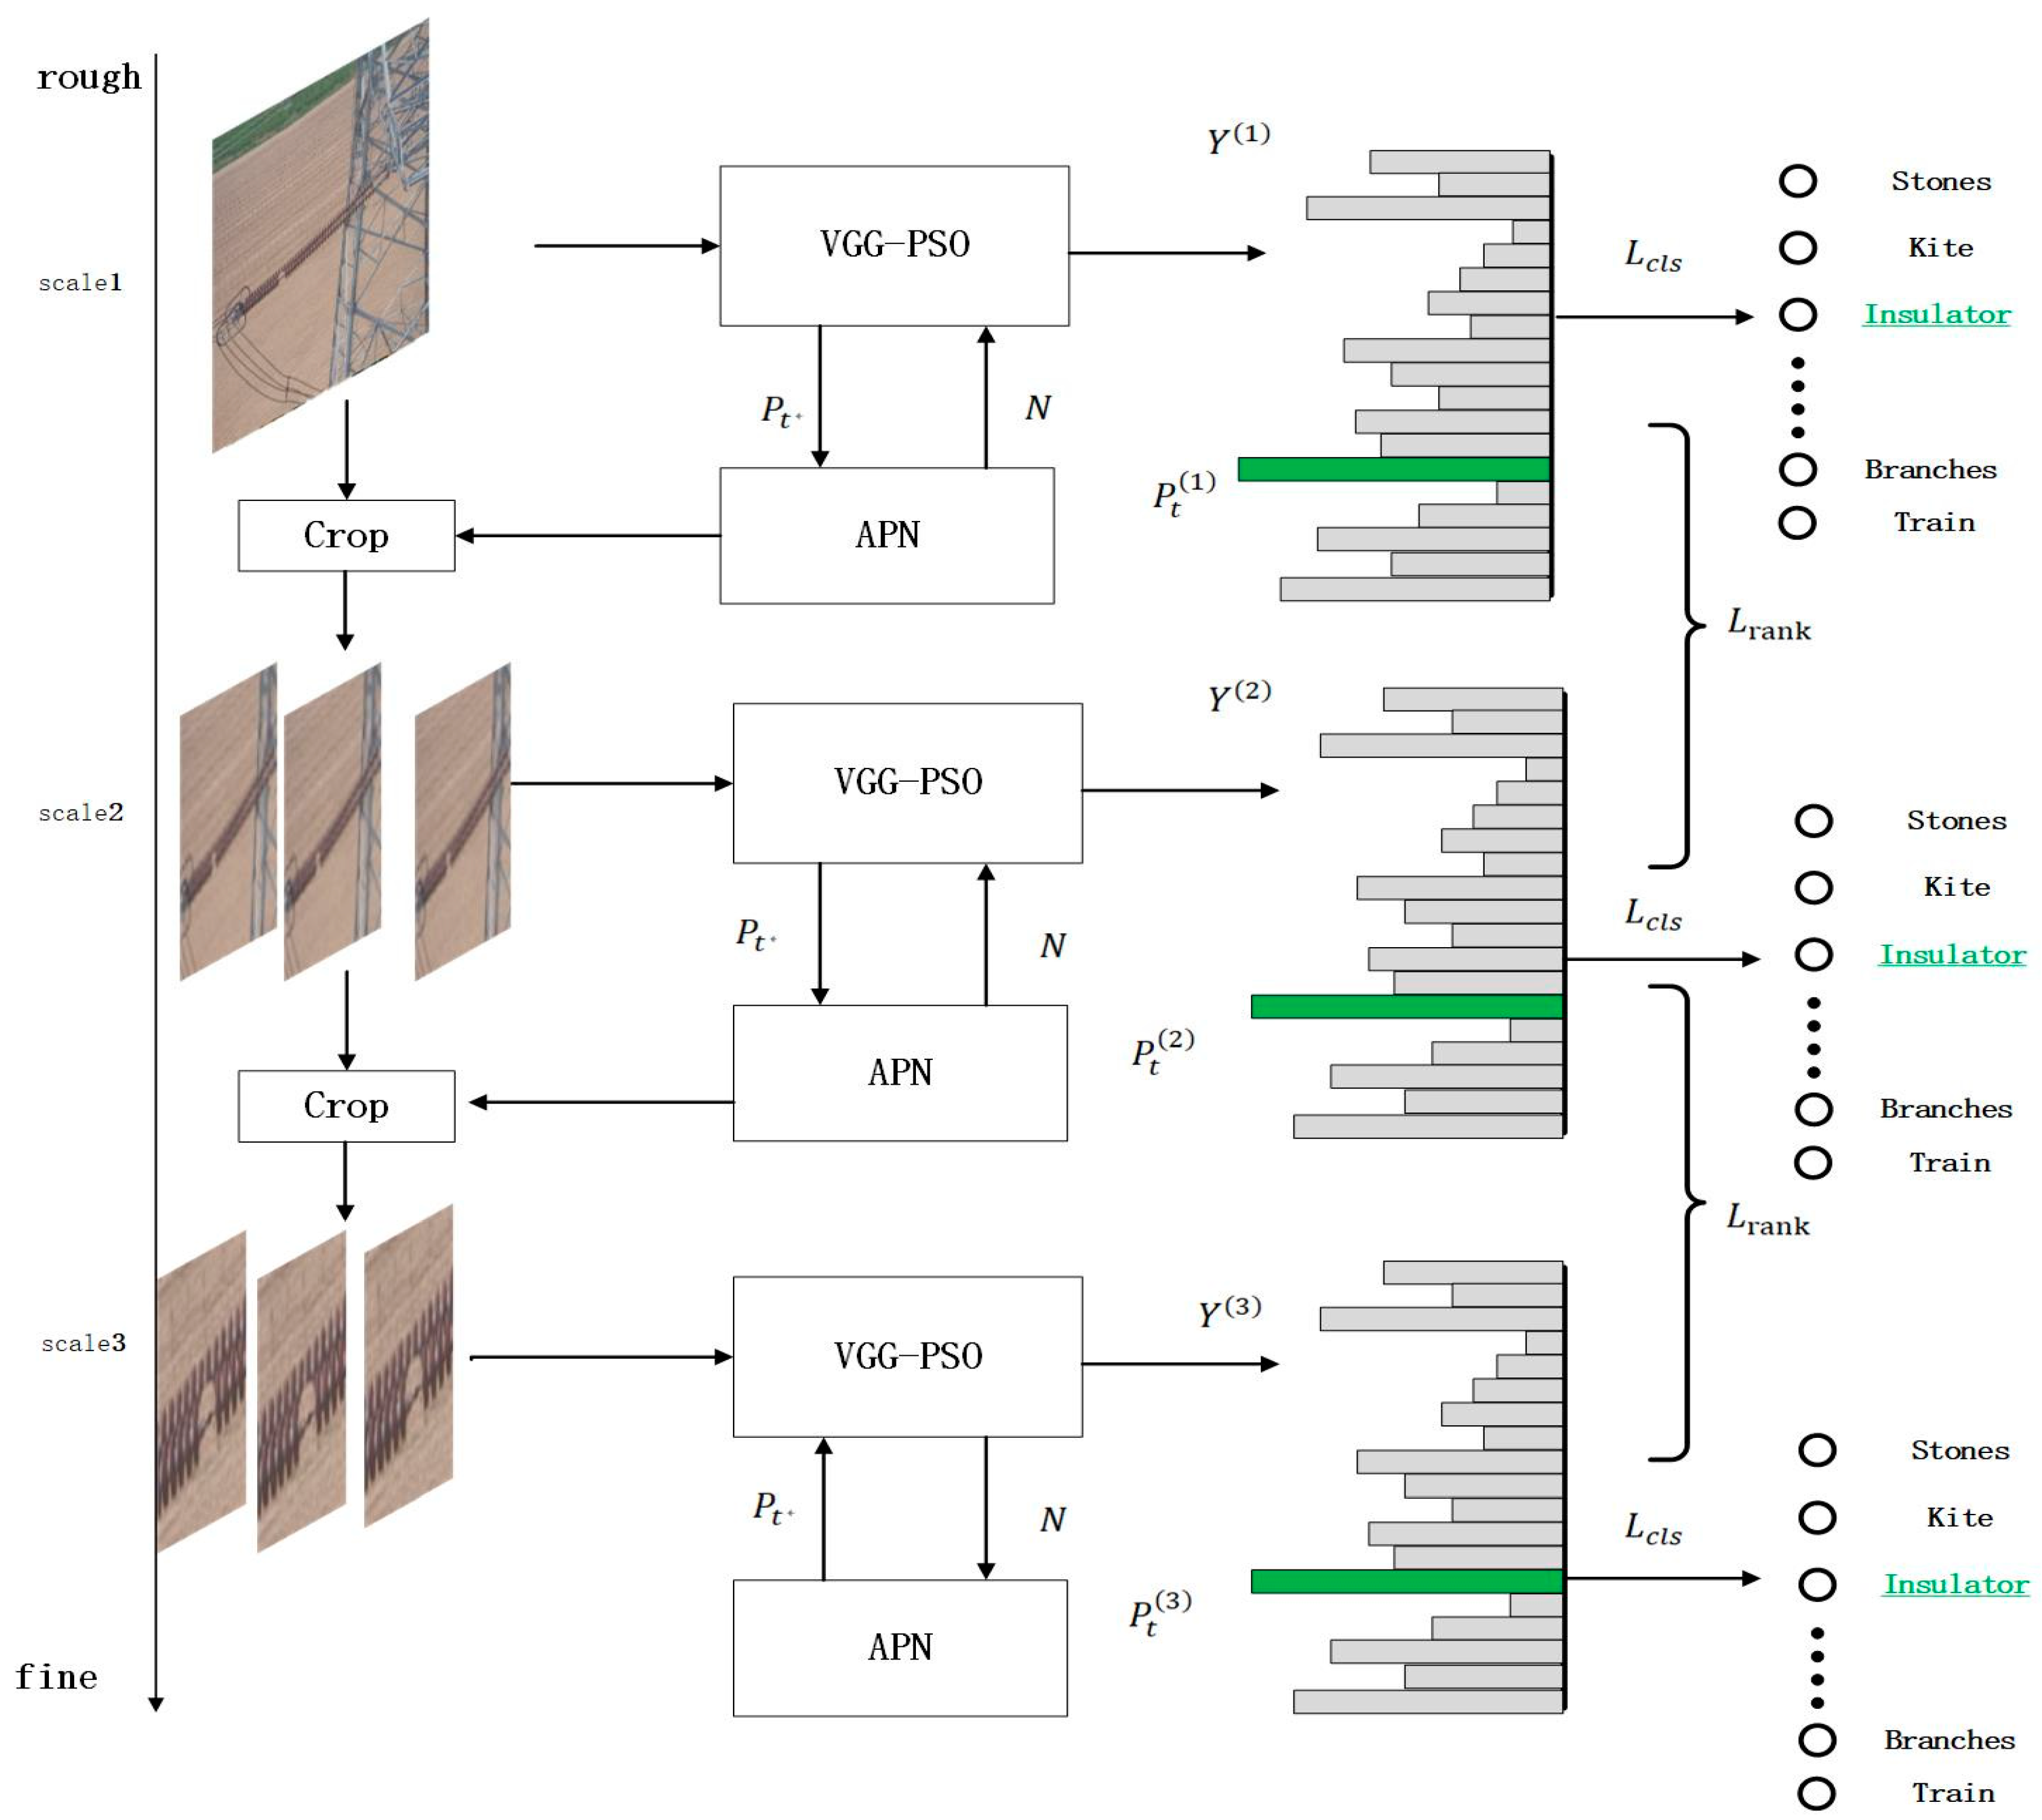
2.1. Experimental Process

The convolution cascade network structure is composed of three levels. The network structure of the three levels is the same, but the parameters between them are uncorrelated. Each level has a classification and a regional sampling. Classifiers of input image feature extraction, classification, and regional sampling are based on the extraction of characteristic value to determine the range of interest as a next step input. Various degrees of output can be obtained by reciprocating work. The overall flow chart for this article is shown in Figure 1.
Firstly, a unified preprocessing method is used to adjust the size of all images of the training set and the test set to 224 × 224. The model in the three layers of network structure and regional sampling module functions on the basis of using the multi-level comprehensive evaluation hierarchical structure instead of the original classification method. SCALE1 in three-dimension network structure is based on the first level image classification and feature extraction for the input of information, and then on to the next level of the network structure for SCALE2 convolution operation. This was repeated three times and three different results were finally obtained. Figure 2 shows the specific results.
In Figure 2, continuous hierarchical sampling of the input image is carried out, and the details of the image are continuously refined. P t is the output of the convolution model after t pooling processing; N is the attention region collected from the extracted feature information and it is taken as the next level of classification and sampling. Y ( m ) is a classification marker for the output of the m layer; P t ( m ) is the possibility of accurate classification of the m layer; L cls is a missing classification module; L rank is the loss of a local sampling component. The details are shown in Figure 1.

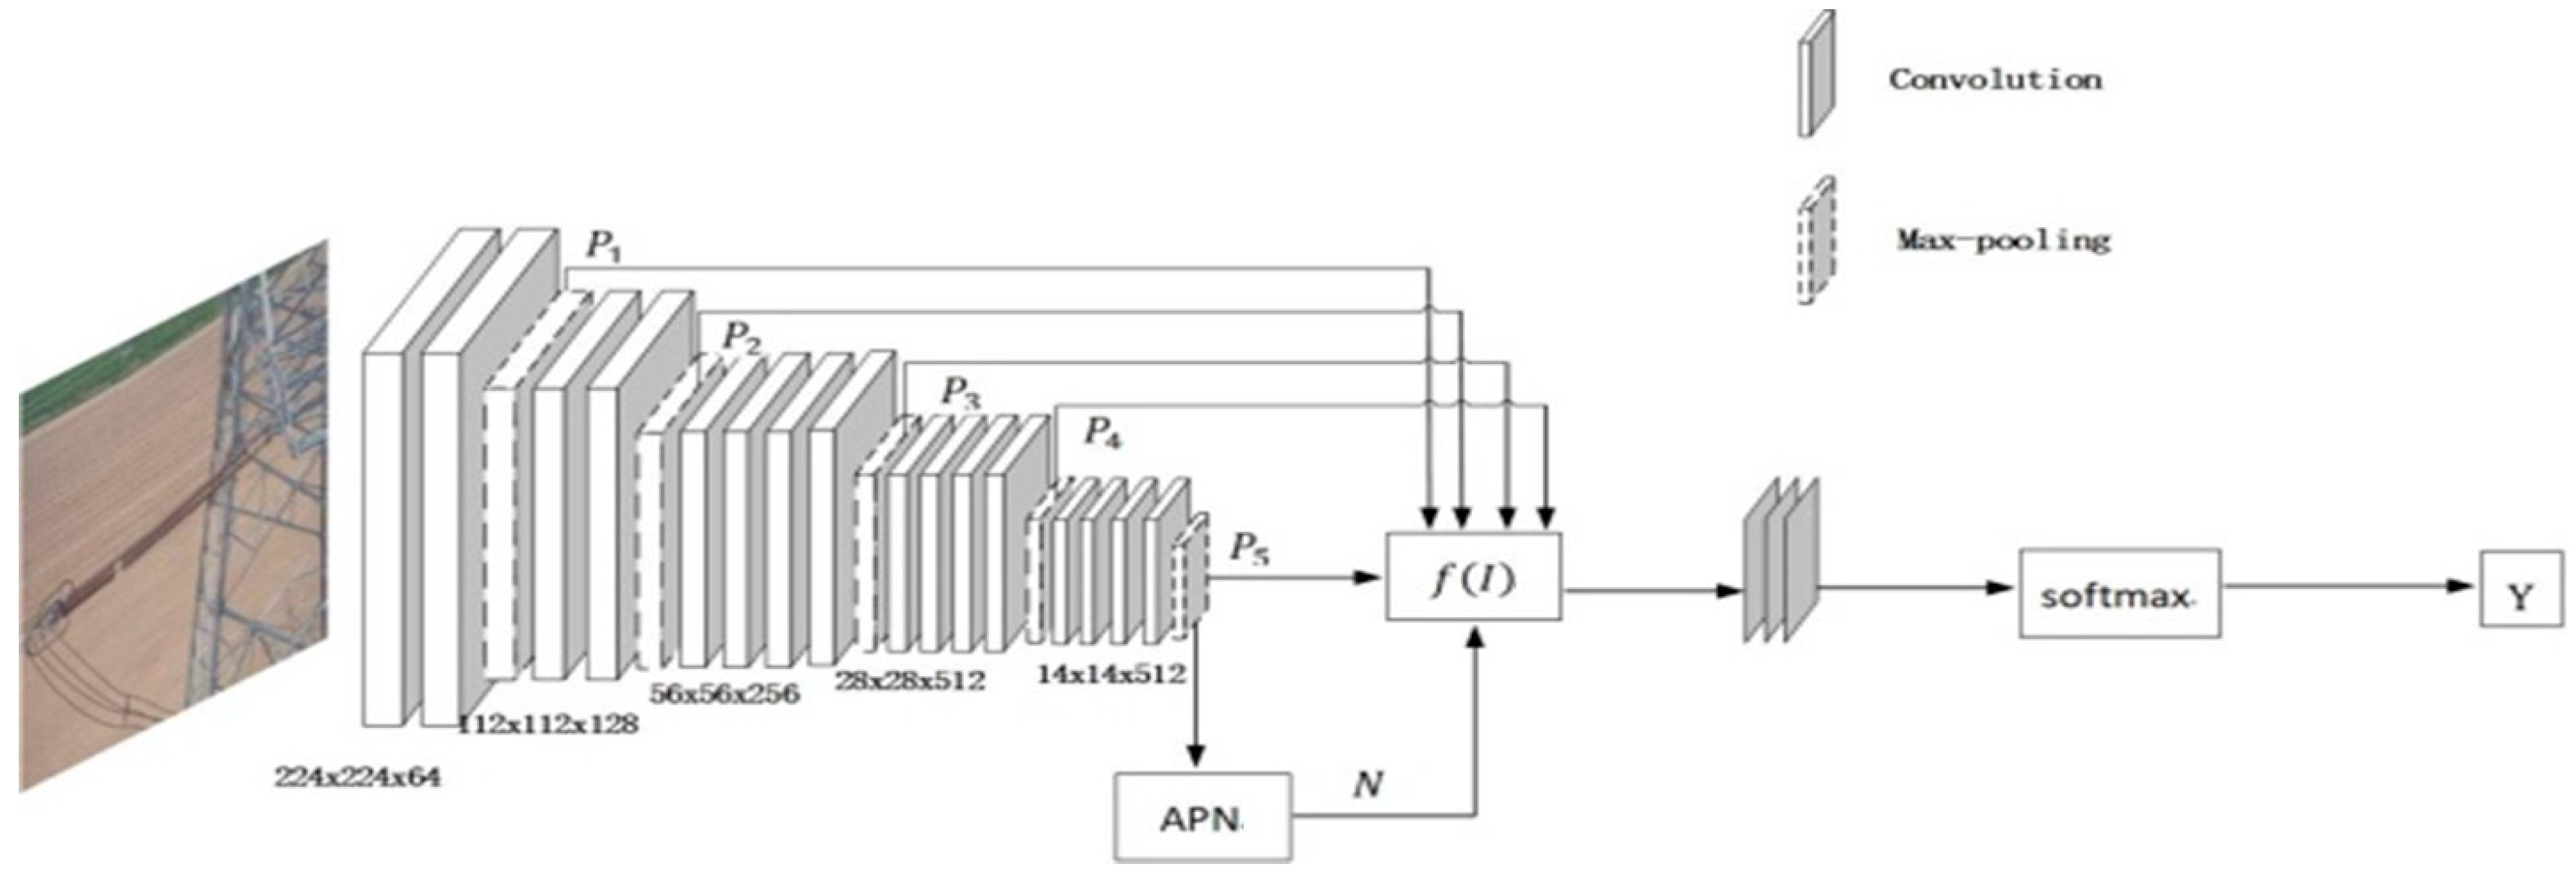
2.2. Classification Module

The core work of the machine vision is to partition the direction of the target. The full convolutional neural network [17,18] is the first systematic study of the method combining convolution operation with multi-layer image segmentation. The system adopts the higher volume, no connection layer, which can be realized to map and different specifications of the input image segmentation. In addition, when establishing the network, researchers use the leapfrog method to enable the network to obtain high-level and low-level image features so as to enrich the characteristics of the target image, which involves many well-known network structures. However, the full convolutional neural network [19,20,21] also has its shortcomings. This method cannot take the characteristics of the different scale areas which closely relate together, so its performance is limited. Subsequent research results are also based on this conclusion, and more information extraction and aggregation have been explored.
The size and specification of the convolutional core are the main factors in its receptive area. As the amount of information increases, the receiving capacity of the network also increases, but the amount of computation also increases, which adversely affects the timeliness of the network. This method applies a new convolution approval rule in the global circumferential convolution [22], which saves a lot of computation. Without more calculations and parameters [23,24], the extended convolution kernel is able to accept a larger information field. Based on the convolution kernel, the expansion factor is introduced into the convolution kernel to find the spacing between the weights of the convolution kernel. Similar approaches have also been used in subsequent work [25,26,27].
Traditional coding and decoding structures are usually used in image segmentation. The decoder is a kind of probability graph, the input image transforms it into pixels classification. On the coding and the structure of the decoder, the connection layers are combined realize the background and the background in the fusion of different scale. Deconvolution network coding and the analytic method is used to analyse the first cut of the image so as to achieve the source data of high-performance testing. SegNet also employs the network architecture of the compiler. In this paper, we introduce a novel upward sampling method so that networks with the same performance have smaller parameters. U-net [28,29] has been widely used in medicine and many papers in this area have been based on it [30,31,32]. In addition, using the multi-layer taper network structure is a common application. Based on the characteristics of the network structure of the pyramid [33,34], it is effective for target detection. In the aspect of image segmentation, ResNet technology is used to extract the feature information by using ResNet, and then the feature information is input into the pyramid model, and the feature maps of various scales are processed, and the data are fused.
RNN is a commonly used algorithm, but some papers use RNN for image segmentation. With the rapid development of GAN technology, many scholars have conducted a variety of machine vision experiments, including image segmentation [35,36,37]. Another point of view is that the image segmentation method [38,39] divide information into the theme and edge; thus, the use of the display model and the boundary of the subject matter is optimized. The SNE—RoadSeg estimation method is the method of using curved surface vector density information from depth to extract the characteristics of the surface normals, thus achieving the goal of space division.
In the traditional network mode, the output P 5 of the 5-stage pool is generally used as a method to calculate the loss function and determine the category label. However, the image characteristics contained in P 5 will be lost due to the change of sampling module area after multi-layer convolution. Based on this, we put forward a method based on multivariate composite. The method can be classified according to the choice of suitable network structure of convolution kernels, which reduces the in-classification the characteristic information loss caused by the sampling. The specific results are shown in Figure 3.

3. Experiments

In recent years, people pay more and more attention to the mechanism, and the attention model is introduced in aspects of machine vision. Common attention and spatial attention focus on modules including channel attention to enhance the network structure by extracting characteristic information from a single pixel point in the local area to strengthen the connection between each channel [40,41,42], and enhance the network structure of spatial attention [43]. GANet [44] built a closed space module so as to realize the adaptive multi-scale features interactive mechanism. FocusNet [45] adopted encoding. Child paid attention to the parallel branch module and produced a gradient flow which is used to optimize the segmentation mask. The multimodal fusion network [46] using multiple channels is encoded separately. It extract feature information and the information combined with design attention mechanism integration module. GSANet [47] used selective attention to extract information pixels at different spatial locations and levels. Researchers [48] established a bidirectional attention model, which was used to process information in the foreground and background, and a parallel reverse attention module [49] for processing polyp colonoscopy images, which used the reverse attention module (reverse attention module) to partition the target area and the edge area. Some researchers [50] proposed a method of utilizing self-attention to construct and analyze the attention region. The researchers used the attention network to detect the boundary regions of polyp images. Attention in the network is designed to use the image of target region and will pay attention to the space and the characteristics of the target area for information. The system can deal well with the position relationship between polyps and edges. In training, multiple channel data can also be used for further learning. Some researchers have proposed a way to use the global attention (such as outlook), and the attention of local information mechanism, adopting a multi-channel and multitasking training strategy and using the training image and the target area image at the same time.
When determining the region to be sampled, it is assumed that the point in the upper left is the origin of coordinates, the left and right directions of the X and Y axes are positive directions, respectively, and the upper left and lower right directions of the region to be sampled are represented by t t l and t b r , respectively, Where t x ,   t y and t l are the step difference values of pixel values corresponding to x and y directions respectively, as expressed by the following Equations (1) and (2):
t x ( t l ) = t x t l ,             t y ( t l ) = t y t l
t x ( b r ) = t x + t l ,             t y ( b r ) = t y + t l .
Introducing a differential map to reflect the attention direction of recursion reduces the information loss brought by the model and sample model. Color is deeper the higher the concentration of focus. Take t x , for instance, where M ( t x ) attention recursive t x differential, and (3) function below:
M ( t x ) = { < 0               x t x ( tl )   > 0               x t x ( br )   = 0               otherwise   .
As can be seen from Figure 4, in the image judgment of the sample area, the initial positioning method is first adopted, and then high-precision segmentation and amplification are carried out so as to obtain more feature information. Due to the graduality, down stitching will be an adverse effects on the subsequent identification, so you can use the improved method to improve the characteristics of upward feedback mechanism. First of all, it is assumed that the upper left coordinate in the figure is the starting point, and the directions of the X- and Y-axes are assumed to be right. On this basis, the addition and clipping operation of elements is used. Because the result of mapping of derivative attention inward from the edge of image transformation, L rank ( t x ) is positive, so in the process of recursive, t x is smaller. Figure 4 shows the first line of the two kinds of different ratio of an image attention body movement. The second row represents a direction of attention mechanism, namely the simulation in the input image. Figure 4 shows the specific results.
When considering the balance of information loss and clipping elements among multiple convolution levels, an adaptive optimization algorithm is needed to screen out the optimal solution for calculation. Genetic algorithm (GA), ant Colony algorithm (ACO), Particle Swarm Optimization (PSO), Artificial Bee Colony (ABC), and Cuckoo Search (CS) are all optimization algorithms based on population. A probabilistic search algorithm for optimization steps is implemented by means of iteration. The experimental thermal map of the above five optimization algorithms combined with the algorithm in this paper is shown in Figure 5 below.
Figure 5 shows that the temperature curve of the insulator identified by PSO coincides with the actual target detection point, so the PSO method is used to optimize it in this paper. Particle swarm optimization (PSO) is a stochastic optimal method used to simulate the flight and foraging of birds. This method is suitable for the complex nonlinear optimization problems this paper aims to solve.
PSO algorithm is used to solve the optimal problem; each particle represents a feasible solution, through the optimization of the objective function, so that every particle in the group can find the optimal solution through a series of motions. In each particle group, the motion law of particles is as follows (4) and (5):
v i ( t ) = ω ( t ) v i ( t 1 ) + M r 1 [ x i b e s t x i ( t 1 ) ] + L r 2 [ x b e s t x i ( t 1 ) ]
x i ( t ) = x i ( t 1 ) + v i t ,
The t in the movement time of particles (t > 0);   x i ( t ) is the position vector of the particle at time t, x i best is the historical best position vector of the particle in motion,   x best is the best historical position vector of the whole body, and v i ( t ) is the velocity vector of the particle at time t.M and L, respectively, corresponding to attention paid to the recursive function with RA−CNN loss function.   r 1 , r 2 is random numbers in the interval [0, 1]. Omega (t) is the following (6) calculation of adaptive inertia weight coefficients:
ω ( t ) = ( ω m a x ω m i n ) P s ( t ) + ω m i n .
In the formula, ω max is the maximum and minimum of the inertia; the maximum and minimum weighted coefficient and the initial value is usually 1.0 and 0.3.   P s ( t ) is the ratio of to-better-position movement of the particles. f i ( x ) is the adaptation degree of the particles in the gait at t, and calculated by the Equation (7):
f ( I ) = ω 1 c f 1 + ω 2 c f 2 + ω 5 c f 5 .
The model consists of five pooling layers, and five types of prediction results are analyzed. On this basis, the weight of five levels corresponding to its adaptive ability is obtained by using the inter-level attention recurrence function and the information loss function. The final input image classification results are performed by multilevel VGG-PSO tags, then the category Y ( m ) of each layer is inserted into the full connection layer, and the final classification results are obtained by softmax. A specific treatment of the weighted heat map is shown in Figure 6.

4. Results

By extracting the multi-level region of interest, the obtained region can not only cover the structure information of the whole object, but also effectively protect the local geographic information. In addition, when the input image is extracted from the second and third level, the information contained is more significantly different, and the extracted attention area is similar to the direction of human perception, which is conducive to fine classification. This can be seen in Figure 7 below:
According to the above results, after the multi-stage cyclic convolution operation, with the deepening of the network, the extraction ability of the feature model also increases, which is mainly because the number of feature layers increases with the further deepening of the features in the multi-stage convolution. Specifically, we can see that in the convolution operation, each layer carries out a certain number of convolution kernel expansion operations. In this process, we can find that each layer uses a certain number of feature extractors, and we find an interesting phenomenon: with the deepening of the network depth, feature extractors become more rich and complex. Note that, at different levels, the recursive function changes and the information loss function is as follows in Figure 8.
In order to make the experimental effect more obvious, considering the target detection and recognition results among different models, classical models FCAN [51] and MG-CNN [52] are introduced to compare the experimental results among different algorithms and verify the performance of the optimization algorithm. The experiment was set up based on the TensorFlow deep learning framework in Windows10 environment. The experiment dataset was divided into training set, verification set, and test set in a ratio of 6:3:1. Detailed parameters were set as follows Table 1.
Meanwhile, ablation experiments are conducted in the Internet Explorer dataset to compare the performance of different algorithms, as shown in Table 2.
From the above table, it can be seen that the target detection accuracy changes at different scales. The detection accuracy of the second layer and the third layer is 81.5% and 80.8%, respectively. The complete RA-CNN model of three-dimension connection (1 + 2 + 3) produces the highest accuracy (up to 85.3%). Compared with the FACN model and MG-CNN model, the improved model has a relative increase of 12.2% and 11.4%, respectively, indicating that the optimized model has a good ability of attention recursion for orbital target detection. At the same time, the RA-CNN(SCALE2) model without attention recurrence optimization has a significant gap in accuracy with other scales, indicating that loss optimization has a certain optimization effect on attention recurrence.
The test results between optimization models are given at different scales. The permutation and combination method is used to test the three-tier scale. The results of the relevant experiments are shown in Table 3 and Figure 9

5. Conclusions

An insulator is an important insulation control used for electrical insulation and mechanical fixing of overhead transmission lines. Because of its large exposure to the environment, it is affected by factors such as climate, temperature, durability, the easy occurrence of explosions, damage, the threat of going missing, and other faults. In order to improve the detection accuracy of self-exploding insulators, especially in bad weather, and overcome the influence of fog on target detection, regression attention convolutional neural network is used and optimized. Through the multi-scale attention recursive operation, the feature information on the multi-scale is connected in series, the regional focus is generated from coarse to fine recursion, and the target region is detected to achieve the optimal results. Experimental results show that this method can effectively improve the fault diagnosis ability of insulators. Compared with other basic models, such as FCAN and MG-CNN, the accuracy of RA-CNN in multi-cascade optimization is higher than that in the first two models, which is 74.9% and 75.6%, respectively. In addition, the results of ablative experiments at different scales show that the identification results of different two-stage combinations are 78.2%, 81.4%, and 83.6%, respectively. The accuracy of selecting three-stage combinations is as high as 85.3%, which is significantly higher than the other models. However, compared with other basic models, the model proposed in this paper, while pursuing the recognition accuracy as much as possible, results in the negative growth of model memory size and running speed to a certain extent. Considering the balance between recognition accuracy and system speed is one of the future research directions of the authors. In addition, the authors will continue to study in greater depth the problems that insulators may cause under different forms of environmental interference, including image pollution, information defects, fuzzy ghost, etc., so as to improve the accuracy and reliability of insulator fault detection and ensure the safe operation of power supply equipment.

Author Contributions

Software, L.W.; Investigation, H.W.; Data curation, D.H.; Writing—review & editing, J.L., X.T. and L.G. All authors have read and agreed to the published version of the manuscript.

Funding

This research was funded by Science and Technology Program of Sichuan Province (2019YJ0210); Science and Technology Program of Sichuan Province (2019YFG0345); National Natural Science Foundation of China (U1934221); National Natural Science Foundation of China (No. 61773323).

Institutional Review Board Statement

Not applicable.

Informed Consent Statement

Not applicable.

Data Availability Statement

Inquiries about related datasets can be made through the author’s email address wanglinfeng60@163.com.

Conflicts of Interest

The authors declare no conflict of interest.

References

  1. Zhang, X.Y.; An, J.; Chen, F. A Simple Method of Tempered Glass Insulator Recognition from Airborne Image. In Proceedings of the Processing of Optoelectronics and Image Processing (ICOIP), Haiko, China, 11–12 November 2010; pp. 127–130. [Google Scholar]
  2. Li, B.; Wu, D.; Cong, Y.; Li, X.Y.; Tang, Y. A method of insulator detection from video sequence. In Proceedings of the 2012 Fourth International Symposium on Information Science and Engineering, Shanghai, China, 14–16 December 2012; pp. 386–389. [Google Scholar]
  3. Han, Z.-X.; Qiao, Y.-H.; Sun, Y. Research on Insulator Fault detection Method of UAV Transmission line based on image recognition. Mod. Electron. Tech. 2017, 40, 179–181. [Google Scholar]
  4. Yang, W. Research on Insulator Recognition and State Detection Based on Aerial Photography Image. Ph.D. Thesis, North China Electric Power University, Beijing, China, 2016. [Google Scholar]
  5. Zhang, J.J.; Han, J.; Liu, L. Insulator recognition and fault diagnosis with shape sensing. J. ImageGraph. 2014, 19, 1194–1201. [Google Scholar]
  6. Zhao, Z.; Liu, N.; Wang, L. Localization of multiple insulators by orientation angle detection and binary shape prior knowledge. IEEE Trans. Dielectr. Electr. Insul. 2015, 22, 3421–3428. [Google Scholar] [CrossRef]
  7. Reddy, M.J.B.; Chandra, B.K.; Mohanta, D.K. A DOST based approach for the condition monitoring of 11 kV distribution line insulators. IEEE Trans. Dielectr. Electr. Insul. 2011, 18, 588–595. [Google Scholar] [CrossRef]
  8. Jiang, Y.; Han, J.; Ding, J. Glass Insulator Identification and Self-detonation Fault Diagnosis Based on Multi-feature Fusion. Electr. Power China 2017, 50, 52–58. [Google Scholar]
  9. Zhang, G.; Liu, Z. Fault Detection of Catenary Insulator Breakage/Inclusion Foreign Body Based on Corner Matching and Spectral Clustering. Chin. J. Sci. Instrum. 2014, 35, 1370–1377. [Google Scholar]
  10. Shang, J.; Li, C.; Chen, L. Insulator Location and Self-Detonation Fault Detection Based on Vision. J. Electron. Meas. Instrum. 2017, 31, 844–849. [Google Scholar]
  11. Feng, W.; Fan, P.; Yao, X.; Gu, S.; Zhou, Z.; Zhou, S. Transmission line insulator Defect Identification based on Deep Learning. J. Hydropower Energy Sci. 2021, 39, 176–178+50. [Google Scholar]
  12. Wang, Y.; Cao, P.; Wang, X.; Yan, X. Research on Insulator Self-detonation Detection Method Based on Deep Learning. J. Northeast. Dianli Univ. 2020, 40, 33–40. [Google Scholar]
  13. Qiu, L.; Zhu, Z. Research on Insulator Defect Detection of Transmission Lines Based on Deep Learning. Appl. Res. Comput. 2020, 37 (Suppl. S1), 358–360+365. [Google Scholar]
  14. Zeng, W. Research on Insulator Detection and Fault Recognition Based on Deep Learning. Ph.D. Thesis, Zhejiang University, Hangzhou, China, 2020. [Google Scholar]
  15. Prates, R.M.; Cruz, R.; Marotta, A.P.; Ramos, R.P.; Simas Filho, E.F.; Cardoso, J.S. Insulator visual non-conformity detection in overhead powerdistribution lines using deep learning. Comput. Electr. Eng. 2019, 78, 343–355. [Google Scholar] [CrossRef]
  16. Zhao, Z.; Zhen, Z.; Zhang, L.; Qi, Y.; Kong, Y.; Zhang, K. Insulator Detection Method in Inspection Image Based on Improved Faster R-CNN. Energies 2019, 12, 1204. [Google Scholar] [CrossRef]
  17. Szegedy, C.; Liu, W.; Jia, Y.Q.; Pierre, S.; Scott, R.; Dragomir, A.; Dumitru, E.; Vincent, V.; Andrew, R. Going deeper with convolutions. In Proceedings of the IEEE Conference on Computer Vision and Pattern Recognition (CVPR), Boston, MA, USA, 7–12 June 2015; pp. 7–12. [Google Scholar]
  18. He, K.; Zhang, X.; Ren, S.; Sun, J. Spatial pyramid pooling in deep convolutional networks for visual recognition. IEEE Trans. Pattern Anal. Mach. Intell. 2015, 37, 904–916. [Google Scholar] [CrossRef]
  19. Shin, H.C.; Roth, H.R.; Gao, M.; Lu, L.; Xu, Z.; Nogues, I.; Summers, R.M. Deep convolutional neural networks for computer-aided detection: CNN architectures, dataset characteristics and transfer learning. IEEE Trans. Med. Imaging 2016, 35, 1285–1298. [Google Scholar] [CrossRef] [PubMed]
  20. Long, J.; Shelhamer, E.; Darrell, T. Fully convolutional networks for semantic segmentation. In Proceedings of the IEEE Conference on Computer Vision and Pattern Recognition (CVPR), Boston, MA, USA, 7–12 June 2015; pp. 3431–3440. [Google Scholar]
  21. Badrinarayanan, V.; Kendall, A.; Cipolla, R. SEGNet: A deep convolutional encoder-decoder architecture for image segmentation. IEEE Trans. Pattern Anal. Mach. Intell. 2017, 39, 2481–2495. [Google Scholar] [CrossRef] [PubMed]
  22. Ghiasi, G.; Fowlkes, C.C. Laplacian pyramid reconstruction and refinement for semantic segmentation. In Proceedings of the Computer Vision—ECCV 2016: 14th European Conference, Amsterdam, The Netherlands, 11–14 October 2016; Springer International Publishing: Cham, Switzerland, 2016; pp. 519–534. [Google Scholar]
  23. Noh, H.; Hong, S.; Han, B. Learning deconvolution network for semantic segmentation. In Proceedings of the IEEE International Conference on Computer Vision (ICCV), Washington, DC, USA, 7–13 December 2015; pp. 1520–1528. [Google Scholar]
  24. Peng, C.; Zhang, X.; Yu, G.; Luo, G.; Sun, J. Large kernel matters—Improve semantic segmentation byglobal convolutional network. In Proceedings of the IEEE Conference on Computer Vision and Pattern Recognition (CVPR), Honolulu, HI, USA, 21–26 July 2017; pp. 4353–4361. [Google Scholar]
  25. Paszke, A.; Chaurasia, A.; Kim, S.; Culurciello, E. ENet: A deep neural network architecture for real-time semantic segmentation. arXiv 2016, arXiv:1606.02147. [Google Scholar]
  26. Yang, M.; Yu, K.; Zhang, C.; Li, Z.; Yang, K. DenseASPP for semantic segmentation in street scenes. In Proceedings of the IEEE Conference on Computer Vision and Pattern Recognition (CVPR), Salt Lake City, UT, USA, 18–23 June 2018; pp. 3684–3692. [Google Scholar]
  27. Yu, F.; Koltun, V. Multi-scale context aggregation by dilated convolutions. arXiv 2015, arXiv:1511.07122. [Google Scholar]
  28. Chen, L.-C.; Papandreou, G.; Kokkinos, L.; Murphy, K.; Yuille, L. Deeplab: Semantic image segmentation with deep convolutional nets, atrous convolution, and fully connected CRFs. IEEE Trans. Pattern Anal. Mach. Intell. 2018, 40, 834–848. [Google Scholar] [CrossRef]
  29. Chen, L.-C.; Papandreou, G.; Schroff, F.; Adam, H. Rethinking atrous convolution for semantic image seg-mentation. arXiv 2017, arXiv:1706.05587. [Google Scholar]
  30. Ronneberger, O.; Fischer, P.; Brox, T. U-Net: Convolutional networks for biomedical image segmentation. In Proceedings of the Medical Image Computing and Computer-Assisted Intervention-MICCAI, Munich, Germany, 5–9 October 2015; Springer International Publishing: Cham, Switzerland, 2015; pp. 234–241. [Google Scholar]
  31. Zhou, Z.; Rahman Siddiquee, M.M.; Tajbakhsh, N.; Liang, J. UNet++: A nested U-Net architecture for medical image segmentation. In Proceedings of the Deep Learning in Medical Image Analysis and Multimodal Learning for Clinical Decision Support, Granada, Spain, 20 September 2018; Springer International Publishing: Cham, Switzerland, 2018; pp. 3–11. [Google Scholar]
  32. Zhang, J.; Jin, Y.; Xu, J.; Xu, X.; Zhang, Y. MDU-Net: Multi-scale densely connected U-Net for biomedical image segmentation. arXiv 2018, arXiv:1812.00352. [Google Scholar]
  33. Song, W.; Zheng, N.; Liu, X.; Qiu, L.; Zheng, R. An improved U-Net convolutional networks for seabed mineral image segmentation. IEEE Access 2019, 7, 82744–82752. [Google Scholar] [CrossRef]
  34. Su, R.; Zhang, D.; Liu, J.; Cheng, C. MSU-Net: Multi-scale U-Net for 2D medical image segmentation. Front. Genet. 2021, 12, 639930. Available online: https://www.frontiersin.org/article/10.3389/fgene.2021.639930 (accessed on 10 October 2022). [CrossRef] [PubMed]
  35. Liu, J.; He, J.; Zhang, J.; Ren, J.S.; Li, H. EfficientFCN: Holistically-guided decoding for semantic segmentation. In Proceedings of the Computer Vision—ECCV, Glasgow, UK, 23–28 August 2020; Springer International Publishing: Cham, Switzerland, 2020; pp. 1–17. [Google Scholar]
  36. Lin, T.; Dollár, P.; Girshick, R.; He, K.; Hariharan, B.; Belongie, S. Feature pyramid networks for object detection. In Proceedings of the IEEE Conference on Computer Vision and Pattern Recognition (CVPR), Honolulu, HI, USA, 21–26 July 2017; pp. 2117–2125. [Google Scholar]
  37. Zhao, H.; Shi, J.; Qi, X.; Wang, X.; Jia, J. Pyramid scene parsing network. arXiv 2016, arXiv:1612.01105. [Google Scholar]
  38. He, J.; Deng, Z.; Zhou, L.; Wang, Y.; Qiao, Y. Adaptive pyramid context network for semantic segmentation. In Proceedings of the IEEE/CVF Conference on Computer Vision and Pattern Recognition (CVPR), Long Beach, CA, USA, 15–20 June 2019; pp. 7519–7528. [Google Scholar]
  39. Byeon, W.; Breuel, T.M.; Raue, F.; Liwicki, M. Scene labeling with LSTM recurrent neural networks. In Proceedings of the IEEE Conference on Computer Vision and Pattern Recognition (CVPR), Boston, MA, USA, 7–12 June 2015; pp. 3547–3555. [Google Scholar]
  40. Liang, X.; Shen, X.; Feng, J.; Lin, L.; Yan, S. Semantic object parsing with graph LSTM. In Proceedings of the Computer Vision—ECCV, Amsterdam, The Netherland, 11–14 October 2016; Springer International Publishing: Cham, Germany, 2016; pp. 125–143. [Google Scholar]
  41. Shuai, B.; Zuo, Z.; Wang, B.; Wang, G. Scene segmentation with DAG-recurrent neural networks. IEEE Trans. Pattern Anal. Mach. Intell. 2017, 40, 1480–1493. [Google Scholar] [CrossRef]
  42. Lin, D.; Ji, Y.; Lischinski, D.; Cohen-Or, D.; Huang, H. Multi-scale context intertwining for semantic segmentation. In Proceedings of the Computer Vision—ECCV, Munich, Germany, 8–14 September 2018; Springer International Publishing: Cham, Switzerland, 2018; pp. 622–638. [Google Scholar]
  43. Hung, W.-C.; Tsai, Y.H.; Liou, Y.T.; Lin, Y.Y.; Yang, M.H. Adversarial learning for semi-supervised semantic segmentation. arXiv 2018, arXiv:1802.07934. [Google Scholar]
  44. Luc, P.; Couprie, C.; Chintala, S.; Verbeek, J. Semantic segmentation using adversarial networks. arXiv 2016, arXiv:1611.08408. [Google Scholar]
  45. Souly, N.; Spampinato, C.; Shah, M. Semi-supervised semantic segmentation using generative adversarial network. In Proceedings of the IEEE International Conference on Computer Vision (ICCV), Venice, Italy, 22–29 October 2017; pp. 5688–5696. [Google Scholar]
  46. Li, X.; Li, X.; Zhang, L.; Cheng, G.; Shi, J.; Lin, Z.; Tan, S.; Tong, Y. Improving semantic segmentation via decoupled body and edge supervision. In Proceedings of the Computer Vision—ECCV 2020: 16th European Conference, Glasgow, UK, 23–28 August 2020; Proceedings, Part XVII 16. pp. 435–452. [Google Scholar]
  47. Fan, R.; Wang, H.; Cai, P.; Liu, M. SNE-RoadSeg: Incorporating surface normal information into semantic segmentation for accurate freespace detection. In Proceedings of the Computer Vision—ECCV, Glasgow, UK, 23–28 August 2020; Springer International Publishing: Cham, Switzerland, 2020; pp. 340–356. [Google Scholar]
  48. Lin, G.; Shen, C.; Van Den Hengel, A.; Reid, I. Efficient piecewise training of deep structured models for semantic segmentation. In Proceedings of the IEEE Conference on Computer Vision and Pattern Recognition (CVPR), Las Vegas, NV, USA, 27–30 June 2016; pp. 3194–3203. [Google Scholar]
  49. Yang, S.; Peng, G. Attention to refine through multi scales for semantic segmentation. In Proceedings of the Advances in Multimedia Information Processing—PCM, Hefei, China, 21–22 September 2018; Springer International Publishing: Cham, Switzerland, 2018; pp. 232–241. [Google Scholar]
  50. Wang, J.; Xing, Y.; Zeng, G. Attention forest for semantic segmentation. In Proceedings of the Pattern Recognition and Computer Vision, Salt Lake City, UT, USA, 18–22 June 2018; Springer International Publishing: Cham, Switzerland, 2018; pp. 550–561. [Google Scholar]
  51. Liu, X.; Xia, T.; Wang, J.; Lin, Y. Fully convolutional at-tention localization networks: Efficient attention localization for fine-grained recognition. arXiv 2016, arXiv:1603.06765. [Google Scholar]
  52. Wang, D.; Shen, Z.; Shao, J.; Zhang, W.; Xue, X.; Zhang, Z. Multiple granularity descriptors for fine-grained categorization. In Proceedings of the 2015 International Conference on Computer Vision, Santiago, Chile, 7–13 December 2015; pp. 2399–2406. [Google Scholar] [CrossRef]
Figure 1. Integral flow chart.
Sustainability 15 03456 g001
Figure 2. Optimized network structure.
Sustainability 15 03456 g002
Figure 3. Network structure of classification model.
Sustainability 15 03456 g003
Figure 4. Attention recursive direction. (a) Primary attention recursive direction. (b) Deep attention recursion.
Sustainability 15 03456 g004
Figure 5. Optimization algorithm comparison. (a) Location of real deeds image; (b) GA optimization results; (c) CA optimization results; (d) ABC optimization results; (e) CS optimization results; (f) PSO optimization results; It can be clearly seen from the figure that, compared with the real image position, only CS and PSO have positive optimization effect, and PSO has the best optimization effect.
Sustainability 15 03456 g005
Figure 6. Weighted heat map. Combine with formula (7) to get a visual effect diagram, cascade the convolution results between different levels, and present them in the form of heat maps.
Sustainability 15 03456 g006
Figure 7. Different target in the region of the three scale.
Sustainability 15 03456 g007
Figure 8. Changes in the recursive attention function and loss function.
Sustainability 15 03456 g008
Figure 9. Target detection results of different algorithm.
Sustainability 15 03456 g009
Table 1. Experimental configuration and parameters.
NameParameterNameParameter
DDR128 GBsize214 × 214 × 3
CPUInter Core i7iterations120
GPU1080Tibatch16
systemWindows 10threshold0.4
editorPycharm 3.8factor0.0005
algorithmNMSlearning rate5 × 10−5
Table 2. Ablation experiment.
Size (MB)FLOP/smAP (%)FPSTraining Time (h)
FCAN [37] (single-attention)31.6 M14.45348.35.37.5
MG-CNN [38] (single-granularity)24.3 M15.4551.24.68.3
RA-CNN (scale 1 + 3)22.3 M5.6655.215.39.6
RA-CNN (scale 2 + 3)24.5 M6.3249.319.810.5
RA-CNN (scale 1 + 2 + 3)20.2 M3.8258.625.418.43
Note: bold values correspond to the best performance in the current table. Abbreviation: FLOP/s, the number of floating-point operations per second; FPS, frames per second; MAP: MAP precision.
Table 3. Experimental results of different convolution models.
ApproachAccuracy (%)
FCAN (single-attention)74.9
MG-CNN (single-attention)75.6
RA-CNN (scale 1) without initial ( t x , t y , t l ) 79.4
RA-CNN (scale 1)81.5
RA-CNN (scale 2)80.8
RA-CNN (scale 2 + 3)83.6
RA-CNN (scale 1 + 2)
RA-CNN (scale 1 + 3)
78.2
81.4
RA-CNN (scale 1 + 2 + 3)85.3
Disclaimer/Publisher’s Note: The statements, opinions and data contained in all publications are solely those of the individual author(s) and contributor(s) and not of MDPI and/or the editor(s). MDPI and/or the editor(s) disclaim responsibility for any injury to people or property resulting from any ideas, methods, instructions or products referred to in the content.

