
Efficiency Measurement of Lignite-Fired Power Plants in Greece Using a DEA-Bootstrap Approach

School of Applied Mathematical and Physical Sciences, National Technical University of Athens, 15780 Athens, Greece
Sustainability 2023, 15(4), 3424; https://doi.org/10.3390/su15043424
Submission received: 19 December 2022
/
Revised: 9 February 2023
/
Accepted: 10 February 2023
/
Published: 13 February 2023
Abstract
:The measurement of power plant efficiency is of great importance for decision makers in order to formulate policies. The purpose of this paper is to analyze the performance of lignite-fired power plants in Greece using data envelopment analysis (DEA) and bootstrap. This research develops DEA-based efficiency metrics based on data from lignite-fired power plants in 2018 and assesses if there are performance disparities between facilities that have been closed or will be closed and plants that are still in operation. The DEA bootstrap results suggest that the power plants are considerably less efficient than what the initial single-DEA efficiency estimates suggested, and additionally, operating lignite-fired power plants are more efficient than those that have already been shut down or are about to be. Furthermore, there is evidence that age may have a detrimental effect on efficiency.
1. Introduction
The energy industry is placing more and more emphasis on sustainable development; thus, electric utilities that face a variety of sustainable development obstacles should be able to track their development in this direction. More than ever, sustainable production processes are required, and approaches for evaluating electric utilities within such a process are crucial in terms of industry rules and future policy research and analysis. A key performance criterion for electric utilities is their contribution to sustainable development, and in addition to financial factors, environmental and social factors must also be taken into account. As a result, in order to reflect the status of the production system from a financial, social, and environmental standpoint, traditional performance measures must be enlarged, and efficiency indicators must be added to firms’ management information systems [1]. This is also true in the context of electricity production from power plants, where aggregate performance indicators can be used to track the contribution to sustainable development made by an electrical utility that owns a number of power plants.
Data envelopment analysis (DEA) [2] as an aggregation method has the potential to provide such metrics that take values between zero and one for inefficient and efficient plants, respectively, using self-defined weighting coefficients [3,4]. Data on variables that are expressed in numerical or physical quantities can be used to develop DEA-based performance indicators. By taking into consideration both conventional inputs, outputs, and environmental effects, these metrics make it possible to compare a given entity—in this case, a power plant—against a group of other similar entities in order to examine improvements in environmental performance.
In this study, Greek Public Power Corporation (GPPC) S.A.’s lignite-fired power plants’ performance is evaluated using DEA while also accounting for environmental effects (i.e., carbon cost). Additionally, a cutting-edge method known as the bootstrap [5,6] is used in efficiency analysis based on DEA to enhance the conventional non-parametric methodology.
The proposed modeling approach is applied to a sample of 13 lignite-fired power plants owned by GPPC, and it may be preferred in situations where a performance evaluation of a group of power plants is required due to the growing concern among policymakers and regulators for the environmental effects of electricity production operations. Data from 2018’s operational and shut down power plants are included in the dataset. The results can be used to identify the power plants that experienced the least inefficiency and to focus efforts on improving the performance of plants that are still in operation. Additionally, a comparison of the performance of active and closed power plants can be done while taking into account the state of operation of the plants. As such, this paper aims to respond to the next central question: How differently do lignite-fired plants perform in terms of converting cost into revenue?
The remainder of the paper is organized as follows. Section 2 reviews the literature linked to the use of one-stage, two-stage, and multi-stage DEA models in assessing the performance of power plants. The dataset and data sources are clarified in Section 3, and the isotonicity relationships between input and output variables are examined. The first four components of the research approach are discussed in Section 4 (part 1: Definition of DMUs and selection of data, part 2: Selection of DEA Model, part 3: DEA assessment, part 4: Bootstrapping). The last component of the research approach involves the presentation and analysis of the results in Section 5. The final section draws the conclusions.
2. Literature Review
The traditional DEA methodology assumes that outputs have to be maximized and inputs have to be minimized [7], whereas when we address the environmental performance, there always exist undesirable outputs [8] which are desired to be minimized. Through modelling undesirable outputs, many articles have addressed the environmental performance [9].
In the literature using DEA, the implicit positive correlation between pollution and desirable outputs has been formalized mainly in a few different ways. A first approach treats pollution as a free disposable input [10]. A second approach considers pollution as outputs by assuming the weak disposability of these bad outputs and the null-jointness of both production types (good outputs and bad outputs) [11,12]. The weak disposability concept describes a situation where outputs are intimately linked and their amounts cannot be changed independently. For other approaches, the interested reader is referred to Dakpo et al. [13].
The methods for including undesirable outputs in DEA models are divided into two categories: indirect and direct [7]. Indirect methods use a monotone decreasing function to the values of the undesirable outputs so that the changed data can be regarded as a conventional desirable output. Direct methods put the undesirable output data in the input or the output side of the DEA. It should be noted that there has been much discussion in the literature about how specifically to regard undesirable outputs as either inputs or outputs. Because both undesirable outputs and conventional inputs have costs for firms, some authors classify them as inputs. Additionally, firms typically work to limit the consumption of inputs and the production of undesirable outputs. Reviews of works on DEA and undesirable outputs can be found in Tyteca [3], Zhou et al. [14], and Halkos and Petrou [15].
Radial and non-radial efficiency measures are used in the application of DEA to environmental performance measurement. In contrast to the non-radial DEA model, which permits non-proportional decreases or increases in each input or output, the radial DEA model permits proportional decreases or increases in each input or output.
When identifying inefficiencies with DEA, an alternative occurs: Either an input or an output orientation might be used in the efficiency analysis. The output-oriented efficiency (i.e., augmenting) indicates a DMU’s capacity to augment outputs given a set of inputs, whereas the input-oriented efficiency (i.e., saving) reflects a DMU’s ability to contract inputs given a set of outputs.
In assessing power plants’ efficiency by treating undesirable outputs, notable DEA studies include Färe et al. [11,12], Tyteca [16], Yang and Pollitt [10], Sueyoshi and Goto [17], Wu et al. [18], and Nakaishi et al. [19]. For recent surveys, see also Zhou et al. [20] and Tsaples and Papathanasiou [21].
The majority of prior works that include uncontrollable variables (i.e., factors that are outside the management’s control) in DEA can be categorized as follows [10]: One-stage DEA [10,11,12,16], two-stage DEA [10,18], and multi-stage DEA (i.e., three-stage DEA [22] or four-stage DEA [10]). Along with conventional inputs and outputs, the one-stage model also directly includes uncontrollable factors. The two-stage model first regresses the efficiency scores of the first stage against a selection of chosen uncontrolled variables in the second stage, starting with a regular DEA model based on conventional inputs and outputs in the first stage. The multi-stage DEA combines a standard DEA in the first stage using conventional inputs and outputs with additional regression techniques and/or DEA in the succeeding stages [10]. Moreover, the series two-stage modeling may be adopted where the first stage is reflected in the production system, and the second stage is considered as the pollution control system. This series two-stage model can then be transformed into a straightforward standard single-stage model [23,24].
It is worth noting that hybrid models have also been mentioned in the literature. Combining competing frontier approaches like DEA and SFA [25,26], DEA with machine learning algorithms [23,24,27], or other approaches like Shannon entropy [28] and multi-objective linear programming (MOLP) [29] are examples of hybrid models.
3. Methods
3.1. Research Design
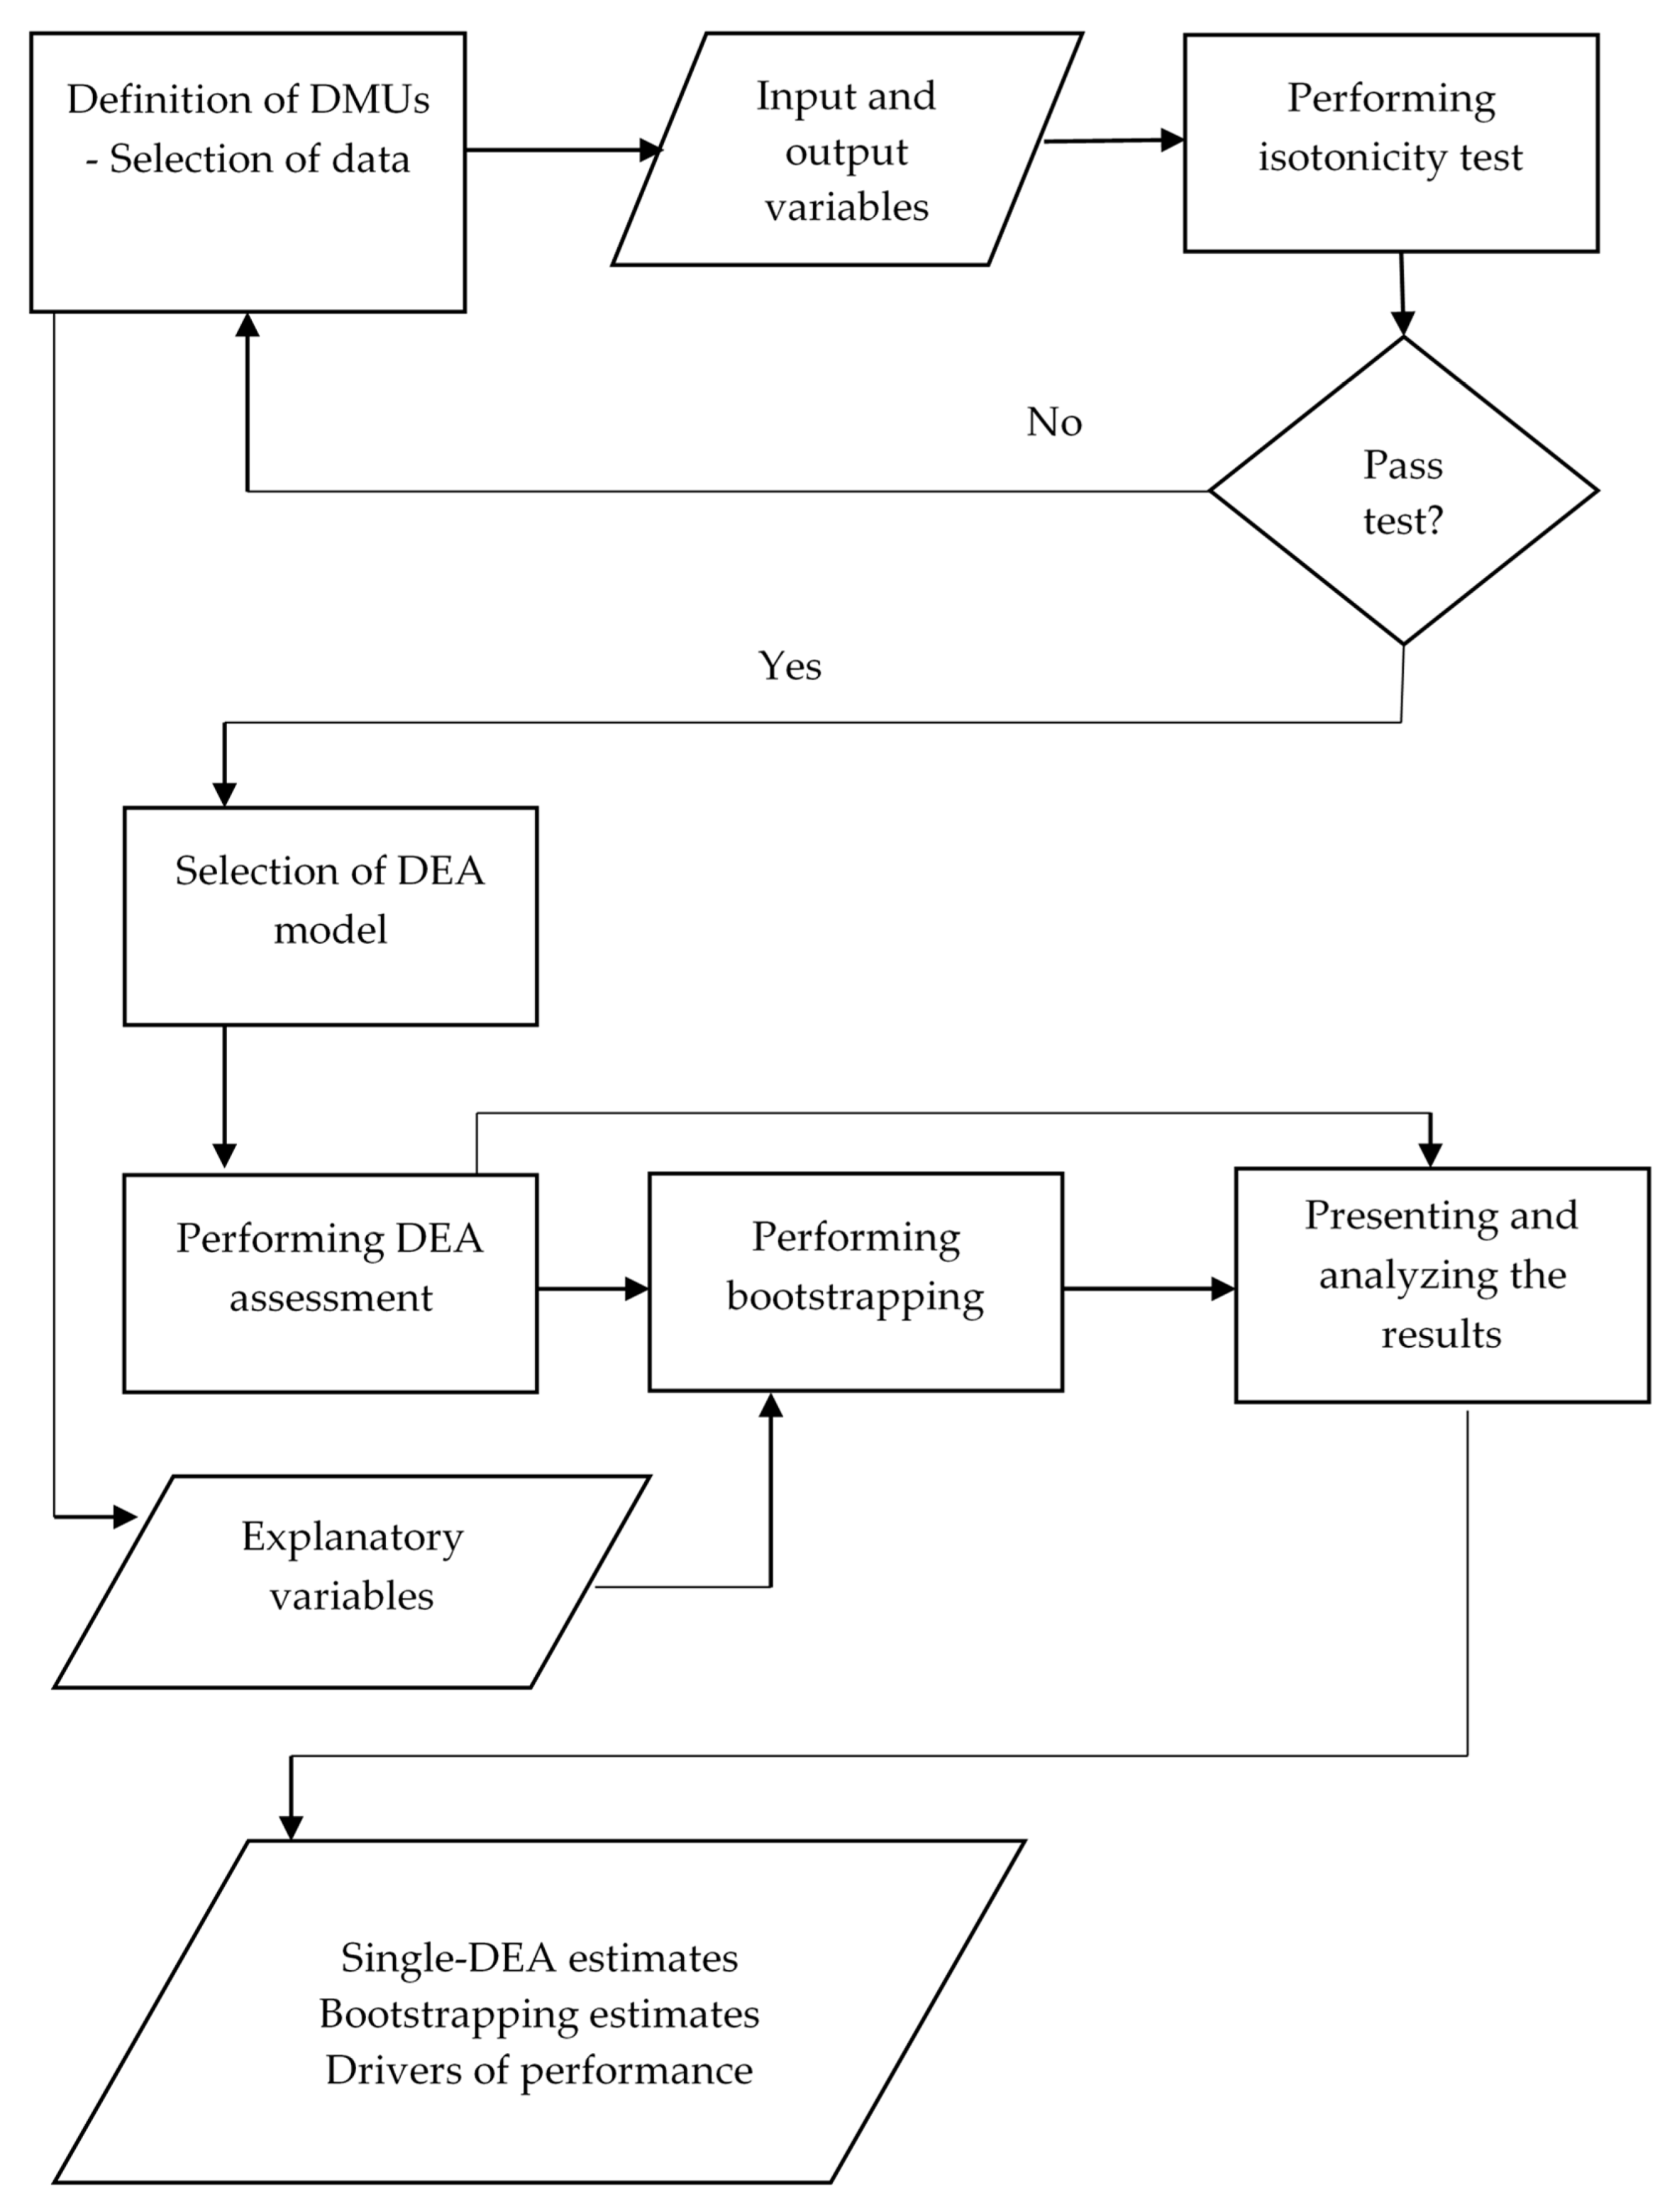
Figure 1 provides a brief description of the study’s structure. This flowchart outlines all the processes (or procedures) that were taken and decisions that were made in order to conduct this research. Step 1 indicates the selected DMUs (i.e., lignite-fired power plants) and selected data (input and output variables, explanatory variables). An isotonicity test should be used to accurately choose the input and output variables before moving on to the next step. Step 2 involves the selection of the DEA model. Step 3 deals with the DEA assessment (measurement of efficiency and estimation of the returns to scale for each DMU). Step 4 involves the bootstrapping of the DEA scores produced in Step 3. This procedure allows us to compute bias-corrected efficiency scores and create confidence intervals. Moreover, the double bootstrap method suggested by Simar and Wilson [30] is also applied. Step 5 involves the presentation and analysis of results that have been produced by Steps 3 and 4.
Below is a more comprehensive explanation of the steps. Section 5 contains the results’ presentation and analysis.
3.1.1. Definition of DMUs—Selection of Data
The DMUs being evaluated in the current study are represented by thirteen Greek lignite-fired power plants.
Input and output variables needed for the DEA assessment should be selected. For the DEA application to be successful, two dataset conditions must be met. The isotonicity property assumption, which asserts that efficiency increases as outputs increase and decreases as inputs increase, is the first. The second is the need for choosing the appropriate number of inputs and outputs and how that relates to the number of DMUs [31,32,33,34]: , where n is the number of observations, m is the number of inputs, and k is the number of outputs. Moreover, the explanatory variables needed for the double bootstrap method should be selected. Data gathering for input, output, and explanatory variables is described in detail in Section 4.
3.1.2. Selection of DEA Model
The non-parametric technique called DEA was used to assess the performance of a set of power plants (i.e., decision-making units (DMUs) in DEA context) that use the same inputs and produce the same outputs. Because of its simple and practical features, DEA has been widely applied in the energy sectors and has benefited from a significant improvement in its theory [18]. Using production theory, DEA may estimate a discrete piecewise frontier without subjecting the data to any functional constraints. In DEA, the location of the frontier is determined by the efficient set of DMUs that lie there; inefficient DMUs are found below the frontier.
DEA was coined by Charnes et al. [2] by proposing the CCR model. Banker et al. [31] developed the BCC model to enhance efficiency by taking into account the size on which each DMU was operating. The interested reader is directed to handbooks [32,33,34,35] for more information about DEA.
Given a set of j (j = 1, 2, …, n) DMUs (i.e., power plants) that use i (i = 1, 2, …, m) inputs denoted by x to produce r (r = 1, …, k) outputs denoted by y, the DEA-based relative performance score results from the solution of the following input-oriented ‘BCC envelopment model’, in reference to its authors (Banker, Charnes, and Cooper) [33]:
where and denote the inputs and outputs used by a DMUj; and are the i-th input and r-th output for the DMUo under evaluation; λj denotes the intensity variables that specify the degree of similarity between an inefficient DMU and its benchmarks; and takes values lower than or equal to one and denotes the factor that measures the efficiency of the DMU under assessment (i.e., DMU0), where a value equal to one indicates an efficient DMU and a value lower than one indicates an inefficient DMU. An input-oriented approach is adopted in order to seek for potential input reductions while retaining the same amount of output produced.
With reference to the various sizes of the Greek power plants examined here, the assumption of variable returns to scale (VRS) reflected by the restriction is thought to be the most pertinent assumption.
For the case of robustness, the super efficiency (SE)-BCC model [18] was also used. Because of the fact that, in Model (1), several power plants can take an efficiency score equal to one, this model cannot rank them exactly. To overcome this problem, Andersen and Petersen [36] proposed a new approach which leads to a concept called ‘‘super-efficiency’’. The efficiency scores from super efficiency models are obtained by eliminating the data on the DMU to be evaluated from the solution set. Although the super efficiency model was introduced to rank efficient DMUs obtained by Model (1), it can be used to evaluate and rank all DMUs.
3.1.3. DEA Assessment
The solution of Model (1) provides the efficiency scores and input slacks for all DMUs and the dual of Model (1) provides the returns to scale for all DMUs. For the case of robustness, the SE-BCC model is also employed.
3.1.4. Bootstrapping
Without taking into consideration the uncertainty behind DEA score estimates, typical DEA applications assume that any deviation from the estimated frontier is driven by various sources of inefficiency. The DEA includes uncertainty either from the estimation of the frontier or from sample variability. The assessment of efficiency in DEA scores can be biased due to ignorance of certain statistical traits and uncertainty, which can produce erroneous results. The general multi-output and multi-input situation is thought to be the ideal setting for bootstrapping in order to investigate the sample characteristics of DEA estimators and assess the robustness of DEA point estimates by correcting the bias and creating confidence intervals [37,38,39,40].
The bootstrapping approach depends on duplicating the data generation process (DGP) (i.e., the process of generating the efficiency ratings) in order to simulate the sampling distribution. Simar and Wilson [39] recommended the bootstrap for DEA under the assumption that the distribution of efficiency ratings is independently distributed. The DEA ratings that are derived from the real data are used in DGP to construct a sizeable number, B, of pseudo-datasets. The efficiency ratings derived by the bootstrapping results are consistent with the actual behavior since the distributions of inefficiency in each pseudo-dataset are the same as those in the original dataset. The B efficiency ratings can be utilized to calculate the DEA scores and to create the empirical distribution for the efficiency metrics.
The conventional bootstrap may only be appropriate if the pertinent statistics are smooth functions of the input data. In order to overcome the problem of the inconsistent behavior of naïve bootstraps when applied to DEA, Simar and Wilson [39] proposed the use of a smoothed bootstrap as a resampling method. By using a smoothing technique that is centered on the kernel density estimator, it is possible to get a consistent estimate with the boundary condition on efficiency scores.
The bootstrap provides the bias, bias-corrected efficiency scores, and their lower and upper bounds with a 95% confidence level. Efficiency that has been corrected for bias is thought to be a better indicator of performance [41]. The double bootstrap method provides the drivers of performance.
4. Dataset
For the evaluations of all Greek lignite-fired plants that are still in operation as well as those that have been shuttered or will be closed, FACE3TS S.A.’s report [42] provides annual data for 2018. The 13 plants included in the analysis are operated by GPPC and its wholly owned subsidiaries Lignitiki Melitis S.A. and Lignitiki Megalopolis S.A. Two inputs, the operating and maintenance (O&M) cost of the power plants and the cost of carbon, and one output, the revenue from the power plants, are used. Carbon cost is the undesired output that is treated as input while O&M cost is the conventional input. The EU Allowance (EUA) used in the European Union Emissions Trading Scheme (EU ETS) is the foundation for the carbon cost estimation [42]. The power plants’ income is the traditional (desirable) output. Since the investment costs and financing plans of the older plants are unknown [42], upfront costs (i.e., capital expenditures) have not been included. As a result, the average cost of capital (WACC), which is required to annualize these costs, has not been employed in the analysis. WACC is the average interest rate that a firm anticipates paying to finance its assets. It establishes the minimum rate required to satisfy stakeholders and helps firms decide whether or not to accept the investment’s risk. The efficiency with which various power plants combine their resources (i.e., expenses) to produce revenues is investigated using the input–output dataset mentioned above. The DEA-based revenue efficiency measures a power plant’s capacity to lower resource costs.
Greece’s power industry is currently undergoing a transition to renewable energy. However, this process is being hampered by the high risks and WACCs associated with new investment. The WACC for coal-fired facilities over the 2015–2018 timeframe is 9.17%, compared to 12% for solar photovoltaic and 22.9% and 23.9%, respectively, for onshore and offshore wind projects [43]. A WACC of 6% [42] for Greek lignite-fired plants is also documented. A reduction in carbon-intensive generation (lignite and oil) and an increase in the contribution of natural gas, solar photovoltaic, and wind technologies are the goals of the recent Greek policy proposals to phase out lignite-based electricity production. The WACC affects technology portfolios. Capital-intensive low-carbon solutions (like wind and photovoltaic technologies) are less competitive as a result of the extremely high WACC values brought on by policy design risk, retroactive feed-in tariff adjustments, technological differences, grid access, and connection type risks [44]. Therefore, where WACCs for low-carbon technology are high, such as in Greece, CO2 emissions are higher.
Despite the study’s small sample size of thirteen power plants, there are other studies in the DEA literature with comparable sample sizes [45]. Despite Simar and Wilson’s [46] assertion that DEA, a non-parametric estimator, produces slower convergence and needs more data compared to parametric estimators, Evanoff and Israilevich [47] claimed that DEA may be used with small sample sizes. The thirteen power plants were in accordance with the general directive provided in Section 3.1.1 on the number of selected input and output variables and their relationship to the number of DMUs.
Table 1 reports the descriptive statistics of the variables used in the DEA assessment.
Regarding the isotonicity property assumption, an isotonicity test between the input and output variables was conducted. The isotonicity test was passed since there were positive (and substantial) correlations between the input and output variables.
5. Results
Table 2 lists the single-DEA estimates resulting from Model (1) for each power plant, along with any associated bias estimates, the DEA estimates that have been corrected for bias, the calculated 95% confidence lower and upper bounds, and the rankings determined by the bias-corrected efficiency scores. Moreover, the operating status of power plants is also provided.
Seven out of the thirteen power plants are apparently efficient, according to the single-DEA model; the efficiency scores range from 0.7855 to 1, with an average value of 0.9497. The bias-corrected efficiency scores in the DEA bootstrap model vary from 0.7798 to 0.99 with an average level of 0.9273. Seven power plants had comprehensive efficiency scores more than 0.95, which indicates that more than half of the examined plants are operating in a productively acceptable manner. These findings suggest that the overall level of the Greek lignite-fired power sector is high.
Agios Dimitrios II and Agios Dimitrios IV plants rank first and second among active power plants, respectively, whereas the Megalopoli IV plant has the lowest efficiency. In comparison to the plants that have been closed or will be closed, the plants that are currently in operation have a higher average efficiency (0.9318 vs. 0.9221).
By analyzing the input slacks that result from Model (1), it is possible to determine the reasons for inefficiency for the inefficient plants. The potential for further input reductions becomes apparent when an inefficient plant is projected onto the estimated frontier. Agios Dimitrios I and Megalopoli IV plants, among those that are now in operation, have the potential to lower O&M and carbon cost.
For the case of robustness, the SE = BCC model was also employed. Despite the fact that the SE=BCC model suffers from infeasibility [49] for one power plant, it provides results that are deemed as satisfactory (Spearman’s correlation coefficient: 0.57) to discriminate efficient and inefficient units. The results are available upon request from the author.
The dual of Model (1) provides the returns to scale (RTS) for all plants. RTS depicts the relationship between the productive scale and the marginal revenue [18]. Managers of power plants would pay closer attention to the RTS of inefficient plants. Agios Dimitrios IV and Meliti plants are the only power plants that operate at the optimal production, exhibiting constant RTS (CRS). Only the Agios Dimitrios V plant exhibits decreasing RTS (DRS) among the other nine plants, indicating that it needs to reduce the producing scale in order to satisfy the optimal output requirements. The other eight plants have increasing RTS (IRS), suggesting that the operational plants should increase their volume of production.
The double bootstrap method was used in an effort to pinpoint the performance-related factors. The nominal capacity (i.e., size) [48] and the age of the plants [18] are included as explanatory factors in the current paper to evaluate their impact on the bias-corrected inefficiency (=1 − bias-corrected efficiency). The results of the double bootstrap were not statistically significant, despite the fact that there is evidence that age may have a negative impact on inefficiency because aging equipment is a widely known cause of inefficiency. The results are available upon request from the author.
6. Conclusions
This study uses DEA modeling to evaluate the performance of Greek lignite-fired power plants using not only revenue and O&M cost but also accounting for the carbon cost. The generated revenue is used in the output side of the DEA, while the O&M (i.e., traditional input) and carbon (i.e., undesirable output) costs are used in the input side. Under the assumption of VRS, the single-DEA- and DEA-bootstrap-based performance indicators are derived. The DEA bootstrap findings imply that the lignite-fired power plants are significantly less efficient than indicated by the single-DEA efficiency estimates. Additionally, power plants that are still in operation are more efficient than those that have already been shut down or are on the verge of doing so. Moreover, there is evidence that age may have a negative impact on inefficiency.
The current article has some management and policy implications. In addition to the usual inputs and outputs, it is important to take into account the effects of undesirable outputs when evaluating the performance of lignite-fired power plants. The application of bootstrapping in DEA can offer valuable information on developing a productive industry. The running power plants that experienced the least inefficiency can be identified using the derived performance indicators, and priority efforts should be made to improve the performance of these plants. Since there are inefficient lignite-fired plants, it is necessary to optimize the structure of electricity production. The increase in unit capacity can result in the best functioning for the plants that are currently running under IRS and will continue to be a part of the electric power production system.
DEA models have limitations because they do not provide the use of a broad range of inputs and outputs for a small number of DMUs. For future research, the multi-objective DEA model can alleviate the aforementioned restriction of the conventional DEA models [50]. Additionally, the WACC and the upfront cost of power plants are study goals that can be considered for upcoming areas of research.
Funding
This research received no external funding.
Institutional Review Board Statement
Not applicable.
Informed Consent Statement
Not applicable.
Data Availability Statement
The data presented in this study are available on request from the author.
Conflicts of Interest
The author declares no conflict of interest.
References
- Tsolas, I.E. Assessing power stations performance using a DEA-bootstrap approach. Int. J. Energy Sect. Manag. 2010, 4, 337–355. [Google Scholar] [CrossRef]
- Charnes, A.; Cooper, W.W.; Rhodes, E. Measuring the efficiency of decision making units. Eur. J. Oper. Res. 1978, 2, 429–444. [Google Scholar] [CrossRef]
- Tyteca, D. On the measurement of the environmental performance of firms—A literature review and a productive efficiency perspective. J. Environ. Manag. 1996, 46, 281–308. [Google Scholar] [CrossRef]
- Olsthoorn, X.; Tyteca, D.; Wagner, M.; Wehrmeyer, W. Environmental indicators for business: A review of the literature and standardisation methods. J. Clean. Prod. 2001, 9, 453–463. [Google Scholar] [CrossRef]
- Efron, B. The Jackknife, the Bootstrap, and Other Resampling Plans; Society for Industrial and Applied Mathematics Philadelphia: Philadelphia, PA, USA, 1982. [Google Scholar]
- Efron, B.; Tibshirani, R.J. An Introduction to the Bootstrap; Chapman & Hall: New York, NY, USA, 1993. [Google Scholar]
- Scheel, H. Undesirable outputs in efficiency valuations. Eur. J. Oper. Res. 2001, 132, 400–410. [Google Scholar] [CrossRef]
- Chung, Y.H.; Färe, R.; Grosskopf, S. Productivity and undesirable out-puts: A directional distance function approach. J. Environ. Manag. 1997, 51, 229–240. [Google Scholar] [CrossRef]
- Li, F.; Emrouznejad, A.; Yang, G.; Li, Y. Carbon emission abatement quota allocation in Chinese manufacturing industries: An integrated cooperative game data envelopment analysis approach. J. Oper. Res. Soc. 2020, 71, 1259–1288. [Google Scholar] [CrossRef]
- Yang, H.; Pollitt, M. Incorporating both undesirable outputs and un-controllable variables into DEA: The performance of Chinese coal-fired power plants. Eur. J. Oper. Res. 2009, 197, 1095–1105. [Google Scholar] [CrossRef]
- Färe, R.; Grosskopf, S.; Pasurka, C. Effects on relative efficiency in electric power generation due to environmental controls. Resour. Energy 1986, 8, 167–184. [Google Scholar] [CrossRef]
- Färe, R.; Grosskopf, S.; Tyteca, D. An activity analysis model of the environmental performance of firms—Application to fossil-fuel-fired electric utilities. Ecol. Econ. 1996, 18, 161–175. [Google Scholar] [CrossRef]
- Dakpo, H.; Jeanneaux, P.; Latruffe, L. Modelling pollution-generating technologies in performance benchmarking: Recent developments, limits and future prospects in the nonparametric framework. Eur. J. Oper. Res. 2016, 250, 347–359. [Google Scholar] [CrossRef]
- Zhou, P.; Ang, B.W.; Poh, K.L. Measuring environmental performance under different environmental DEA technologies. Energy Econ. 2008, 30, 1–14. [Google Scholar] [CrossRef]
- Halkos, G.; Petrou, K.N. Treating undesirable outputs in DEA: A critical review. Econ. Anal. Policy 2019, 62, 97–104. [Google Scholar] [CrossRef]
- Tyteca, D. Linear programming models for the measurement of environ-mental performance of firms—Concepts and empirical results. J. Product. Anal. 1997, 8, 183–197. [Google Scholar] [CrossRef]
- Sueyoshi, T.; Goto, M. DEA environmental assessment of coal fired power plants: Methodological comparison between radial and non-radial models. Energy Econ. 2012, 34, 1854–1863. [Google Scholar] [CrossRef]
- Wu, Y.; Ke, Y.; Xu, C.; Xiao, X.; Hu, Y. Eco-efficiency measurement of coal-fired power plants in China using super efficiency data envelopment analysis. Sustain. Cities Soc. 2018, 36, 157–168. [Google Scholar] [CrossRef]
- Nakaishi, T.; Takayabu, H.; Eguchi, S. Environmental efficiency analysis of China’s coal-fired power plants considering heterogeneity in power generation company groups. Energy Econ. 2021, 102, 105511. [Google Scholar] [CrossRef]
- Zhou, H.; Yang, Y.; Chen, Y.; Zhu, J. Data envelopment analysis application in sustainability: The origins, development and future directions. Eur. J. Oper. Res. 2018, 264, 1–16. [Google Scholar] [CrossRef]
- Tsaples, G.; Papathanasiou, J. Data envelopment analysis and the concept of sustainability: A review and analysis of the literature. Renew. Sustain. Energy Rev. 2021, 138, 110664. [Google Scholar] [CrossRef]
- Gan, W.; Yao, W.; Huang, S. Evaluation of Green Logistics Efficiency in Jiangxi Province Based on Three-Stage DEA from the Perspective of High-Quality Development. Sustainability 2022, 14, 797. [Google Scholar] [CrossRef]
- Mirmozaffari, M.; Yazdani, M.; Boskabadi, A.; Ahady Dolatsara, H.; Kabirifar, K.; Amiri Golilarz, N. A Novel Machine Learning Approach Combined with Optimization Models for Eco-efficiency Evaluation. Appl. Sci. 2020, 10, 5210. [Google Scholar] [CrossRef]
- Mirmozaffari, M.; Shadkam, E.; Khalili, S.M.; Kabirifar, K.; Yazdani, R. Gashteroodkhani, T.A. A novel artificial intelligent approach: Comparison of machine learning tools and algorithms based on optimization DEA Malmquist productivity index for eco-efficiency evaluation. Int. J. Energy Sect. Manag. 2021, 15, 523–550. [Google Scholar] [CrossRef]
- Mirmozaffari, M.; Yazdani, R.; Shadkam, E.; Khalili, S.M.; Tavassoli, L.S.; Boskabadi, A. A Novel Hybrid Parametric and Non-Parametric Optimisation Model for Average Technical Efficiency Assessment in Public Hospitals during and Post-COVID-19 Pandemic. Bioengineering 2022, 9, 7. [Google Scholar] [CrossRef] [PubMed]
- Mirmozaffari, M.; Yazdani, R.; Shadkam, E.; Tavassoli, L.S.; Massah, R. VCS and CVS: New combined parametric and non-parametric operation research models. Sustain. Oper. Comput. 2021, 2, 36–56. [Google Scholar] [CrossRef]
- Mirmozaffari, M.; Yazdani, R.; Shadkam, E.; Khalili, S.M.; Mahjoob, M.; Boskabadi, A. An Integrated Artificial Intelligence Model for Efficiency Assessment in Pharmaceutical Companies During the COVID-19 Pandemic. Sustain. Oper. Comput. 2022, 3, 156–167. [Google Scholar] [CrossRef]
- Peykani, P.; Seyed Esmaeili, F.S.; Mirmozaffari, M.; Jabbarzadeh, A.; Khamechian, M. Input/Output Variables Selection in Data Envelopment Analysis: A Shannon Entropy Approach. Mach. Learn. Knowl. Extr. 2022, 4, 688–699. [Google Scholar] [CrossRef]
- Mirmozaffari, M.; Shadkam, E.; Khalili, S.M.; Yazdani, M. Developing a Novel Integrated Generalised Data Envelopment Analysis (DEA) to Evaluate Hospitals Providing Stroke Care Services. Bioengineering 2021, 8, 207. [Google Scholar] [CrossRef]
- Simar, L.; Wilson, P.W. Estimation and inference in two-stage, semi-parametric models of productive processes. J. Econom. 2007, 136, 31–64. [Google Scholar] [CrossRef]
- Banker, R.; Charnes, A.; Cooper, W. Some models for estimating technical and scale efficiencies in data envelopment analysis. Manag. Sci. 1984, 30, 1078–1092. [Google Scholar] [CrossRef]
- Norman, M.; Stoker, B. Data Envelopment Analysis: The Assessment of Performance; Wiley: New York, NY, USA, 1991. [Google Scholar]
- Thanassoulis, E. Introduction to the Theory and Application of Data Envelopment Analysis: A Foundation Text with Integrated Software; Kluwer Academic Publishers: Hingham, MA, USA, 2001. [Google Scholar]
- Cooper, W.W.; Seiford, L.M.; Tone, T. Data Envelopment Analysis: A Comprehensive Text with Models, Applications, References and DEA-Solver Software; Springer Science+Business Media, Inc.: New York, NY, USA, 2007. [Google Scholar]
- Cooper, W.W.; Seiford, L.M.; Zhu, J. Handbook on Data Envelopment Analysis, 2nd ed.; Springer: New York, NY, USA, 2011. [Google Scholar]
- Andersen, P.; Petersen, N.C. A procedure for ranking efficient units in data envelopment analysis. Manag. Sci. 1993, 39, 1261–1264. [Google Scholar] [CrossRef]
- Simar, L.; Wilson, P.W. Sensitivity analysis of efficiency scores: How to bootstrap in nonparametric frontier models. Manag. Sci. 1998, 44, 49–61. [Google Scholar] [CrossRef]
- Simar, L.; Wilson, P.W. Statistical inference in nonparametric frontier models: The state of the art. J. Product. Anal. 2000, 13, 49–78. [Google Scholar] [CrossRef]
- Simar, L.; Wilson, P.W. A general methodology for bootstrapping in nonparametric frontier models. J. Appl. Stat. 2000, 27, 779–802. [Google Scholar] [CrossRef]
- Simar, L.; Wilson, P.W. Two-stage dea: Caveat emptor. J. Product. Anal. 2011, 36, 205–218. [Google Scholar] [CrossRef]
- Parra Santiago, J.I.; Camarero Orive, A.; Díaz Gutiérrez, D.; De Manuel López, F.d.A. Employing DEA for Assessment of Cruise Market: A Case Study in Malaga—Spanish Port. J. Mar. Sci. Eng. 2022, 10, 1805. [Google Scholar] [CrossRef]
- FACE3TS S.A. An Examination of the Economic Prospects of Greek Lignite Plants. 2019. Available online: http://facets.gr/wp-content/uploads/2021/03/Lignite_Econ_Evaluation_Results_Report_v18a_final.pdf (accessed on 4 December 2022).
- Polzin, F.; Sanders, M.; Steffen, B.; Egli, F.; Schmidt, T.S.; Karkatsoulis, P.; Fragkos, P.; Paroussos, L. The effect of differentiating costs of capital by country and technology on the European energy transition. Clim. Chang. 2021, 167, 26. [Google Scholar] [CrossRef]
- Angelopoulos, D.; Doukas, H.; Psarras, J.; Stamtsis, G. Risk-based analysis and policy implications for renewable energy investments in Greece. Energy Policy 2017, 105, 512–523. [Google Scholar] [CrossRef]
- Avkiran, N.K. The evidence of efficiency gains: The role of mergers and the benefits to the public. J. Bank. Financ. 1999, 23, 991–1013. [Google Scholar] [CrossRef]
- Simar, L.; Wilson, P.W. Statistical inference in nonparametric frontier models: Recent developments and perspectives. In The Measurement of Productive Efficiency and Productivity Growth, 2nd ed.; Fried, H.O., Lovell, C.A.K., Schmidt, S.S., Eds.; Oxford University Press: Oxford, UK, 2008; pp. 421–521. [Google Scholar]
- Evanoff, D.D.; Israilevich, P.R. Productive efficiency in banking. Econom. Perspect. 1991, 15, 11–32. [Google Scholar]
- Zhang, N.; Kong, F.B.; Choi, Y.; Zhou, P. The effect of size-control policy on unified energy and carbon efficiency for Chinese fossil fuel power plants. Energy Policy 2014, 70, 193–200. [Google Scholar] [CrossRef]
- Seiford, L.M.; Zhu, J. Infeasibility of super efficiency data envelopment analysis models. INFOR Inf. Syst. Oper. Res. 1999, 37, 174–187. [Google Scholar] [CrossRef]
- Rezaee, M.J. Using shapley value in multi-objective data envelopment analysis: Power plants evaluation with multiple frontiers. Int. J. Electr. Power Energy Syst. 2015, 69, 141–149. [Google Scholar] [CrossRef]
Figure 1.
Steps to follow in DEA analysis combined with bootstrap.


Table 1.
Descriptive statistics of the inputs and output.
| Inputs, Output | Mean | Standard Deviation |
|---|---|---|
| O&M cost, EUR ‘000 | 56,521 | 18,718 |
| Carbon cost, EUR ‘000 | 21,970 | 7836 |
| Revenue, EUR ‘000 | 77,006 | 27,807 |
Source: Author’s computation using data from FACE3TS S.A.’s report [42].
Table 2.
Single-DEA and bootstrapping estimates.
| Single DEA | DEA Bootstrapping Estimates | |||||||
|---|---|---|---|---|---|---|---|---|
| POWER PLANT | Operating Status | Single DEA Estimates | Bias-Corrected Estimates | Bias | Lower Bound | Upper Bound | Ranking a | Returns to Scale |
| Agios Dimitrios I | In operation | 0.9541 | 0.9423 | 0.0118 | 0.9202 | 0.9536 | 10 | IRS |
| Agios Dimitrios II | In operation | 1.0000 | 0.9835 | 0.0165 | 0.9605 | 0.9994 | 2 | IRS |
| Agios Dimitrios III | In operation | 1.0000 | 0.9481 | 0.0519 | 0.8208 | 0.9993 | 8 | IRS |
| Agios Dimitrios IV | In operation | 1.0000 | 0.9683 | 0.0317 | 0.8835 | 0.9993 | 6 | CRS |
| Agios Dimitrios V | In operation | 1.0000 | 0.9453 | 0.0547 | 0.8215 | 0.9991 | 9 | DRS |
| Amyntaio | Closed | 0.8360 | 0.8226 | 0.0134 | 0.7834 | 0.8354 | 11 | IRS |
| Kardia I | Closed | 1.0000 | 0.9794 | 0.0206 | 0.9410 | 0.9991 | 3 | IRS |
| Kardia II | Closed | 0.9814 | 0.9712 | 0.0102 | 0.9513 | 0.9809 | 5 | IRS |
| Kardia III | Closed | 1.0000 | 0.9900 | 0.0100 | 0.9767 | 0.9994 | 1 | IRS |
| Kardia IV | Closed | 0.9872 | 0.9789 | 0.0084 | 0.9660 | 0.9866 | 4 | IRS |
| Megalopoli III | To be closed | 0.8013 | 0.7904 | 0.0109 | 0.7577 | 0.8007 | 12 | IRS |
| Megalopoli IV | In operation | 0.7855 | 0.7798 | 0.0057 | 0.7697 | 0.7851 | 13 | IRS |
| Meliti | In operation | 1.0000 | 0.9550 | 0.0450 | 0.8507 | 0.9993 | 7 | CRS |
a Rankings are based on bias-corrected DEA estimates generated with 2000 bootstrap iterations. IRS: Increasing returns to scale; CRS: Constant returns to scale; DRS: Decreasing returns to scale.
Disclaimer/Publisher’s Note: The statements, opinions and data contained in all publications are solely those of the individual author(s) and contributor(s) and not of MDPI and/or the editor(s). MDPI and/or the editor(s) disclaim responsibility for any injury to people or property resulting from any ideas, methods, instructions or products referred to in the content. |
© 2023 by the author. Licensee MDPI, Basel, Switzerland. This article is an open access article distributed under the terms and conditions of the Creative Commons Attribution (CC BY) license (https://creativecommons.org/licenses/by/4.0/).
Share and Cite
MDPI and ACS Style
Tsolas, I.E. Efficiency Measurement of Lignite-Fired Power Plants in Greece Using a DEA-Bootstrap Approach. Sustainability 2023, 15, 3424. https://doi.org/10.3390/su15043424
AMA Style
Tsolas IE. Efficiency Measurement of Lignite-Fired Power Plants in Greece Using a DEA-Bootstrap Approach. Sustainability. 2023; 15(4):3424. https://doi.org/10.3390/su15043424
Chicago/Turabian StyleTsolas, Ioannis E. 2023. "Efficiency Measurement of Lignite-Fired Power Plants in Greece Using a DEA-Bootstrap Approach" Sustainability 15, no. 4: 3424. https://doi.org/10.3390/su15043424
Note that from the first issue of 2016, this journal uses article numbers instead of page numbers. See further details here.