Article

Optimal Design of Hybrid Renewable Systems, Including Grid, PV, Bio Generator, Diesel Generator, and Battery

1
School of Traffic and Transportation Engineering, Hunan Institute of Traffic Engineering, Hengyang 421001, China
2
Department of Renewable Energies, Faculty of New Sciences and Technologies, University of Tehran, Tehran 1417935840, Iran
3
Department of Electrical and Electronics Engineering, Nisantasi University, Istanbul 34467, Turkey
4
School of Engineering, Cardiff University, Cardiff CF24 3AA, UK
5
British Malaysian Institute, Universiti Kuala Lumpur, Kuala Lumpur 50250, Malaysia
6
Department of Electrical Engineering, Faculty of Advanced Technology and Multidiscipline, Universitas Airlangga, Surabaya 60115, Indonesia
*
Authors to whom correspondence should be addressed.
Sustainability 2023, 15(4), 3297; https://doi.org/10.3390/su15043297
Submission received: 26 December 2022 / Revised: 23 January 2023 / Accepted: 8 February 2023 / Published: 10 February 2023

Abstract

:
Renewable energies are the best solutions to reduce CO2 emissions and supply reliable electricity. This study aims to find the best combination of various components considering economic, environmental, and technical factors together. The most important consideration factors are the limitation of using PV panels due to the land constraints and applying CO2 penalties where diesel generators and the grid are generating electricity. Findings show that providing electricity by hybrid systems would be useful even in the well-provided electricity regions by the grid with the least blackouts. The best combination of the proposed components, including PV, bio generator, diesel generator, batteries, and grid for the case study region where the load demand is 890 kWh/day and peak load is 167.2 kW, would be an off-grid hybrid system including PV, bio generator, diesel generator, and battery. The optimization results show an NPC (present value of the costs of investment and operation of a system over its lifetime) of $1.02 million and a COE (the average cost per capital of useful electricity produced by the system) of 0.188 $/kWh. Finally, due to the showing of the effect of different conditions on the optimization results and making the study usable for other circumstances of the case study region, some sensitivity analyses have been carried out.

1. Introduction

Electricity is one of the most important kinds of energy used worldwide. There are such issues as security, reliability, the number of blackouts, the price of power, and environmental problems regarding electricity use. In this respect, hybrid energy systems can address most problems and fulfill energy demands both in off/on grid-connected areas [1]. Considering the variety and availability of energy sources in case study regions, it is no secret that renewable sources can be the best solution for improving electricity supply [2] since they are usually environmentally better and can be used in remote or grid-connected areas where there is no feasible way to reach to the electricity network. Considering the mentioned points, wind turbines [3], photovoltaic panels [4], geothermal, bio generators [5], and fuel cells [6] can be used to supply energy demand.
Indonesia is a country in Southeast Asia with a population of about 270 million people and over 17,000 islands. This country planned to reduce pollutant emissions by 26% to 41% by 2030, which is impossible unless they use renewable energies. In 2013, it rolled out feed-in tariffs to develop renewables, they are as follows: $0.06–0.14 for wind, $0.25–0.3 for solar, and $0.12–0.17 for biomass [7]. Indonesia has a tropical climate where solar irradiation is enough for power generation. In this respect, there is a significant concentration on generating power from solar in Indonesia; however, the potential of renewables is not well used in Indonesia. The potencies of bioenergy, solar power, and wind power are 32,654 MW, 207,898 MW, and 60,647 MW, respectively, while the utilization of these energies is 5.1%, 0.04%, and 0.01%. Indonesia’s national energy policy targets profit from these natural sources to reduce emissions and compensate for its lack of electricity supply [8]. Renewable electricity generation from wind, biofuels, hydro, geothermal, and PV for Indonesia in 2019 is shown in Figure 1 [9]. Indonesia has the highest energy consumption growth rate (3.46% per year) and is the sixth global producer of emissions (4.56% of the total). Electricity and transportation will have 40% of total emissions by 2040. Considering the lack of primary fossil fuels, it will face an energy crisis in the future if it does not develop and use renewable sources. One of the main obstacles to a lack of renewable development is higher subsidies for fossil fuels than renewable energies [10]. As reported in Table 1, eight out of thirteen energy producer systems in Indonesia have an electricity supply crisis and face some blackouts [11]. Indonesia planned in 2021 to reach zero emissions by 2060. According to this plan, it is supposed that independent power producers support 65% of the total investment for the installation of renewable energies [12]. Indonesia is going to impose a sharp reduction in diesel subsidies from 17 trillion to 11.3 trillion so that 51.6% of 40.6 GW of planned electricity supply from 2021 to 2030 will be from renewable energies. Accordingly, renewables will provide 24.8% of total energy by 2030 [13]. The government’s policies have two general strategies: find the best economic optimum systems and the most environmentally friendly systems. The government will remove 9.3 GW of the PLN’s (Perusahaan listrik negara–national electric company, Indonesia) plants since most of them use coal to generate electricity. Additionally, while the original Carbon tax was 4.83 $/ton-CO2, it was changed to 2.1 $/ton-CO2 to impose on coal power plants and then on other parts from April 2022 [13]. To reach a 23% renewable fraction by 2025, 10–20% of the capacity of coal power plants must burn Biofuels and newly installed ones should use 30% of their fuels from biofuels. In this regard 14 million ton biomass is needed every year [14].
Apart from government incentives and energy policies, individual houses can invest in installing sustainable energies and profit economically. Some research has been done on hybrid renewable systems in Indonesia with different goals, mainly about finding optimum systems for the case studies.
Apribowo et al. [15] investigated a hybrid renewable system using a floating PV-wind turbine to overcome the land limitation on Nipah island and reported their financial results. They also considered the sell-back price to the grid when the hybrid system produces excess electricity. Aisyah et al. [16] pointed out that Biaro island faces lack access to transportation, cannot quickly receive diesel fuel, and is not connected to the grid. The island is utilizing some diesel generators that can only provide electricity for people 12 h a day. They optimized economic hybrid systems to supply power demand and reduce CO2 emissions. The base case scenario of their study was using three diesel generators and recommended further modeling since RF may lead to stability problems. Ramelan et al. [17], considering that the reliability and efficiency of a power system are characterized by when it can respond to load demand and load change, studied various batteries along with 1 MW PV panels. The results showed that Vanadium (VRFB) batteries have lower COE compared to Lithium–ion and ZnBr ones, while still lead–acid and Li–ion batteries are being used in the hybrid renewable systems in Indonesia. They also reported that Vanadium batteries have lower investment costs, more durability, and easier maintenance. Apprillia et al. [18] designed a hybrid on-grid system for Bandung city and focused on economic parameters and return investment period. They reported that four years is enough to reach the initial investment so that renewable PV systems can help the national grid at day peak hours. Kanata et al. [19] considered diesel generators as the base scenario and compared them with hybrid renewable systems for Sebesi island. They concluded that PV/Bio-Gn/Bat system has the best economic scenario, reducing expenses by 28% compared to the base scenario, while PV/Bio-Gn/Wind/Bat system is the best techno-environmental solution. They finally suggested further sensitivity analyses in future research. Syahputra et al. [20] aimed to design a grid-connected hybrid system for Yogyakarta, using Java-Madura-Bali electricity, and is not still effectively using the hydro and solar potential for power generation. After considering 6 p.m. to 9 p.m. as peak load time and 12 p.m. to 4 a.m. as off-peak time, they used the PSO algorithm to find systems capacity considering capital cost, sell-back, COE, and NPV. Nugroho et al. [21], considering the high expenses of grid extending to remote areas due to the submarine cables and also variation in diesel prices, compared PV/Gn/Bat and PV/Gn/Wind/bat with the present power system, including some diesel generators for Eastern Indonesia. The results showed a 21% reduction in COE and a 53% reduction in fuel consumption and pollutant emission. Rumbayan et al. [22] designed an optimum hybrid system for Miangas where fuel transfer prices are high. After finding the size of the system’s components, they implemented sensitivity analysis on the diesel price and found that increasing fuel price leads to increasing system’s COE. Table 2 shows the details of the mentioned studies.
In this study, different hybrid renewable systems are proposed and optimized by HOMER software where some constraints, such as lack of enough space for installing PV panels, and CO2 penalties, are considered. The optimization results are investigated where economic, environmental, and technical factors are considered, which in the previous studies they were not taken into account together, especially those in the literature review. Furthermore, sensitivity analyses are employed to simulate the different economic and environmental issues, as well as different load demands to make this study applicable to different conditions in the case study region.

2. Hybrid Renewable Energy Systems

2.1. Grid

In 2022, for residential usage where the connection power is more than 3500 VA, the price of electricity will be increased by 17.6% for people who have enough income, which is around 2.5% of the total PLN users [25]. According to the ministry of energy and mineral resources, the prices for connections lower than 3500 VA will be constant, and for higher than 3500 VA will change every three months according to the rate of Rp/USD, the price of oil, the price of coal, and the inflation rate [26]. In general, two factors impact the price of electricity for consumers: the kind of connection to the grid and the amount of VA which typically is 220 v and 25 A (equal to 5500 VA), known as R2 users, and the amount of electricity consumption per kWh. The government’s electricity price is changed by altering the price of oil so that increasing 1$ in oil price increases $34.11 million PLN’s expense. The price of electricity for residential usage (R2 and R3), is between 0.0996 to 0.1172 $/kWh [27]. The maximum purchase price for produced electricity through renewables by PLN would be 85% of the sale price by PLN [28]. It should be mentioned that CO2 emission from coal power plants in Indonesia is 1000 kg CO2/kWh [29]. At present, since Indonesia’s policies for CO2 emission’s social costs are not clear enough [30], the amount of social costs defined by ADB’s criteria could be considered as 39.3 $/ton-CO2 [31].

2.2. Solar

The price of installing solar panels differs from roof to roof, model to model, and size by size. The more the area of the roof and the electrical connection size (VA), the lower the price of solar electricity. There are two important factors in the price: technology and brand. For residential usage, monocrystal and polycrystal panels are used, the way that the former is more usual since it takes less space and has more efficiency. Various roofs have a 5% tolerance in price, while the system’s size and batteries have more impact on the final price. Additionally, the amount of electricity demand is important for selecting the appropriate PV panels to supply electricity, especially during peak hours. According to the national solar experts, without considering installation cost, in semi-detached houses with 2.2 kW connection power, the price of PV would be 1380 $/kW, while for townhouses (5.5 kW connection power) and bungalows (10 kW connection power), the cost of PV panels would be 1035 $/kW and 863 $/kW. The land needed for the mentioned locations would be 6 m2/kW [32]. According to estimated values, the cost of electricity generation by solar in Indonesia is between 0.069 to 0.1932 $/kWh for different locations in the country [30].
The selected PV panel for the proposed configurations was LONGi Solar LR6-60, the panel type of which was a flat plate and included a Two-Axis tracker system. Rated capacity (kW), temperature coefficient, operation temperature (°C), and efficiency (%) for this type of panel are 0.3, −0.41, 47, and 18.3, respectively. The equation of the produced power by PV (kW) panels could be obtained through the following equation:
Power   generation =   RC × DF × ( SRI IR ) × [ 1 + T C P × ( C T C T S T C ) ]
where RC is the rated capacity (kW) of PV equal to the output power generated by PV under Standard Test Condition (STC), where radiation is 1 kW/m2, the cell temperature is 25 °C, and no wind. The Derating Factor (DF) (%) of PV represents the reduced percentage of power output along the PV’s lifetime. SRI is Solar Radiation Incident (kW/m2) in the current time step, while IR (1 kW/m2) is the incident radiation at STC. TCP is the temperature coefficient of power (%/°C) as the dependency on power output on the cell temperature. CT and CTSTC are PV’s cell temperatures (°C) at reality and STC, respectively [1].

2.3. Inverter

There are three main factors for selecting an inverter. The size of the inverter is almost close to the size of PV panels. The location’s geography is another factor in how it affects the amount of the received solar rays and, consequently, the amount of electricity generation. The last factor is the site’s specific factors like azimuth and shade. Additionally, an important factor named arrey-to-inverter means that the DC rating of solar panel per maximum output of inverter should be considered. This value is better not to be more than 1.5. If PV panels are not supposed to work at their maximum capacity, it will be better to use higher values of arrey-to-inverter. In addition, the inverter size should be proportional to solar capacity to prevent clipping phenomena [33].
To convert produced electricity from PV panels, which is in DC mode, to AC, for all of the proposed systems, a converter was selected where its lifetime, efficiency, and capital cost are 15 years, 95%, and 250 ($/kW), respectively.

2.4. Battery

Batteries are used to store excess electricity produced by PV panels and generators. In this project, it is prohibited that batteries can sell electricity to the grid. Additionally, they cannot be charged by the grid when renewables cannot charge them. For all of the proposed configurations Generic 1 kWh Li-Ion was selected as a storage pack, the price of which is 400 ($). In addition, nominal voltage, roundtrip efficiency, maximum charge current, and maximum discharge current were 6 (v), 90 (%), 167 (A), and 500 (A), respectively.

2.5. Case Study Region, Resources, and Loads

Malang, located in East Java, in Indonesia, has been studied in this study. The location of the region is shown in Figure 2 [34], and the latitude and longitude of the selected region are 7°58.5′ S and 112°40.8′ E, respectively. In an overall view, this region is connected to the grid. Figure 3 shows the case study’s solar radiation (GHI) and clearness index. As can be seen, the average solar radiation is 5.17 kWh/m2/day. The proposed demand load was 890 kWh/day, and the peak load was 167.21 kW. Figure 4 shows the seasonal demand load.

3. Proposed Hybrid Systems and Scenarios

In this study, as shown in Table 3, 14 scenarios were considered under 7 configurations according to Figure 5. For each configuration, proposed scenarios were optimized by HOMER software for free using PV panels and limited to using PV panels up to 90 kW due to the land limitations needed for installing PV panels according to the peak load. Considering the proposed configurations, possible dispatches were tested as optimization strategies. Additionally, the selected search spaces for generators mentioned in Table 3, were considered after different primary optimizations have been done to find their appropriate possible size ranges based on the load demand. Configurations were designed in a way that included both using and not using the grid to find the best solution for supplying electricity. Inflation, discount rate, and project’s lifetime were 2.7%, 4.5%, and 20 years, respectively. Since the usage was considered residential, capacity shortage, as a factor that showed how many percentages of the demanded load could not be supplied by the designed system, was considered 1%.

4. Results and Discussion

This section reports the simulated systems’ results by HOMER software, and the best scenario was selected by employing a multi-criteria decision-making (MCDM) method. The employed MCDM method was TOPSIS [35]. Finally, the selected scenario is described, and some sensitivity analyses have been carried out on the system.
Table 4 shows the results of the optimized systems. As can be seen, COE for grid-connected configurations was 0.131 ($/kWh) and for off-grid configurations it varied from 0.188 to 0.276 ($/kWh). The obtained COEs were less than the ones mentioned in the previous studies in Table 2, which confirms both the correctness of optimizations and their accuracies. Except for S7, in which HOMER predictive (PS) dispatch was used for optimization, for all scenarios, Cycle Charging (CC) dispatch (in which supplying the demanded load by renewables is its priority) has had the best result. As can be seen, S5, S6, and S9 to S14 had the same economic and emission values, as well as the same size of PV. This happened because, when the system includes a grid, using bio and diesel generators is not economical, so the system does not use them as the main electricity supplier. Additionally, the grid provided around 66% of the total load demand for all the grid-connected systems. Hence, according to the obtained results and combinations, S1 to S10 have been considered the main alternatives. Considering the columns of Table 4 as criteria, the obtained Pi values by the MCDM method are shown in Figure 6. According to this figure, S1 to S4 had the highest Pi values, which means that they would be the best options for selection. Hence, systems including the grid are not good choices when all of the technical, economic, and environmental aspects are considered, while in the case of considering only economic parameters, systems including the grid are the best choices. Considering the configurations in Table 3 and the obtained results in Table 4, between S1 to S4, it would be a rational decision to choose S4 since, firstly, it includes all of the components resulting in more reliability when there are unpredictable problems, such as lack of biofuel, diesel fuel, and other related problems to PV panels. In addition, S4 did not use more than 90 kW PV, meaning that the limitation of land was well considered according to the primary assumptions of this study, and, compared to the grid-connected systems, it had around a one-twelve times more environmentally friendly emission. Hence, in this study, S4 is selected as the best choice for the case study region.

4.1. Analysis of S4

In this section, technical analysis of the scenario S4 is performed. For this scenario, CO2 emission was 18,790 kg/year, and the renewable fraction was 92%. The share of PV, bio generators, and diesel generators in supplying electricity was 43%, 49%, and 8%, respectively. Additionally, biomass and diesel consumptions were 1.49 tons/day and 19.6 Lit/day, respectively. This system uses a 72.5 (kW) converter. Figure 7a shows the power output of the 87 (kW) PV panels during a year versus daily hours. As expected, most of the produced power was from 10:00 a.m. to 4 p.m. and from 6 p.m. to 6 a.m., there was no power generation by solar panels, so other components had to supply electricity to reach the demand load. The highest level of electricity production was around 11 to 3 p.m.; if the generated electricity became more than the demand load, excess electricity was stored in the battery bank. Figure 7b shows the state of the 229 (kW) batteries charge during the different hours of the day during a year. According to this figure, batteries were charging from 11:00 a.m. to 6 p.m. since the heat map shows batteries were almost fully charged. From 18:00 to 24:00 p.m. batteries were around 10% charged, which means that some of the demand load was supplied with batteries. From 00:00 to 6:00 a.m., the state of the batteries showed that they were around 50% charged, which means that bio and diesel generators could charge the batteries when they generate excess electricity. Figure 7c,d show electricity generation by 50 (kW) bio and 12 (kW) diesel generators, respectively. According to these figures, from 6:00 p.m. to 24:00 p.m. and 4:00 a.m. to 7:00 a.m., bio generators produced electricity; from 00:00 to 4:00 a.m., diesel generators produced electricity. Hence, it turns out that all of the components supported a part of electricity generation. To better see the demand load and supplied load by the components, Figure 8 would be useful. This figure is selected as sample days of a year to investigate the details of the electricity consumption and generation during a day. On 18 July, 8:00 a.m., bio generators and PV panels were generating electricity, and batteries were being charged. At this time, produced electricity was more than the electricity consumption, so excess electricity moved to the batteries. On 18 July, 24:00 p.m., diesel generators were supplying load demand while solar panels and batteries had no production. On 19 July, 4:00 a.m., batteries were being discharged and provided load demand.
The cost summary of the components is reported in Table 5. Most of the capital cost was related to PV panels and batteries, respectively. According to this figure, bio and diesel generators and system converters will be sold to the market after the project’s lifetime since the results show salvage values for these components. The capital column shows the initial cost of purchasing components in the first year, and the replacement column shows the expenses that will be paid during the project’s lifetime when the component’s lifetime is finished.

4.2. Sensitivity Analysis on S4

In this section, some of the system’s variables have been investigated by sensitivity analysis. It is no secret that applying sensitivity analysis not only considers different situations that may occur or change during the project’s lifetime or changing the location, but also leads to having a range of results in case of questionable modeling or unreliable data.
Due to the importance of fuel prices on their consumption, sensitivity analysis is carried out on diesel fuel and biomass prices. Figure 9 shows the results of this sensitivity analysis. According to this figure, an increment in biomass price from 1 to 40 $/ton would lead to decreasing bio generator capacity from 55 kW to 20 kW, and diesel generator capacity increases from 24 to 56, where the diesel fuel price is 0.4 $/L; While when diesel price is increased to 2 $/L, the optimum system will just use about 55 kW bio generator and 4 kW diesel generator. Additionally, an increment in biomass price from 1 to 40 $/ton would cause an increment in COE from 0.170 to 0.207 $/kWh and 0.186 to 0.260 $/kWh, where diesel fuel prices are 0.4 and 2 $/L, respectively. Results show that an increment in diesel fuel price does not significantly affect NPC values, while an increment in biomass prices remarkably affects the system’s NPC values. Increment in the NPC values is higher when diesel fuel price is more expensive since, in this condition, the optimized system will use more bio generators than when diesel fuel prices are lower. Considering the heating values, pollutant taxes, and biomass prices, using bio generators is more cost-effective than diesel generators.
To investigate the effects of the cost of bio generator and PV panels on the system’s sizing, sensitivity analysis on the price of bio generator and PV panels has been done, and the obtained results are shown in Figure 10. An increment in the price of bio generator from 0.4 to 1.3 times the base considered capital cost (800 $/kW) will not change the capacity of PV panels in the optimized systems when the PV panels’ price is at the lowest value (0.5 times of the base cost (1500 $/kW)). While, at this condition, the system will use 10 kW less bio generator. An increment in the price of PV panels up to 1.5 times higher than the base cost would lead to a decrement in using PV panels from 90 to 66 kW and an increment in bio generator size from 50 to 70 kW. According to the obtained heat maps increment in bio generator cost or PV, the panels’ costs will not significantly affect the NPC values since when one of the prices is expensive, the optimized system will use the other cheap component to supply electricity. However, an increment in both PV panel prices (from 0.5 to 1.5 times the base cost) and bio generator prices (from 0.4 to 1.3 times the base cost) will increase NPC values from $0.85 million to $1.15 million. Changing bio generator cost from 0.4 to 1.3 times its base cost where PV is the lowest price (0.5 times its base cost) will increase COE values from 0.158 to 0.183 $/kWh. These changings in COE values are from 0.181 to 0.208 $/kWh, where PV panels are expensive (1.5 times the base cost). In addition, an increment in PV panels’ cost from 0.5 to 1.5 times its base cost would increase COE values from 0.158 to 0.181 $/kWh and 0.183 to 0.208 $/kWh, where bio generator costs are 0.4 to 1.3 times its base coast, respectively.
The last sensitivity analysis was done on the load demand and CO2 penalty, as shown in Figure 11 and Figure 12, and Table 6. According to the obtained results in Figure 11, the optimum combination of the components should be PV and bio generator for the blue parts of the figure and PV, bio generator, and diesel generator for the red parts. In this figure’s corners, points A, B, C, and D were selected to show the optimum size of the components considering different load demands and CO2 penalties. For instance, in point D, where the load is 1500 kWh/day and the CO2 penalty is 2.1 $/ton, the optimum system will use 89 kW PV, 100 kW bio generator, and 30 kW diesel generator. This figure also shows changing CO2 emissions under changing CO2 penalties and load demand. Changing the CO2 penalty from 2.1 to 60 $/ton, where load demand is 100 kWh/day, will not change CO2 emissions; while, where load demand is 1500 kWh/day, an increment in CO2 penalty leads to a reduction of emissions from 1185 to 116 ton/20 years. Additionally, CO2 emission will reduce from 0.26 to 116 tons/20 years where the penalty is 60 $/ton and load demand is changed from 100 to 1500 kWh/day. The last CO2 changes can be seen where load demand is changed from 100 to 1500 kWh, and the CO2 penalty is considered 2.1 $/ton. At this condition, CO2 emissions will change from 0.26 to 1185 tons/20 years.
According to the obtained results shown in Figure 11, Table 6 shows NPC values of various combinations of components for corner points of Figure 11, called A, B, C, and D. This table shows that in the case of using each combination, how much the NPC valued will be changed. To better see the impact of a different combination of components, Figure 12 shows NPC values for 8 proposed combinations shown in Figure 11 for its corner points. For instance, in the case of using combination 4 according to Table 6 for points A, B, C, and D in Figure 11, NPC values will be increased compared to selecting combination 1. According to Figure 12, the best combination for points B and D is PV, bio generator, and batteries. All in all, where the load demand is high, the effect of selecting components is significantly more on the NPC values.

5. Conclusions

In this study, the different combinations of the components are considered to find the optimum hybrid renewable systems for the Malang regency in Indonesia. After that, the different scenarios were optimized, by employing the MCDM method, the best choice scenario was selected, and some sensitivity analyses were done on the system’s most important parameters. Results showed the following findings:
  • Although the case study region was connected to the grid, an off-grid hybrid system including PV, bio generators, diesel generators, and the battery could provide demand load and fulfill environmental issues. Additionally, the mentioned system was reliable in the case of a problem with one of the components.
  • The best choice scenario had an NPC of $1.02 million and a COE of 0.188 $/kWh, where the demand load was 890 kWh/day, and the peak load was 167.2 kW. Additionally, CO2 emission would be 376 tons/20 years, which was significantly less than the scenario that used PV panels and the grid (4488 tons/20 years).
  • Sensitivity analysis of the biomass prices (1 to 40 $/ton) and diesel prices (0.4 to 2 $/L) showed that where the price of biomass is cheap (1 $/ton), changing the price of diesel would not significantly alter the capacity of bio generator and COE values. While, where the price of biomass is expensive (40 $/ton), the capacity of bio generator decreases from 55 to 20 kW and COE increases from 0.207 to 0.260 $/kWh.
  • Sensitivity analysis on the price of PV (from 750 to 2250 $/kW) and bio generator (from 320 to 1020 $/kW) resulted in the size of bio generator ranging from 40 to 70 kW and PV panels 66 to 90 kW. Additionally, where the PV panels are cheap, altering the price of bio generators does not affect the NPC values. While, in the high prices of PV panels (2250 $/kW), changing bio generator prices increases NPC and COE values from $0.94 to $1.15 million and 0.181 to 0.208 $/kWh, respectively.
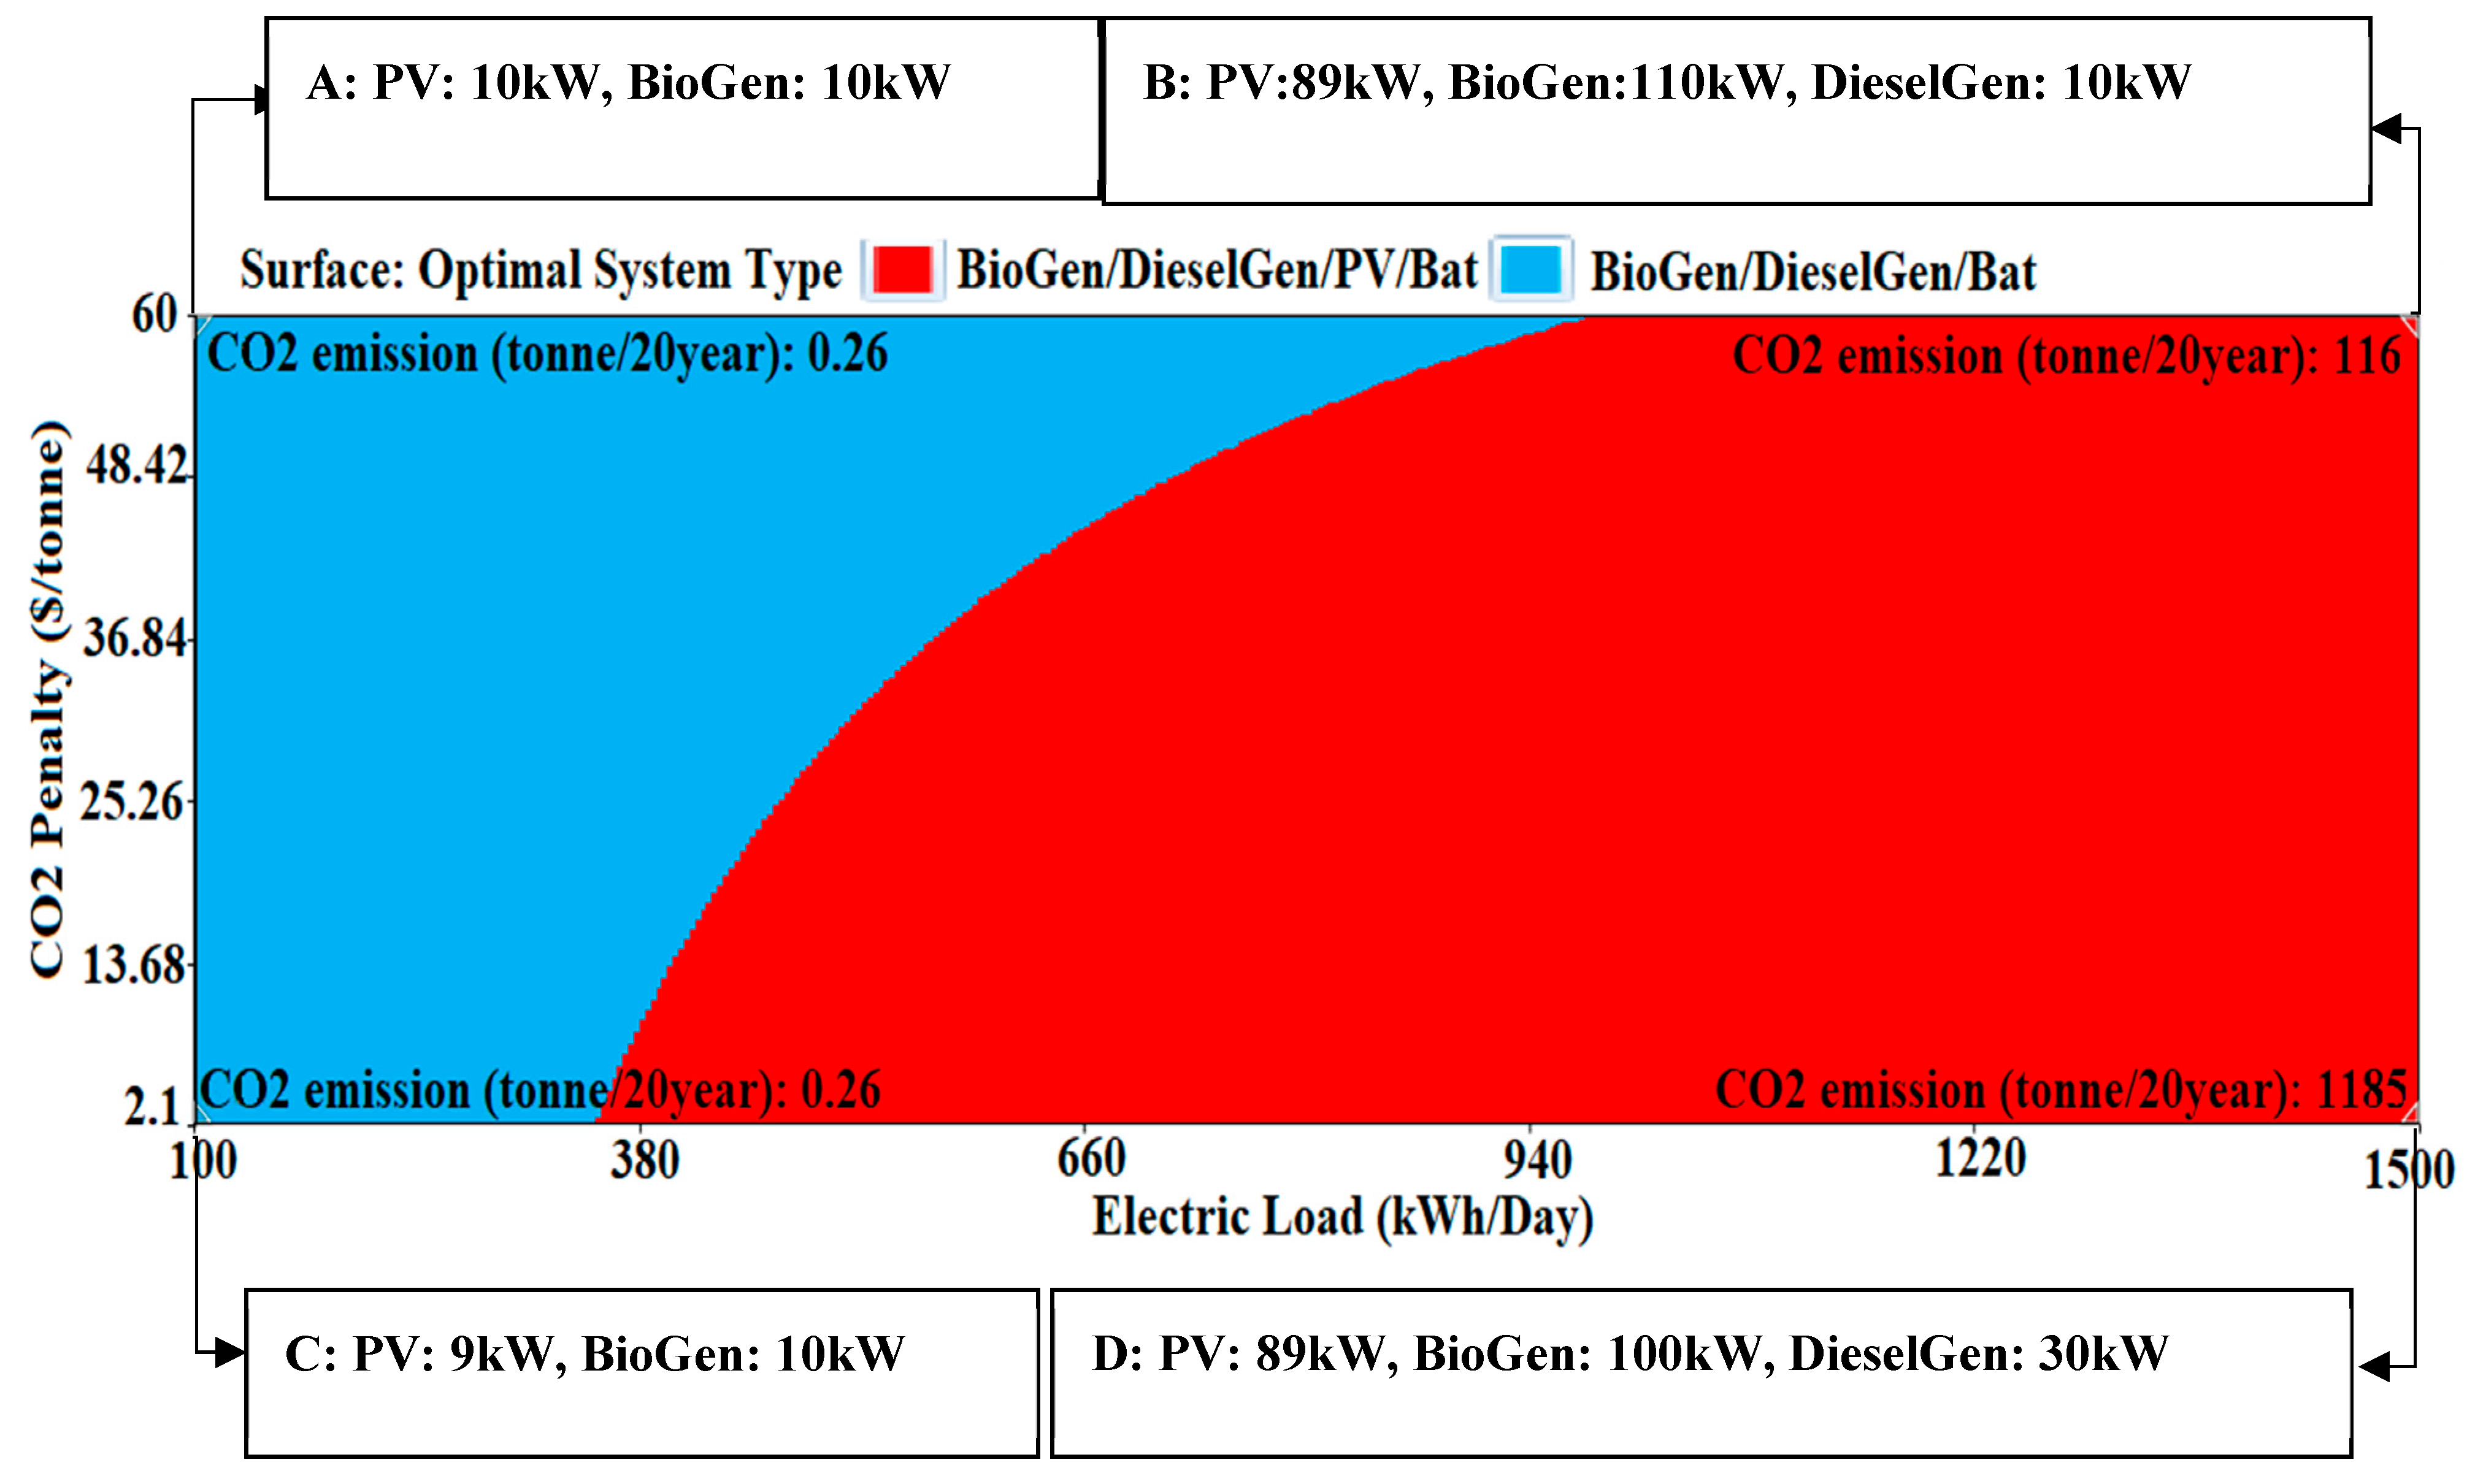
  • Sensitivity analysis of the load demand (100 to 1500 kWh/day) and CO2 penalties (2.1 to 60 $/ton) showed that these parameters could significantly affect the selecting components since the combination would result in remarkably different NPC values.
This study found that hybrid systems, including a combination of PV panels, bio generators, diesel generators, and batteries, are an effective way to reduce CO2 emissions and provide reliable electricity. Land constraints and CO2 penalties were major considerations in determining the optimal system. The results of the study can be applied to other regions with similar conditions. Additionally, sensitivity analyses were conducted to further understand the effects of different conditions on the optimization results.
The authors suggest investigating further combinations of components, such as wind turbines and geothermal energy, to provide a comprehensive study for the case study region.

Author Contributions

M.H., L.J.A., K.Y. and H.F.F. conceptualized the problem, provided the methodology and analysis and prepared the original draft. K.Y., I.A. and M.M. reviewed and edited the manuscript and provided valuable insights in the overall system. All authors have read and agreed to the published version of the manuscript.

Funding

Funded by the Scientific Research Project of Hunan Provincial Department of Education (No.22C0941).

Institutional Review Board Statement

Not applicable.

Informed Consent Statement

Not applicable.

Data Availability Statement

Data sharing not applicable.

Conflicts of Interest

The authors declare no conflict of interest.

References

  1. Fard, H.F.; Alavi, M.F.; Sharabaty, H.; Ahmadzadeh, M.; Mahariq, I. Technical Design and Economic Investigations for Reducing CO2 Emission considering Environmental Protection Agency Standards by Employing an Optimum Grid-Connected PV/Battery System. Int. J. Photoenergy 2022, 2022, 7360159. [Google Scholar] [CrossRef]
  2. Zhang, W.; Maleki, A.; Nazari, M.A. Optimal operation of a hydrogen station using multi-source renewable energy (solar/wind) by a new approach. J. Energy Storage 2022, 53, 104983. [Google Scholar] [CrossRef]
  3. Rashidi, M.M.; Mahariq, I.; Murshid, N.; Wongwises, S.; Mahian, O.; Nazari, M.A. Applying wind energy as a clean source for reverse osmosis desalination: A comprehensive review. Alex. Eng. J. 2022, 61, 12977–12989. [Google Scholar] [CrossRef]
  4. Almutairi, K.; Nazari, M.A.; Salem, M.; Rashidi, M.; El Haj Assad, M.; Padmanaban, S. A review on applications of solar energy for preheating in power plants. Alex. Eng. J. 2022, 61, 5283–5294. [Google Scholar] [CrossRef]
  5. Shabestari, S.T.; Kasaeian, A.; Rad, M.V.; Fard, H.F.; Yan, W.-M.; Pourfayaz, F. Techno-financial evaluation of a hybrid renewable solution for supplying the predicted power outages by machine learning methods in rural areas. Renew. Energy 2022, 194, 1303–1325. [Google Scholar] [CrossRef]
  6. Fard, H.F.; Khodaverdi, M.; Pourfayaz, F.; Ahmadi, M.H. Application of N-doped carbon nanotube-supported Pt-Ru as electrocatalyst layer in passive direct methanol fuel cell. Int. J. Hydrogren Energy 2020, 45, 25307–25316. [Google Scholar] [CrossRef]
  7. Guild, J. Feed-in-tariffs and the politics of renewable energy in Indonesia and the Philippines. Asia Pac. Policy Stud. 2019, 6, 417–431. [Google Scholar] [CrossRef]
  8. Tambunan, H.B.; Hakam, D.F.; Prahastono, I.; Pharmatrisanti, A.; Purnomoadi, A.P.; Aisyah, S. The challenges and opportunities of renewable energy source (RES) penetration in Indonesia: Case study of Java-Bali power system. Energies 2020, 13, 5903. [Google Scholar] [CrossRef]
  9. Indonesia, International Energy Agency. Available online: https://www.iea.org/data-and-statistics/data-product/renewables-information (accessed on 2 August 2022).
  10. Yudha, S.W.; Tjahjono, B. Stakeholder mapping and analysis of the renewable energy industry in Indonesia. Energies 2019, 12, 602. [Google Scholar] [CrossRef]
  11. Wicaksono, A. Energy Reform in Indonesia: One Year after the New Government. UQ Energy Talk. 2015. Available online: https://www.scribd.com/document/380923039/ToSendUQEnergyTalk-AgungWicaksono-IndonesiaEnergyReform (accessed on 13 October 2015).
  12. United Nations Climate Change. ENHANCED NATIONALLY DETERMINED CONTRIBUTION REPUBLIC OF INDONESIA. Available online: https://unfccc.int/sites/default/files/NDC/2022-09/23.09.2022_Enhanced%20NDC%20Indonesia.pdf (accessed on 23 September 2022).
  13. Suharsono, A.; Lontoh, L. Indonesia’s Energy Policy Briefing February. no. February 2022, pp. 2021–2030. 2023. Available online: https://www.iisd.org/system/files/2022-03/indonesia-energy-policy-briefing-february-2022-en.pdf (accessed on 22 February 2022).
  14. Bissett, N.; Ang, K.H. PLN’s New 2021–2030 Business Plan: High Hopes and ‘Greener’ Projects. 2021. Available online: https://insightplus.bakermckenzie.com/bm/attachment_dw.action?attkey=FRbANEucS95NMLRN47z%2BeeOgEFCt8EGQJsWJiCH2WAUTleh6%2BAJHrupJMOqEcbrp&nav=FRbANEucS95NMLRN47z%2BeeOgEFCt8EGQbuwypnpZjc4%3D&attdocparam=pB7HEsg%2FZ312Bk8OIuOIH1c%2BY4beLEAeghVfJ1aYVlM%3D&fromContentView=1 (accessed on 12 October 2021).
  15. Apribowo, C.H.B.; Ibrahim, M.; Purnomo, M.R.B. Design and economic analysis of floating PV-wind turbine plant for renewable energy supply in Indonesia. In AIP Conference Proceedings; AIP Publishing LLC: Melville, NY, USA, 2020; Volume 2217, p. 30191. [Google Scholar]
  16. Aisyah, S.; Aditya, I.; Syamsudin, A. Optimum hybrid renewable energy system design using HOMER: Case study Biaro Island, Indonesia. In AIP Conference Proceedings; AIP Publishing LLC: Melville, NY, USA, 2020; Volume 2255, p. 20034. [Google Scholar]
  17. Ramelan, A.; Adriyanto, F.; Apribowo, C.; Ibrahim, M.; Iftadi, I.; Ajie, G.S. Simulation and Techno-Economic Analysis of On-Grid Battery Energy Storage Systems in Indonesia. J. Electr. Electron. Inf. Commun. Technol. 2021, 3, 30–34. [Google Scholar] [CrossRef]
  18. Aprillia, B.S.; Rigoursyah, M.A.F. Design On-Grid Solar Power System for 450 VA Conventional Housing using HOMER Software. In IOP Conference Series: Materials Science and Engineering; IOP Publishing Ltd.: Bristol, UK, 2020; Volume 771, p. 12011. [Google Scholar]
  19. Kanata, S.; Baqaruzi, S.; Muhtar, A.; Prasetyawan, P.; Winata, T. Optimal Planning of Hybrid Renewable Energy System Using HOMER in Sebesi Island, Indonesia. Int. J. Renew. Energy Res. (IJRER) 2021, 11, 1507–1516. [Google Scholar]
  20. Syahputra, R.; Soesanti, I. Renewable energy systems based on micro-hydro and solar photovoltaic for rural areas: A case study in Yogyakarta, Indonesia. Energy Rep. 2021, 7, 472–490. [Google Scholar] [CrossRef]
  21. Nugroho, O.; Pramono, N.; Hanafi, M.; Husnayain, F.; Utomo, A.R. Techno-economic analysis of hybrid Diesel-PV-Battery system and hybrid Diesel-PV-Wind-Battery system in Eastern Indonesia. IOP Conference Series: Earth and Environmental Science; IOP Publishing Ltd.: Bristol, UK, 2020; Volume 599, p. 12031. [Google Scholar]
  22. Rumbayan, M.; Nakanishi, Y. Prospect of PV-wind-diesel hybrid system as an alternative power supply for Miangas Island in Indonesia. Int. J. Smart Grid Clean Energy 2019, 8, 402–407. [Google Scholar] [CrossRef]
  23. Hiendro, A.; Kurnianto, R.; Rajagukguk, M.; Simanjuntak, Y.M. Techno-economic analysis of photovoltaic/wind hybrid system for onshore/remote area in Indonesia TURBINE AC LOAD BATTERY GENERATOR. Energy 2013, 59, 652–657. [Google Scholar] [CrossRef]
  24. Rumbayan, M.; Sompie, S.; Ruindungan, D.; Panjaitan, N. Design of a Photovoltaics Stand-Alone System for a Residential Load in Bunaken Island Using HOMER. IOP Conference Series: Earth and Environmental Science; IOP Publishing Ltd.: Bristol, UK, 2021; Volume 927, p. 12039. [Google Scholar]
  25. Christina, B. UPDATE 2-Indonesia to Raise Electricity Tariffs for Some Customers-Official. Available online: https://www.reuters.com/article/indonesia-power-idINL1N2Y002U (accessed on 13 June 2022).
  26. Office of Assistant to Deputy Cabinet Secretary for State Documents & Translation. Gov’t Adjusts Electricity Tariffs. 2022. Available online: https://setkab.go.id/en/govt-adjusts-electricity-tariffs/ (accessed on 13 January 2022).
  27. Trisnawati, M. [INFOGRAPHIC] Electricity Tariff Increases On 1 July 2022, Here Are the Details. 2022. Available online: https://voi.id/en/economy/180779/infographic-electricity-tariff-increases-on-july-1-2022-here-are-the-details (accessed on 1 July 2022).
  28. Faizi, M.F.; Robinson, J.R.; Bergbau, V.B.B.; Donalek, J.G. Government Regulation No. 50 of 2017 on Utilization of Renewable Energy Sources for Power Supply. Available online: https://policy.asiapacificenergy.org/sites/default/files/Government%20Regulation%20No.%2050%20of%202017%20on%20UTILIZATION%20OF%20RENEWABLE%20ENERGY%20SOURCES%20FOR%20POWER%20SUPPLY.pdf (accessed on 5 June 2014).
  29. U.S. Environmental Protection Agency. Greenhouse Gas Reporting Program: Industrial Profile: Power Plants Sector. no. September. 2019. Available online: http://www.eia.gov/electricity/data/browser/#/topic/0?agg=2 (accessed on 24 December 2022).
  30. Asian Development Bank. Renewable Energy Tariffs and Incentives in Indonesia: Review and Recommendations; Asian Development Bank: Mandaluyong, Philippines, 2020. [Google Scholar]
  31. Asian Development Bank. Unlocking Indonesia’s Geothermal Potential; Asian Development Bank: Mandaluyong, Philippines, 2015. [Google Scholar]
  32. Solar AI Technologies. Solar Panel Indonesia—Price of Installation and Maintenance. 2022. Available online: https://getsolar.ai/blog/solar-panel-installation-maintenance-price-indonesia/ (accessed on 26 April 2022).
  33. Thoubboron, K. What Size Solar Inverter Do I Need? 2018. Available online: https://news.energysage.com/what-size-solar-inverter-do-i-need/ (accessed on 29 November 2018).
  34. Overall View of the Case Study Region on the Map. Available online: https://earth.google.com/web/search/7°+58.5’S++112°+40.8’E/@-7.96784148,112.66997977,441.17259322a,19017.64822589d,35y,0h,0t,0r/data=CigiJgokCT3oUEfSWx_AETHjle9YRyDAGTSlLIP_L1xAIZISNcN2JlxA (accessed on 24 December 2022).
  35. Xu, A.; Awalin, L.; Al-Khaykan, A.; Fard, H.; Alhamrouni, I.; Salem, M. Techno-Economic and Environmental Study of Optimum Hybrid Renewable Systems, Including PV/Wind/Gen/Battery, with Various Components to Find the Best Renewable Combination for Ponorogo Regency, East Java, Indonesia. Sustainability 2023, 15, 1802. [Google Scholar] [CrossRef]
Figure 1. Electricity generation from renewables.
Sustainability 15 03297 g001
Figure 2. Overall view of the case study region, Malang, Indonesia.
Sustainability 15 03297 g002
Figure 3. Solar radiation and clearness index of the selected location.
Sustainability 15 03297 g003
Figure 4. Seasonal load demand of the selected location, a residential usage.
Sustainability 15 03297 g004
Figure 5. Schematic view of the proposed hybrid systems.
Sustainability 15 03297 g005
Figure 6. The obtained Pi values from MCDM method vs. scenarios.
Sustainability 15 03297 g006
Figure 7. Technical results of the components in scenario 4 (S4). (a) PV power output (b) State of the batteries charge (c) Diesel generator power output (d) Bio generator power output.
Sustainability 15 03297 g007
Figure 8. Load demand and power production curves for scenario 4 (S4).
Sustainability 15 03297 g008
Figure 9. Sensitivity analysis on biomass and diesel fuel prices under scenario 4.
Sustainability 15 03297 g009
Figure 10. Sensitivity analysis on PV and bio generator prices under scenario 4. “(*)” means the value mentioned in the axis must be multiplied to the primary considered value of the parameter in the text.
Sustainability 15 03297 g010
Figure 11. Sensitivity analysis on load demand and CO2 penalties under scenario 4.
Sustainability 15 03297 g011
Figure 12. NPC values for 8 proposed combinations mentioned in Table 6 for the corner points of Figure 11.
Sustainability 15 03297 g012
Table 1. Electricity capacity and shortage in Indonesia.
SystemCapacity (MW)Shortage (%)
Aceh-Sumat1788−9
Bangka130−10.8
Sumbar-Riau1194−2.7
Sumbagsel1493−4.1
Kalbar406−8.4
Kalselteng543−0.2
Suluttenggo520−6.8
Mauku140−3.8
Kaltimra467+0.9
NTT141+9.9
Papua205+5.8
Jawa-Bali23,900+31
Sulselbar1024+21.6
Table 2. Some of the hybrid renewable energy systems studied in Indonesia.
ReferenceLocationUsageHybrid SystemGridCOE ($/kWh)RF (%)
[15]MaduraResidentialPV/Wind/GridOn/Grid0.08583
[16]BiaroResidentialPV/Wind/Gen/BattOff/Grid0.20444.3
[17]SurakartaResidentialPV/Batt/GridOn/Grid1.03
[18]BandungResidentialPV/Batt/GridOn/Grid0.04642.4
[19]SebesiResidentialPV/Wind/Gen/BattOff/Grid0.28891.1
[20]YogyakartaResidentialPV/Micro-hydro/GridOn/Grid0.13100
[21]EastResidentialPV/Wind/Gen/BattOff/Grid0.15647
[22]MiangasResidentialPV/Wind/Gen/BattOff/Grid0.3282
[23]TemajukResidentialPV/Wind/BattOff/Grid0.75100
[24]BunakenResidentialPV/BattOff/Grid0.26995
Table 3. Proposed scenarios and configuration of the hybrid renewable systems.
ScenarioCombinationConstraintsBio SearchDiesel SearchDispatch (Dis)
S1PV-Bio-Bat-70, 75, 80-LF, CC, CD, PS
S2PV-Bio-BatPV limited Up to 90 kW55, 60, 65-LF, CC, CD, PS
S3PV-Bio-Diesel-Bat-34, 36, 38FreeLF, CC, GO
S4PV-Bio-Diesel-BatPV limited Up to 90 kW45, 50, 5510, 12, 14LF, CC, GO
S5PV-Bio-Grid-Bat-Free-LF, CC
S6PV-Bio-Grid-BatPV limited Up to 90 kW5, 10, 15-LF, CC
S7PV-Diesel-Bat--15, 20, 25LF, CC, CD, PS
S8PV-Diesel-BatPV limited Up to 90 kW-45, 50, 55LF, CC, CD, PS
S9PV-Diesel-Grid-Bat--FreeLF, CC, CD
S10PV-Diesel-Grid-BatPV limited Up to 90 kW-FreeLF, CC, CD
S11PV-Grid-Bat---LF, CC, CD
S12PV-Grid-BatPV limited Up to 90 kW--LF, CC, CD
S13PV-Bio-Diesel-Grid-Bat-FreeFreeLF, CC, GO
S14PV-Bio-Diesel-Grid-BatPV limited Up to 90 kWFreeFreeLF, CC, GO
Table 4. Obtained results from HOMER software for the proposed systems.
ScenNPC
(M$)
COE ($/kWh)Emission (ton/20-Year)Excess El (%)PV (kW)Bio
(kW)
Diesel
(kW)
Bat
(kW)
Grid
(%)
Dis
S11.040.1922.47.3886.77501520CC
S21.310.2422.183.03906003220CC
S31.020.1883315.9896.73893000CC
S41.020.1883764.558750122290CC
S50.7140.13144833.676750165CC
S60.7130.13145572.716210167CC
S71.30.24199312.31910207520PS
S81.490.27634117.4890501960CC
S90.7130.13144833.676605166CC
S100.7130.13145572.716205167CC
S110.7120.13144883.516600066CC
S120.7120.13144993.336500066CC
S130.7120.13144883.516600066CC
S140.7120.13144993.336500066CC
Table 5. Cost summary of Scenario 4 (S4).
ComponentCapital ($)Replacement ($)O & M ($)Fuel ($)Salvage ($)Total ($)
Generic 1 kWh Li-Ion$91,600.00$76,997.85$38,354.08$0.00$0.00$206,951.93
Biogas Generator $40,000.00$99,362.79$303,482.94$45,439.87($10,625.05)$477,660.56
Diesel Generator $3000.00$4980.37$12,523.19$83,713.11($488.87)$103,727.82
LONGi Solar LR6-60$130,482.11$0.00$58,276.81$0.00$0.00$188,758.93
Other$0.00$0.00$16,618.62$0.00$0.00$16,618.62
System Converter$18,122.80$13,964.89$0.00$0.00($8535.27)$23,552.42
System$283,204.91$195,305.90$429,255.65$129,152.99($19,649.18)$1,017,270.28
Table 6. NPC values for different components configurations in corner points of Figure 11.
Combination Point in Figure 11ABCD
1Bio/PV/Bat125,4861,825,481121,4461,825,257
2Bio/Diesel/PV/Bat136,2251,818,818130,4271,784,735
3Bio/Bat152,7272,089,029147,8472,081,728
4Diesel/PV/Bat164,7692,842,375156,3772,517,274
5Bio/Diesel/Bat173,9611,986,028159,1461,934,680
6Bio/Diesel233,7392,538,969216,8792,401,256
7Bio/Diesel/PV235,1262,493,939217,6472,340,140
8Diesel/Bat256,7033,428,611217,7632,989,894
Disclaimer/Publisher’s Note: The statements, opinions and data contained in all publications are solely those of the individual author(s) and contributor(s) and not of MDPI and/or the editor(s). MDPI and/or the editor(s) disclaim responsibility for any injury to people or property resulting from any ideas, methods, instructions or products referred to in the content.

