Article

Eco-Innovation Performance of Lithuania in the Context of European Environmental Policy: Eco-Innovation Indicators and Efficiency

by
Bahman Peyravi
*,
Kęstutis Peleckis
and
Artūras Jakubavičius
Faculty of Business Management, Vilnius Gedimino Technical University, Sauletekio al. 11, 10223 Vilnius, Lithuania
*
Author to whom correspondence should be addressed.
Sustainability 2023, 15(4), 3139; https://doi.org/10.3390/su15043139
Submission received: 19 December 2022 / Revised: 31 January 2023 / Accepted: 1 February 2023 / Published: 9 February 2023
(This article belongs to the Special Issue Energy Consumption and Economic Growth)

Abstract

:
The European Union (EU) has made eco-innovation and green technology a priority as they are essential to the continent’s long-term prosperity. To move towards sustainable economic growth, eco-innovation takes a significant role in the transition process. The aim of the article is to use the eco-innovation indicators as an instrument to measure the eco-innovation performance of Lithuania in the context of the EU Green Deal in order to analyze and assess the components and indicators of the eco-innovation index for Lithuania. Following the aim of the article, a set of research hypotheses will be formulated. The evaluation of eco-innovation indicators in Lithuania relative to EU countries using Eco-IS indicators, determination of eco-innovation efficiency using the Decision-Making Trial and Evaluation Laboratory (DEMATEL) method, and identification of necessary eco-innovation policies for sustainable growth are the objectives of this paper. The research results present the positive impact of eco-innovation activities in the EU on Lithuania, and vice versa. Lithuania was affected positively by eco-innovation activities of other EU nations. The outcome of the study indicates its relevance by highlighting Lithuania’s position among the lowest countries in terms of eco-innovation adoption, hence new research pathways for the creation and implementation of policies to solve the current situation are provided.

1. Introduction

Increasing demand for energy and resources, rapid urbanization, increased consumer habits, pollution, and the amount of waste generated by the industrial revolution all contribute to the challenge of sustainability. Following World War II, the world experienced its most rapid development. Oil, gas, synthetic materials, and low-cost energy were all part of the economic expansion plan. The negative implications of mass production acquired significance in the early 1970s with the inclusion of simulation studies on the future of the international economy [1]. Degradation of the environment and climate change have compelled governments and corporations to incorporate sustainability into their strategic decisions. In the forefront of these publications are the Stockholm Conference (1972) and the “Limits to Growth” report sponsored by the Club of Rome. Although environmental issues appear to have been afforded a higher political importance in industrialized nations during the 1970s and 1980s, there is no sense of the situation’s urgency [2]. Increased product consumption, energy production, and transportation, as well as greenhouse gas emissions that produce climate change, significantly harm the Earth’s eco-system, presenting a global problem. On the other hand, one in every nine persons in the globe, or in another phrase, 821 million people, suffer from hunger and malnutrition [3]. With the publication of reports such as the Vienna Convention on the Protection of the Ozone Layer (1985), the Brundtland Report “Our Common Future” [4], and the first International Federation of Clinical Chemistry (IFCC) report (1988), the focus shifted from the aforementioned issues to the negative effects of production and sustainable growth.
In the early 1970s, environmental pollution, climate change, acid rain, toxic wastes, depletion of natural resources, carbon emissions, and global warming began to be recognized and discussed; however, today, as the importance of sustainable growth is recognized, the number of studies in this field is increasing rapidly, with the primary goal of public policy being to ensure sustainable growth; in addition, owing to current global changes, both social and economic businesses should recognize the importance of sustainable growth. The concept of innovation, which is characterized as the engine of economic growth, is supplanted by the concept of eco-innovation as the concept of economic growth is replaced by the concept of sustainable growth, which prioritizes environmental challenges and their solutions. As the importance of eco-innovation in strategic decisions increases and corporate sustainability improves, the purpose of this study is to assess eco-innovation indicators and eco-innovation efficiency in Lithuania relative to other EU nations. The objectives of this study are to evaluate the eco-innovation indicators in Lithuania relative to EU countries using Eco-IS indicators, determine eco-innovation efficiency using the Decision-Making Trial and Evaluation Laboratory (DEMATEL) method, and identify eco-innovation policies required for sustainable growth. Eco-definition, innovation’s objective, types, determinants, and evaluation are described in the second half of the study. In the third section of the study, eco-innovation indicators in Lithuania are compared to those in other EU nations, and methodological details regarding the DEMATEL data technique are offered. In the fourth section, the research findings are provided alongside an evaluation of Lithuania’s eco-innovation effectiveness. Discussions, conclusions, and recommendations conclude the study. The finding of this study redounds to the benefit of society considering that eco-innovation refers to any new technology or innovation that significantly contributes to environmental solutions and sustainable development. This could include innovations that lessen the environmental effect of manufacturing, strengthen the resilience of nature, or make more efficient use of natural resources.

2. Eco-Innovation and Eco-Efficiency

Growing environmental consciousness at the national and international levels has shown the need for a robust environmental policy mandating the reduction of environmental issues and the shift to greener and cleaner production technologies. People in industrialized nations consume tens of times more resources than those in underdeveloped ones; hence, economic development is correlated with resource consumption [5]. Industry must not only reframe its social and economic duties regarding the environment, but also invest in eco-innovation activities that maximize economic gain while minimizing environmental harm [6]. In the literature, eco-innovation [7] was formulated in various ways, such as Green Innovation [8,9], Sustainable Innovation [10,11], Ecologic Innovation [12,13], and Environmental Innovation [14,15]; however, the concept of eco-innovation has been used significantly in recent years [16]. The term “eco-innovation” refers to the development of novel and economically viable goods, processes, systems, services, and design processes that satisfy human needs while reducing the consumption of natural resources and the emission of hazardous chemicals through their existence [17]. Even while research on eco-innovation has expanded in recent decades and the influence of eco-innovation on sustainability is still uncertain, the social and political significance of eco-innovations on the basis of sustainable growth has increased. As the significance of eco-innovation in strategic decision-making increases, the sustainability of businesses improves [18]. There are few studies on the relationship between eco-innovation and sustainability, although there are numerous studies on the relationship between eco-innovation activities and social, economic, and environmental development [19,20,21]. The European Commission launched the Eco-Innovation Action Plan (EcoAP), which supports eco-innovative processes, goods, and services, in 2011 as part of the Europe 2020 agenda and the “Innovation Union” project [22,23]. Eco-innovation is the intersection of economic gain, environmental innovation, and social consciousness [24].
In fact, when we delve deeper into the past, Rio de Janeiro, Brazil, hosted the United Nations Conference on Environment and Development (UNCED), often known as the “Earth Summit”, from June 3 to June 14, 1992. On the 20th anniversary of the first Human Environment Conference, which took place in Stockholm, Sweden in 1972, this global conference was organized. It brought together political leaders, diplomats, scientists, media representatives, and non-governmental organization leaders to address the environmental effects of global social and economic activity. The Rio de Janeiro summit brought to light the connection between social, economic, and environmental issues, as well as the necessity for action in several sectors to ensure that successes in one area may be sustained over time and influence other determinants of sustainability. The primary objective of the Rio “Earth Summit” was to establish a comprehensive agenda and a new strategy for global action on environmental concerns, which would lead to international cooperation and the adoption of shared policies. Businesses were attentive to environmental protection as a result of investments in environmental awareness. Kuo and Smith (2018) mentioned that, initially, eco-innovation was defined by Fussler and James in 1996 as the act of inventing a new product, process, or service that produces value for the user and the company while dramatically reducing environmental concern (damages) [25], and suggested that consumer knowledge of the environment and societal expectations offer firms opportunities to gain a competitive edge. Indeed, company executives must adapt to these social forces in order to preserve their markets, maintain social acceptability, and sustain their companies’ existence. Consequently, eco-innovation was characterized differently by other scholars in the years that followed, including Hojnik and Ruzzier (2016) [26], Gasior et al. (2022) [27], Oltra and Saint Jean (2009) [28], and Molina et al. (2018) [29]. Nonetheless, one of the most important definitions of eco-innovation can be found in the work of Kemp and Pearson (2007) [30]. Departing from the Oslo manual, they defined eco-innovation as the “production, application, or exploitation of a novel good, service, production process, organizational structure, management, or business method that results, throughout its lifecycle, in a reduction of environmental risk, pollution, and the negative impacts of resource use (including energy use) compared to relevant alternatives”. According to this definition, eco-innovation encompasses all new processes that increase resource efficiency, and the term is mostly based on an assessment of environmental benefits and dangers as a whole. In accordance with the sustainable growth strategies of the European Union, the Eco-Innovation Observatory (EIO) defines eco-innovation as the introduction of a new or significantly improved product, process, organizational change, or marketing method that reduces the use of natural resources and the release of harmful substances [31,32]. The EIO, similar to the Oslo Manual, categorized eco-innovation into four primary groups as product eco-innovation, process eco-innovation, organizational eco-innovation, and marketing eco-innovation [17]. Some studies in the literature place greater emphasis on the relationship between the environmental aspects of product and process eco-innovation [10]. Rennings (1998) [33] categorizes eco-innovations as technological, organizational, and social, taking non-commercialization of the eco-innovation into mind, and thus defines corporate eco-innovation. Innovation based on sustainability examines systems holistically; it addresses the entire process, from resource generation to production, consumption, and renewal. It changes the basis of competitiveness, the source of differentiation, and the character of consumption on a global scale [34]. Innovation and eco-efficiency are both key components of national and international economic strategy, as well as strategic components of sustainable development. There are numerous reasons why innovation is crucial, including those mentioned in [11]; in other words, to strike a balance between environmental safeguards and economic considerations. Innovations developed within the framework of environmental policy frequently increase competitiveness by reducing costs and bring benefits by opening new markets; new production processes and technologies, renewable energy systems, or infrastructure frequently require innovation and aim to strike a balance between economic, social, and environmental considerations; and environmental products and processes are already a part of business operations. Innovation improves the efficacy and profitability of businesses, enables their entry into new markets, and secures the expansion of the existing market. Consequently, innovation is a crucial factor that promotes employment growth, sustainable development, social welfare, and quality of life. In the face of global competition, enterprises unable to capture environment-related innovation and make change permanent would perish [35]. Eco-efficiency is one of eco-innovation’s most essential goals. Eco-efficiency is the maximization of added value while minimizing resource usage and ecological impact [36]. Only the development of clean manufacturing technologies, waste management, and system innovation (new product/service systems) can ensure eco-efficiency [37]. These measures aim to increase the added value and reduce the environmental effect. To attain eco-innovation objectives, eco-determinants of innovation must be identified. Horbach (2008) [38] outlines supply, demand, and technology as the factors of eco-innovation. Institutional and political effects on the supply side include cost savings, market characteristics, sustainable innovations, risks and ambiguities, knowledge level and workforce, and time interval. The demand side includes demand-pull and social consciousness. Environmental policies, organizational structure, and global pressures are the institutional and political determinants of the components. Despite the fact that rules, incentives, market needs, and technical advancements are major catalysts for the fulfilment of this responsibility, firms might disregard and avoid their responsibilities by viewing essential (sustainable-based) expenditures as a cost element. Regulations and obligations for sustainability, on the one hand, and cost considerations, on the other, are the primary issues for enterprises [24]. Diaz-Garcia et al. (2015) [16] split eco-innovation drivers into three categories: micro, meso, and macro. Micro-level drivers include structural factors, strategy and business logic, resources, and capacities; meso-level drivers include market dynamics, finance, networks, pressure groups, and industry; and macro-level drivers include policy instruments, education policy, technology systems, and regional variables. As technological, financial, labor-related, regulatory, consumer-related, supplier-related, and management constraints, they can be handled comprehensively [39]. ETAP (European Commission’s Environmental Technologies Action Plan) identifies economic barriers, regulatory barriers and standards, technological barriers, and dissemination barriers as the primary obstacles to eco-innovation [40].
The measurement of eco-innovation at the company, industry, regional, national, or international level serves many purposes. Given that eco-innovation is a process and that the product’s life cycle must be comprehended in order to detect environmental impacts, measuring eco-innovation is extremely complex [41,42]. Despite the fact that there are different approaches to the measurement of eco-innovation in the literature, the studies appear to be focused on some methods and variables.
The most common methods used in eco-innovation measurement can be grouped under three headings as survey analysis, patent analysis, and digital and documentary resource analysis [30]. In these studies, four different measurements are used, including input measurement, intermediate output measurement [43], and direct and indirect measurement (Arundel and Kemp, 2009 [7]). The primary objective of the EU’s revised growth strategy is to develop a sustainable environmental strategy for a prosperous society based on a resource-efficient, competitive economy where the industrial production and manufacturing production plays an important role [44,45,46]. The new strategy’s major challenge is economic and industrial growth that is resource-independent as well as greenhouse emissions. Eco-innovation has been at the center of European policy during the past few years as a result of the EU’s drive to attain a cleaner natural world and environment protection, competition, carbon neutrality, sustainable economic growth, social equity, and prosperity. Effective adaptation of industrial companies to continuing changes through the creation and execution of eco-innovation is necessary to achieve a balance between the pursuit of higher economic competitiveness in import and export activities and a clean environment [47]. The scientific and practical perspective focuses on studying the problems of innovation and sustainable development and their interrelationship in terms of the impact of eco-innovation activities on the long-term viability of businesses, where loans to the private sector take significant potency [48]. At the same time, it should be noted that this component of the manifestation of the two phenomena has not been thoroughly researched and discussed in the scientific literature. The study of eco-innovation and sustainable development, as well as their interactions, is critical to the growth of modern industrial businesses [49]. Thus, hypotheses are formulated as follows (Figure 1): There is a relationship between Y1 indicators and X indicators (H1); There is a positive interaction between Y1 and Y2 (H2); There is a nexus between Y1 eco-innovation indicators (Internal) (H3); There is a nexus between Y2 eco-innovation indicators (Internal) (H4).
Among the most important aims of assessing eco-innovation are the evaluation of implemented policies through national or international comparisons and the promotion of a more environmentally conscious economy or sector [50]. The completion of these analyses depends on achieving national eco-innovation standards. Eco-IS (Eco-Innovation Scoreboard) determines these values for EU member states at the national level.
Using the Eco-IS index, the values and performance of eco-innovation in Lithuania could be evaluated and the policies required for cleaner manufacturing could be determined.

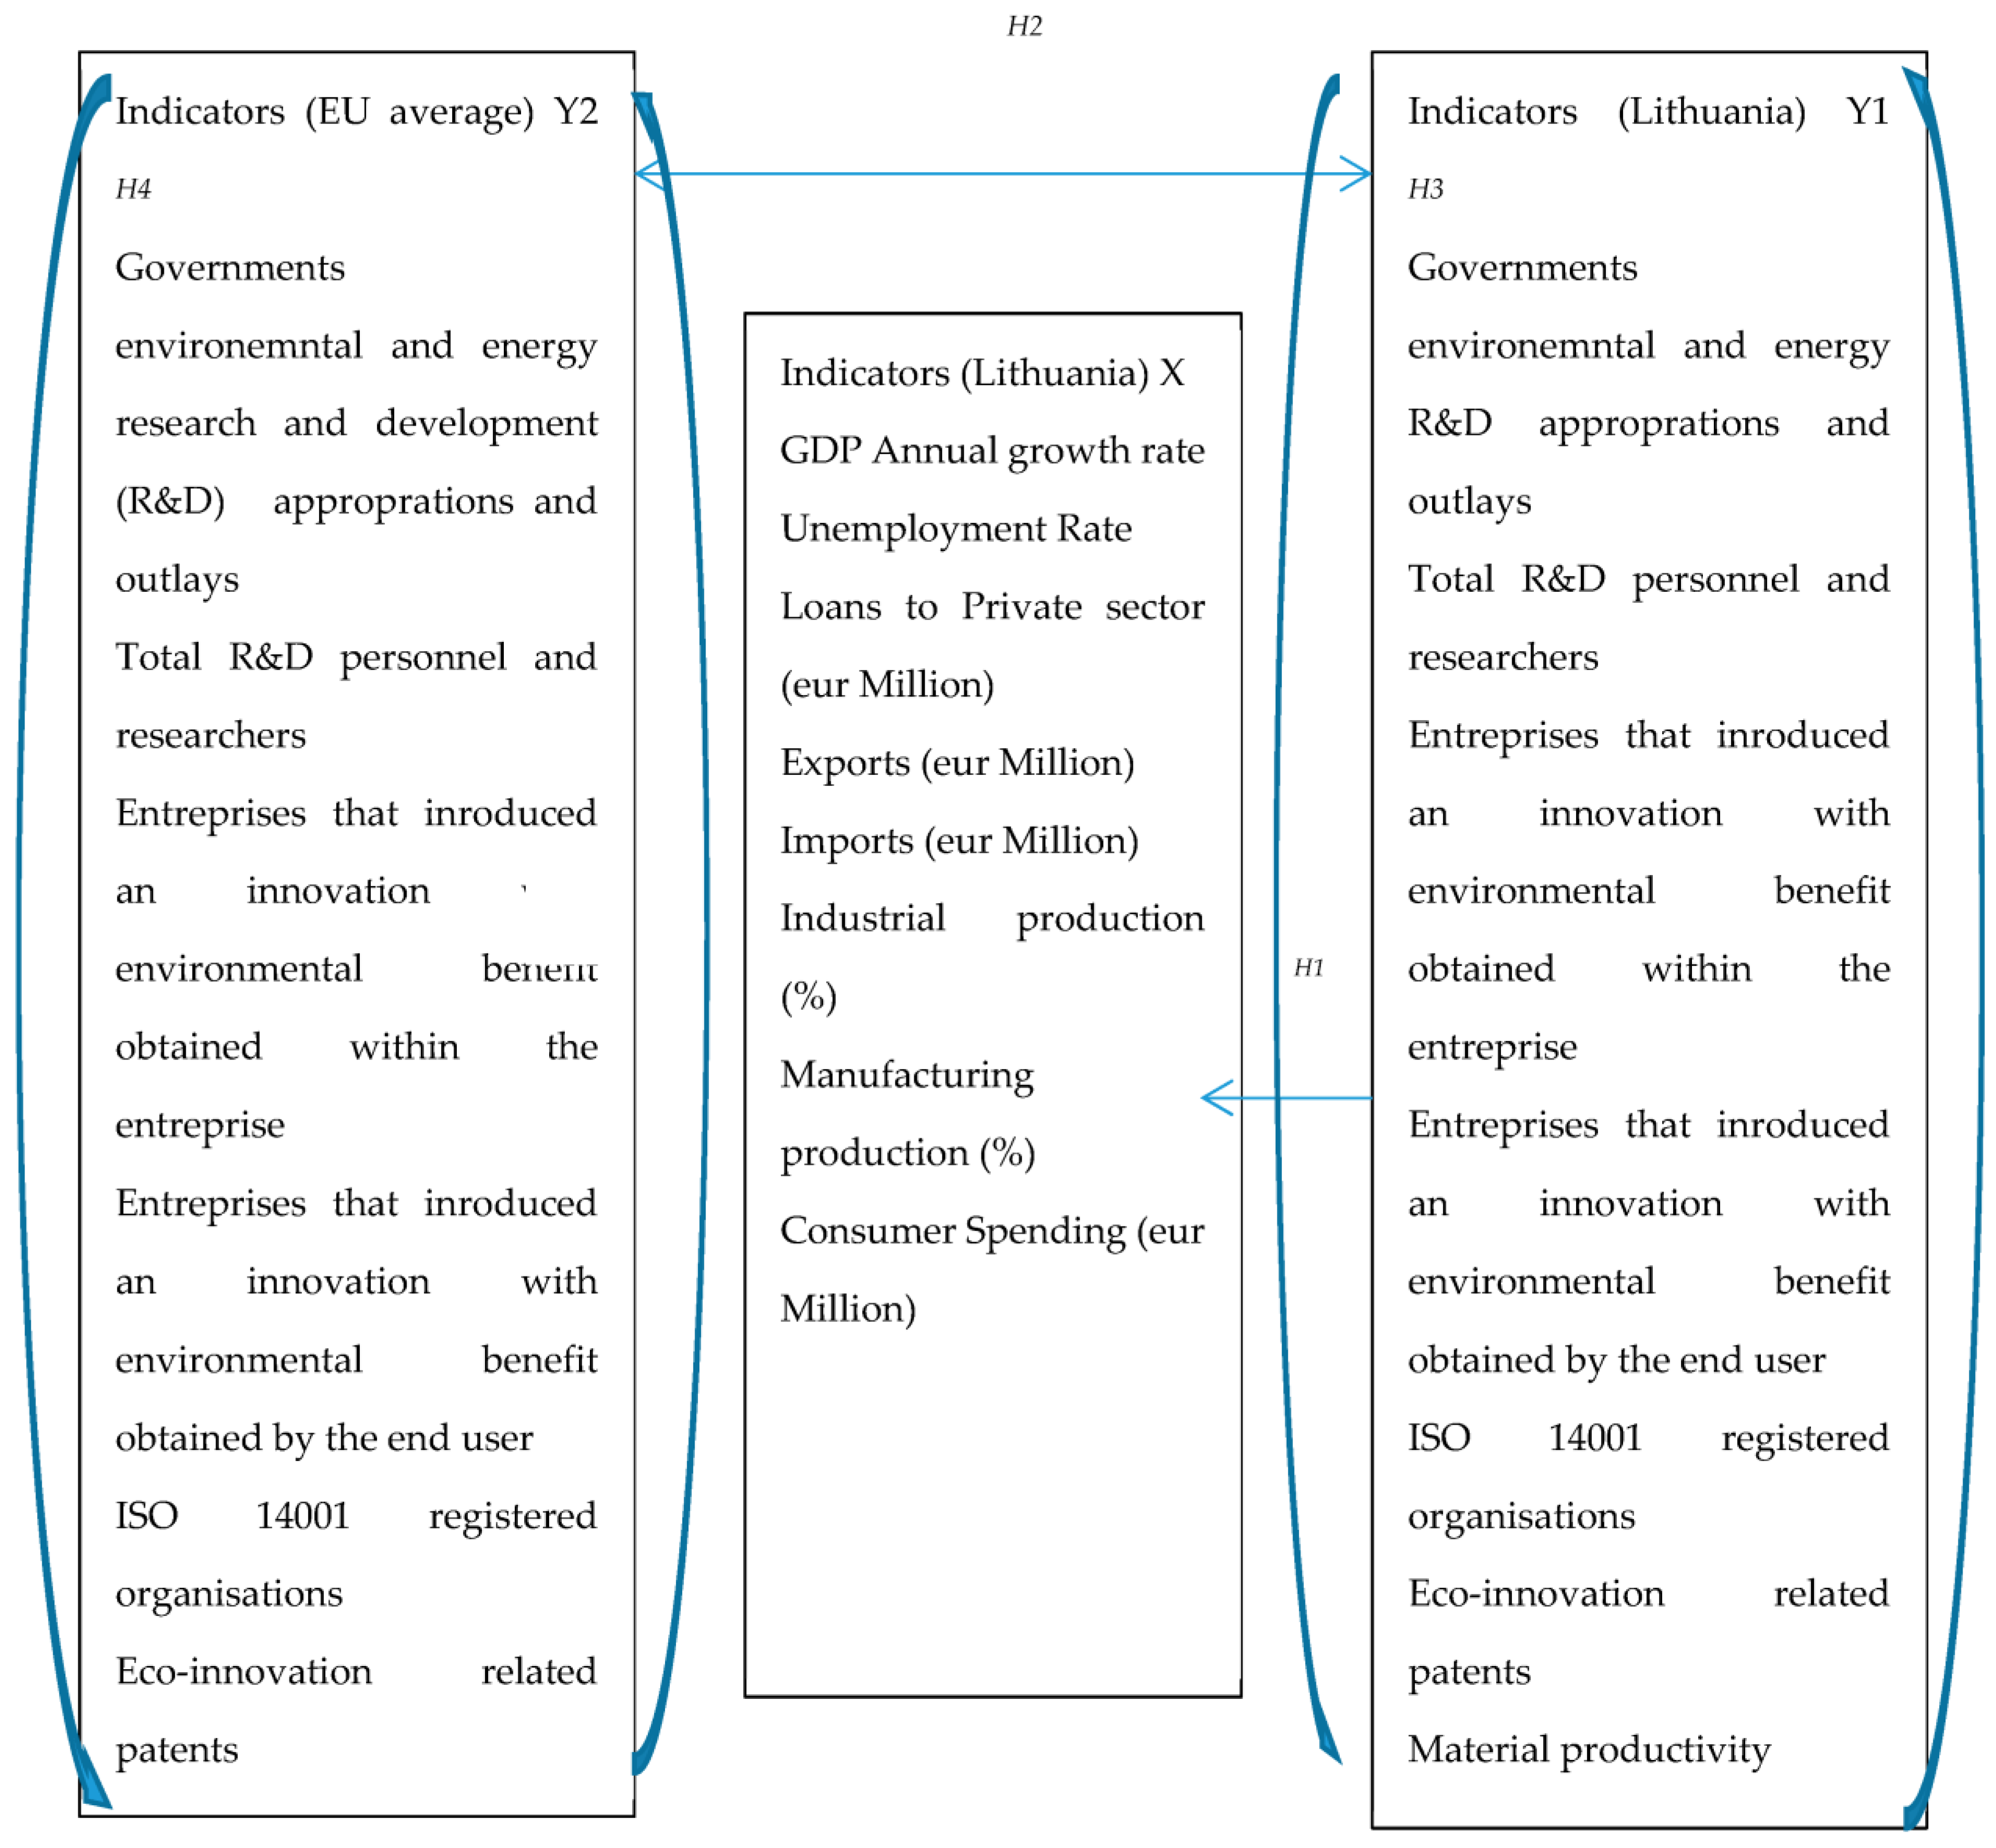
3. Research Methodology

In this study, the Decision-Making Trial and Evaluation Laboratory (DEMATEL) methodology is proposed for researching and solving complex and intertwined problem groups owing to its ability to verify interdependence between variables and attempt to improve them by providing a specific chart to reflect interdependence between variables. Experts play a complimentary and approving role in all processes and portions of this method. Clarification of significant elements will be accomplished by the use of the direct-influenced matrix, and then the priority of each component will be defined. This methodology is capable of verifying dependency among unanticipated aspects or attributes, as well as revealing the characteristic’s relationship to an essential system and growth, attempting to reflect the interrelationship between variables by enhancing the directed graph [51,52,53,54,55,56]. Furthermore, DEMATEL aids in the identification of practical solutions, specific problems, and most importantly the cluster of comorbidities. The final output of the DEMATEL method is the impact relation map (IMR). Initially, the direct-influenced matrix must be constructed before DEMATEL can be used. The following step is to calculate the normalization of the matrix that is directly influenced. The subsequent step is to obtain the whole relation matrix, which enables the production of the causal diagram. The fourth step is to obtain the impact relationship map and inner dependence matrix, and the fifth and final step is to acquire inner dependence when the sum of each column in the total-relation nn matrix is equal to 1 via the normalization method.
Ten experts took part in the research process. The experts were selected according their experience in the field of innovation management and economics with a minimum of 10 years’ experience according to geographical location and education level. (1) Expert A: Professor at the management department, VGTU; (2) Expert B: Client development executive at international furniture manufacturing company, B2B, Lithuania; (3) Expert C: Expert at Vilnius municipality, environment and energy; (4) Expert D: Expert at Ministry of Economy and Innovation, Baltic Region, Economic Development Department; (5) Expert E: Associate Professor. Lead Research Fellow, Energy Economics and Efficiency, Environmental and Resource Economics; (6) Expert F: Director at Department for Regional Development and Entrepreneurship, Latvia; (7) Expert G: Expert at Lithuanian Innovation Center; (8) Expert H: Economy analyst at SME support agency, Lithuania; (9) Expert I: Expert at National Agency for Regional Development; (10) Expert J: Independent member on supervisory board, Modus, Lithuania.

4. Research Results

The Eco-IS index is a composite index comprised of 16 indicators compiled into five components: eco-innovation inputs, eco-innovation activities, eco-innovation outputs, resource efficiency results, and socio-economic outcomes. While eco-innovation inputs, eco-innovation activities, and eco-innovation outputs are all directly related to eco-innovation, resource efficiency outputs and socio-economic consequences linked with eco-innovation effects are not [57]. To obtain an EU average that corrects for the bias of smaller Member States, country-specific values for a single indicator are weighted by population share. Consequently, the EU average of a sub-indicator represents the weighted mean of country-specific data from all EU-28 Member States [58]. To normalize the data collection, min-max normalization is applied, which scales each value so that it lies between 0 and 1. This enables the indexes to be combined to form the composite index. The overall index score for each of the EU-28 Member States is produced by taking the mean of the 16 sub-indicators and assigning each the same weight. Thus, there is no bias between the various index sections. Setting the EU average to 100 means that nations with numbers higher than the EU average will receive a score higher than 100, while countries with numbers lower than the EU average would receive a score lower than 100, based on their deviations from the EU average. The eco-innovation index indicates a country’s eco-innovation relative to other nations. According to the 2018 index values of the 28 EU member states, Luxembourg, Germany, Sweden, Finland, Austria, and Denmark make up the group of eco-innovation leader countries, whereas the countries with an index value of 83 or less are known as eco-innovation catchers. Eco-innovation inputs are investments (financial, human, and technical resources) that serve as a catalyst for eco-innovation activities in businesses, research institutes, and other organizations. Total R&D professionals and researchers (percent of total employment) is the most comprehensive measurement of a nation’s innovation capacity. Owing to the difficulty in collecting a precise count of workers and researchers active in environmental R&D, the total number of R&D personnel is utilized to calculate the eco-innovation index. Fikrli (2022), in their research based on studies of the eco-innovation performance, presented valuable measures on Lithuania. While the ratio of R&D professionals and researchers (percent of total employment) in Lithuania was 0.58 percent on average between 2010 and 2018, it rose to 0.62 percent in 2018. Although the average unemployment rate of EU member states is 1.35 percent, which is roughly twice that of Lithuania, the trend of rising unemployment is observed in all nations with the exception of Malta. The public has a vital role in the national implementation and diffusion of eco-innovation. Increased funding and expenditures on the development of production technologies that are less damaging to the environment boost the national diffusion of eco-innovation. From 2010 through 2018, the average ratio of Lithuanian public environmental R&D expenditures to GDP was approximately 0.012 percent; however, in 2018, the ratio plummeted to 0.01 percent (Eurostat). Two main factors that will reduce the environmental impact of economic activity are technological breakthroughs and better energy efficiency. Alvarez-Herrández et al. (2017) [59] predict that advances in energy technologies will minimize environmental externalities, particularly CO2 and other greenhouse gas emissions. In addition, empirical studies indicate that public incentives are the driving force behind renewable energy investments and play a crucial role in reducing environmental pollution [60]. Despite the fact that, from 2010 to 2018, the ratio of public sector energy R&D expenditures to GDP in Lithuania was near to 0.015 (below the EU average), this ratio was close to 0.01 in 2018 (Eurostat).
Regarding eco-innovation activities, ISO 14001 specifies environmental management system criteria (EMS). Instead of stating environmental performance requirements, ISO 14001 provides a framework for establishing a successful EMS. It can be utilized by any organization that seeks to boost resource efficiency, minimize waste, and reduce expenses. Furthermore, through audits and technical support, ISO 14001 assists enterprises in adopting cleaner and more efficient technology [61]. According to Eurostat data, the average number of businesses in Lithuania acquiring ISO 14001 certificates between 2010 and 2018 was 200; however, in 2018, that figure climbed to 300. This expansion demonstrates the business sector’s interest in ecologically responsible production and management in Lithuania.
Material productivity is defined as the amount of economic output generated (in terms of GDP) per unit of materials consumed in resource efficiency outcomes. The better a nation’s material efficiency rate, the fewer materials/substances are utilized per unit of production, resulting in less waste and decreased usage of natural resources. In 2018, the EU resource efficiency rate was 2.1, whereas Lithuania’s rate was 0.85, which is 2% lower than the average from 2010 to 2018 (Eurostat). Energy efficiency, which indicates the rate of economic output per unit of energy use, is a metric that provides information regarding the relative performance of nations in economic, energy, and environmental challenges. Between 2010 and 2018, Lithuania produced 4.3 euros for every kilogram of oil-equivalent energy input, compared with 4.5 euros today.
Step 1: Construct the direct-influenced matrix
In order to determine the model of the relationships between the n criteria, an nn matrix must first be created. Each element in each row exerts an effect on each element in each column of this matrix. If the opinions of numerous experts are utilized, each expert must complete the matrix. Using the arithmetic mean of all of the experts’ judgments, a direct relation matrix X is created.
X = [ 0 x n 1 x 1 n 0 ]  
Table 1 below displays the direct relationship matrix, which corresponds to the pairwise comparison matrix of the experts.
Step 2: Compute the normalized direct-relation matrix
To normalize, the direct sum of the matrix’s rows and columns is calculated (Table 2). k represents the greatest number of the row and column sums. In order to normalize, each element of the direct-relation matrix must be split by k.
k = m a x { m a x j = 1 n x i j ,   i = 1 n x i j }  
N = 1 k X  
Step 3: Compute the total relation matrix
Following the computation of the normalized matrix, the fuzzy total-relation matrix can be determined as follows:
T = lim k + ( N 1 + N 2 + + N k )
In other words, an N identity matrix is created first, then subtracted from the normalized matrix, and the resulting matrix is inverted. The total relation matrix is obtained (Table 3) by multiplying the normalized matrix by the resulting matrix.
T = N × ( I N ) 1
Step 4: Set the threshold value
To construct the internal relations matrix, it is necessary to obtain the threshold value. Consequently, incomplete relationships are disregarded and the network relationship map (NRM) is created. The NRM depicts just those relations whose values in matrix T exceed the threshold value. Calculating the average values of the matrix T is adequate for calculating the threshold value for relations. After determining the threshold intensity, all values in matrix T that are less than the threshold value are set to zero, i.e., the previously described causal relationship is disregarded.
The threshold value found in this investigation is 7.872.
All of the values in matrix T less than 7.872 are set to zero, hence ignoring the previously established causal relationship. The model of relevant relationships is shown in Table 4 below.
Step 5: Final output and create a causal diagram
The following step is to determine the sum of each row and column of T (in step 3). Calculating the sum of rows (D) and columns (R) is performed as follows:
D = j = 1 n T i j  
R = j = 1 n T i j    
D and R can then be used to determine the values of D+R and D−R, where D+R represents the relevance of factor I to the entire system and D−R represents the net effects factor I has on the system.
The final results are shown in Table 5 below.
The diagram below depicts the model of key relationships. This model can be represented as a Figure 2 in which the values of (D+R) are placed on the horizontal axis and the values of (D−R) on the vertical axis. The coordinate system determines the position and interaction of each factor with a point in the coordinates (D+R, D−R).
Step 6: Interpret the results
According to the diagram (Figure 3) and Table 5 above, each factor can be assessed based on the following aspects:
Horizontal vector (D+R) represents the degree of importance each factor plays in the entire system. In other words, (D+R) indicates both factor i’s impact on the whole system and other system factors’ impact on the factor. In terms of degree of importance, energy productivity is ranked in first place, followed by enterprises that introduced an innovation with environmental benefit obtained by the end user, eco-innovation-related patents, enterprises that introduced an innovation with environmental benefit obtained within the enterprise, material productivity, total R&D personnel and researchers, ISO 14001 registered organisations, and governments environmental and energy R&D appropriations and outlays, respectively.
The vertical vector (D−R) represents the degree of a factor’s influence on system. In general, the positive value of D−R represents a causal variable and the negative value of D−R represents an effect. In this study, governments environmental and energy R&D appropriations and outlays, total R&D personnel and researchers, enterprises that introduced an innovation with environmental benefit obtained within the enterprise, enterprises that introduced an innovation with environmental benefit obtained by the end user, and eco-innovation-related patents are considered as causal variables, while ISO 14001 registered organisations, material productivity, and energy productivity are regarded as effects.
The results obtained (Figure 4) on the direct relation matrix are similar, which is the same as the pairwise comparison matrix of the experts for eco-innovation indicators and the selected economic factors. To normalize, the sum of all rows and columns of the matrix is calculated directly. An n × n identity matrix is first generated, then this identity matrix is subtracted from the normalized matrix and the resulting matrix is reversed; finally, the total-relationships matrix is calculated by considering the threshold value.
Horizontal vector (D+R) represents the degree of importance each factor plays in the entire system. In other words, (D+R) indicates both factor i’s impact on the whole system and other system factors’ impact on the factor. In terms of the degree of importance, consumer spending (EUR Million) (Lithuania) is ranked in first place, followed by year, manufacturing production (%) (Lithuania), industrial production (%) (Lithuania), imports (EUR Million) (Lithuania), exports (EUR Million) (Lithuania), ISO 14001 registered organisations (Lithuania), energy productivity (Lithuania), energy productivity (EU average), total R&D personnel and researchers (Lithuania), total R&D personnel and researchers (EU average), material productivity (EU average), material productivity (Lithuania), governments environmental and energy R&D appropriations and outlays (Lithuania), unemployment rate (Lithuania), enterprises that introduced an innovation with environmental benefit obtained by the end user (EU average), loans to private sector (EUR Million) (Lithuania), GDP annual growth rate (Lithuania), eco-innovation-related patents (Lithuania), enterprises that introduced an innovation with environmental benefit obtained within the enterprise (Lithuania), ISO 14001 registered organisations (EU average), enterprises that introduced an innovation with environmental benefit obtained by the end user (Lithuania), governments environmental and energy R&D appropriations and outlays (EU average), enterprises that introduced an innovation with environmental benefit obtained within the enterprise (EU average), and eco-innovation-related patents (EU average), respectively.
The vertical vector (D−R) represents the degree of a factor’s influence on the system. In general, a positive value of D−R represents a causal variable and a negative value of D−R represents an effect. In this study, enterprises that introduced an innovation with environmental benefit obtained within the enterprise (EU average), ISO 14001 registered organisations (EU average), eco-innovation-related patents (EU average), material productivity (EU average), energy productivity (EU average), GDP annual growth rate (Lithuania), unemployment rate (Lithuania), loans to private sector (EUR Million) (Lithuania), exports (EUR Million) (Lithuania), imports (EUR Million) (Lithuania), industrial production (%) (Lithuania), manufacturing production (%) (Lithuania), and consumer spending (EUR Million) (Lithuania) are considered as causal variables, while year, governments environmental and energy R&D appropriations and outlays (Lithuania), total R&D personnel and researchers (Lithuania), enterprises that introduced an innovation with environmental benefit obtained within the enterprise (Lithuania), enterprises that introduced an innovation with environmental benefit obtained by the end user (Lithuania), ISO 14001 registered organisations (Lithuania), eco-innovation-related patents (Lithuania), material productivity (Lithuania), energy productivity (Lithuania), governments environmental and energy R&D appropriations and outlays (EU average), total R&D personnel and researchers (EU average), and enterprises that introduced an innovation with environmental benefit obtained by the end user (EU average) are regarded as effects.
Taking into account the above hypotheses (H1, H2, H3, and H4), the hypothesis stating that there is a relationship between governments environmental and energy R&D appropriations and outlays, total R&D personnel and researchers, and enterprises that introduced an innovation with environmental benefit obtained within the enterprise at both the Lithuania and EU level is accepted. The findings illustrate the positive impact of eco-innovation activities in the EU on Lithuania, and vice versa. Lithuania was affected positively by eco-innovation activities of other EU nations. The research proves the positive affect of eco-innovation activities (both EU and Lithuania) on the unemployment rate, loans to private sector, exports, imports, industrial production, manufacturing production, and consumer spending in both product eco-innovation and process eco-innovation. The study also confirmed that there is a relationship between eco-innovation-related patents, material productivity, and energy productivity with industrial production and manufacturing production at both the EU level and Lithuania.

5. Discussion

To finish the preceding debate on the importance of eco-innovation in deciding on the application of the concept of sustainable economic growth, it is obvious that eco-innovation is vital for attaining sustainable growth in light of the globalization of economies and its effect on global pollution and the use of scarce resources. Thus, eco-innovation arises as a chance to develop sustainable technologies for production sustainability, green energy, eco-efficiency, and consumption awareness [8,9,10,15,22]. Roleders et al. [44] evaluated the main components of eco-innovation activities in achieving sustainable development. They determined that inadequate technological infrastructure is one of the most significant indicators of sustainable production, taking into consideration industry dynamics and manufacturing issues. Taking into consideration the importance of ability, capability, and the knowledge of the employees in sustainable production and growth, as well as its nexus with technology development and its utility, companies will prioritize the recruitment of talented personnel [45,46,47]. The use of eco-innovation by businesses, including the production and application of various eco-innovations (product, process, and organizational) that contribute to the implementation of the sustainable development principle [31,32], is a major component of many processes that characterize a closed-loop economy. Moreover, by leveraging the synergy effect, recognizing eco-innovation as crucial to establishing green/circular business models can increase the socioeconomic efficiency of corporate operations [3,35]. In Lithuania, policy makers must consider EU eco-innovation-related directives that are adequately reflected in the legal system. Development and implementation of effective policy programs and initiatives to encourage eco-innovation while also assisting in the establishment of new institutions and funds for the development of eco-innovation is a must. Lithuania’s performance in eco-innovation activities is below the EU average. However, when resource efficiency outputs and eco-innovation activities, which are subheadings of the Eco-IS index, are included, Lithuania does rather well in comparison with other EU countries.
Clearly, the private sector in Lithuania has a tendency toward eco-innovative products and processes in terms of eco-innovation activities. As a result of the technical assistance and advice provided to businesses within the scope of ISO 14001 certificates obtained by the private sector, it is anticipated that the positive externality of the documents will emerge in the upcoming period and the companies’ orientation toward eco-innovation will increase. Comparing Lithuania’s eco-innovation performance to that of EU nations yields comparable results. In recent years, the efficiency of eco-innovation in Lithuania has declined sharply and is already departing from efficiency [37,38]. The quantity of R&D personnel has a considerable impact on the performance of eco-innovation. In order to be effective in eco-innovation, it is essential to dramatically increase the percentage of R&D personnel. However, compared with its R&D staff ratio, Lithuania spends more on public energy and environmental R&D, which could be increased. Employment of R&D employees in the private sector must be encouraged through reward systems and regulatory requirements. In addition to increasing the number of researchers in public institutions, this shortage can also be remedied by increasing their numbers. The most significant limitation of the study is lack of research on the nexus between eco-innovation activities in the EU, eco-innovation indicators and infrastructure in Lithuania, and its reflection on the economic growth.

6. Conclusions

It is possible to state that eco-innovations in Lithuania encounter numerous obstacles. On the basis of the preceding analysis, the primary implications for policymakers and managers in Lithuania can be suggested. In Lithuania, public financing and expenditures for research and development remain low. State, public, and private organizations must be more involved in the financial support toward eco-innovation-related research and effectively address the benefit for manufacturers and public interest; therefore, it is vital to create positive awareness and effective infrastructure related to eco-innovations toward high added value (both social and economic—eco-innovation is the improvement of a society’s economic and environmental performance at the same time) in regard to the corporate responsibility concept. Moreover, considering the research results, policymakers in Lithuania should place a greater emphasis on ensuring that EU directives are adequately reflected in the legal system. Implementation of effective policy programs and initiatives to encourage eco-innovation while also assisting in the establishment of new institutions and funds for the development of eco-innovation is a must. the research results indicates that the role of the EU in this process cannot be neglected. A more effective system for sustainable development must be established in collaboration with central government authorities, business executives, academia, and non-governmental organizations to focused on progress in the field of technology and processes, with an intention to reduce environmental impacts of economic activities where every product or service generates an environmental benefit. Lithuania’s position in addressing eco-innovation is negligible when compared with the EU average, where eco-innovation contributes significantly to economic growth.
The utility of this study is shown in the outcome research, which highlights Lithuania’s position among the lowest countries in terms of eco-innovation adoption, opening up new avenues for research into the design and implementation of policies to address the existing situation.
The uncertain market demand due to low awareness of the significant impact of eco-innovation on employment and economic growth is a barrier that must be overcome by applying and implementing an action plan promoting eco-innovation by developing know-how oriented to barriers in eco-innovation activities; designing and implementing legislation on the nexus among environment and innovation; and implementing projects that aim to improve the environment, increasing European collaboration to promote internal and external eco-innovation and mobilization of financial tools among EU states to encourage eco-innovation in all possible spheres of the economy.

Author Contributions

Conceptualization, K.P. and B.P.; methodology, K.P. and B.P.; software, K.P.; validation, K.P. and B.P.; formal analysis, A.J. and B.P.; investigation, K.P. and B.P.; resources, K.P, A.J. and B.P.; writing—original draft preparation, B.P.; writing—review and editing, K.P. and B.P.; visualization, B.P.; supervision, A.J. All authors have read and agreed to the published version of the manuscript.

Funding

This research was funded by EUROPEAN SOCIAL FUND, grant number 09.3.3-LMT-K-712-23-0128 under a grant agreement with the Research Council of Lithuania (LMTLT).

Institutional Review Board Statement

Not applicable.

Informed Consent Statement

Not applicable.

Data Availability Statement

The data presented in this study are available on request from the corresponding author.

Conflicts of Interest

The authors declare no conflict of interest.

References

  1. Freeman, C. The greening of technology and models of innovation. Technol. Forecast. Soc. Change 1996, 53, 27–39. [Google Scholar] [CrossRef]
  2. Svedin, U. The contextual features of the economy-ecology dialogue. In Linking the Natural Environment and the Economy: Essays from the Eco-Eco Group; Folke, C., Kaberger, T., Eds.; Springer: Dordrecht, The Netherlands, 1991; pp. 3–19. [Google Scholar]
  3. FAO; IFAD; UNICEF; WFP; WHO. The State of Food Security and Nutrition in the World 2018: Building Climate Resilience for Food Security and Nutrition; FAO: Rome, Italy, 2018; Available online: http://www.fao.org/3/i9553en/i9553en.pdf (accessed on 26 August 2021).
  4. WCED. Our Common Future, World Commission on Environment and Development; Oxford University Press: Oxford, UK, 1987. [Google Scholar]
  5. Eco-Innovation Observatory (EIO). Europe in Transition: Paving the Way to a Green Economy through Ecoinnovation; European Commission/DG Environment: Brussels, Belgium, 2013. [Google Scholar]
  6. Vence, X.; Pereira, A. Eco-innovation and circular business models as drivers for a circular economy. Contaduría Y Adm. 2019, 64, 1–19. [Google Scholar] [CrossRef]
  7. Urbaniec, M.; Tomala, J.; Martinez, S. Measurements and Trends in Technological Eco-Innovation: Evidence from Environment-Related Patents. Resources 2021, 10, 68. [Google Scholar] [CrossRef]
  8. Schiederig, T.; Tietze, F.; Herstatt, C. Green innovation in technology and innovation management—An exploratory literature review. RD Manag. 2012, 42, 180–192. [Google Scholar] [CrossRef]
  9. Aguilera-Caracuel, J.; Ortiz-de-Mandojana, N. Green innovation and financial performance: An institutional approach. Organ. Environ. 2013, 26, 365–385. [Google Scholar] [CrossRef]
  10. Harsanto, B.; Mulyana, A.; Faisal, Y.A.; Shandy, V.M.; Alam, M. A Systematic Review on Sustainability-Oriented Innovation in the Social Enterprises. Sustainability 2022, 14, 14771. [Google Scholar] [CrossRef]
  11. Ekins, P. System innovation for environmental sustainability: Concept, policies and political economy. In International Economics of Resource Efficiency: Eco Innovation Policies for Green Economy; Bleischwitz, R., Welfens, P.J.J., Zhang, Z., Eds.; Springer Science & Business Media: Berlin/Heidelberg, Germany, 2011; pp. 51–88. [Google Scholar]
  12. Horbach, J.; Rammer, C.; Rennings, K. Determinants of eco-innovations by type of environmental impact: The role of regulatory push/pull, technology push and market pull. Ecol. Econ. 2012, 78, 112–122. [Google Scholar] [CrossRef]
  13. Preuss, L. Contribution of purchasing and supply management to ecological innovation. Int. J. Innov. Manag. 2007, 11, 515–537. [Google Scholar] [CrossRef]
  14. Liu, L.; Zhou, Y. The Impact of Managers’ Environmental Cognition on Urban Public Service Innovation from the Perspective of Green Ecology. Int. J. Environ. Res. Public Health 2022, 19, 15945. [Google Scholar] [CrossRef]
  15. Mazur, J.; Różyło, R.; Wójcik, M.; Panasiewicz, M.; Zawiślak, K.; Sobczak, P. Development of an Innovative Attachment Determining Friction Parameters for Quality Assessment in Sustainable Processing. Sustainability 2022, 14, 12986. [Google Scholar] [CrossRef]
  16. Díaz-García, C.; González-Moreno, Á.; Sáez-Martínez, F.J. Eco-Innovation: Insights from a literature review. Innov. Manag. Policy Pract. 2015, 17, 6–23. [Google Scholar] [CrossRef]
  17. Meena, C.S.; Kumar, A.; Jain, S.; Rehman, A.U.; Mishra, S.; Sharma, N.K.; Bajaj, M.; Shafiq, M.; Eldin, E.T. Innovation in Green Building Sector for Sustainable Future. Energies 2022, 15, 6631. [Google Scholar] [CrossRef]
  18. Dong, Y. Effects of eco-innovation typology on its performance: Empirical evidence from chinese enterprises. J. Eng. Technol. Manag. 2014, 34, 78–98. [Google Scholar] [CrossRef]
  19. Porter, M.E.; Van Der Linde, C. Green and Competitive: Ending the Stalemate, harvard Business Review, septembre-octobre. Kring 1995, 73, 120–134. [Google Scholar]
  20. Medeiros, J.F.; Ribeiro, J.L.D.; Cortimiglia, M.N. Success factors for environmentally sustainable product innovation: A systematic literature review. J. Clean. Prod. 2014, 65, 76–86. [Google Scholar] [CrossRef]
  21. Cheng, C.C.; Shiu, E.C. Validation of a proposed instrument for measuring eco-innovation: An implementation perspective. Technovation 2012, 32, 329–344. [Google Scholar] [CrossRef]
  22. Mavi, R.K.; Standing, C. Evaluating Eco-Innovation of OECD Countries with Data Envelopment Analysis. International Association for Development of the Information Society. 2016; pp. 237–244. Available online: https://eric.ed.gov/?id=ED571599 (accessed on 5 December 2021).
  23. Sáez-Martínez, F.J.; Ferrari, G.; Mondéjar-Jiménez, J. Eco-İnnovation: Trends and approaches for a field of study. Innov. Manag. Policy Pract. 2015, 17, 1–5. [Google Scholar] [CrossRef]
  24. Peyravi, B.; Jakubavičius, A. Drivers in the eco-innovation road to the circular economy: Organiational capabilities and exploitative strategies. Sustainability 2022, 14, 10748. [Google Scholar] [CrossRef]
  25. Kuo, T.C.; Smith, S. A systematic review of technologies involving eco-innovation for enterprises moving towards sustainability. J. Clean. Prod. 2018, 192, 207–220. [Google Scholar] [CrossRef]
  26. Hojnik, J.; Ruzzier, M. What drives eco-innovation? A review of an emerging literature. Environ. Innov. Soc. Trans. 2016, 19, 31–41. [Google Scholar] [CrossRef]
  27. Gąsior, A.; Grabowski, J.; Ropęga, J.; Walecka, A. Creating a Competitive Advantage for Micro and Small Enterprises Based on Eco-Innovation as a Determinant of the Energy Efficiency of the Economy. Energies 2022, 15, 6965. [Google Scholar] [CrossRef]
  28. Oltra, V.; Saint Jean, M. Sectoral systems of environmental innovation: An application to the french automotive industry. Technol. Forecast. Soc. Change 2009, 76, 567–583. [Google Scholar] [CrossRef]
  29. Molina-Sánchez, E.; Leyva-Díaz, J.C.; Cortés-García, F.J.; Molina-Moreno, V. Proposal of sustainability indicators for the waste management from the paper industry within the circular economy model. Water 2018, 10, 1014. [Google Scholar] [CrossRef]
  30. Kemp, R.; Pearson, P. Final Report MEI Project about Measuring Eco-Innovation. OECD. 2007. Available online: https://www.oecd.org/env/consumption-innovation/43960830.pdf (accessed on 20 March 2022).
  31. Eco-Innovation Observatory (EIO). Methodological Report; Eco-Innovation Observatory: Brussels, Belgium, 2010; Available online: https://www.eco-innovation.eu/index.php/reports (accessed on 15 July 2021).
  32. Eco-Innovation Observatory (EIO). Eco-Innovation of Products: Case Studies and Policy Lessons from eu Member States for a Product Policy Framework that Contributes to a Circular Economy; Eco-Innovation Observatory: Brussels, Belgium, 2018. [Google Scholar]
  33. Rennings, K. Towards a Theory and Policy of Eco-Innovation-Neoclassical and (Co-)Evolutionary Perspectives. ZEW Discussion Papers No. 98-24. 1998. Available online: https://www.econstor.eu/handle/10419/24575 (accessed on 1 January 2020).
  34. Fisk, P. People Planet Profit: How to Embrace Sustainability for Innovation and Business Growth. Kogan Page. 2010. Available online: https://books.google.com.sg/books?hl=en&lr=&id=2akKRa6hr_oC&oi=fnd&pg=PA1&dq=People+Planet+Profit:+How+to+embrace+sustainability+for+innovation+and+business+growth&ots=DGVNtwpCWV&sig=fxUFnBc8GdwIcEz92Shtm9hoQ08#v=onepage&q=People%20Planet%20Profit%3A%20How%20to%20embrace%20sustainability%20for%20innovation%20and%20business%20growth&f=false (accessed on 1 January 2020).
  35. Gürsu, H. Sahi Inovasyon Neden Bize Bu Kadar Uzak; Destek Yayınevi: İstanbul, Türkiye, 2014. [Google Scholar]
  36. Senthil Kannan, S. Textiles and Clothing Sustainability: Recycled and Upcycled Textiles and Fashion; Springer Publications: Berlin/Heidelberg, Germany, 2017. [Google Scholar]
  37. Ziółkowski, B. The world trends in eco-innovation assessment. Mod. Manag. Rev. 2013, 20, 153–162. [Google Scholar] [CrossRef]
  38. Horbach, J. Determinants of environmental innovation—New evidence from german panel data sources. Res. Policy 2008, 37, 163–173. [Google Scholar] [CrossRef]
  39. Kopnina, H. Sustainability: New strategic thinking for business. Environ. Dev. Sustain. 2017, 19, 27–43. [Google Scholar] [CrossRef]
  40. Commission of the European Communities (CEC). Communication from the Commission to the European Parliament, the Council, the European Economic and Social Committee and the Committee of the Regions Stimulating Technologies for Sustainable Development: An Environmental Technologies Action Plan for the European Union; Commission of the European Communities (CEC): Brussels, Belgium, 2004. [Google Scholar]
  41. Basso, L.C.; Santos, D.F.L.; Kimura, H.; Braga, A.C.S. Eco-Innovation in Brazil: The Creation of an Index. 2013. SSRN: 2284336. Available online: https://ssrn.com/abstract=2284336 (accessed on 1 January 2020).
  42. Park, M.S.; Bleischwitz, R.; Han, K.J.; Jang, E.K.; Joo, J.H. Eco-innovation indices as tools for measuring eco-innovation. Sustainability 2017, 9, 2206. [Google Scholar] [CrossRef]
  43. Huppes, G.; Kleijn, R.; Huele, R.; Ekins, P.; Shaw, B.; Esders, M.; Schaltegger, S. Measuring Ecoinnovation: Framework and Typology of Indicators Based on Causal Chains. Final Report ff the Ecodrive Project, CML, Leiden University. 2008. Available online: https://www.ecoinnovation.eu/wiki/images/Ecodrive_final_report.pdf (accessed on 17 July 2021).
  44. Roleders, V.; Oriekhova, T.; Zaharieva, G. Circular Economy as a Model of Achieving Sustainable Development. Probl. Ekorozw. —Probl. Sustain. Dev. 2022, 17, 178–185. [Google Scholar] [CrossRef]
  45. Terjesen, S.; Patel, P.C. In search of Process Innovations: The Role of Search Depth, Search Breadth, and the Industry Environment. J. Manag. 2017, 43, 1421–1446. [Google Scholar] [CrossRef]
  46. Cozzolino, A.; Verona, G.; Rothaermel, F. Unpacking the Disruption Process: New Technology, Business Models, and Incumbent Adaptation. J. Manag. Stud. 2018, 55, 1166–1202. [Google Scholar] [CrossRef]
  47. Lesáková, L.; Laco, P. Using Eco-innovation Index to Measure the Eco-innovation Performance in the Global Knowledge Economy: Evidence from Slovakia. SHS Web Conf. 2020, 74, 06017. [Google Scholar] [CrossRef]
  48. León-Ledesma, M.A.; Satchi, M. Appropriate Technology and Balanced Growth. Rev. Econ. Stud. 2019, 86, 807–835. [Google Scholar] [CrossRef]
  49. Kogan, L.; Papanikolaou, D.; Seru, A.; Stoffman, N. Technological Innovation, Resource Allocation, and Growth. Q. J. Econ. 2017, 132, 665–712. [Google Scholar] [CrossRef]
  50. Andersen, M.M. Eco-Innovation Indicators. European Environment Agency. 2006. Available online: https://backend.orbit.dtu.dk/ws/portalfiles/portal/115329898/2007_115_report.pdf (accessed on 20 October 2021).
  51. Hori, S.; Shimizu, Y. Designing methods of human interface for supervisory control systems. Control Eng. Pract. 1999, 7, 1413–1419. [Google Scholar] [CrossRef]
  52. Tamura, H.; Okanishi, H.; Akazawa, K. Decision support for extracting and dissolving consumers’ uneasiness over foods using stochastic DEMATEL. J. Telecommun. Inf. Technol. 2006, 4, 91–95. [Google Scholar]
  53. Shieh, J.I.; Wu, H.H.; Huang, K.K. A DEMATEL method in identifying key success factors of hospital service quality. Knowl.-Based Syst. 2010, 23, 277–282. [Google Scholar] [CrossRef]
  54. Tseng, M.L.; Lin, Y.H. Application of fuzzy DEMATEL to develop a cause and effect model of municipal solid waste management in Metro Manila. Environ. Monit. Assess. 2009, 158, 519–533. [Google Scholar] [CrossRef]
  55. Liou, J.J.H.; Yen, L.; Tzeng, G.H. Building an effective safety management system for airlines. J. Air Transp. Manag. 2008, 14, 20–26. [Google Scholar] [CrossRef]
  56. Tzeng, G.H.; Chiang, C.H.; Li, C.W. Evaluating intertwined effects in e-learning programs: A novel hybrid MCDM model based on factor analysis and DEMATEL. Expert Syst. Appl. 2007, 32, 1028–1044. [Google Scholar] [CrossRef]
  57. Kowalska, A. Implementing eco-innovations: Determinants and effects. Rocz. Nauk. Stowarzyszenia Ekon. Rol. I Agrobiz. 2014, 16, 153–158. [Google Scholar]
  58. Smol, M.; Kulczycka, J.; Avdiushchenko, A. Circular economy indicators in relation to ecoinnovation in European regions. Clean Technol. Environ. Policy 2017, 19, 669–678. [Google Scholar] [CrossRef]
  59. Álvarez-Herránz, A.; Balsalobre, D.; Cantos, J.M.; Shahbaz, M. Energy İnnovations-GHG emissions nexus: Fresh empirical evidence from OECD countries. Energy Policy 2017, 101, 90–100. [Google Scholar] [CrossRef]
  60. Yang, X.; He, L.; Xia, Y.; Chen, Y. Effect of government subsidies on renewable energy investments: The threshold effect. Energy Policy 2019, 132, 156–166. [Google Scholar] [CrossRef]
  61. Carrillo-Labella, R.; Fort, F.; Parras-Rosa, M. Motives, barriers and expected benefits of ISO 14001 in the agri-food sector. Sustainability 2020, 12, 1724. [Google Scholar] [CrossRef] [Green Version]
Figure 1. Formulation of the research hypothesis (compiled by the author’s).
Sustainability 15 03139 g001
Figure 2. Cause–effect diagram for Lithuania in eco-innovation activities.
Sustainability 15 03139 g002
Figure 3. Cause–effect diagram for EU in eco-innovation activities.
Sustainability 15 03139 g003
Figure 4. Cause–effect diagram for Lithuania for eco-innovation/economy interrelations.
Sustainability 15 03139 g004
Table 1. Direct relation matrix for Lithuania/EU.
Governments Environmental and Energy R&D Appropriations and Outlays
Y1/Y2
Total R&D Personnel and Researchers
Y1/Y2
Enterprises That Introduced an Innovation with Environmental Benefit Obtained within the Enterprise
Y1/Y2
Enterprises that Introduced an Innovation with Environmental Benefit Obtained by the End User
Y1/Y2
ISO 14001 Registered Organisations
Y1/Y2
Eco-Innovation-Related Patents
Y1/Y2
Material Productivity
Y1/Y2
Energy Productivity
Y1/Y2
Governments environmental and energy R&D appropriations and outlays 0/00.97/0.968423880.93/0.921842630.96/0.95485830.93/0.926550560.91/0.907123190.9684238891/0.901075760.94/0.93550202
Total R&D personnel and researchers0.94/0.968423880/00.93/0.927596330.96/0.957005950.9/0.95485830.97/0.966409170.96/0.95141620.97/0.96053515
Enterprises that introduced an innovation with environmental benefit obtained within the enterprise0.922/0.921842630.928/0.927596330/00.97/0.966350910.97/0.963388810.96/0.95485830.95/0.944727080.96/0.96018973
Enterprises that introduced an innovation with environmental benefit obtained by the end user0.955/0.95485830.957/0.957005950.966/0.966350910/00.98/0.9722270.97/0.965762070.95/0.95485830.990.98314939/
ISO 14001 registered organisations 0.92655056/0.9270.897/0.896717540.963/0.963388810.972/0.9722270/00.92/0.919878260.92/0.913195110.96/0.9548583
Eco-innovation-related patents0.907/0.907123190.966/0.966409170.96/0.960069980.966/0.965762070.92/0.919878260/00.99/0.984152610.99/0.98176208
Material productivity0.901/0.901075760.951/0.95141620.945/0.944727080.949/0.94881360.913/0.913195110.984/0.984152610/00.99/0.98865915
Energy productivity0.9360.93550202/0.961/0.960535150.96/0.960189730.983/0.983149390.953/0.952757760.982/0.981762080.989/0.988659150/0
Table 2. The normalized direct-relation matrix for Lithuania/EU.
Governments Environmental and Energy R&D Approprations and Outlays Total R&D Personnel and ResearchersEnterprises That Introduced an Innovation with Environmental Benefit Obtained within the EnterpriseEnterprises That Introduced an Innovation with Environmental Benefit Obtained by the End UserISO 14001 Registered OrganisationsEco-Innovation-Related PatentsMaterial ProductivityEnergy Productivity
Governments environmental and energy R&D appropriations and outlays /00/0.1430.143/0.1360.137/0.1410.142/0.1370.137/0.1340.134/0.1330.134/0.1380.139
Total R&D personnel and researchers/0.1430.143/00/0.1370.137/0.1420.142/0.1410.133/0.1430.143/0.1410.142/0.1420.143
Enterprises that introduced an innovation with environmental benefit obtained within the enterprise/0.1360.136/0.1370.137/00/0.1430.143/0.1420.143/0.1410.142/0.140.14/0.1420.142
Enterprises that introduced an innovation with environmental benefit obtained by the end user/0.1410.141/0.1420.141/0.1430.143/00/0.1440.145/0.1430.143/0.1410.14/0.1450.146
ISO 14001 registered organisations/0.1370.137/0.1330.133/0.1420.142/0.1440.144/00/0.1360.136/0.1350.136/0.1410.142
Eco-innovation-related patents/0.1340.134/0.1430.143/0.1420.142/0.1430.143/0.1360.136/00/0.1460.146/0.1450.146
Material productivity/0.1330.133/0.1410.141/0.140.14/0.140.14/0.1350.135/0.1460.145/00/0.1460.146
Energy productivity/0.1380.138/0.1420.142/0.1420.142/0.1450.145/0.1410.141/0.1450.145/0.1460.146/00
Table 3. The total relation matrix for Lithuania/EU.
Governments Environmental and Energy R&D Appropriations and Outlays Total R&D Personnel and ResearchersEnterprises That Introduced an Innovation with Environmental Benefit Obtained within the EnterpriseEnterprises That Introduced an Innovation with Environmental Benefit Obtained by the End UserISO 14001 Registered OrganisationsEco-Innovation-Related patentsMaterial ProductivityEnergy Productivity
Governments environmental and energy R&D appropriations and outlays 7.503/7.2427.744/7.4787.763/7.4897.873/7.5937.675/7.4497.805/7.5227.777/7.4817.911/7.607
Total R&D personnel and researchers7.737/7.5347.729/7.5217.874/7.6587.985/7.7647.781/7.627.923/7.6997.894/7.6568.028/7.781
Enterprises that introduced an innovation with environmental benefit obtained within the enterprise7.733/7.4837.851/7.5957.755/7.4917.988/7.7187.791/7.5757.924/7.6517.895/7.6098.029/7.734
Enterprises that introduced an innovation with environmental benefit obtained by the end user7.845/7.5987.964/7.7127.99/7.737.974/7.7087.9/7.6898.035/7.7668.005/7.7238.144/7.852
ISO 14001 registered organisations7.633/7.3947.745/7.5017.777/7.5257.884/7.6277.564/7.3597.816/7.5557.788/7.5147.924/7.641
Eco-innovation-related patents7.772/75277.896/7.6477.92/7.6628.029/7.7667.826/7.6177.841/7.5747.941/7.668.074/7.784
Material productivity7.705/7.4757.828/7.5937.852/7.6087.959/7.7117.758/7.5647.9/7.6497.746/7.4818.005/7.732
Energy productivity7.839/7.6057.961/7.7217.986/7.7388.097/7.8447.894/7.6958.033/7.7778.006/7.7368.013/7.734
Table 4. The total-relationships matrix by considering the threshold value for Lithuania/EU.
Governments Environmental and Energy R&D Appropriations and Outlays Total R&D Personnel and ResearchersEnterprises that Introduced an Innovation with Environmental Benefit Obtained within the EnterpriseEnterprises That Introduced an Innovation with Environmental Benefit Obtained by the End UserISO 14001 Registered OrganisationsEco-Innovation-Related PatentsMaterial ProductivityEnergy Productivity
Governments environmental and energy R&D appropriations and outlays 0/00/00/07.873/00/00/00/07.911/0
Total R&D personnel and researchers0/00/07.874/7.6587.985/7.7640/07.923/7.6997.894/7.6568.028/7.781
Enterprises that introduced an innovation with environmental benefit obtained within the enterprise0/00/00/07.988/7.7180/07.924/7.6517.895/08.029/7.734
Enterprises that introduced an innovation with environmental benefit obtained by the end user0/07.964/7.7127.99/7.737.974/7.7087.9/7.6898.035/7.7668.005/7.7238.144/7.852
ISO 14001 registered organisations0/00/00/0 7.884/7.6270/00/00/07.924/7.641
Eco-innovation-related patents0/07.896/7.6477.92/7.6628.029/7.7660/00/07.941/7.668.074/7.784
Material productivity0/00/00/07.959/7.7110/07.9/7.6490/08.005/7.732
Energy productivity0/07.961/7.7217.986/7.7388.097/7.7387.894/7.6958.033/7.7778.006/7.7368.013/7.734
Table 5. The final output (DETAMEL) for Lithuania/EU.
R
Y1/Y2
D
Y1/Y2
D+R
Y1/Y2
D−R
Y1/Y2
Governments environmental and energy R&D appropriations and outlays 61.766/59.85862.051/59.861123.817/119.7190.285/0.003
Total R&D personnel and researchers62.718/60.76762.952/61.231125.67/121.9990.234/0.464
Enterprises that introduced an innovation with environmental benefit obtained within the enterprise62.917/60.90162.966/60.857125.884/121.7570.049/−0.044
Enterprises that introduced an innovation with environmental benefit obtained by the end user63.791/61.73163.858/67.779127.649/123.510.066/0.048
ISO 14001 registered organisations62.189/60.56762.13/60.115124.319/120.682−0.059/−0.452
Eco-innovation-related patents63.275/61.19363.298/61.237126.573/122.4310.023/0.044
Material productivity63.052/60.8662.753/60.813125.805/121.673−0.299/−0.047
Energy productivity64.128/61.86763.829/61.851127.956/123.717−0.299/−0.016
Disclaimer/Publisher’s Note: The statements, opinions and data contained in all publications are solely those of the individual author(s) and contributor(s) and not of MDPI and/or the editor(s). MDPI and/or the editor(s) disclaim responsibility for any injury to people or property resulting from any ideas, methods, instructions or products referred to in the content.

