Article

Local Feature Search Network for Building and Water Segmentation of Remote Sensing Image

1
Jiangsu Collaborative Innovation Center on Atmospheric Environment and Equipment Technology, Nanjing University of Information Science and Technology, Nanjing 210044, China
2
College of Information Science and Technology, Nanjing Forestry University, Nanjing 210037, China
*
Author to whom correspondence should be addressed.
Sustainability 2023, 15(4), 3034; https://doi.org/10.3390/su15043034
Submission received: 28 November 2022 / Revised: 15 January 2023 / Accepted: 3 February 2023 / Published: 7 February 2023
(This article belongs to the Special Issue Remote Sensing, Sustainable Land Use and Smart City)

Abstract

:
Extracting buildings and water bodies from high-resolution remote sensing images is of great significance for urban development planning. However, when studying buildings and water bodies through high-resolution remote sensing images, water bodies are very easy to be confused with the spectra of dark objects such as building shadows, asphalt roads and dense vegetation. The existing semantic segmentation methods do not pay enough attention to the local feature information between horizontal direction and position, which leads to the problem of misjudgment of buildings and loss of local information of water area. In order to improve this problem, this paper proposes a local feature search network (DFSNet) application in remote sensing image building and water segmentation. By paying more attention to the local feature information between horizontal direction and position, we can reduce the problems of misjudgment of buildings and loss of local information of water bodies. The discarding attention module (DAM) introduced in this paper reads sensitive information through direction and location, and proposes the slice pooling module (SPM) to obtain a large receptive field in the pixel by pixel prediction task through parallel pooling operation, so as to reduce the misjudgment of large areas of buildings and the edge blurring in the process of water body segmentation. The fusion attention up sampling module (FAUM) guides the backbone network to obtain local information between horizontal directions and positions in spatial dimensions, provide better pixel level attention for high-level feature maps, and obtain more detailed segmentation output. The experimental results of our method on building and water data sets show that compared with the existing classical semantic segmentation model, the proposed method achieves 2.89% improvement on the indicator MIoU, and the final MIoU reaches 83.73%.

1. Introduction

Remote sensing image classification is an important link in the application of remote sensing technology. With the progress of remote sensing data acquisition technology [1], the information of high-resolution remote sensing images shows a trend of massive growth, and the number and diversity of target samples also increase dramatically [2]. Early image classification is mainly based on manually extracted image features. These methods mainly rely on experts with a lot of professional knowledge and practical experience to design various image features. Several of the most representative manual description features include color histogram, texture feature, direction histogram and scale invariant feature transformation. Although these classification methods are intuitive and easy to understand, the description ability of these features is very limited when faced with complex images. In recent years, machine learning methods [3] based on probability and statistics have provided many feasible methods for remote sensing image classification. Typical machine learning methods include classification methods such as support vector machine, decision tree, principal component analysis and k-means clustering. The classification methods of machine learning mentioned above belong to shallow learning networks [4], and it is difficult to establish complex function representations and cannot adapt to remote sensing image classification of complex samples. The emergence of deep learning provides a new method for land cover classification [5,6,7]. Deep learning is a kind of neural network with deep structure, which can extract the features of remote sensing images better than models with shallow structure such as artificial neural network and support vector machine [8]. Its motivation is to establish neural networks that simulate human brain for analysis and learning. It can learn more useful features through massive training data and deep models with many hidden layers, and ultimately improve the accuracy of classification.
With the rapid development of deep learning [9,10,11], many scholars have proposed effective high-resolution remote sensing image segmentation methods [12,13,14,15,16] for remote sensing image feature extraction [17,18,19]. In the process of image acquisition and processing, image noise increases. Noise reduces the visibility of image edges, thus introducing false edge information, resulting in poor segmentation performance of object contours. Full convolution neural network FCN [20] makes image segmentation enter a new stage. These pixels can not only classify objects according to their categories, but also improve the accuracy of image segmentation. We found that the main problem based on the FCN model at present is the lack of appropriate strategies to use global scene category clues. For the understanding of typical complex scenes, in order to obtain global image level features, the spatial pyramid pool is widely used, in which spatial statistics provide a good descriptor for the overall scene interpretation. Different from these methods, in order to combine appropriate global features, Zhao et al. proposed the Pyramid Scene Parsing Net (PSPNet) [21]. It can embed the context features of difficult scenes into FCN’s pixel prediction framework, fully understand the scene, and accurately predict each pixel category, position and shape. The local and global information are fused together to make the final prediction more reliable. Ronneberger et al. proposed a U-Net network [22] for medical image processing, improved the feature fusion method based on the FCN network framework, and fused features of different levels. The PAN [23] paper combines the Attention mechanism with the pyramid structure, which can extract the relatively low level precise dense features based on the high-level semantic guidance, replacing the complex hole convolution and multiple codec operations in other methods, and jumping out of the usual U-Net structure. Due to the large difference in the scale of the objects contained in the remote sensing image and the complex boundary of the objects, it is difficult to accurately extract the features of the remote sensing image, which makes it difficult to accurately segment the remote sensing image. Chen et al. proposed a multi-level aggregation network [15] for semantic segmentation of high-resolution remote sensing images, which extracts depth global features by learning the relationship between all positions in the context through a global dependency module, and filters redundant channel information to optimize segmentation results. Xia et al. proposed a separable attention network based on different size fusion [24]. The method uses residual neural network as the backbone network to obtain the information features of rivers. Through attention modules of different scales, the deep feature information and shallow feature information of rivers are fused. The shallow features and large scale attention module are used to locate the main position of the river, and the deep features and small scale attention module are used to finely segment the river edge, so as to accurately extract the river from the background. Thus, the problems that traditional detection methods cannot identify small tributaries and the edge information is rough are solved.
The above network solves many problems of remote sensing image semantic segmentation [25,26]. However, the existing semantic segmentation networks use more multi-scale fusion of feature maps to enhance the effect of image segmentation [27], and pay less attention to the horizontal direction information, resulting in misjudgment of buildings and loss of local information of water bodies. Generally, the down sampling operation is used to extract abstract semantic features, so high resolution details are easy to lose, and local details are inaccurate, edges are fuzzy, and buildings are misjudged in the segmentation results.Therefore, the land cover classification model based on semantic segmentation needs to be improved to extract feature information between the horizontal directions of the image. In order to solve this problem, a local feature search network for building and water area segmentation in high-resolution remote sensing images is proposed. The network strengthens the semantic extraction of image horizontal direction and location information, reads sensitive information through direction and location, enables the model to more accurately locate and identify the target area, captures cross channel information, and embeds location information into channel attention, To efficiently integrate the spatial coordinate information, so as to improve the local information loss and misjudgment of buildings in the process of building and water area segmentation, enhance the search ability of local features of the network, and ultimately improve the semantic segmentation ability.
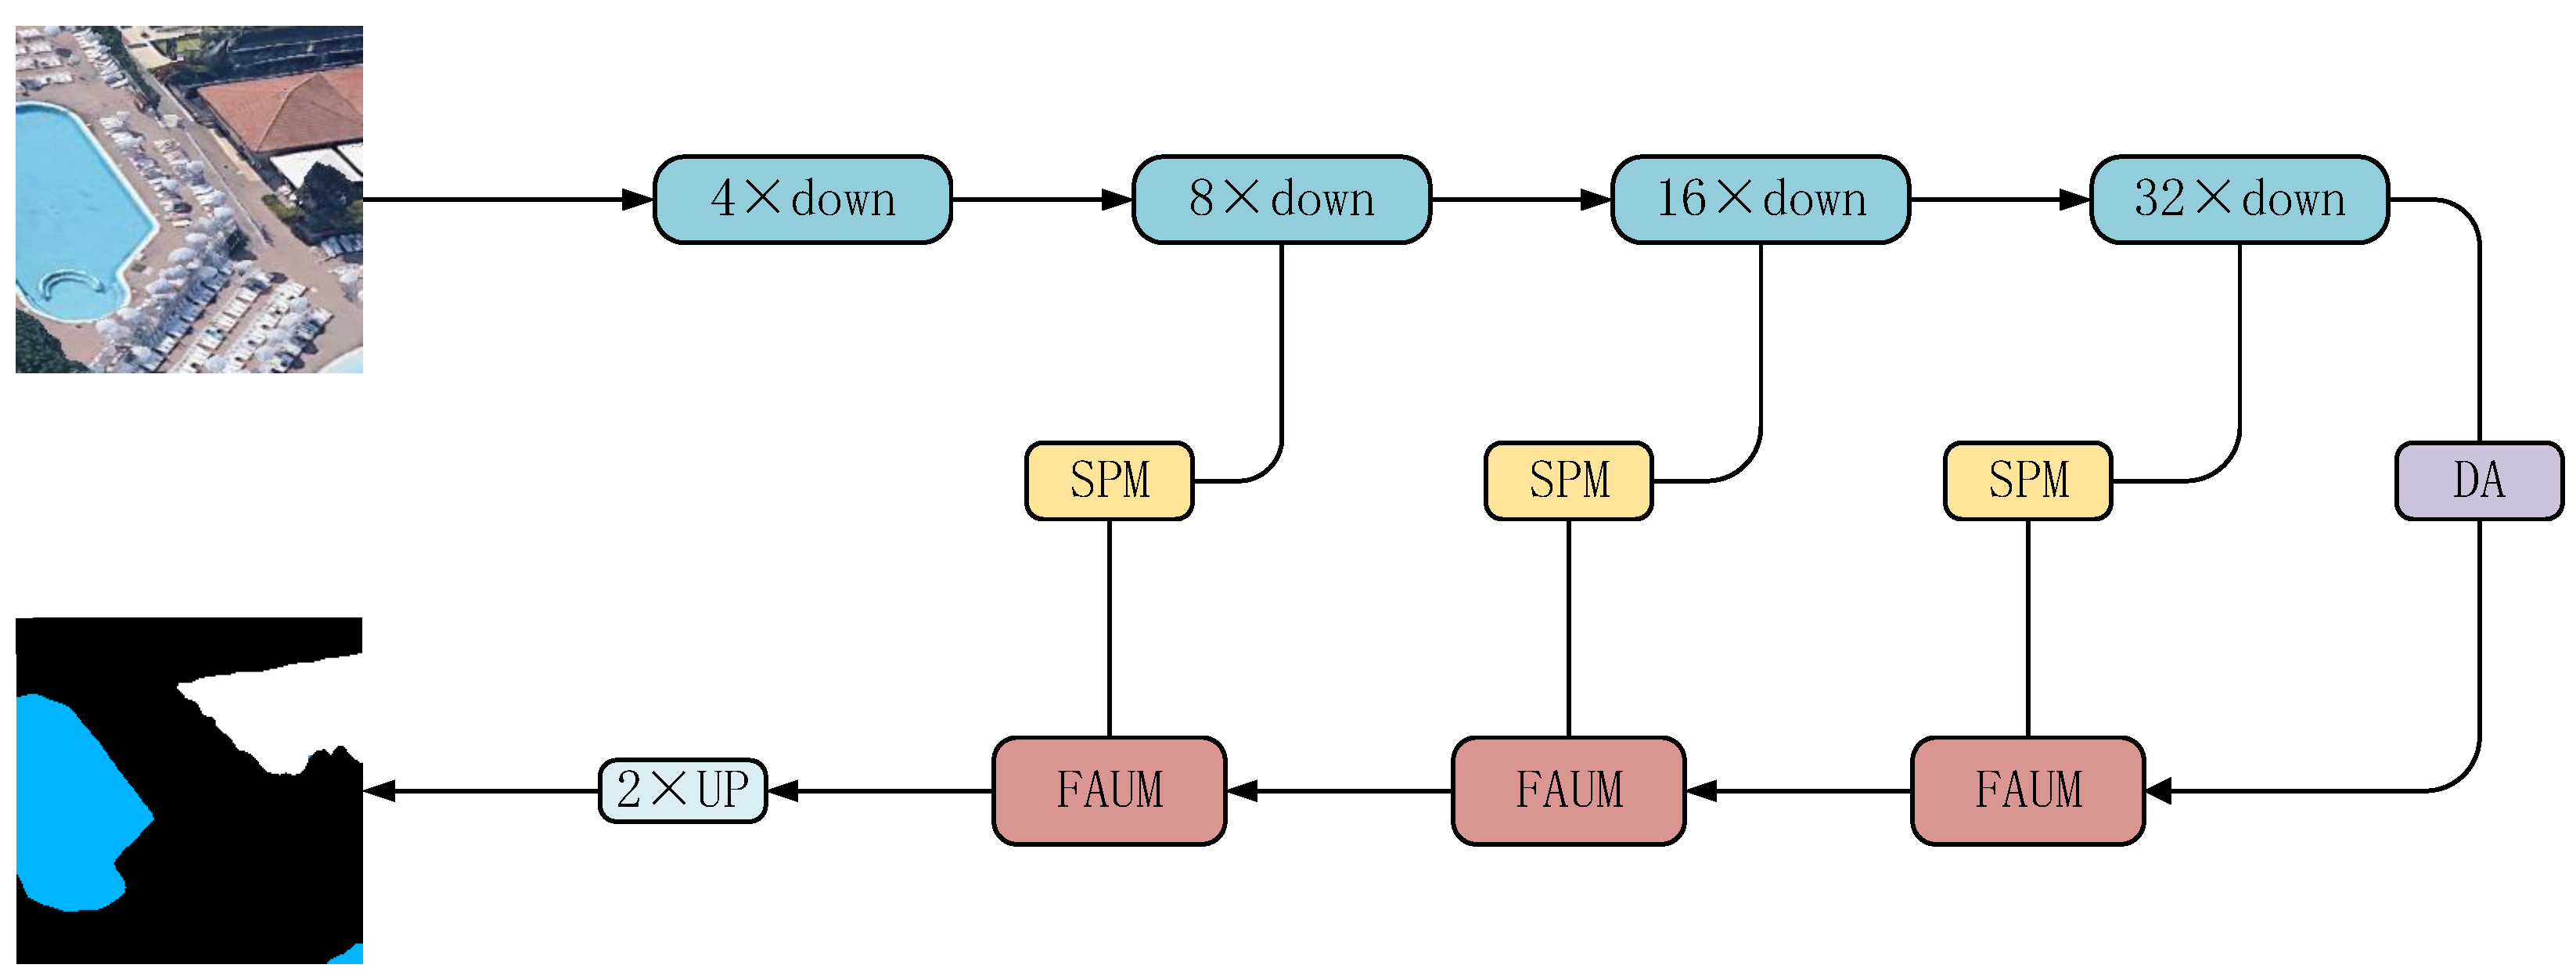
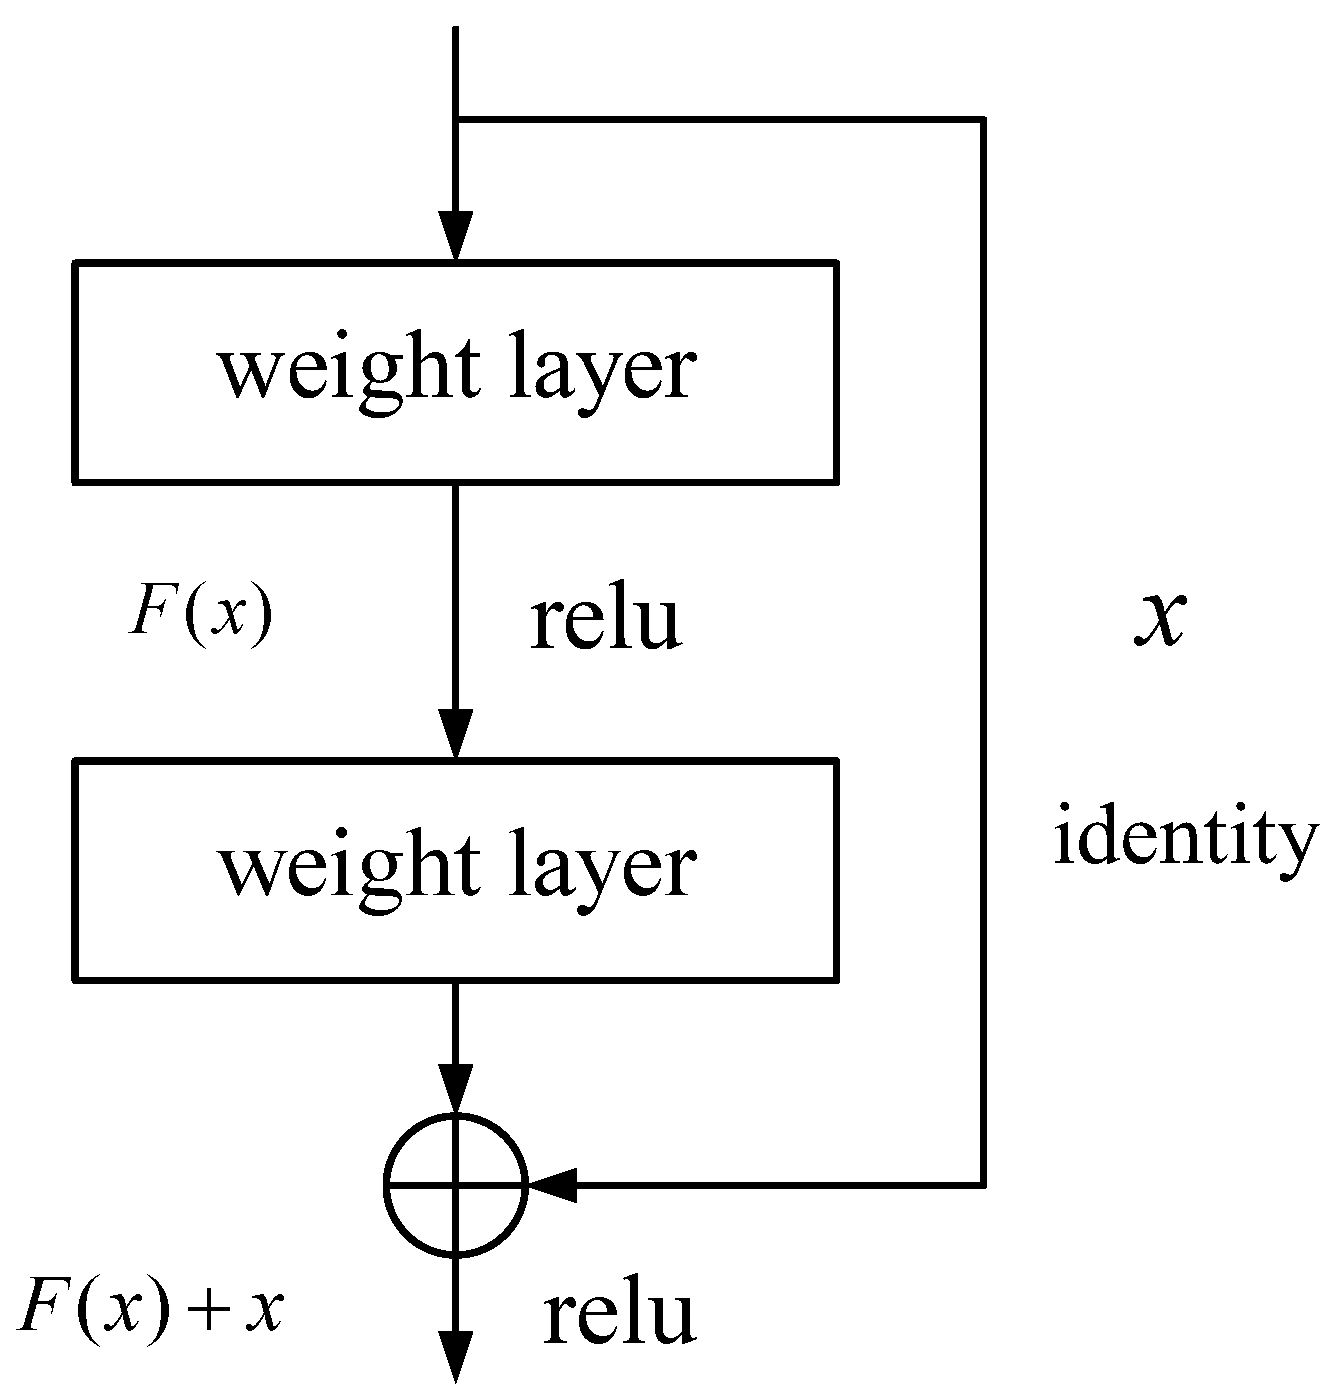
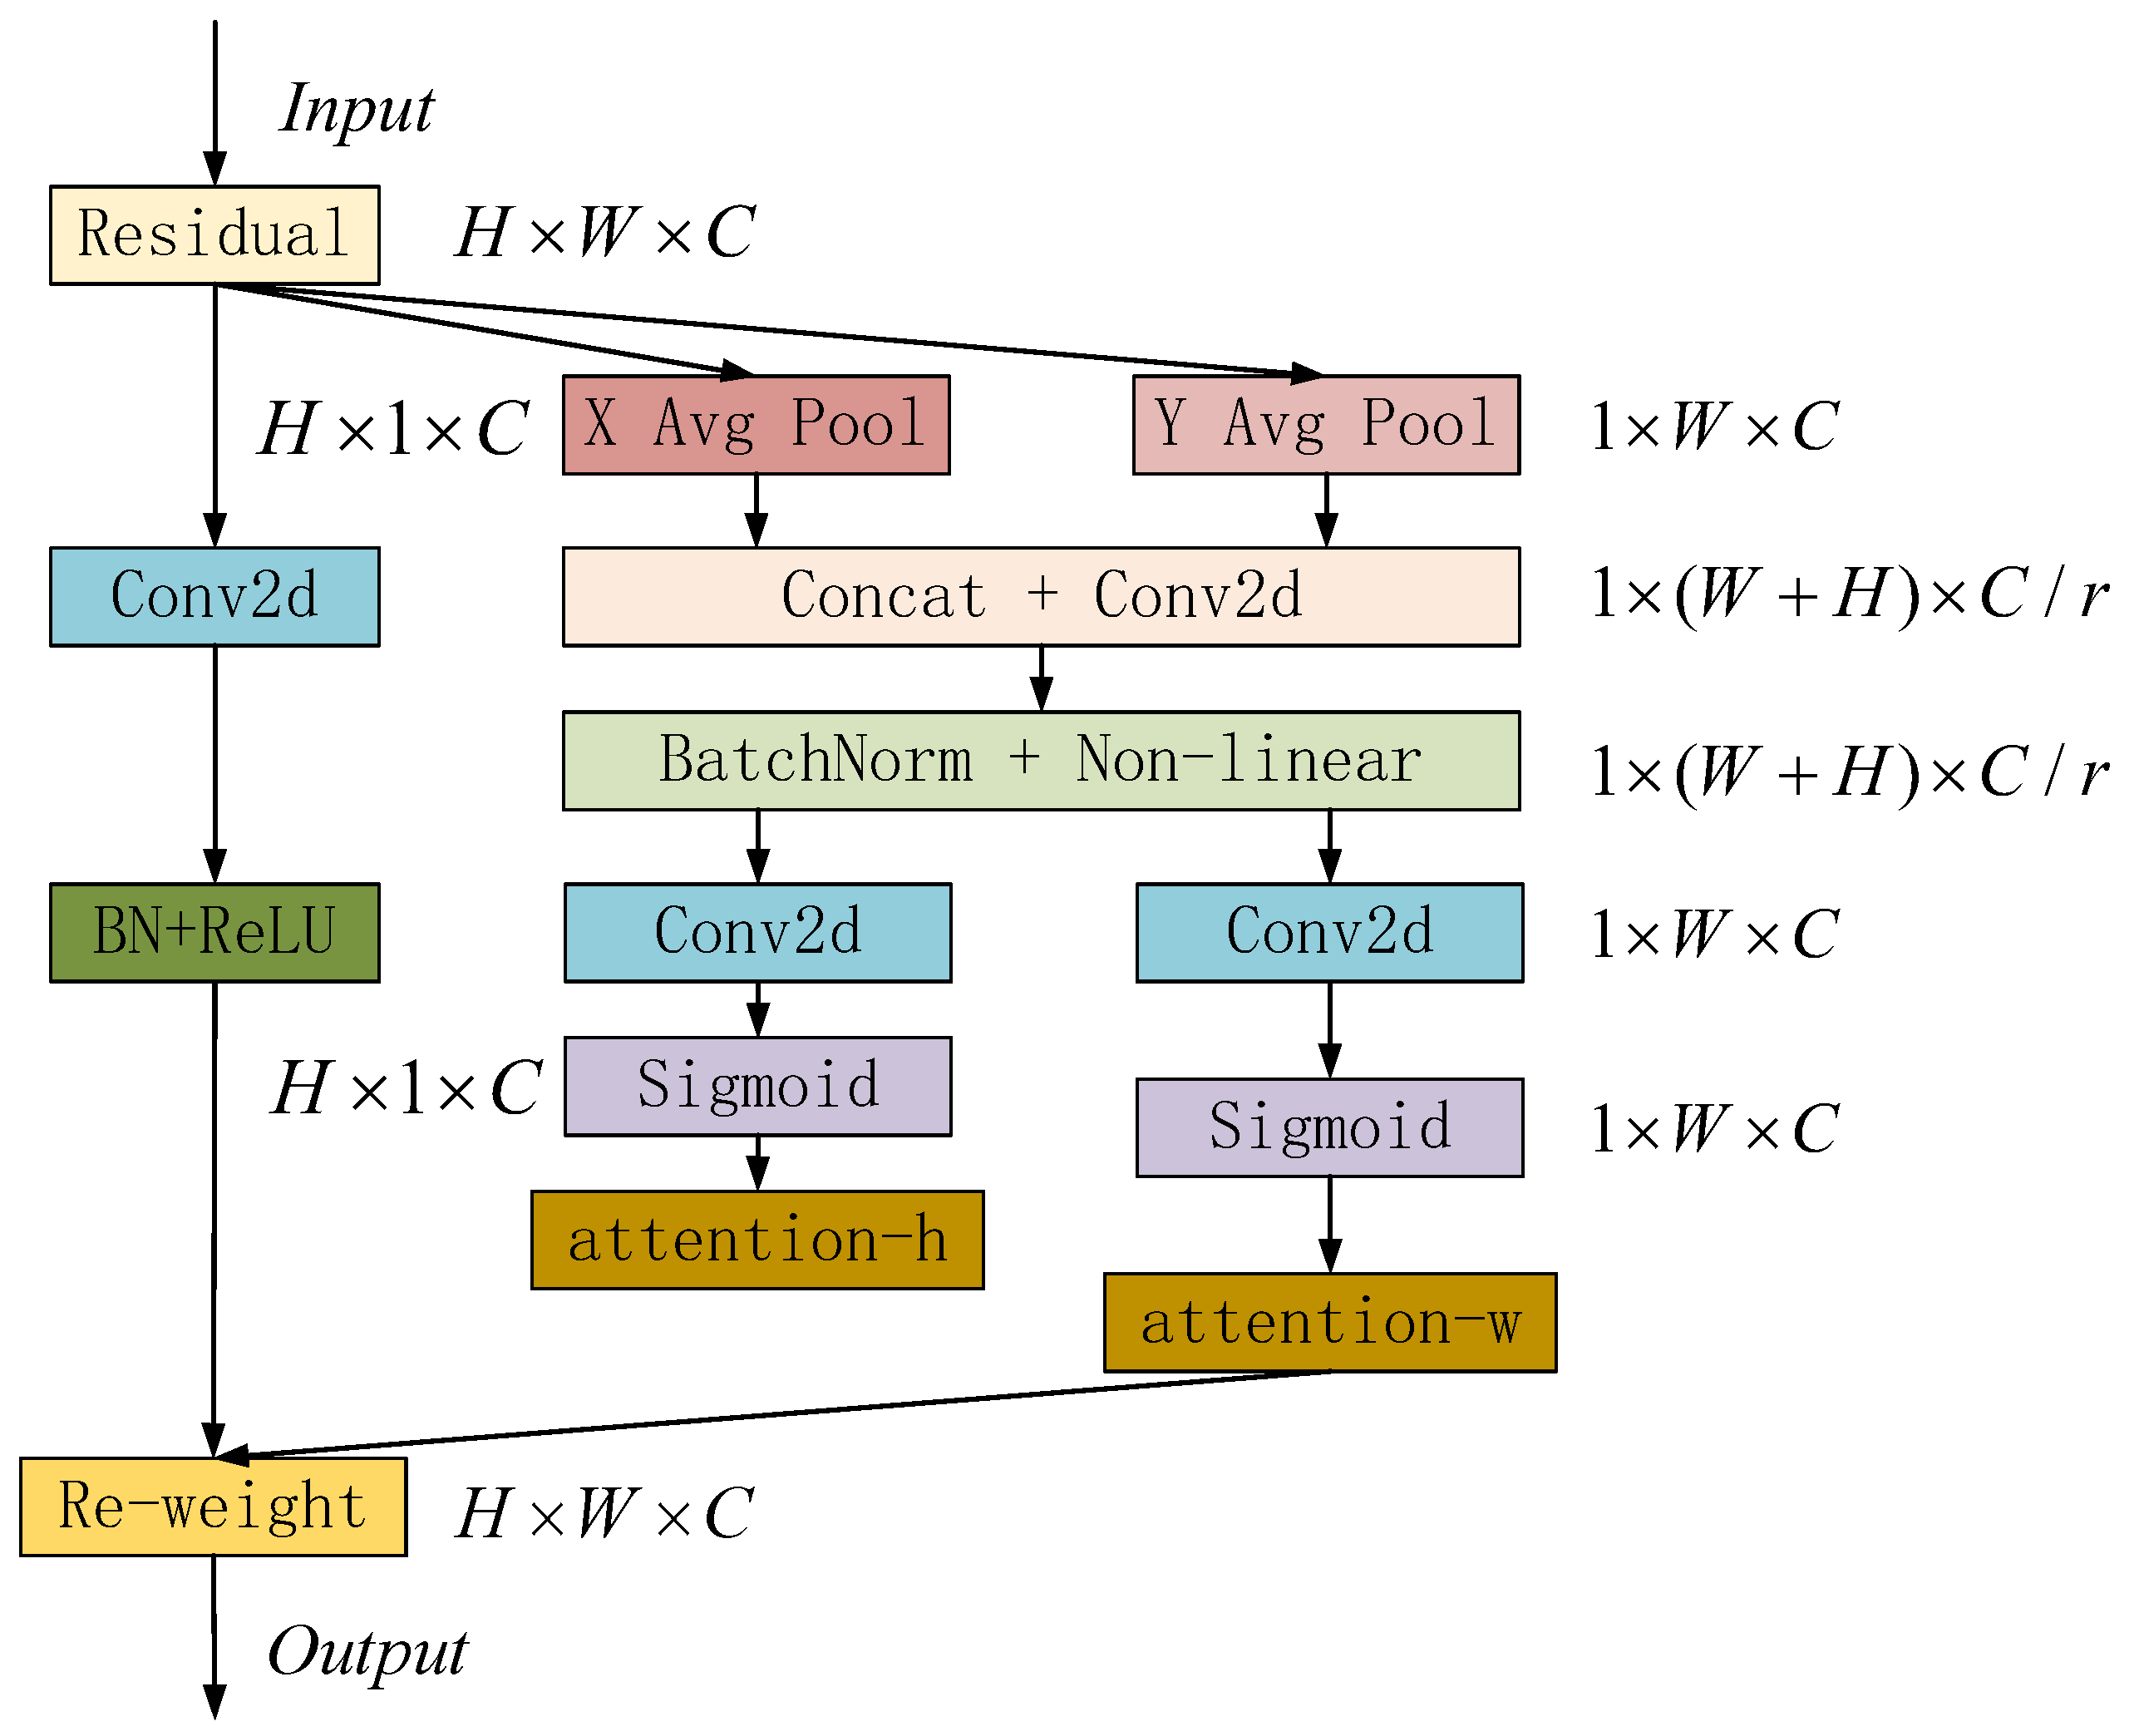
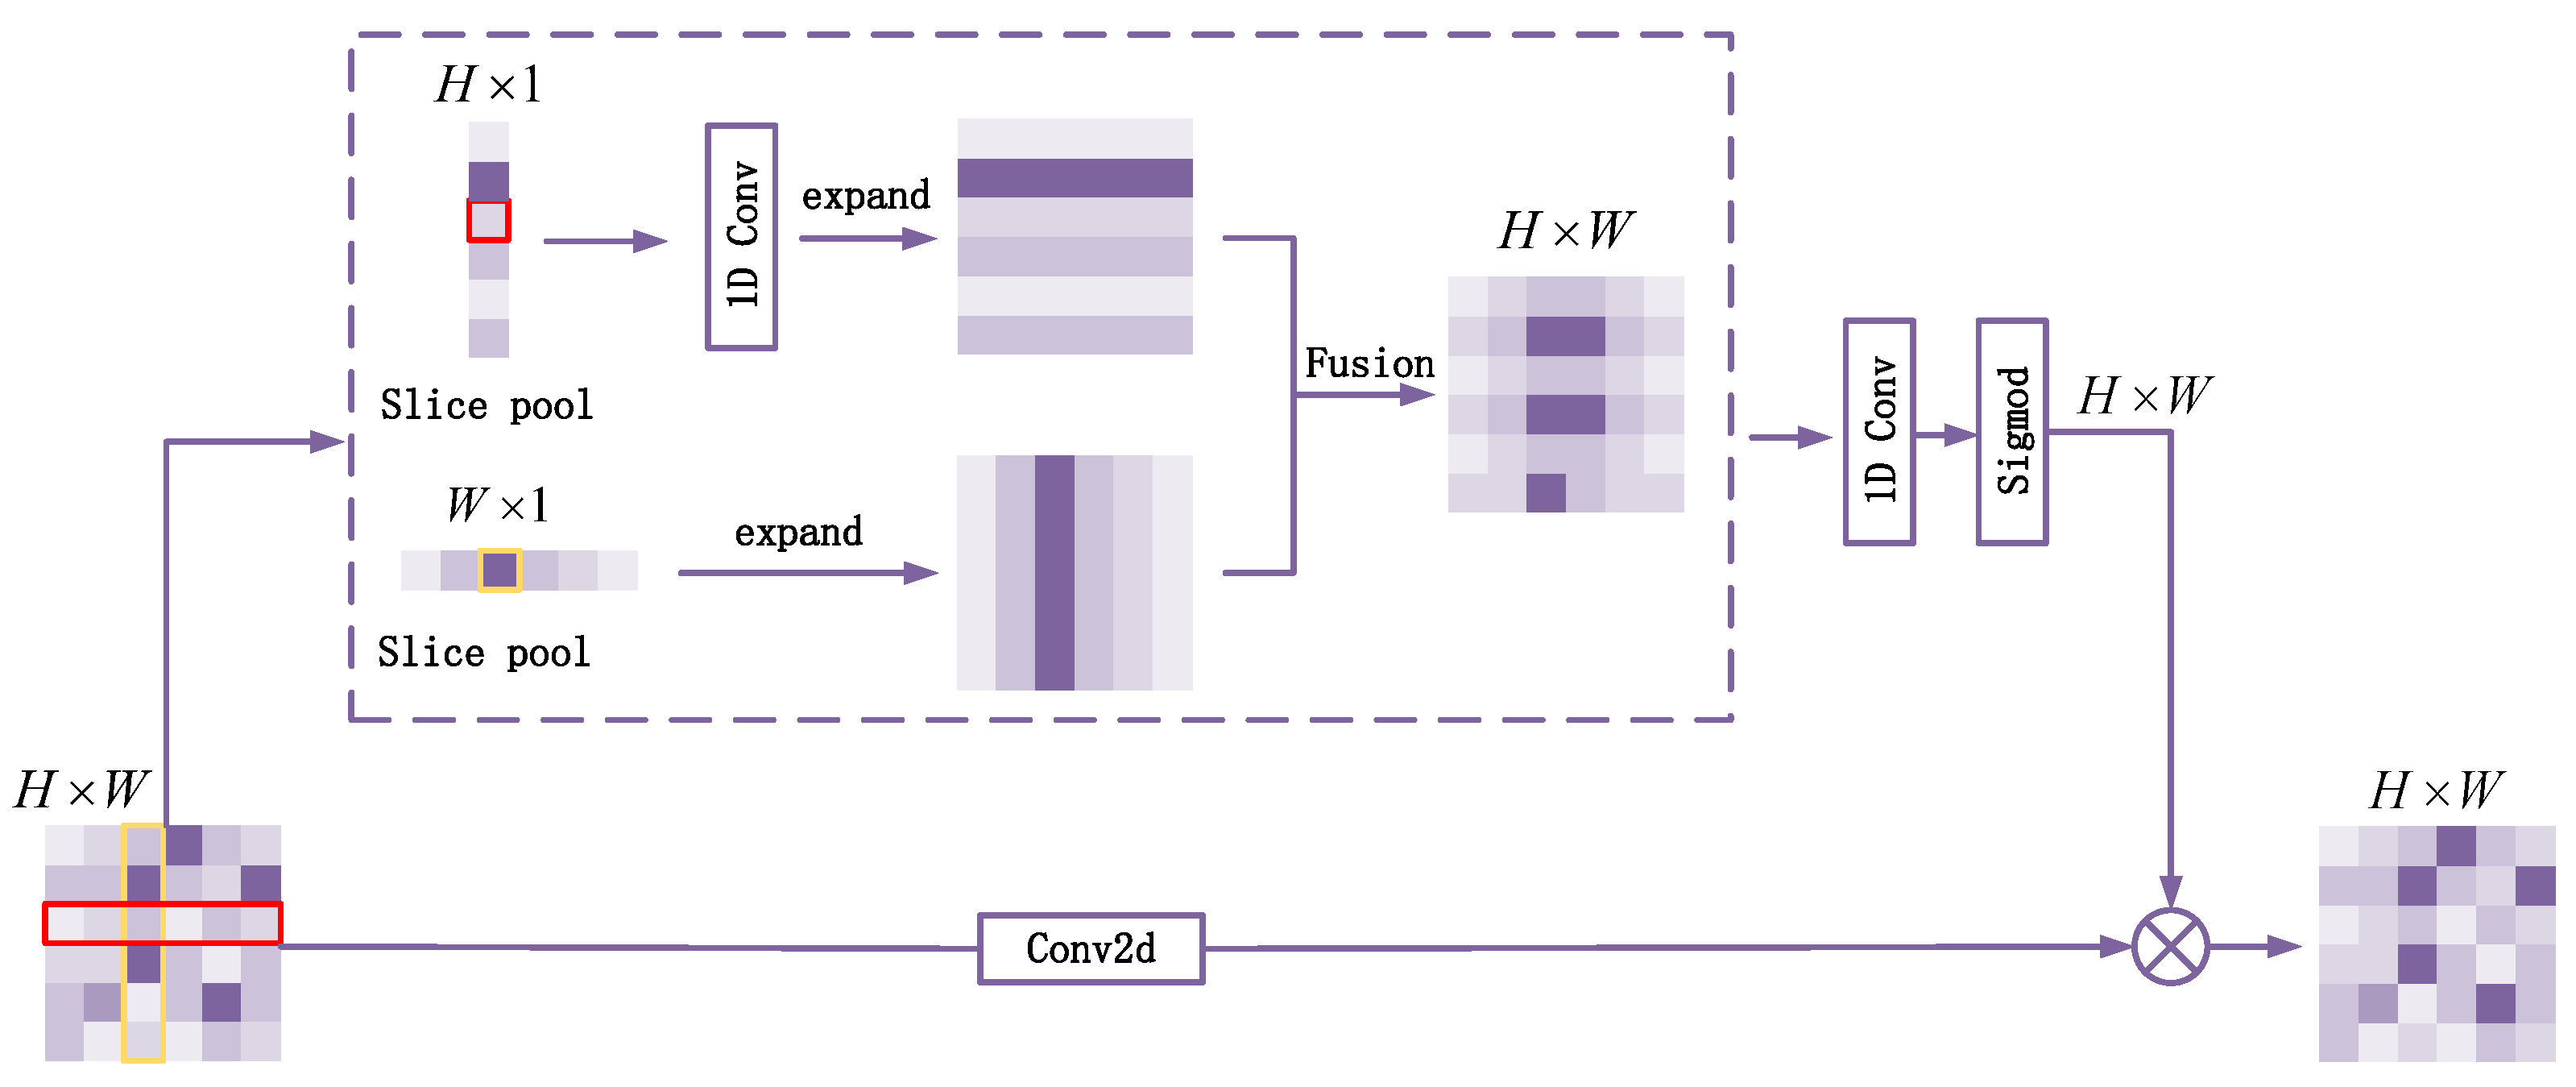
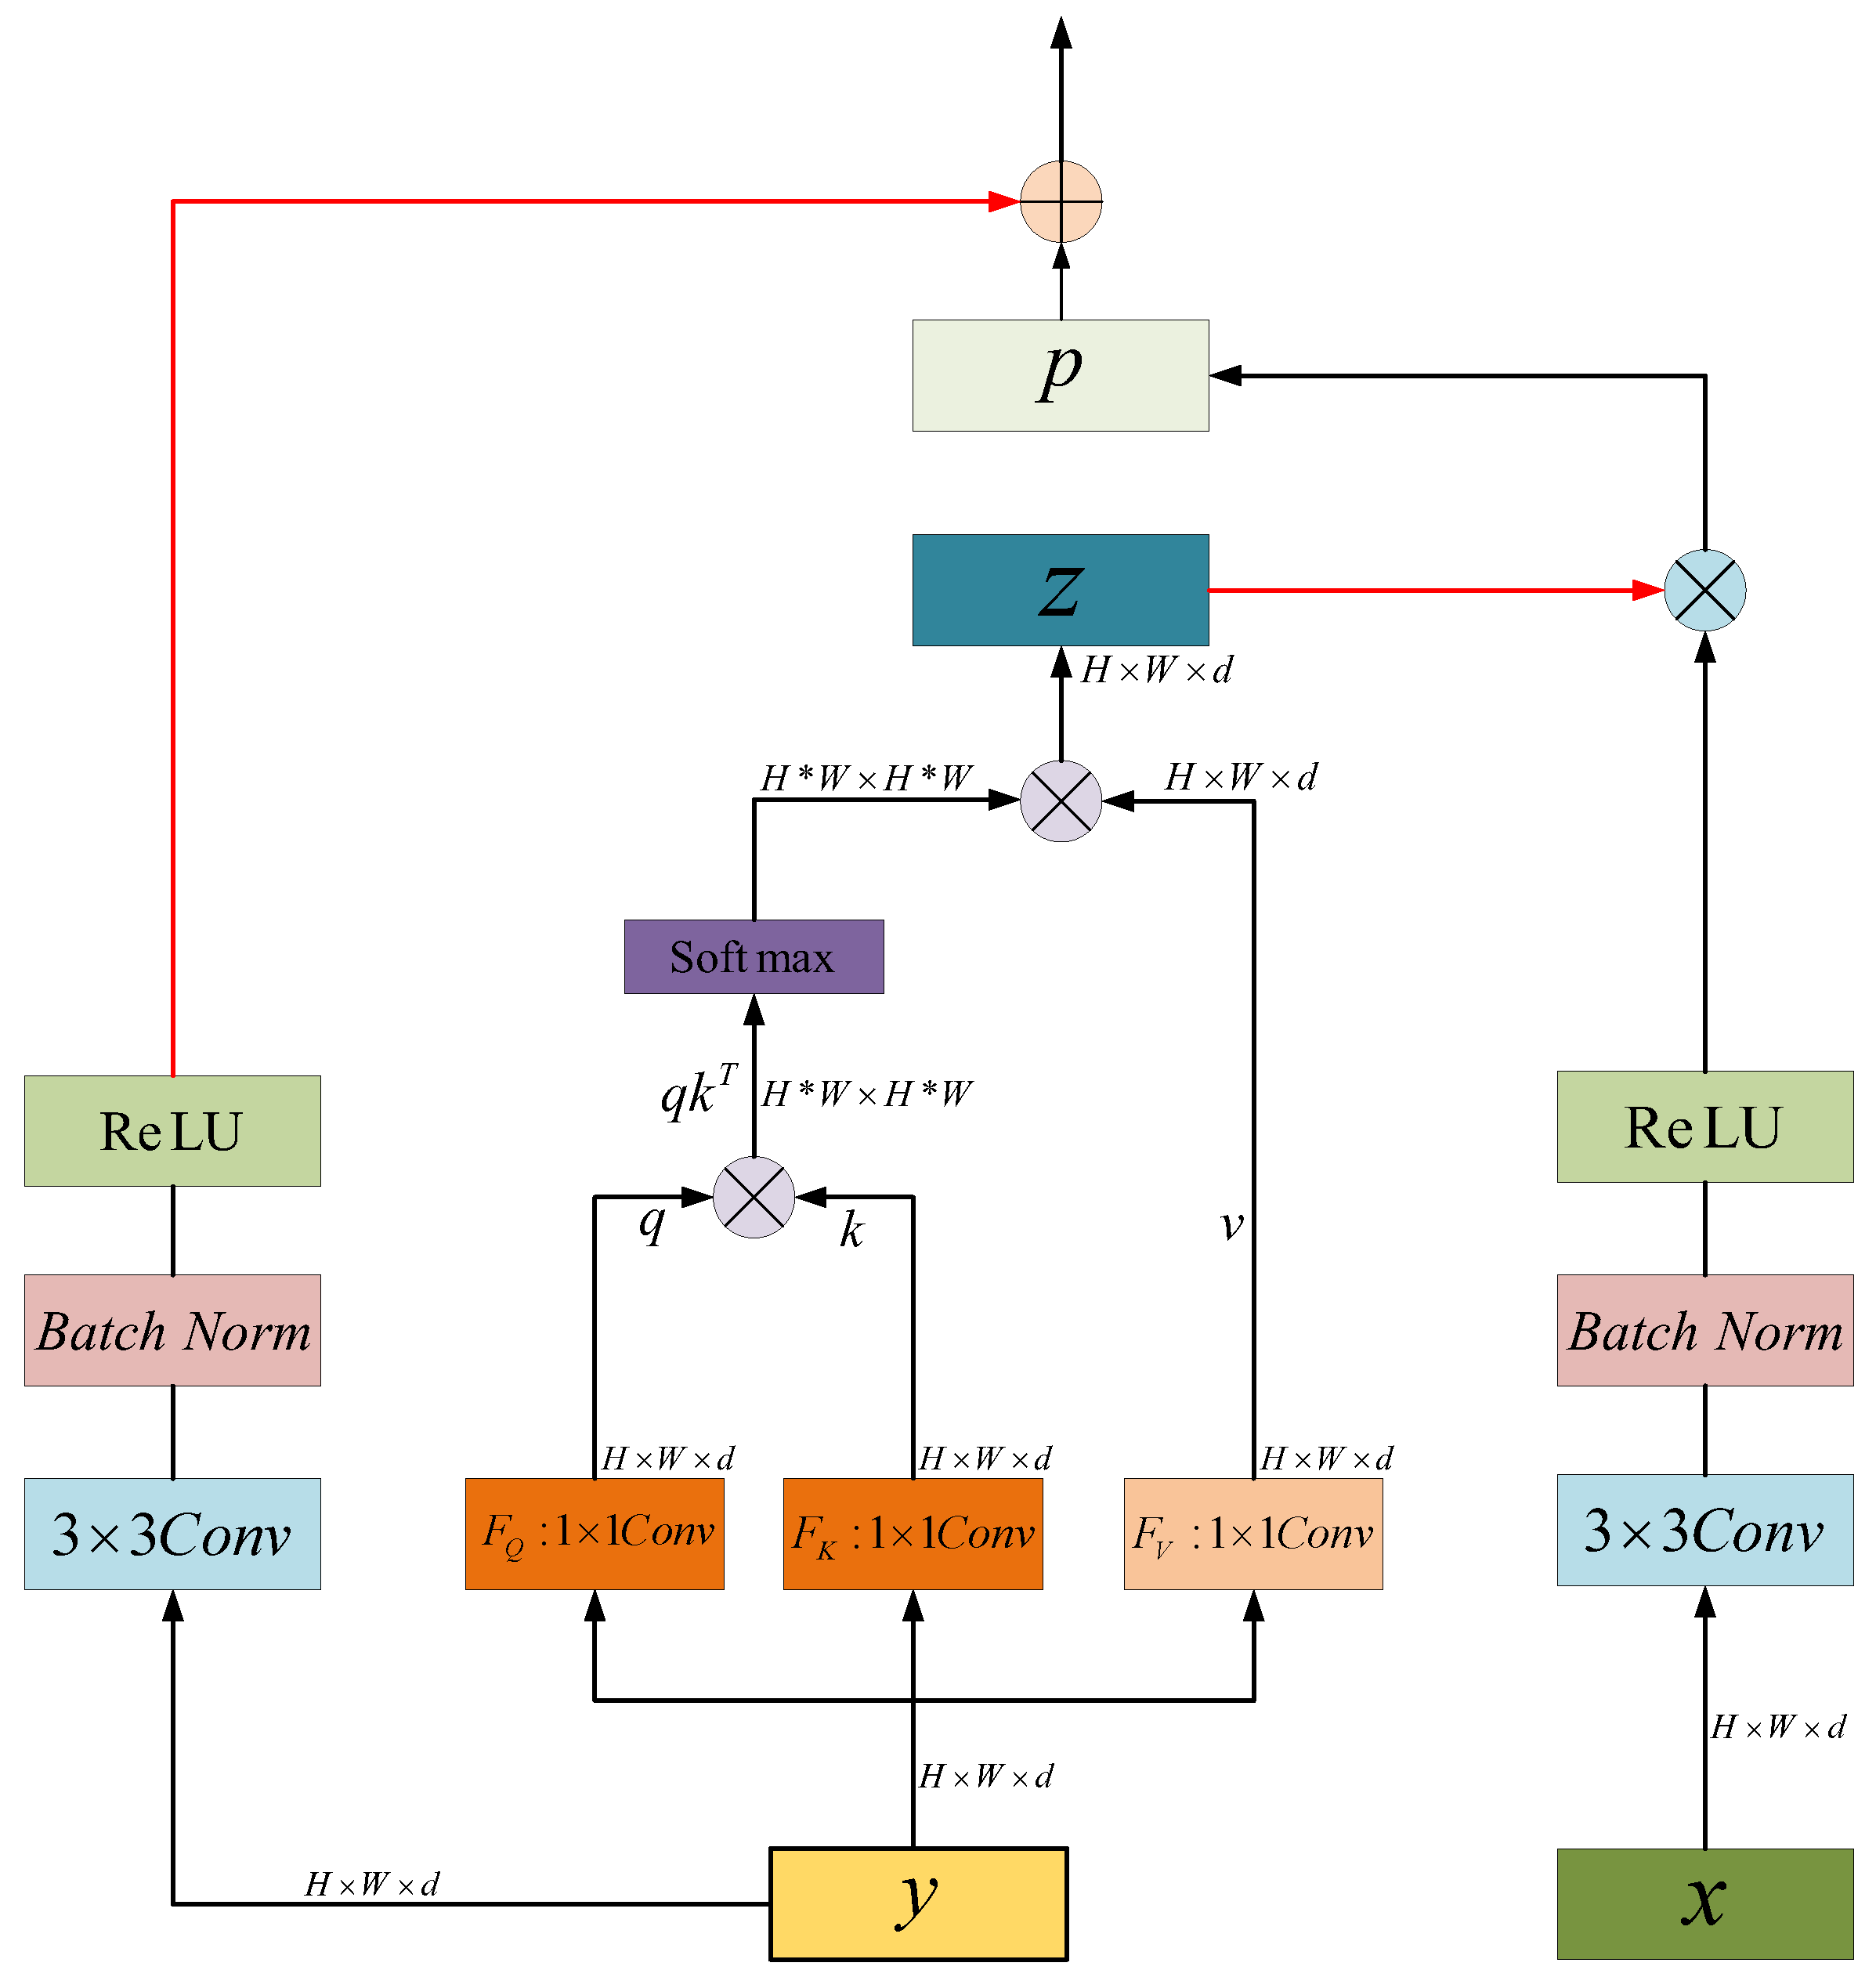
In our proposed local feature search network, ResNet18 is used as the backbone network for feature extraction to obtain feature information with rich semantic information. Then, a discarding attention module DAM is constructed to read sensitive information through direction and location, discard irrelevant information, and make the model locate and identify the target area more accurately. In addition, the SPM chip pooling module we propose can acquire a large receptive field in pixel by pixel prediction tasks through parallel pooling operation, and the network can capture a wide range of context information, thus avoiding the establishment of most unnecessary connections between locations far away from each other, so as to improve the ability to capture remote spatial dependencies and utilize inter channel dependencies. The FAUM fusion attention up sampling module proposed in this paper is used to guide the backbone network feature map to obtain the feature information on the spatial dimension. Finally, the feature map is recovered through up sampling, and the output result is a more detailed prediction image, while providing better pixel level attention for high-level feature maps. Experiments on high resolution remote sensing image semantic segmentation dataset show that the MIoU of the proposed local feature search network, DSFNet, reaches 83.73%. Compared with the existing semantic segmentation model, this model has the highest accuracy, which verifies the effectiveness of this model.
Contributions of this paper are as follows:
1. This paper proposes a local feature search network for building and water area segmentation in high-resolution remote sensing images. The Discard Attention Module (DAM) reads sensitive information through direction and location, discards irrelevant information, and enables the model to locate and identify the target area more accurately. It can not only capture cross channel information, but also integrate spatial coordinate information efficiently by embedding location information into channel attention, so that mobile networks can obtain larger area information without introducing large overhead. This method can better solve the problems of misjudgment of large areas of buildings and edge blurring in the process of water area segmentation.
2. In the work, the Slice Pooling Module (SPM) is built to obtain a large receptive field in the pixel by pixel prediction task through parallel pooling operation, so that the network can capture a wide range of context information, and the range of slice pooling considerations is long and narrow, rather than the entire feature map, thus avoiding the establishment of most unnecessary connections between locations that are far away from each other, to improve the ability to capture remote spatial dependencies and utilize inter channel dependencies.
3. The Fusion Attention Upsampling Module (FAUM) built in the project is used to guide the backbone network feature map to capture the feature information of remote spatial dimensions and channels. The feature information of horizontal direction and position is extracted from the discard attention module (DAM) and slice pooling module (SPM), so as to efficiently integrate the spatial coordinate information and provide better pixel level attention for high-level feature maps. It can effectively enhance the local information search ability of the model and improve the segmentation accuracy.
The rest of this article is organized as follows: Section 2 describes DFSNet and the functions of each module. Section 3 describes the experimental setup and data details. Section 4 summarizes the corresponding work of this paper and puts forward the future research direction.

2. Network Structure

With the increase of remote sensing image resolution, the detailed information and complex spatial information of remote sensing images have increased dramatically. The current semantic segmentation model is not good at effective segmentation under complex data sets. In complex spatial information, it is easy to have problems such as misjudgment of buildings and loss of local information in water areas. The existing land cover classification models still need to be improved in the extraction of horizontal direction and location features. Therefore, a local feature search network (DFSNet) is proposed. The overall framework of the network is shown in Figure 1. DFSNet is an end-to-end training model, which is divided into a decoding network and a coding network. The encoding network uses ResNet18 [28] as the backbone network for feature extraction. The decoding network consists of discarded attention module (DAM), slice pooling module (SPM) and fused attention upsampling module (FAUM). DAM module reads sensitive information through direction and location, discards irrelevant information, so that the model can more accurately locate and identify the target area, and enhance the search ability of local information on the network. The SPM module obtains a large receptive field in the pixel by pixel prediction task through parallel pooling operation, so that the network can capture a wide range of context information, thus avoiding the establishment of most unnecessary connections between locations that are far away from each other, so as to improve the problem of large area misjudgment of buildings and fuzzy water edge information in the whole network segmentation process. The FAUM module effectively integrates the backbone network feature map and the feature information extracted by DAM and SPM to guide the backbone network to obtain the semantic information on the spatial dimension, thus improving the segmentation accuracy. Finally, bilinear interpolation and two times of up sampling are directly used to obtain the segmented output results.

2.1. Encoding Network

This paper takes ResNet18 as the backbone network and extracts the network feature layer. After the emergence of AlexNet [29], many excellent network models have emerged, such as VGG [30] with deeper network layers, GoogleNet [31] with modular network structure (Inception), lightweight network models, MobileNet [32] and ShuffleNet [33] suitable for mobile devices, segmentation models FCN, UNet, etc. ResNet is proposed to solve the problem of network degradation. VGG network studies the problem of increasing network depth to improve classification accuracy, but deeper and wider networks can mine more abstract feature representations in data to improve classification efficiency. However, too large network models will increase training consumption, reduce training efficiency, and may also reduce the generalization of the network, resulting in over fitting, ResNet can well use the residual network structure to build a deep network and solve the degradation and gradient problems. After weighing the characteristics and accuracy of the network, we chose ResNet18 as our backbone network. Layer by layer sampling can obtain richer semantic information and be provided to the decoding network for semantic information decoding.

Baseline

ResNet can alleviate the network degradation caused by network layer deepening through residual structure. The introduction of residual structure is helpful to solve the problems of gradient disappearance and gradient explosion. Let us not only train the deeper network, but also ensure good information. Compared with the serial structure of the ordinary network, as shown in Figure 2, the residual unit adds a jump mapping, which directly adds the input and output to supplement the feature information lost in the convolution process. For a stack layer structure, when the input is x, the special record learned is F ( x ) . Now add a branch and jump directly to the output of the stack layer. At this time, the final output H ( x ) = F ( x ) + x .The detailed parameter settings of the entire ResNet-18 are shown in Table 1.

2.2. Decoding Network

The decoding network is responsible for decoding the encoded information and recovering the semantic information of the feature map. The decoding network is mainly composed of discarded attention module (DAM), slice pooling module (SPM) and fused attention upsampling module (FAUM). The DAM module reads sensitive information through direction and location, discards irrelevant information, and enables the model to more accurately locate and identify the target area to reduce the loss of water area feature information. The SPM module obtains a large receptive field in the pixel by pixel prediction task through parallel pooling operation, so that the network can capture a wide range of context information, and alleviate problems such as misjudgment of buildings and blurring of water area edges. FAUM module extracts the feature information of horizontal direction and position from DAM module and SPM module, so as to efficiently integrate the spatial coordinate information, provide better pixel level attention for high-level feature map, enhance the search ability of the network for target feature information, and improve the segmentation precision.

2.2.1. Discard Attention Module

In land cover classification, the spectral information of the same object fed back from different directions and positions is different. Therefore, the main work of this module is to read the sensitive information through the direction and location [34], discard the irrelevant information, make the model locate and identify the target area more accurately, reduce the loss of building and water area feature information, and enhance the network target location capability [35].
We consider the relationship between channels and the location information at the same time. It can not only capture cross channel information, but also embed the location information into the channel attention, so that the mobile network can obtain larger regional information without introducing large overhead. In order to avoid the loss of location information caused by the introduction of 2D global pooling, this paper proposes to decompose channel attention into two parallel 1D feature codes to efficiently integrate spatial coordinate information, namely our Discard Attention Module (DAM), as shown in Figure 3. The DAM attention mechanism module aims to enhance the expression ability of mobile network learning features. It can input X = [ x 1 , x 2 , , x c ] R H × W × C to any intermediate feature tensor in the network, and output tensor Y = [ y 1 , y 2 , , y c ] R H × W × C of the same size after transformation.
Two 1D global pooling operations are used to pool the input features along the vertical and horizontal directions to get two 1D vectors, Concat and 1 × 1 Conv is used to compress the channel, then BN and Non linear are used to encode the spatial information in the vertical and horizontal directions, then split, and then 1 × 1 Conv gets the same number of channels as the input characteristic graph, and after splitting, it passes 1 × 1 The convolution obtains two attention information attention_h and attention_w respectively. After discarding attention_h, the obtained attention_w captures the long-distance dependency of the input feature map along a spatial direction. The location information is saved by attention_w, and then attention_w is applied to the input feature map by multiplication to emphasize the presentation of the attention region.
In order to obtain attention on image width and height and encode accurate position information, DAM first divides the input feature map into height and width directions for global average pooling, first uses the pooling cores of (H, 1) and (1, W) to encode each channel along the horizontal and vertical coordinate directions, and then obtains the feature map of channel c in width w and height h directions, as shown in the following Equation (1):
g c h ( h ) = 1 W 0 i W x c ( h , i ) , g c w ( w ) = 1 H 0 j H x c ( j , w ) .
The above two transformations aggregate features along two spatial directions respectively to obtain a pair of direction aware feature maps. These two transformations also allow the attention module to capture the long-term dependence along one spatial direction, and save the location information along the other spatial direction, which helps the network locate the target of interest more accurately.
After the transformation of information embedding, this part will concat the above transformation, and then use 1 × 1 Conv. Convolution transformation function F 1 is used for transformation, δ is a nonlinear activation function, and η is an intermediate feature mapping for encoding spatial information in horizontal and vertical directions, as shown in Equation (2) below:
η = δ ( F 1 ( [ g h , g w ] ) ) .
Then, along the spatial dimension, η is divided into two separate tensors η h R C / r × H and η w R C / r × W , where r represents the down sampling ratio, and r = 8 in the experiment. Reuse two 1 × 1 Convolution F h and F w transform the characteristic graph η h and η w to the same number of channels as the input characteristic graph x, and then generate two attention weights z h and z w through the sigmod activation function, respectively, z h and z w correspond to the attention_h and attention_w in the graph. σ is the sigmod activation function. The calculation process is shown in Equation (3):
z h = σ ( F h ( η h ) ) , z w = σ ( F w ( η w ) ) .
Then the weights of z h and z w are expanded. During the training, z h , that is, attention_h, is discarded to emphasize the representation of the attention region. The DAM module simultaneously completes the horizontal and vertical attention. At the same time, the redundant information in the vertical direction is discarded during the training, which enhances the network’s attention to the horizontal direction. Multiply the final weight by the output of the left branch to calibrate the channel feature information, emphasize the representation of the attention region, multiply the obtained attention weight z w by the output of the left branch, and finally obtain the output of the DAM module as shown in Equation (4):
y c ( i , j ) = x c ( i , j ) × z c w ( j ) ,
where, x c ( i , j ) is the output result of the left branch, and is the characteristic graph x passing through 1 × 1 After the convolution transformation function F 1 is converted, it is obtained through normalization and ReLu processing. β is normalized processing and γ is ReLU function to prevent gradient explosion caused by too deep network. The calculation process is shown in Formula (5):
x c ( i , j ) = γ ( β ( F 1 ( X ) ) ) .

2.2.2. Slice Pooling Module

The conventional receptive field is generally pooled in the conventional rectangular area of N × N . By using parallel pooling operation to obtain large receptive fields in pixel by pixel prediction tasks, the network can capture a wide range of context information [36], and has proven its potential on multiple scene resolution benchmarks. However, due to the shape of the square core, its ability to use context information is limited [37]. In this chapter, a new pooling strategy is adopted, and the long strip slice pool core is used to implement pooling operations. The pool core is redesigned as N × 1 and 1 × N , so as to build a slice pool module (SPM), as shown in Figure 4.
In the module reasoning process, a two-dimensional tensor with size of H × W is input, and the upper branch is operated by using the bar pool core with size of H × 1 and 1 × W , averaging the element values in the pool core, and taking this value as the pool output value. The calculation process is shown in Equation (6).
g i h = 1 W 0 j W x i , j , g j z = 1 H 0 i H x i , j .
Note that the dimension of input x is C × H × W , where C is the number of input channels. x uses 1D Conv to expand the feature map up and down through the pooled window (H, 1), where the core size is 3. x directly expands from left to right through the pooled window (1, W). After the expansion, the corresponding elements at each location are added to form a new feature map, defining g c , j h R C × W , g c , j z R C × W , and then g R C × H × W can be expressed as Equation (7).
g c , i , j = g c , j h + g c , j z
The original image passes through the one-dimensional convolution layer in the lower branch, and its core size is 1, which is used to modulate the current position and its adjacent features. The final output M can be expressed as Equation (8).
M = M u l t i ( σ ( x ) , σ ( F 1 ( g ) ) ) ,
where M u l t i ( · , · ) represents element multiplication by bit, σ represents sigmoid function, and F 1 represents 1 × 1 convolution. Compared with global average pooling, slice pooling considers a long and narrow range, rather than the entire feature map, thus avoiding the establishment of most unnecessary connections between locations that are far away from each other, so as to improve the ability to capture remote spatial dependencies and make use of inter channel dependencies, thereby further enhancing the ability to obtain horizontal direction information of the network and obtain more local feature information.

2.2.3. Fusion Attention Upsampling Module

The main idea of the FAUM module is that it can integrate context information of different scales [23,38], and at the same time, it can provide better pixel level attention [39] for high-level feature maps, so as to enhance the local search ability of the horizontal direction and location of the model, and enhance the local details of the building and water body segmentation map. The whole module structure is shown in Figure 5.
FAUM module is a unit used for decoding. Specifically, we perform 3 × 3 convolution operation on low level feature x to reduce the number of channels of CNN feature graph and realize feature mapping x ^ of dimension H × W × d . The calculation process is shown in Equation (9) below.
x ^ = γ ( β ( F 3 ( x ) ) ) ,
where F 3 is 3 × 3 convolution, β is normalization, and γ is ReLU function. Then the attention mechanism is introduced, and the advanced feature graph y predicts a channel mask Z through attention. In order to reduce the calculation burden, three 1 × 1 convolutions, F Q , F K and F V , are defined in the initialization function. The whole attention prediction is essentially an addressing process. Given a task related query vector q, the attention distribution with the key value vector k is calculated and added to the value matrix vector v to predict a channel mask Z. The correlation is calculated by calculating the dot product of q and k, and the attention weight is calculated by softmax. The transposed k is multiplied by q to obtain the attention matrix A R ( H × W × d ) between two pairs of each position, and then the softmax operation is performed to obtain A ^ R ( H × W × d ) , and finally the v matrix is multiplied to output the channel mask Z R ( H × W × d ) . The whole calculation process is shown in Equation (10).
A ^ = s o f t max ( A ) = q k T , Z = v A ^
Then the output vector Z is multiplied by the low level feature to obtain a new feature p, namely p = x ^ Z , p R ( H × W × d ) . High level feature y goes through 3 × 3 After convolution, batch normalization and ReLU, realize feature mapping y ^ of dimension H × W × d , namely y ^ = γ ( β ( F 3 ( y ) ) ) . Finally, the new feature p and the high level feature y are added and gradually upsampled.

3. Experiment and Result Analysis

In order to verify the effectiveness of the local feature search network (DSFNet) proposed in this paper, we conducted experiments on our own land cover dataset and Massachusetts Buildings Dataset to verify the accuracy and generalization of the model. The quantitative analysis indexes of the experiment were pixel accuracy (PA), category average pixel accuracy (MPA), and average intersection to union ratio (MIoU). The model proposed in this paper is compared with the current excellent semantic segmentation models BisenetV2 [40], ExtremeC3 [41], FCN8s, PAN, PSPNet, Unet, SegNet [42], EsNet [43], EDANet [44], LinkNet [45], DeeplabV3plus [46], OcrNet [47], MSResNet [48]. The experimental results show that the neural network model proposed in this paper is superior to the comparison model in many evaluation indexes, which proves that the local feature search network (DSFNet) proposed in this paper has better segmentation effect in remote sensing image building and water body segmentation.

3.1. Datasets

3.1.1. Landcover Dataset

The main data set comes from Google Earth, which presents satellite photos, aerial photos and GIS in the form of 3D models. Capture several images on Google Earth with a resolution of 1500 × 800 . These large maps have a large space span and various shooting angles. They roughly fall into the following categories: villas in North America, villages and forests in Europe, Britain, France and Germany, and coastal rivers in China. To sum up, the coverage of the data set, including many complex terrain environments, realistically simulates the real land cover segmentation task scenarios, and fully examines the real detection capability of the model. These pictures are manually marked as three types of objects: buildings (white, RGB [255,255,255]), waters (blue, RGB [0,180,255]), and backgrounds (black, RGB [0,0,0]). The dataset is composed of 2000 large 1500 × 800 images cut into 224 × 224 images. The training data diagram is shown in Figure 6. The corresponding colors of the categories in Figure 6 are shown in Table 2.
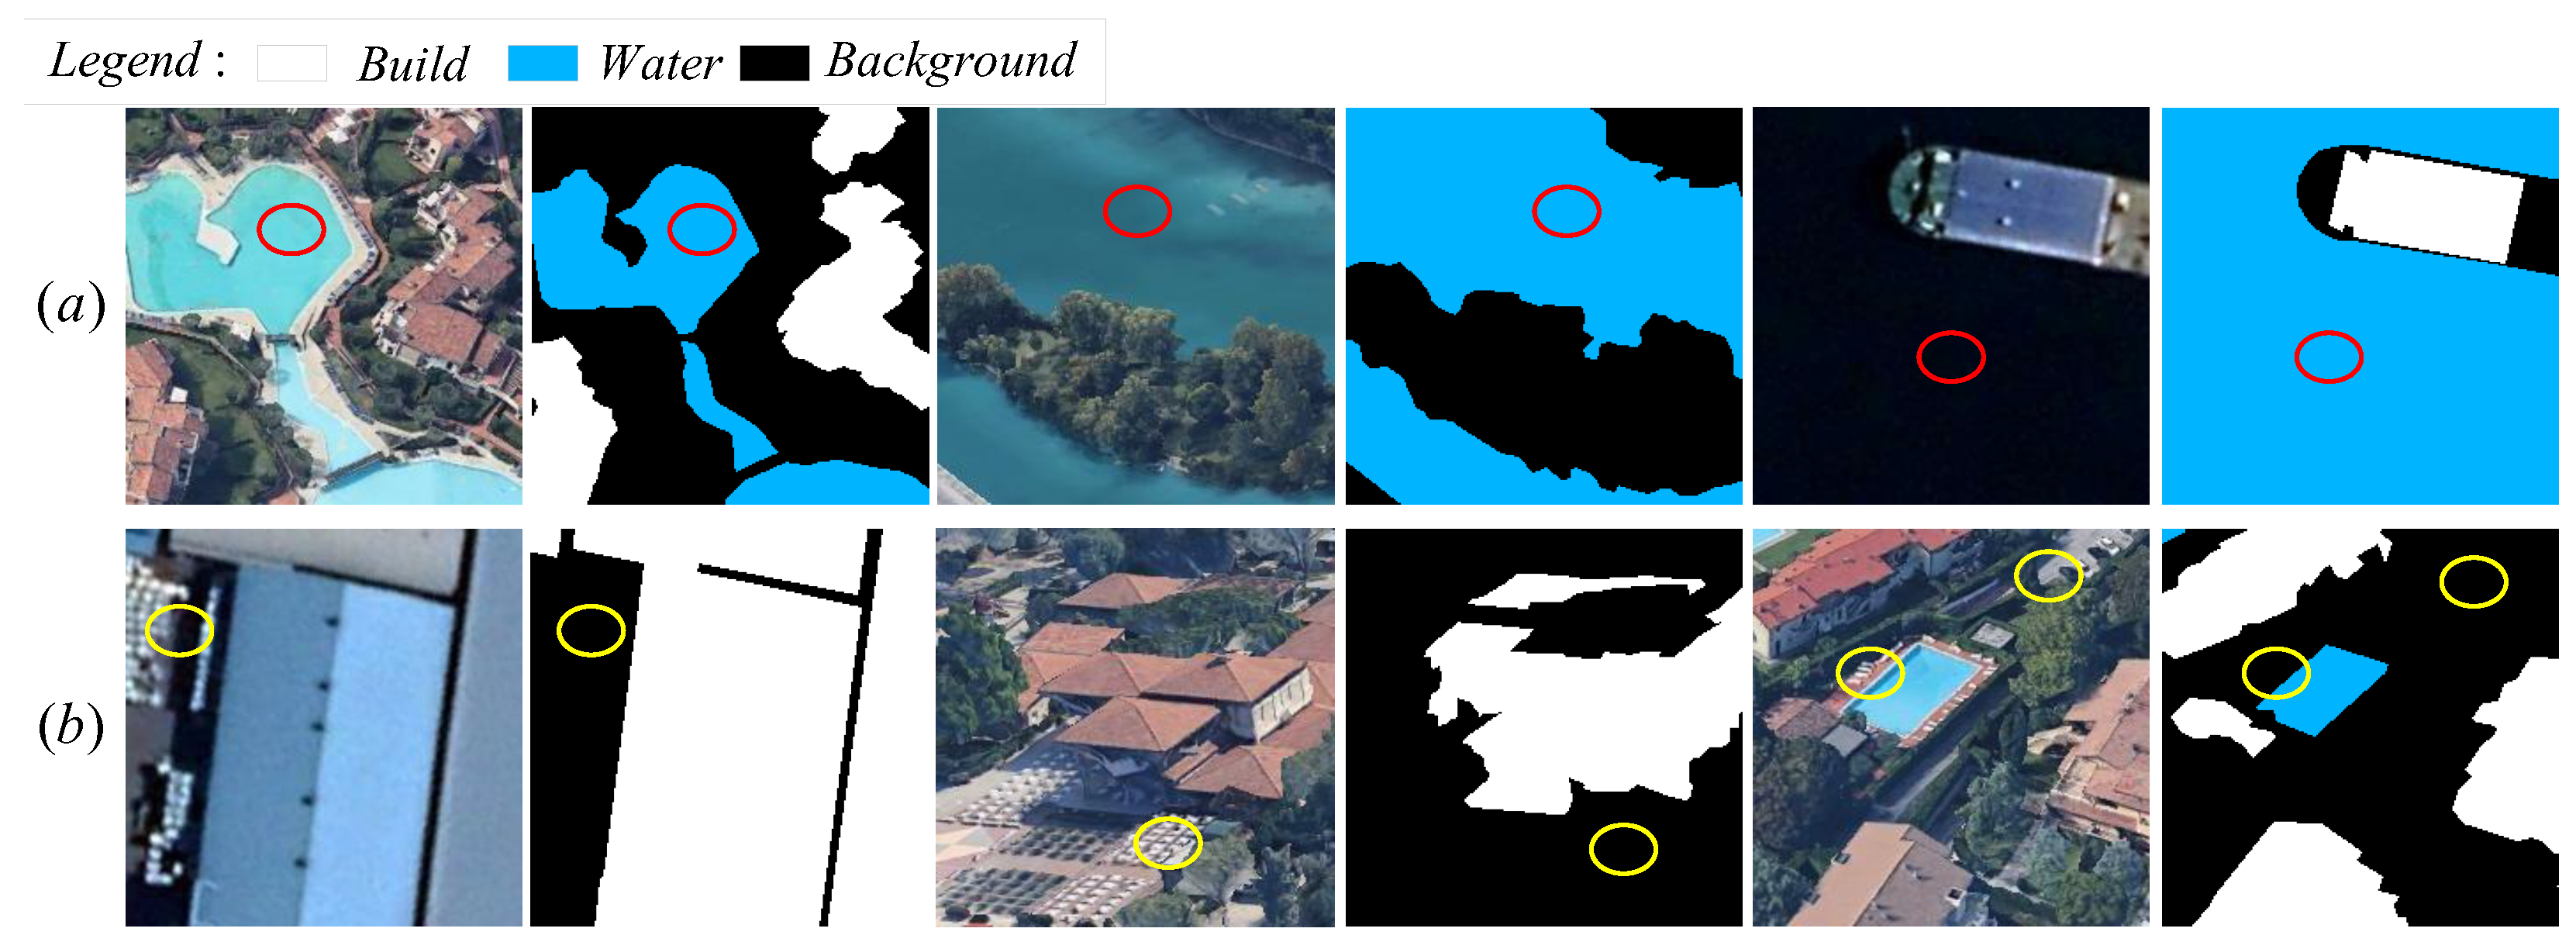
The semantic segmentation of the dataset is difficult. In addition to the multi-resolution and spatiotemporal span mentioned above, there are also strict definitions of three types of objects. The height difference of buildings is large, and the shadow casting of high buildings and trees will affect the edge contour segmentation of low buildings; Some waters will feed back different spectral information in different spaces. These remote sensing images with orthographic projection may cause indiscernibility in appearance. Objects circled by yellow lines look like low buildings, but they are actually roads and rows of storage boxes. To sum up, the entire dataset is complex and difficult to learn, and it is also difficult to make extremely accurate land cover segmentation and perfect target classification. Therefore, the proposed model has a better segmentation effect than the comparison model.
When processing this dataset, all images are segmented from left to right and from top to bottom, and there is no regional overlap during segmentation. As a result, more than 1500 images in total are selected for data enhancement [49] such as rotation and folding of 200 more complex images. Re-clean the collected data set, remove the solid color image with only black background in the label, and finally obtain the data set of more than 2000 images. Then they are randomly divided into training sets and test sets according to the ratio of 7:3.

3.1.2. Massachusetts Buildings Dataset

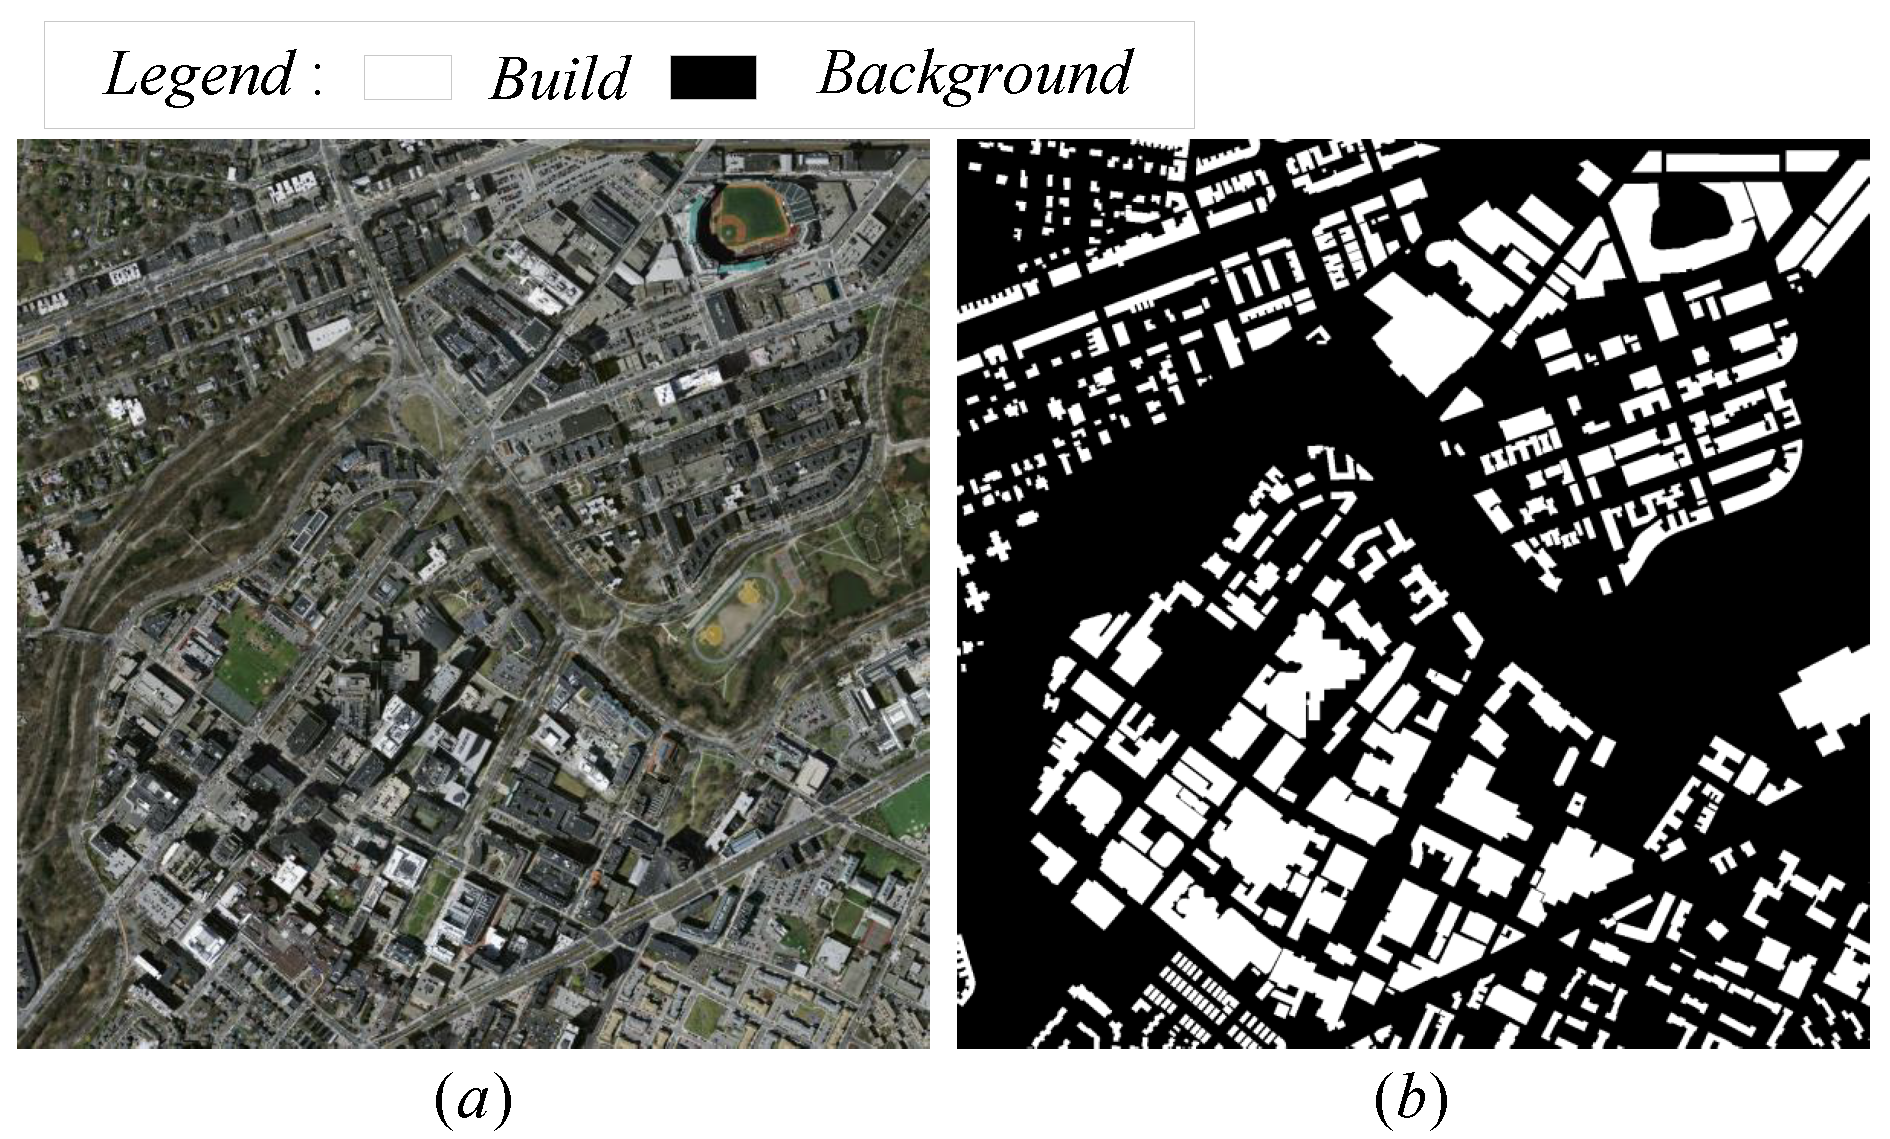
To verify the generalization capability of the proposed model, we used the Massachusetts Building Data Set.The Massachusetts Building Data Set consists of 151 aerial images of the Boston area, each with a pixel of 1500 × 1500 and an area of 2.25 square kilometers.Therefore, the entire dataset covers about 340 square kilometers. The target map is obtained by rasterizing the building contour lines obtained from the OpenStreetMap project. The Boston area selected in this paper is used for experiments. The data set is named Boston-A, which contains 64 original images and an average size of 1500 × 1500 . A in Figure 7 is the original image, and b in Figure 7 is the label. Boston—A consists of two categories: architecture and background. See Table 3 for the corresponding colors of the categories in Figure 7.
Since the original image size of Boston A is too large to directly input model training, we take the original data image (size 1500 × 1500 ) cut into 256 × 256 small size pictures, 2176 pictures obtained, of which the size is 256 × 256 . Finally, a new data set is obtained. There are 1523 pictures in the training set and 653 pictures in the test set.

3.2. Implementation Details

We take pixel accuracy (PA), category average pixel accuracy (MPA), and average intersection/merge ratio (MIou) as the evaluation indicators of the model. The network training parameters are as follows: use a single GTX3070 graphics card on the Windows platform for reasoning calculation. The model is built using the deep learning framework pytorch. All models have been trained for 300 epochs, with an initial learning rate of 0.001 and a batch size of 3. Set the weight attenuation of Adam optimizer to 0.0001, and the other parameters are the default values.

3.3. Ablation Study of Attention Module

In the ablation experiment, DAM modules are added to the second, third and fourth layers of the decoding path, allowing the attention module to capture the long-term dependence along one spatial direction and save the location information along the other spatial direction, which helps the network locate the target of interest more accurately. SPM module is added in the first layer to capture a wide range of context information. At the same time, the fusion attention up sampling module FAUM is used as the decoding block to fuse the details between channels, providing better pixel level attention for high-level feature maps. In order to verify the effectiveness of the above modules, several ablation experiments were carried out on the master dataset. As shown in Table 4, the combination of different modules with ResNet18 as the baseline network significantly improves the network performance. Specifically, compared with the baseline, only adding FAUM modules has brought 8.16% improvement to MIoU. These results strongly prove the advantages of decoding paths constructed with FAUM modules. Only adding SPM and FAUM modules further improves the network performance, bringing 6.81% improvement to MIoU, and only adding DAM and FAUM modules brings 6.36% improvement to MIoU. After all the modules proposed in this paper are combined, compared with the best MIoU results of other methods, the classification capacity is increased by 2.89%, with the highest value reaching 83.73%.
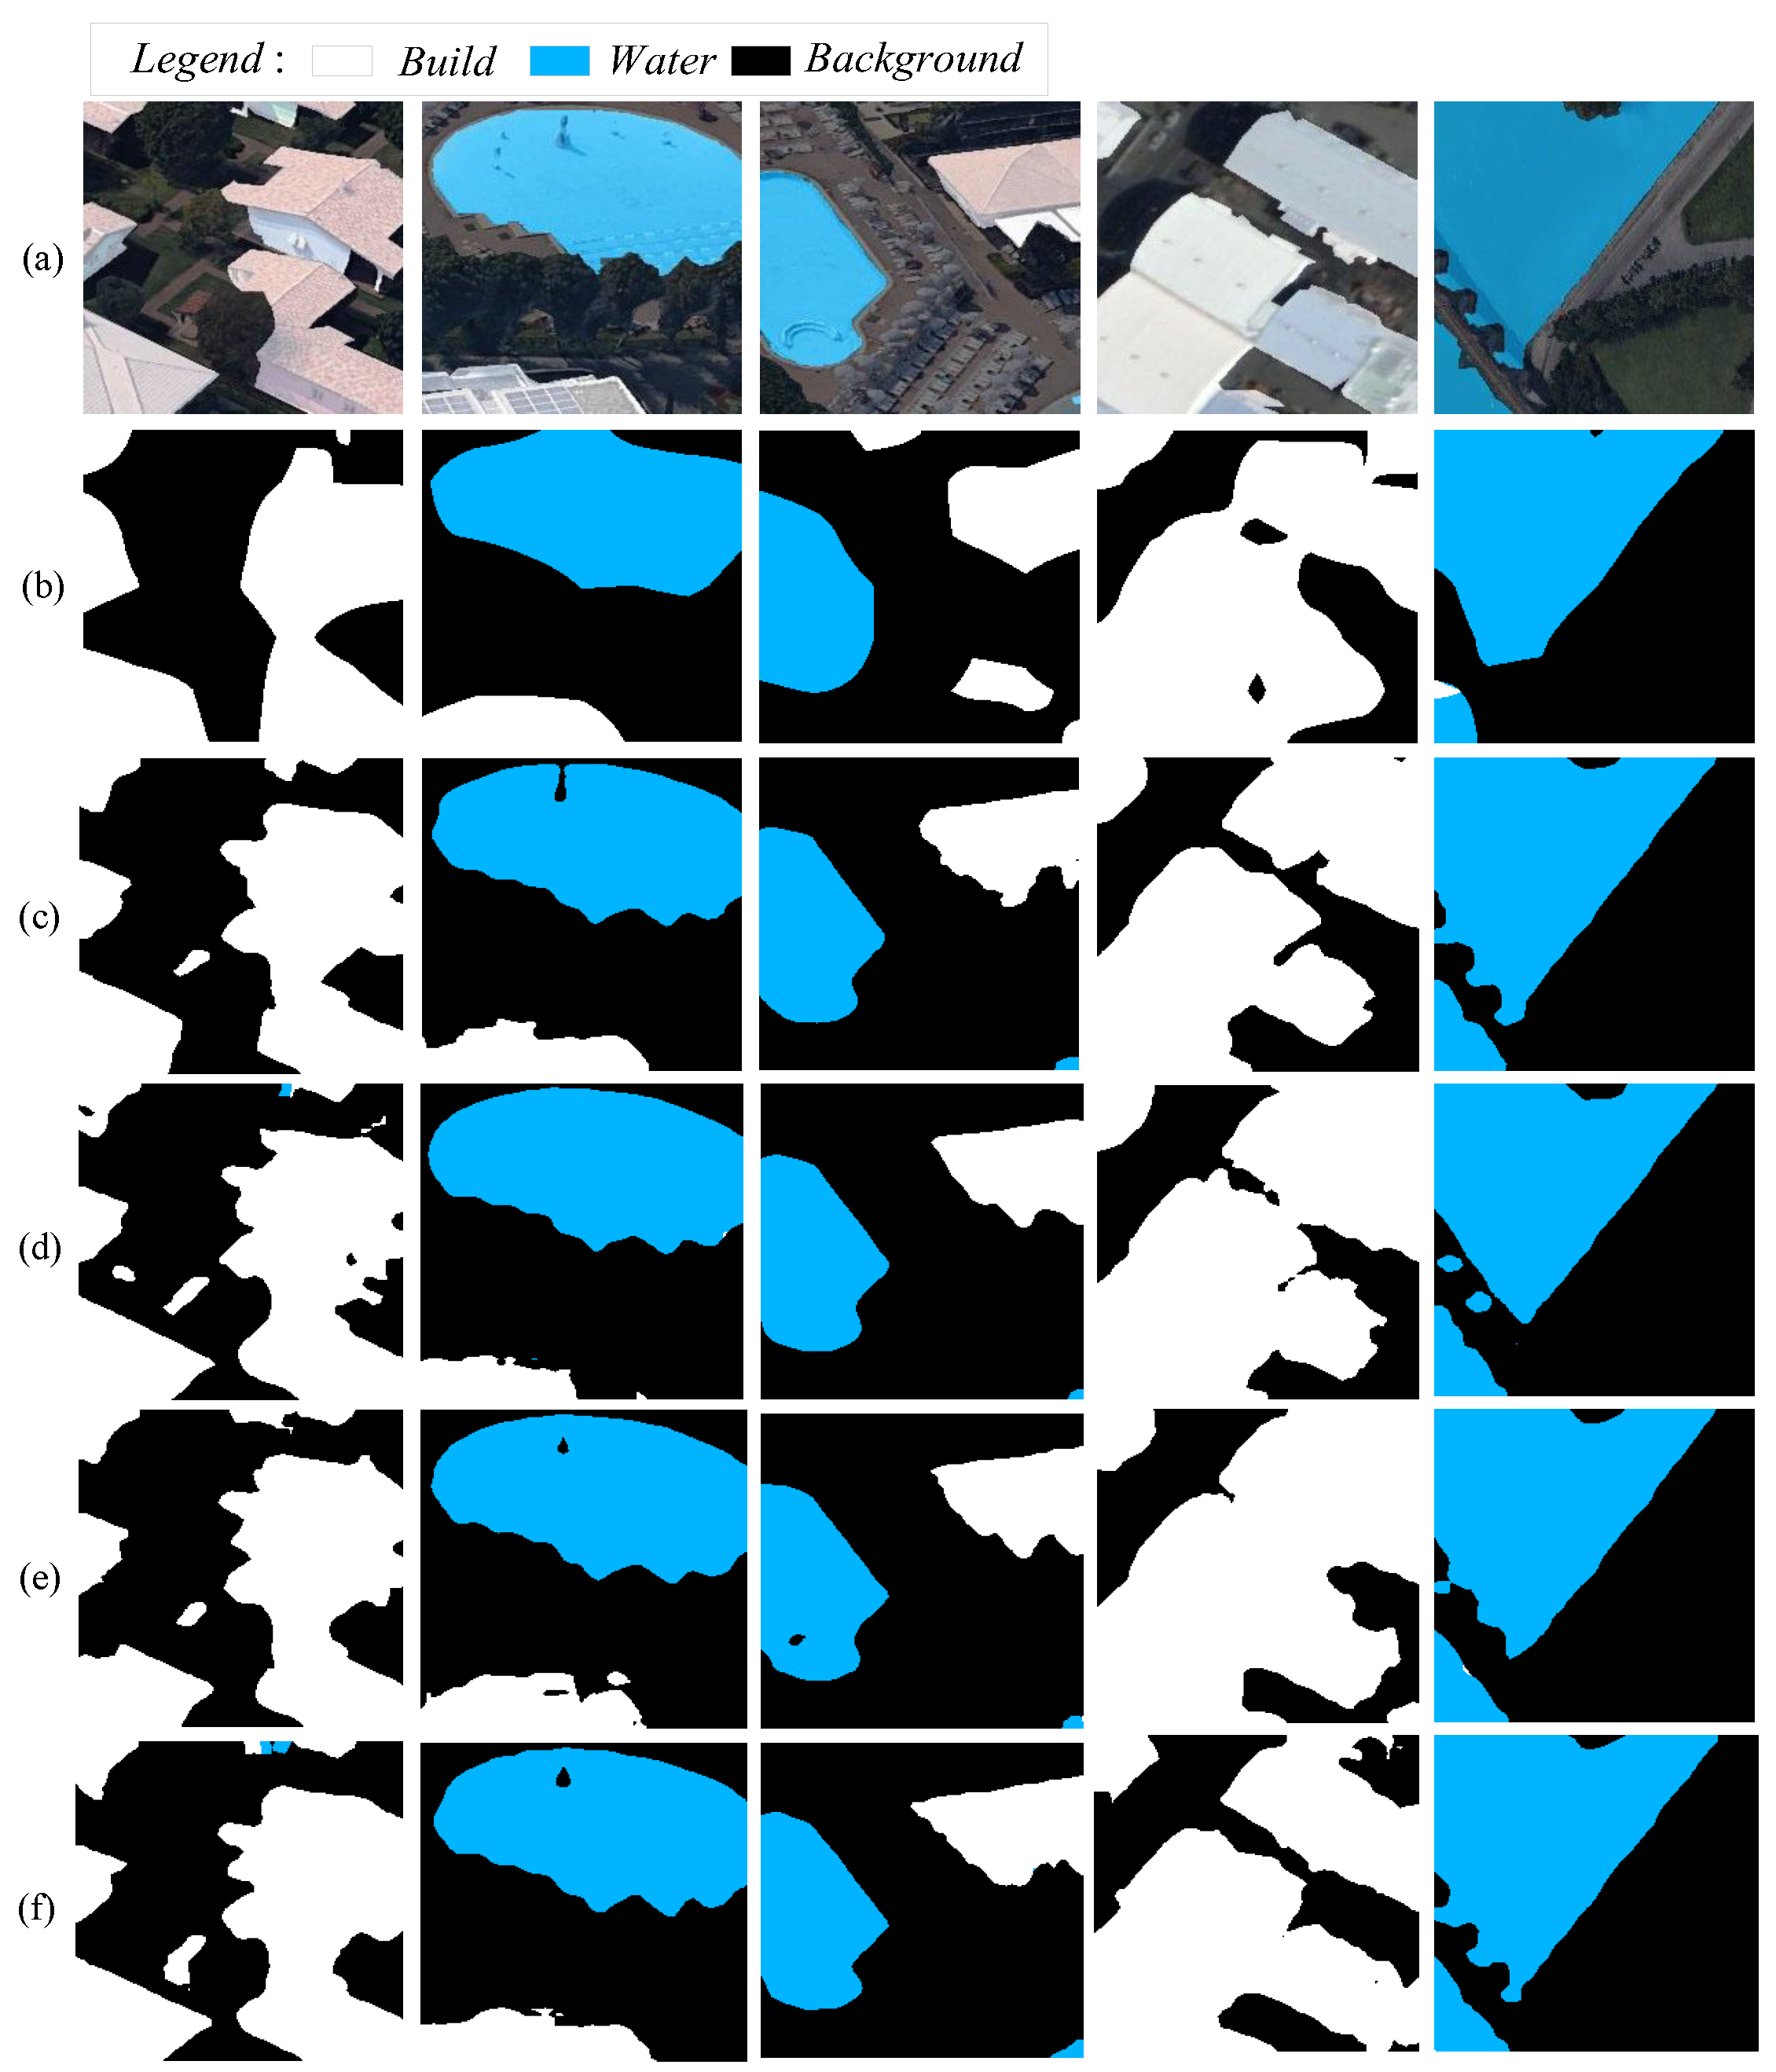
In order to further analyze the impact of different modules, several representative examples of land cover classification results are compared, as shown in Figure 8. The baseline sensor without decoding path only gives the approximate location of the land cover category, and it is difficult to identify small-scale ground objects (Figure 8b). As a decoding module, FAUM module improves the ability of DSFNet to recognize spatial details, but it has poor performance in accurately obtaining building and water area edge information (Figure 8c). SPM module and DA module improve the search ability with low class variance characteristics (Figure 8d,e) to a certain extent, which proves their ability to capture remote spatial dependencies and utilize inter channel dependencies. As shown in Figure 8f, DSFNet with baseline and integration of all modules has significantly improved in identifying the confusion features and spatial details between classes, and the local feature information of buildings and water bodies is clearer. In general, each module used in DSFNet enables the network to capture remote spatial dependencies, read local sensitive information through direction and location, enable the model to more accurately locate and identify the target area, and ultimately improve the classification capability.

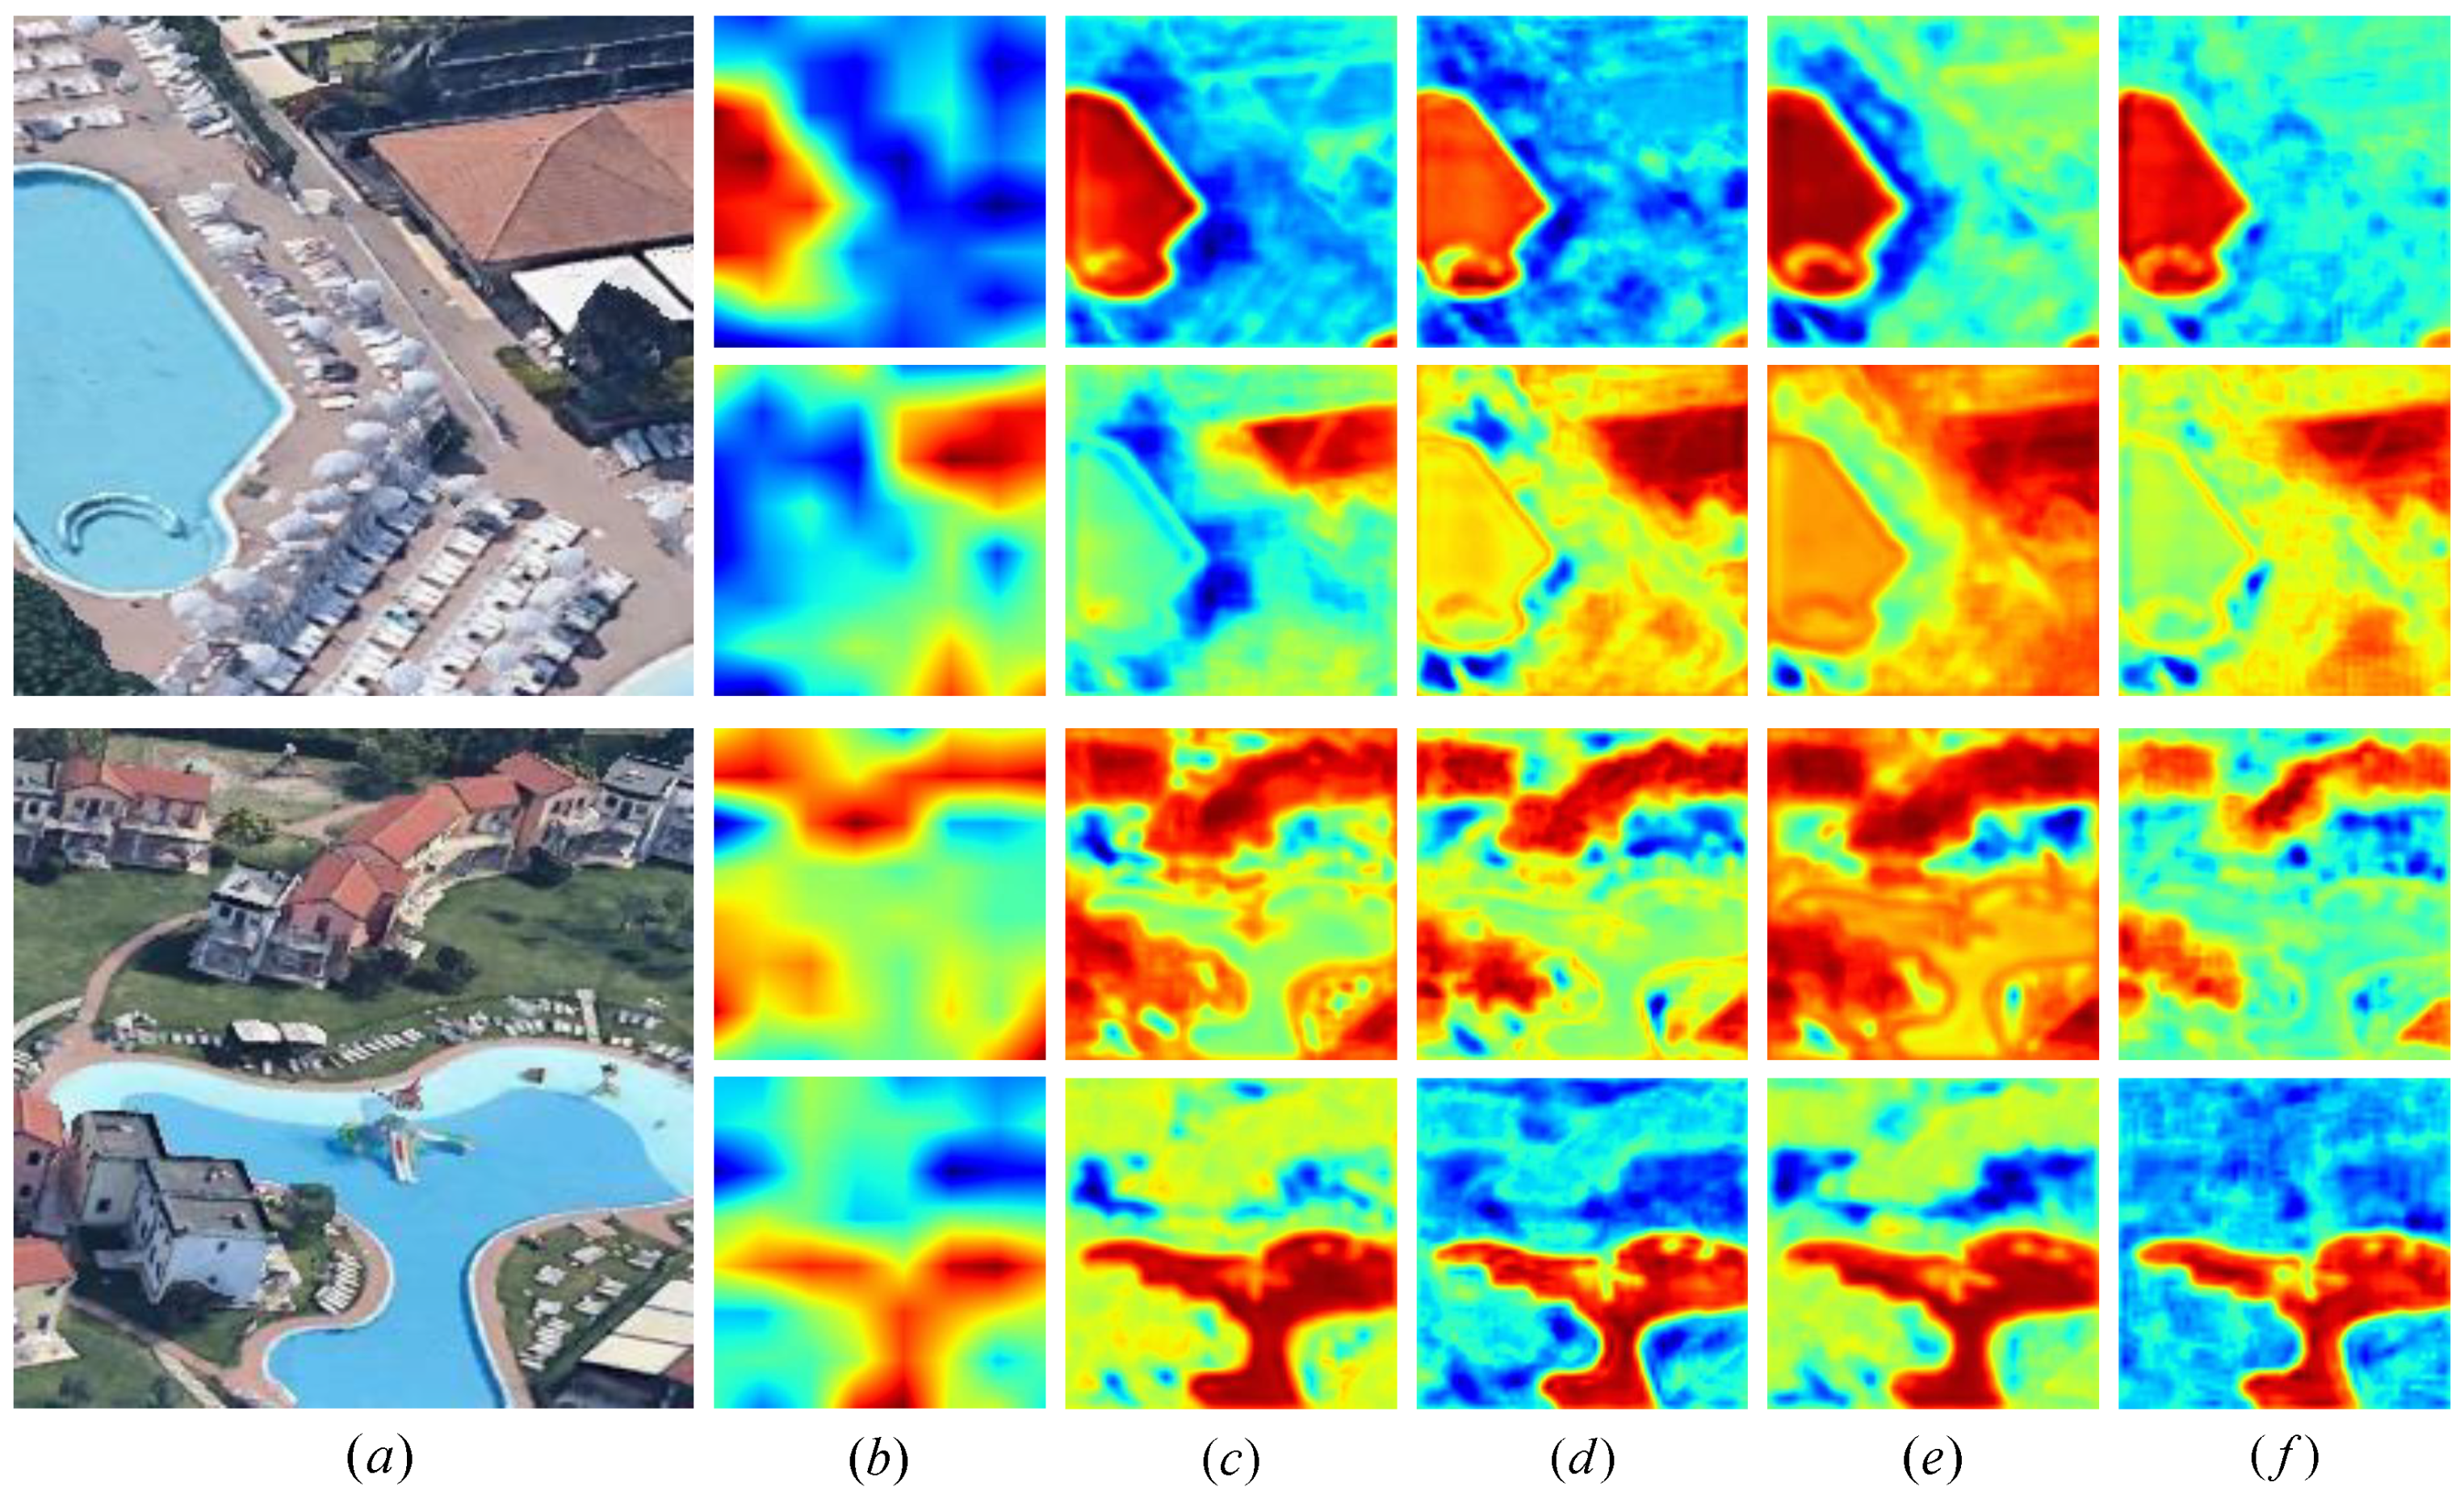
Comparison of the Effects of Thermal Maps of Ablation Experiments

Figure 9 shows the comparison of thermographic effects of different modules added in the ablation experiment. Orange red is the key part of the module, and yellow green and blue are the secondary parts. The first behavior module of each sample focuses on the effect of water, and the second behavior module focuses on the effect of buildings. It can be seen from column (b) that only baseline can not pay enough attention to water and buildings. After the FAUM module is added, the water area and building boundaries become clearer. From column (d), it can be seen that after only the SPM module is integrated, the local information of water area and buildings is supplemented. From column (e), it can be seen that only the color of the focus area of the integrated DAM module is deepened, and the water area and the interior of the building are supplemented. The method proposed in (f) makes the model pay more attention to the target area, especially the local information, so that more accurate target location and boundary segmentation can be obtained.

3.4. Experimental Results and Visual Analysis on the Master Data Set

In order to verify the effectiveness of our model, we conducted experiments on the land cover dataset, and the indicators on the test set exceeded the existing model. The specific experimental results are shown in Table 5, and the visual contrast effect is shown in Figure 10 and Figure 11. The comparison models include BisenetV2, ExtremeC3, FCN8s, PAN, PSPNet, Unet, SegNet, EsNet, EDANet, LinkNet, DeeplabV3plus, OcrNet, and MSResNet. The backbone networks of FCN8s, PAN, DeeplabV3+, PSPNet and MSResNet are VGG16, ResNet-50, ResNet-101, ResNet-50 and ResNet-34 respectively. The backbone networks should be consistent with the original text as much as possible.
It can be seen from Table 5 that the DSFNet, MPA, PA and MIoU proposed in this paper obtain 91.52%, 91.03% and 83.74% respectively. The network proposed in this paper strengthens the importance search between local features, effectively reads local information through direction and location, so that the model can more accurately locate and identify the target area, thus reducing the misjudgment of buildings in remote sensing images and the loss of water area information. All three indicators exceeded the comparison network. The lowest index is the FCN-8s with VGG16 as the backbone network. The PA and MIoU reach 81.71% and 65.35% respectively. Compared with FCN8s, the index of SegNet obtained by modifying VGG-16 based on FCN has a certain improvement, with PA of 87.78% and MIoU of 75.23%. LinkNet uses each encoder and decoder to connect to recover the spatial information lost in the downsampling operation. Compared with SegNet, the segmentation accuracy is improved to a certain extent. The PA and MIoU are 88.30% and 77.80% respectively. PAN uses the attention mechanism and spatial pyramid structure to extract dense features. Compared with LinkNet, PA and MIoU have a certain improvement, 89.12% and 77.86% respectively. The segmentation accuracy of EDANet using asymmetric convolution is the same as that of PAN, which is not improved, but slightly higher than that of PAN in PA. Compared with EDANet, ExtremeC3Net based on improved C3 module has a certain improvement in segmentation accuracy, with a MIoU of 78.75%.
DeepLabV3+uses expansion convolution to obtain larger receptive field, and the segmentation accuracy MIoU is improved by 0.45% compared with ExremeC3Net. BiseNetV2, which uses auxiliary loss to make the network converge better in shallow layers, has a certain improvement in segmentation accuracy compared with DeepLabV3+in PA and MIoU, which are 89.50% and 79.47% respectively. The nearly symmetric decoder encoder architecture is adopted for the EsNet network, and the segmentation accuracy MIoU is improved to a certain extent compared with BiseNetV2, with a MIoU of 79.65%. Compared with EsNet, the segmentation accuracy of UNet on PA and MIoU has improved to a certain extent, which are 89.35% and 79.98% respectively.
OcrNet uses the representation of corresponding object classes to calculate the representation of object regions. Compared with UNet, the segmentation accuracy of PA and MIoU has improved to a certain extent, 90.06% and 80.49% respectively. PSPNet uses depth convolution network to extract advanced feature information, and uses pyramid module for multi-scale fusion. Compared with OcrNet, the MIoU of segmentation accuracy is improved to a certain extent, and the MIoU is 80.85%. The MIoU index of FENet on the test set exceeds the 12 models compared, and the MIoU index is 2% higher than the highest PSPNet.
In order to facilitate the visual comparison of model prediction results, we visualized the prediction results of different models and obtained Figure 10 and Figure 11. 
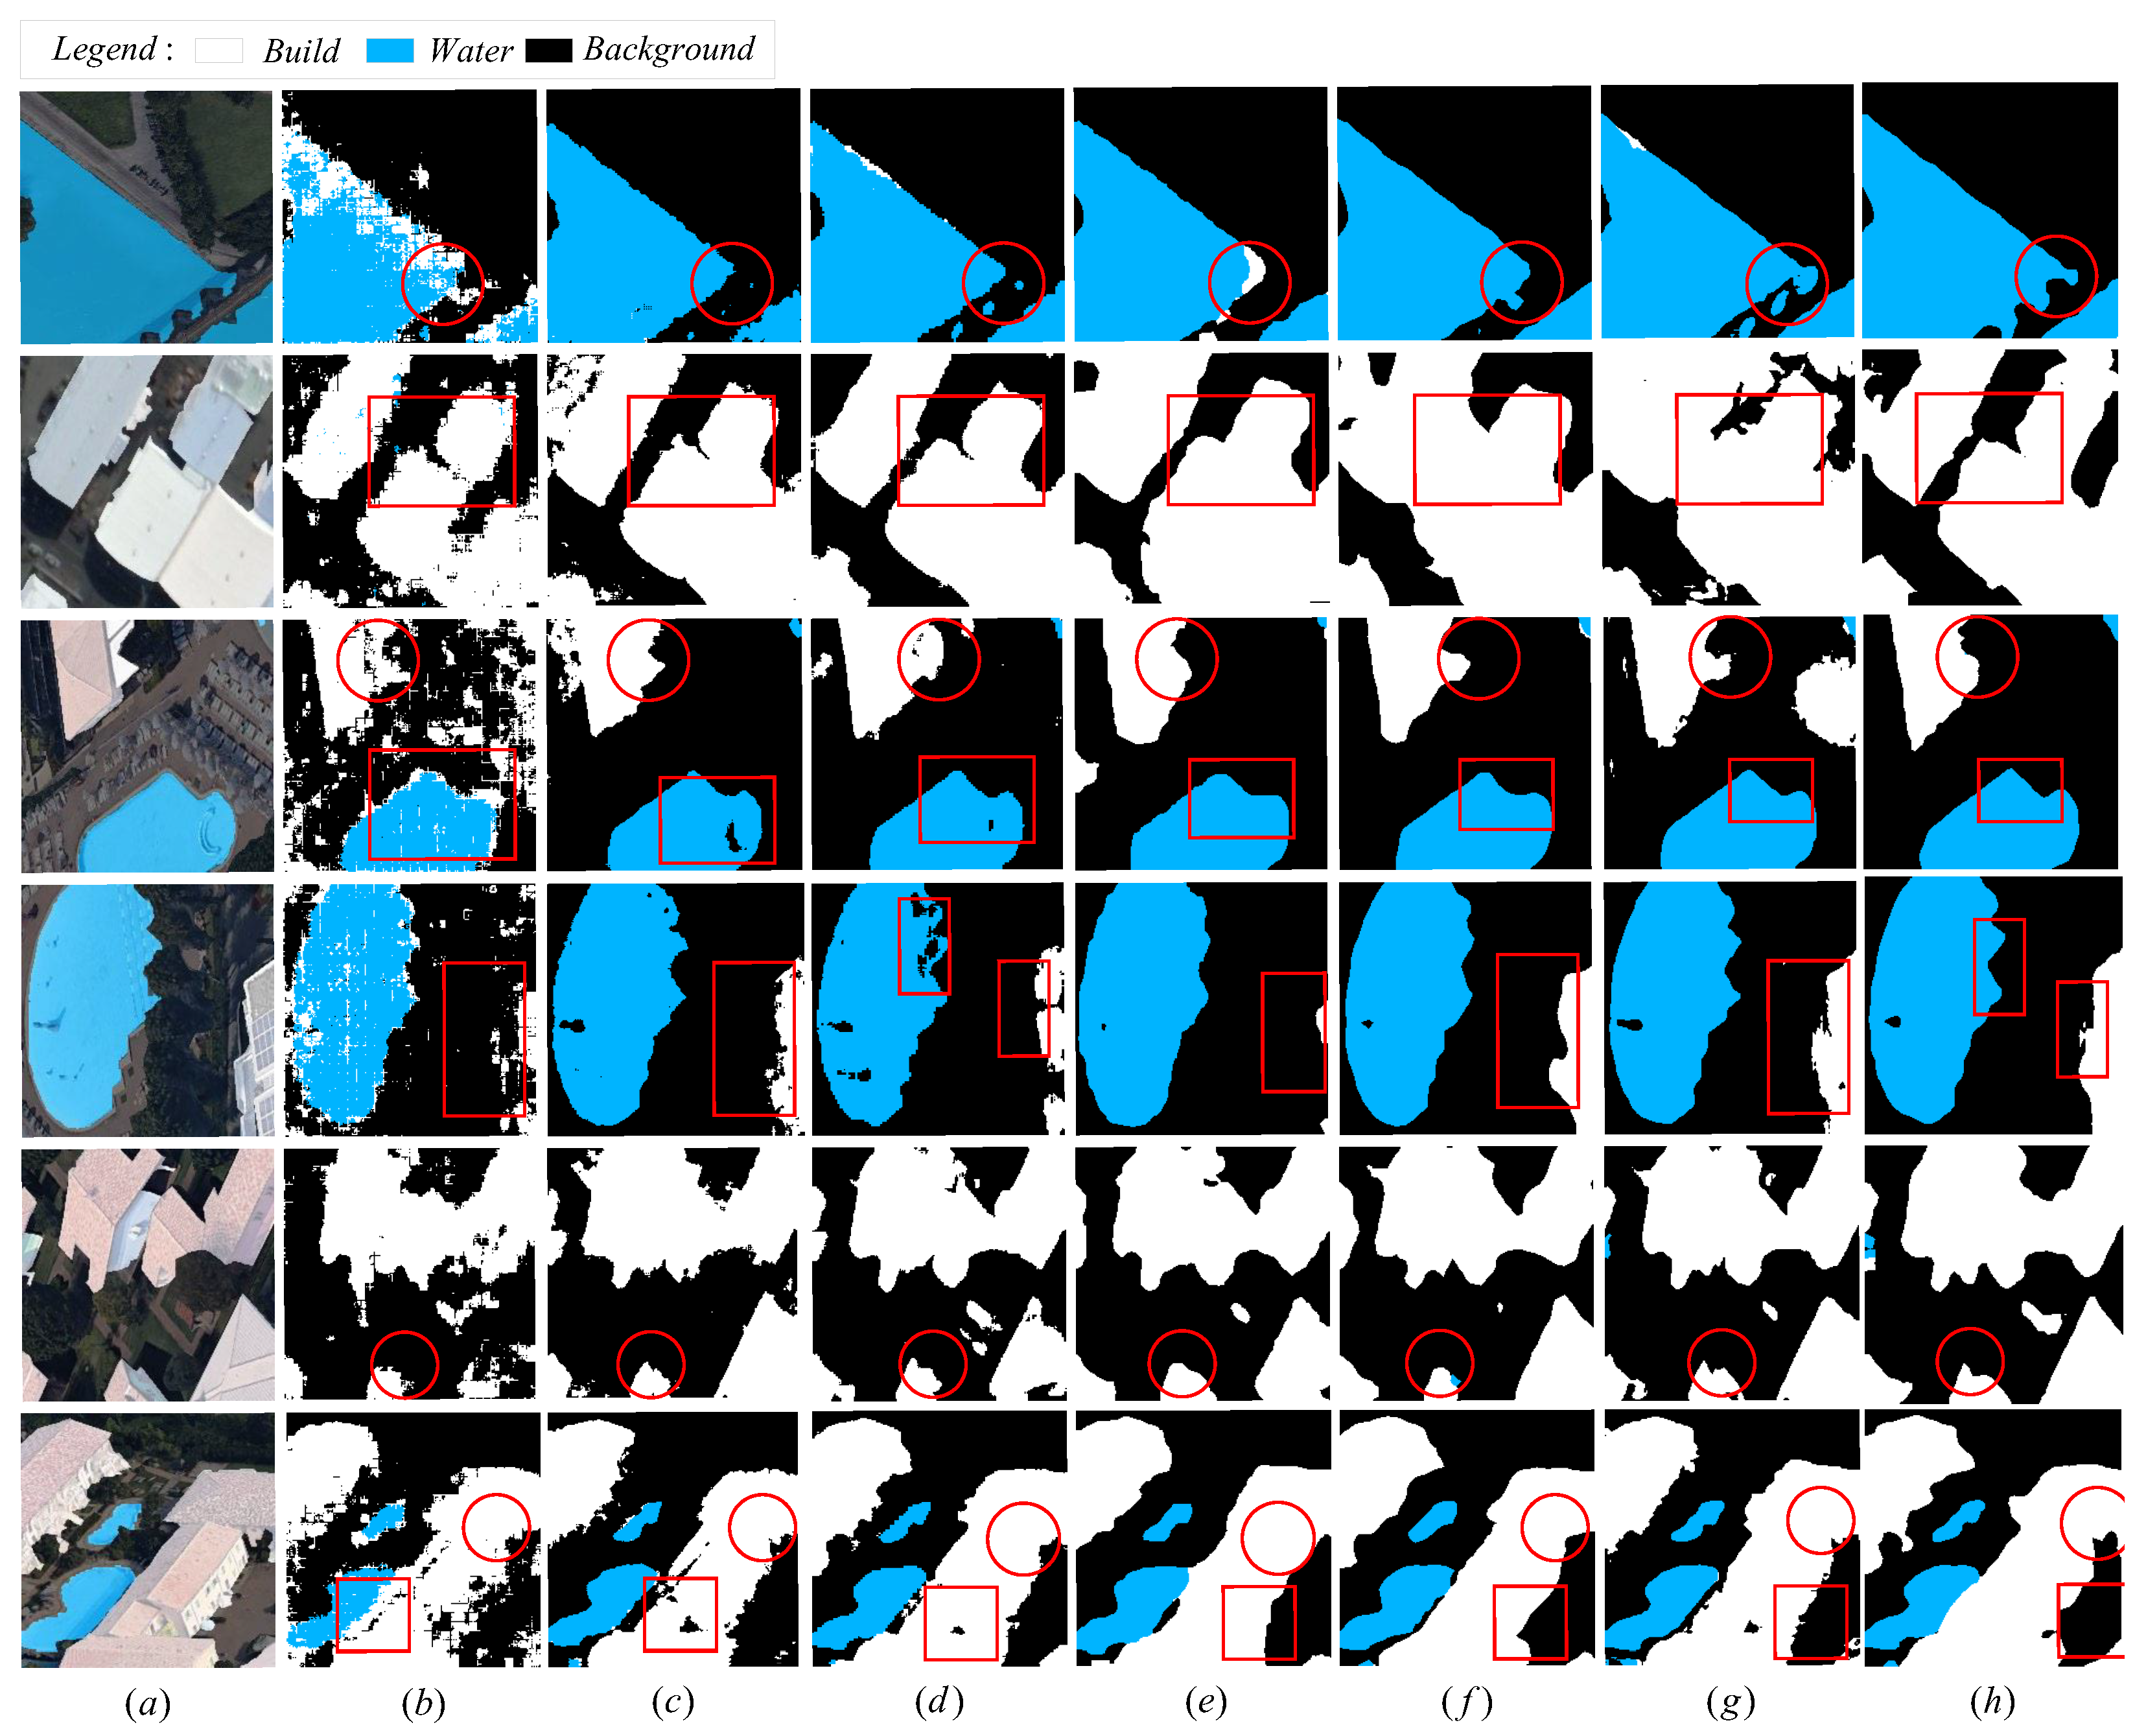
Figure 10 shows a total of six prediction graphs, and each column in Figure 10 represents the prediction graph of a model. Figure 10 has 8 columns in total. Column a is the superposition of images and labels, and column b, c, d, e, f, g, h correspond to FCN8s, SegNet, LinkNet, PAN, EDANet, ExtremeC3, DSFNet (Ours) respectively. From the column of b, we can see that the neural network proposed in this paper has good performance in piecewise noise control. The segmentation realizes the accurate extraction of houses and waters, and greatly reduces the misclassification of houses and waters. This achievement is attributed to DSFNet (ours), which makes up for the sensitive information of local locations that is easily ignored by existing networks, and reads local sensitive information fully through directions and locations, thus avoiding the establishment of most unnecessary connections between locations that are far away from each other, so as to improve the ability to capture remote spatial dependencies and make use of inter channel dependencies, and help to achieve accurate classification. It is not difficult to see that there will be obvious misjudgments from columns b, c, d, and e, The local feature search network (DSFNet) proposed by us can overcome these difficulties and accurately classify the background and water. e. Although the columns f and g basically realize the classification of background, water area and buildings, their edges are blurry and water is wrongly identified as a building. From the circles and boxes marked in the figure, we can see that DSFNet has better ability to express local details, thanks to the network’s ability to search for local features, thus giving mask images more details.
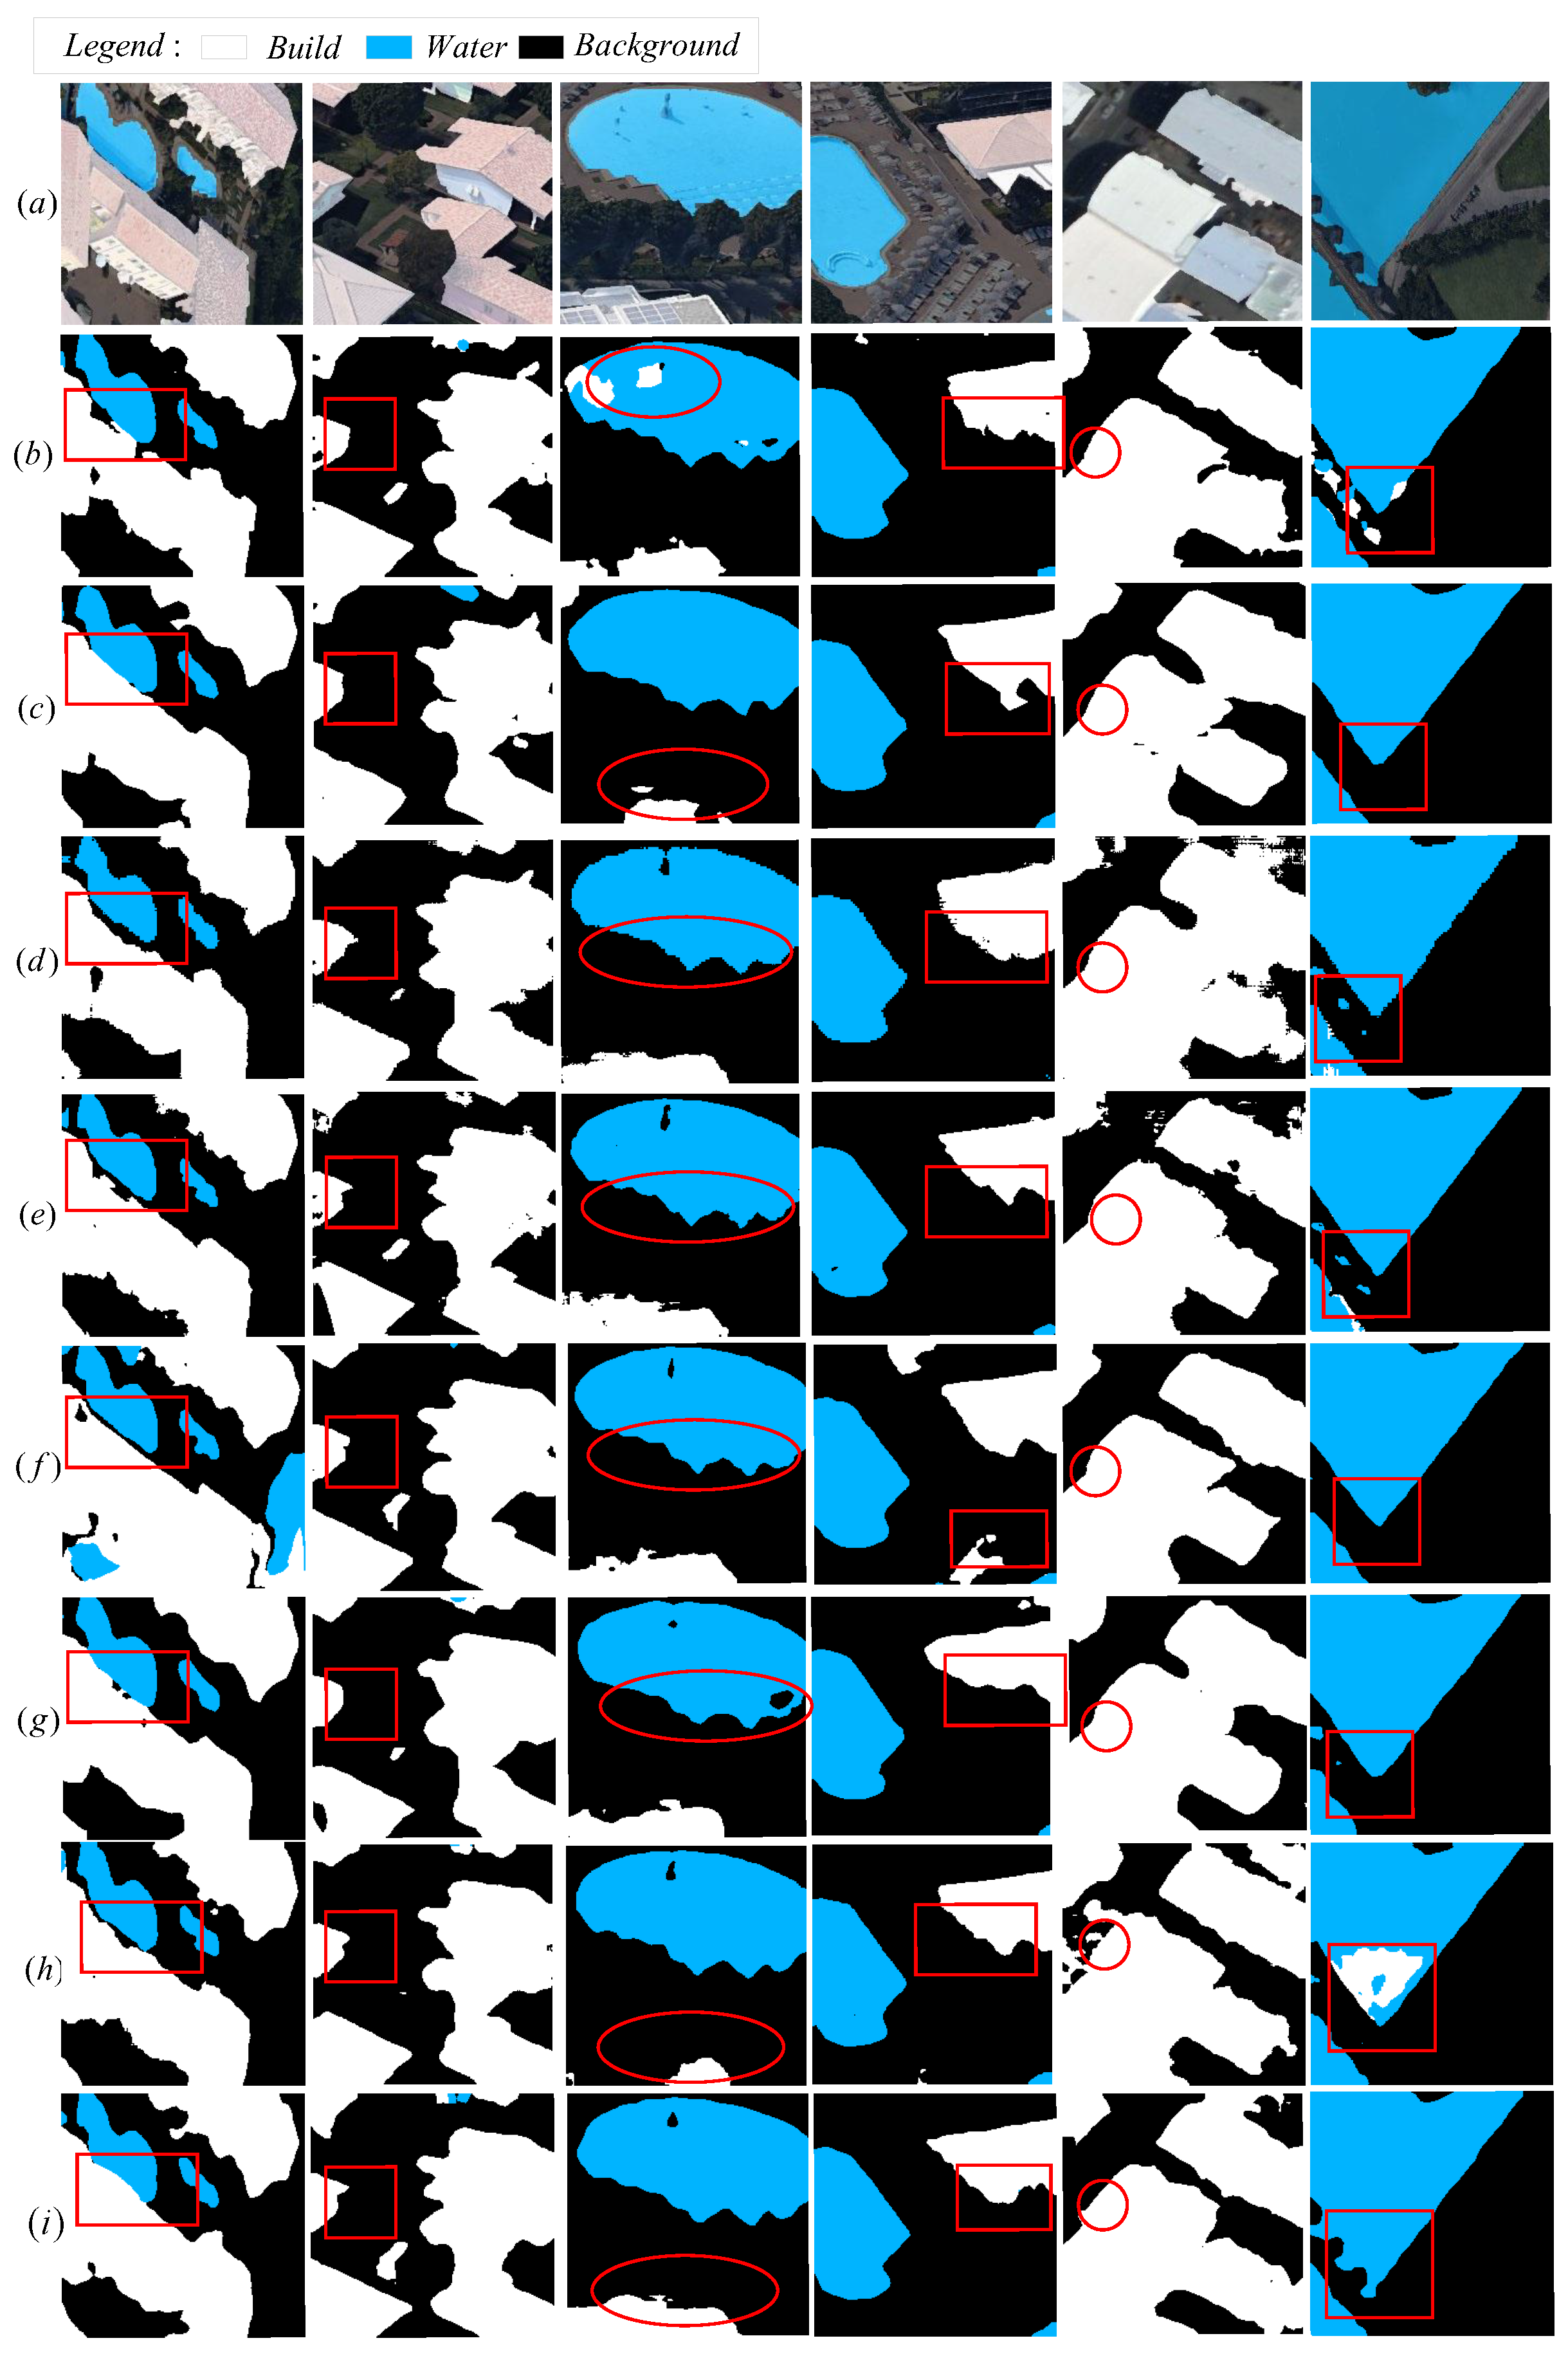
Figure 11 shows a total of six prediction graphs. Each row in Figure 11 represents the prediction graph of a model. Figure 11 has 8 rows in total. Column a is the superposition of images and labels, and columns b, c, d, e, f, g, h, and i correspond to DeepLapV3+, BiseNetV2, EsNet, UNet, OcrNet, PSPNet, MSResNet, and DSFNet (Ours) respectively. Because the models compared in Figure 11 want to improve the accuracy of the models compared in Figure 10, the classification effect is a little better than that of the models compared in Figure 10. However, lines b, d, and e still clearly misjudge the water area as a building, lines b and c even judge the building as a water area, and line g misjudges the water area as a background. Our local feature search network (DSFNet) model alleviates these problems, The basic contours of buildings and water areas are basically extracted, which effectively solves the problems of misjudgment of buildings and disconnection of water areas, and endows the image with more detailed local features. This is the result of the fusion of the direction and location feature information extracted by SPM and DAM modules with the backbone network feature. The fused feature map contains not only rich location information of the backbone network, but also more local features of horizontal direction and location, The problem of unclear water area and buildings is effectively improved. The DSFNet network proposed by us fully captures the horizontal direction and local location information, provides rich semantic information feature maps, and realizes the effective extraction of building and water area contours.

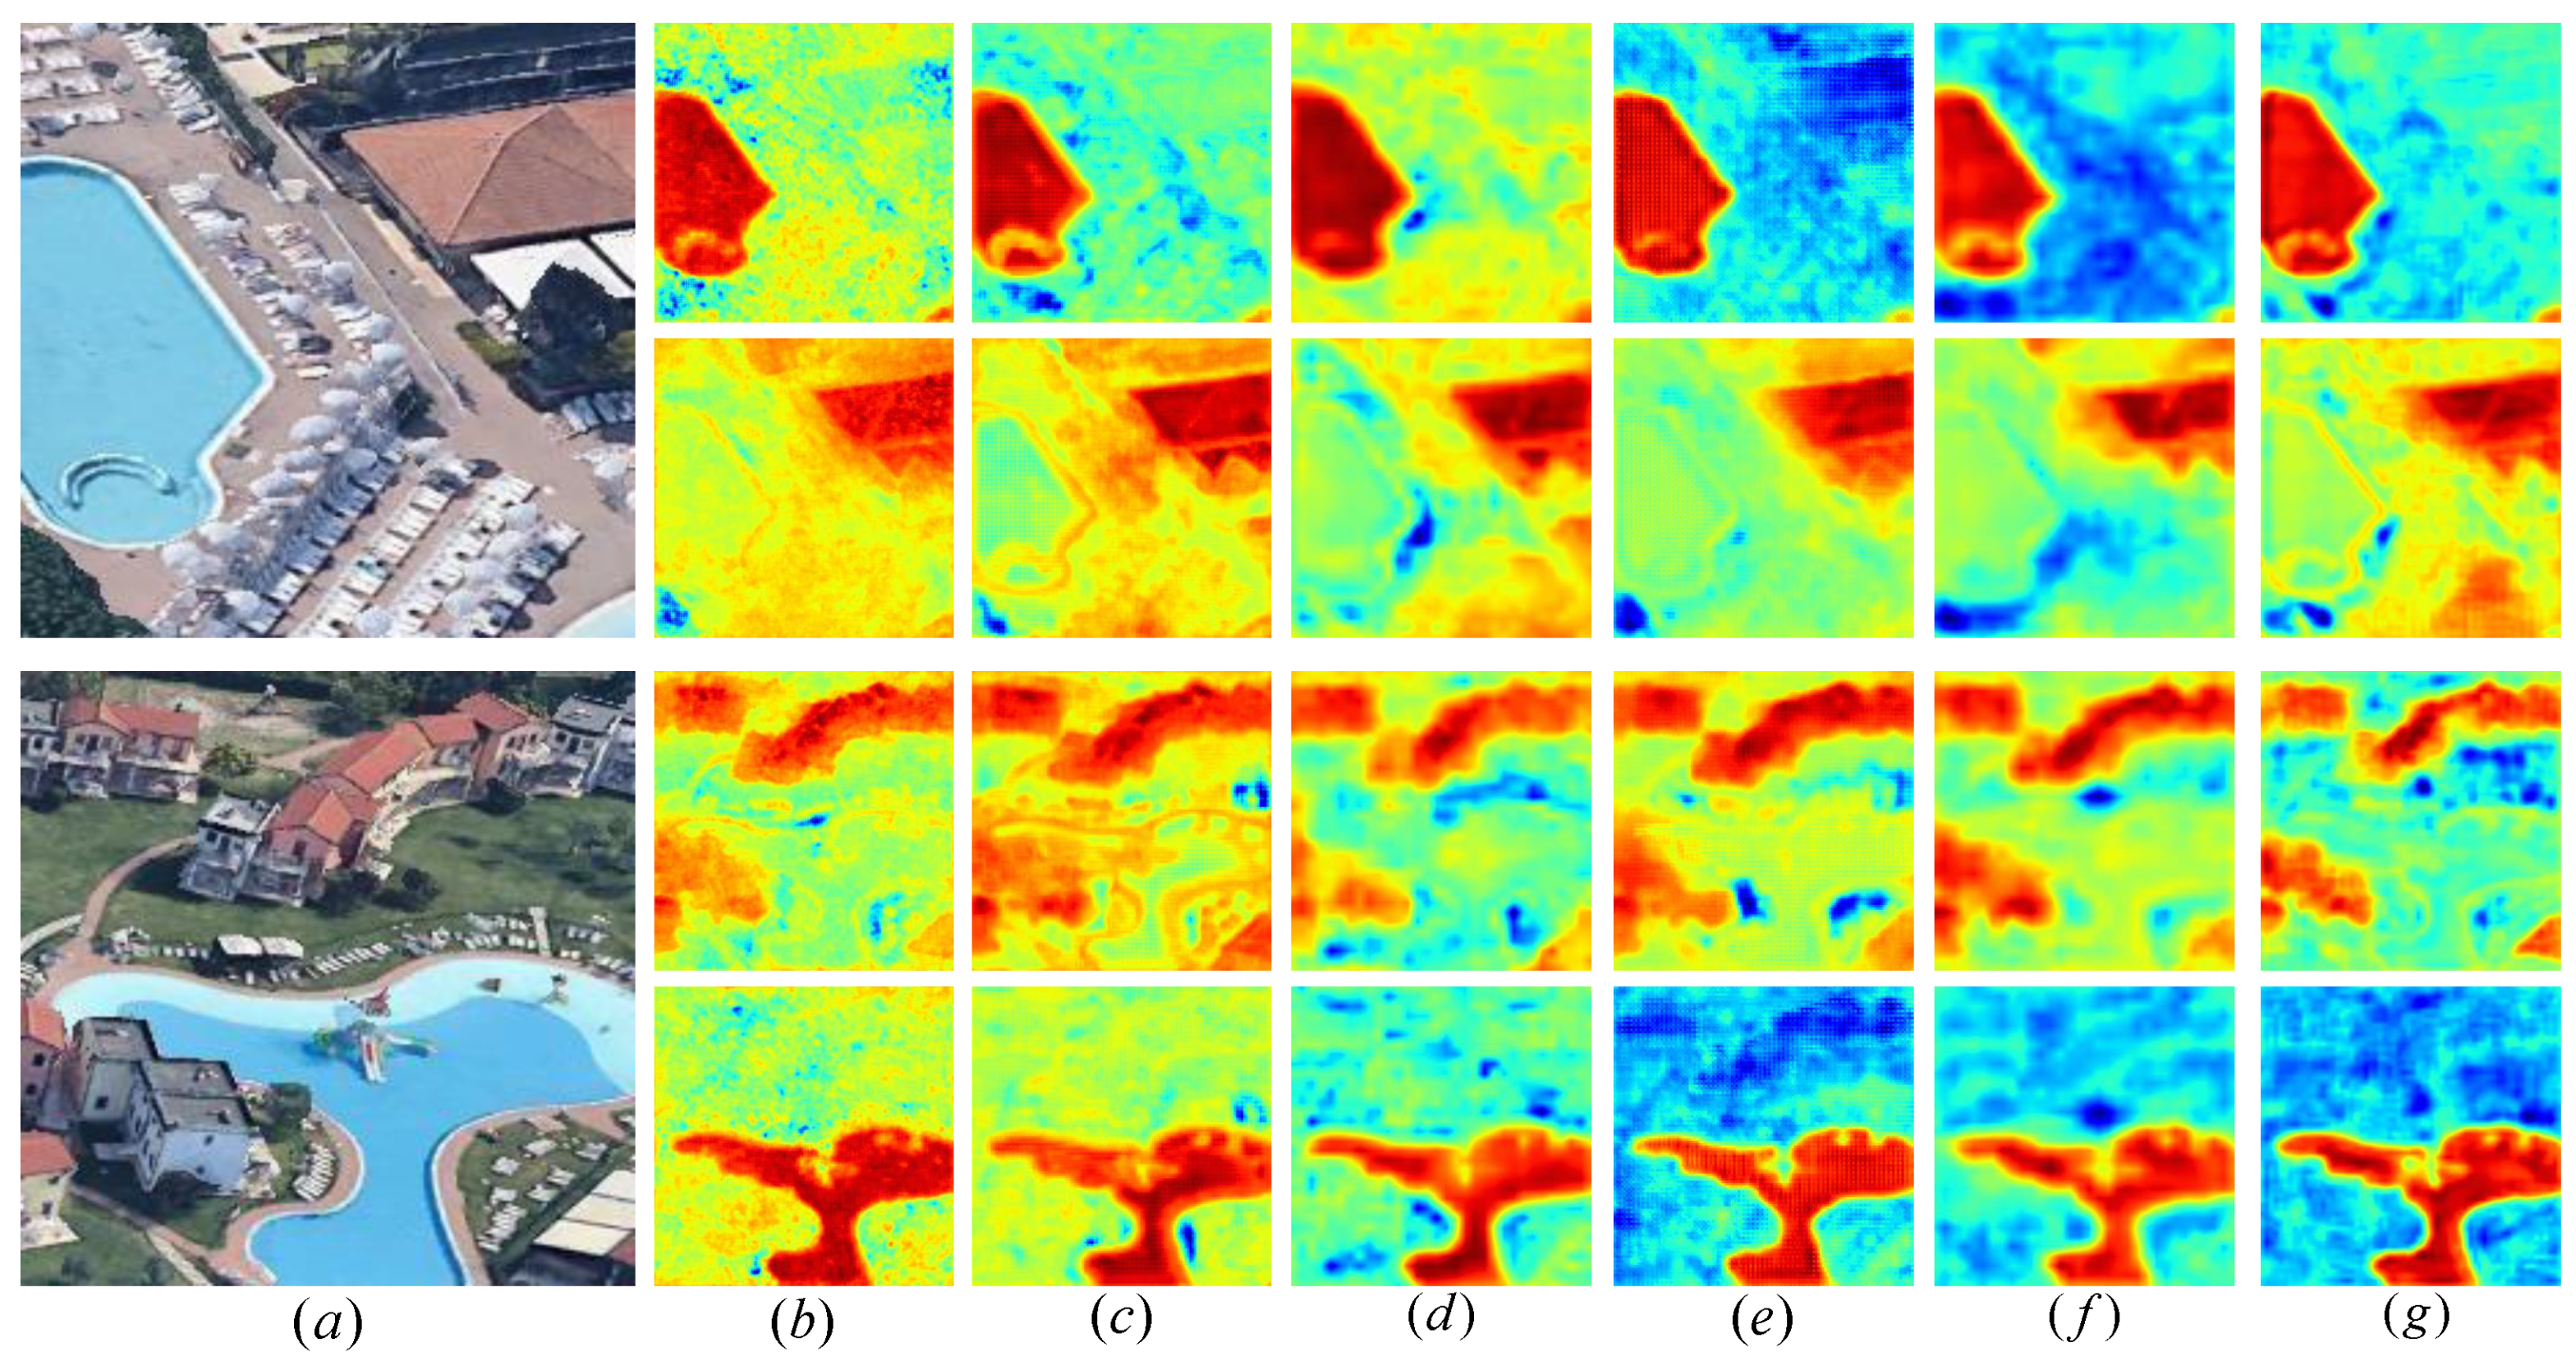
Comparison of Thermodynamic Diagram Effects of Different Models

Figure 12 shows the comparison of the effects of thermal maps of different models. The first line of each sample focuses on the water area, and the second line focuses on the buildings. The orange red area is the focus of the model, and the yellow green and blue are the secondary parts. According to the results of the thermal map, SegNet did not pay enough attention to the water area and the internal information of the building, which also led to the poor display effect. LinkNet, EDANet, EsNet and PSPNet pay more attention to the target area, but pay less attention to the boundary and local information. Our proposed local feature search network (DSFNet) can significantly enhance the focus on local and boundary information, so it can obtain more accurate target location and clearer boundary segmentation.

3.5. Massachusetts Building Data Set Generalization Experiment Results and Visual Analysis

Since it is difficult for a single data set to reflect the generalization performance of the model, we use the Massachusetts building data set to test the generalization performance of the model. The experimental results on the dataset are shown in Table 6. It can be seen from Table 6 that the segmentation accuracy PA and MIoU of the neural network DSFNet proposed by us reach 93.46% and 84.69% respectively. The above indicators exceed the comparative models, proving the effectiveness and good generalization ability of the model proposed in this paper.
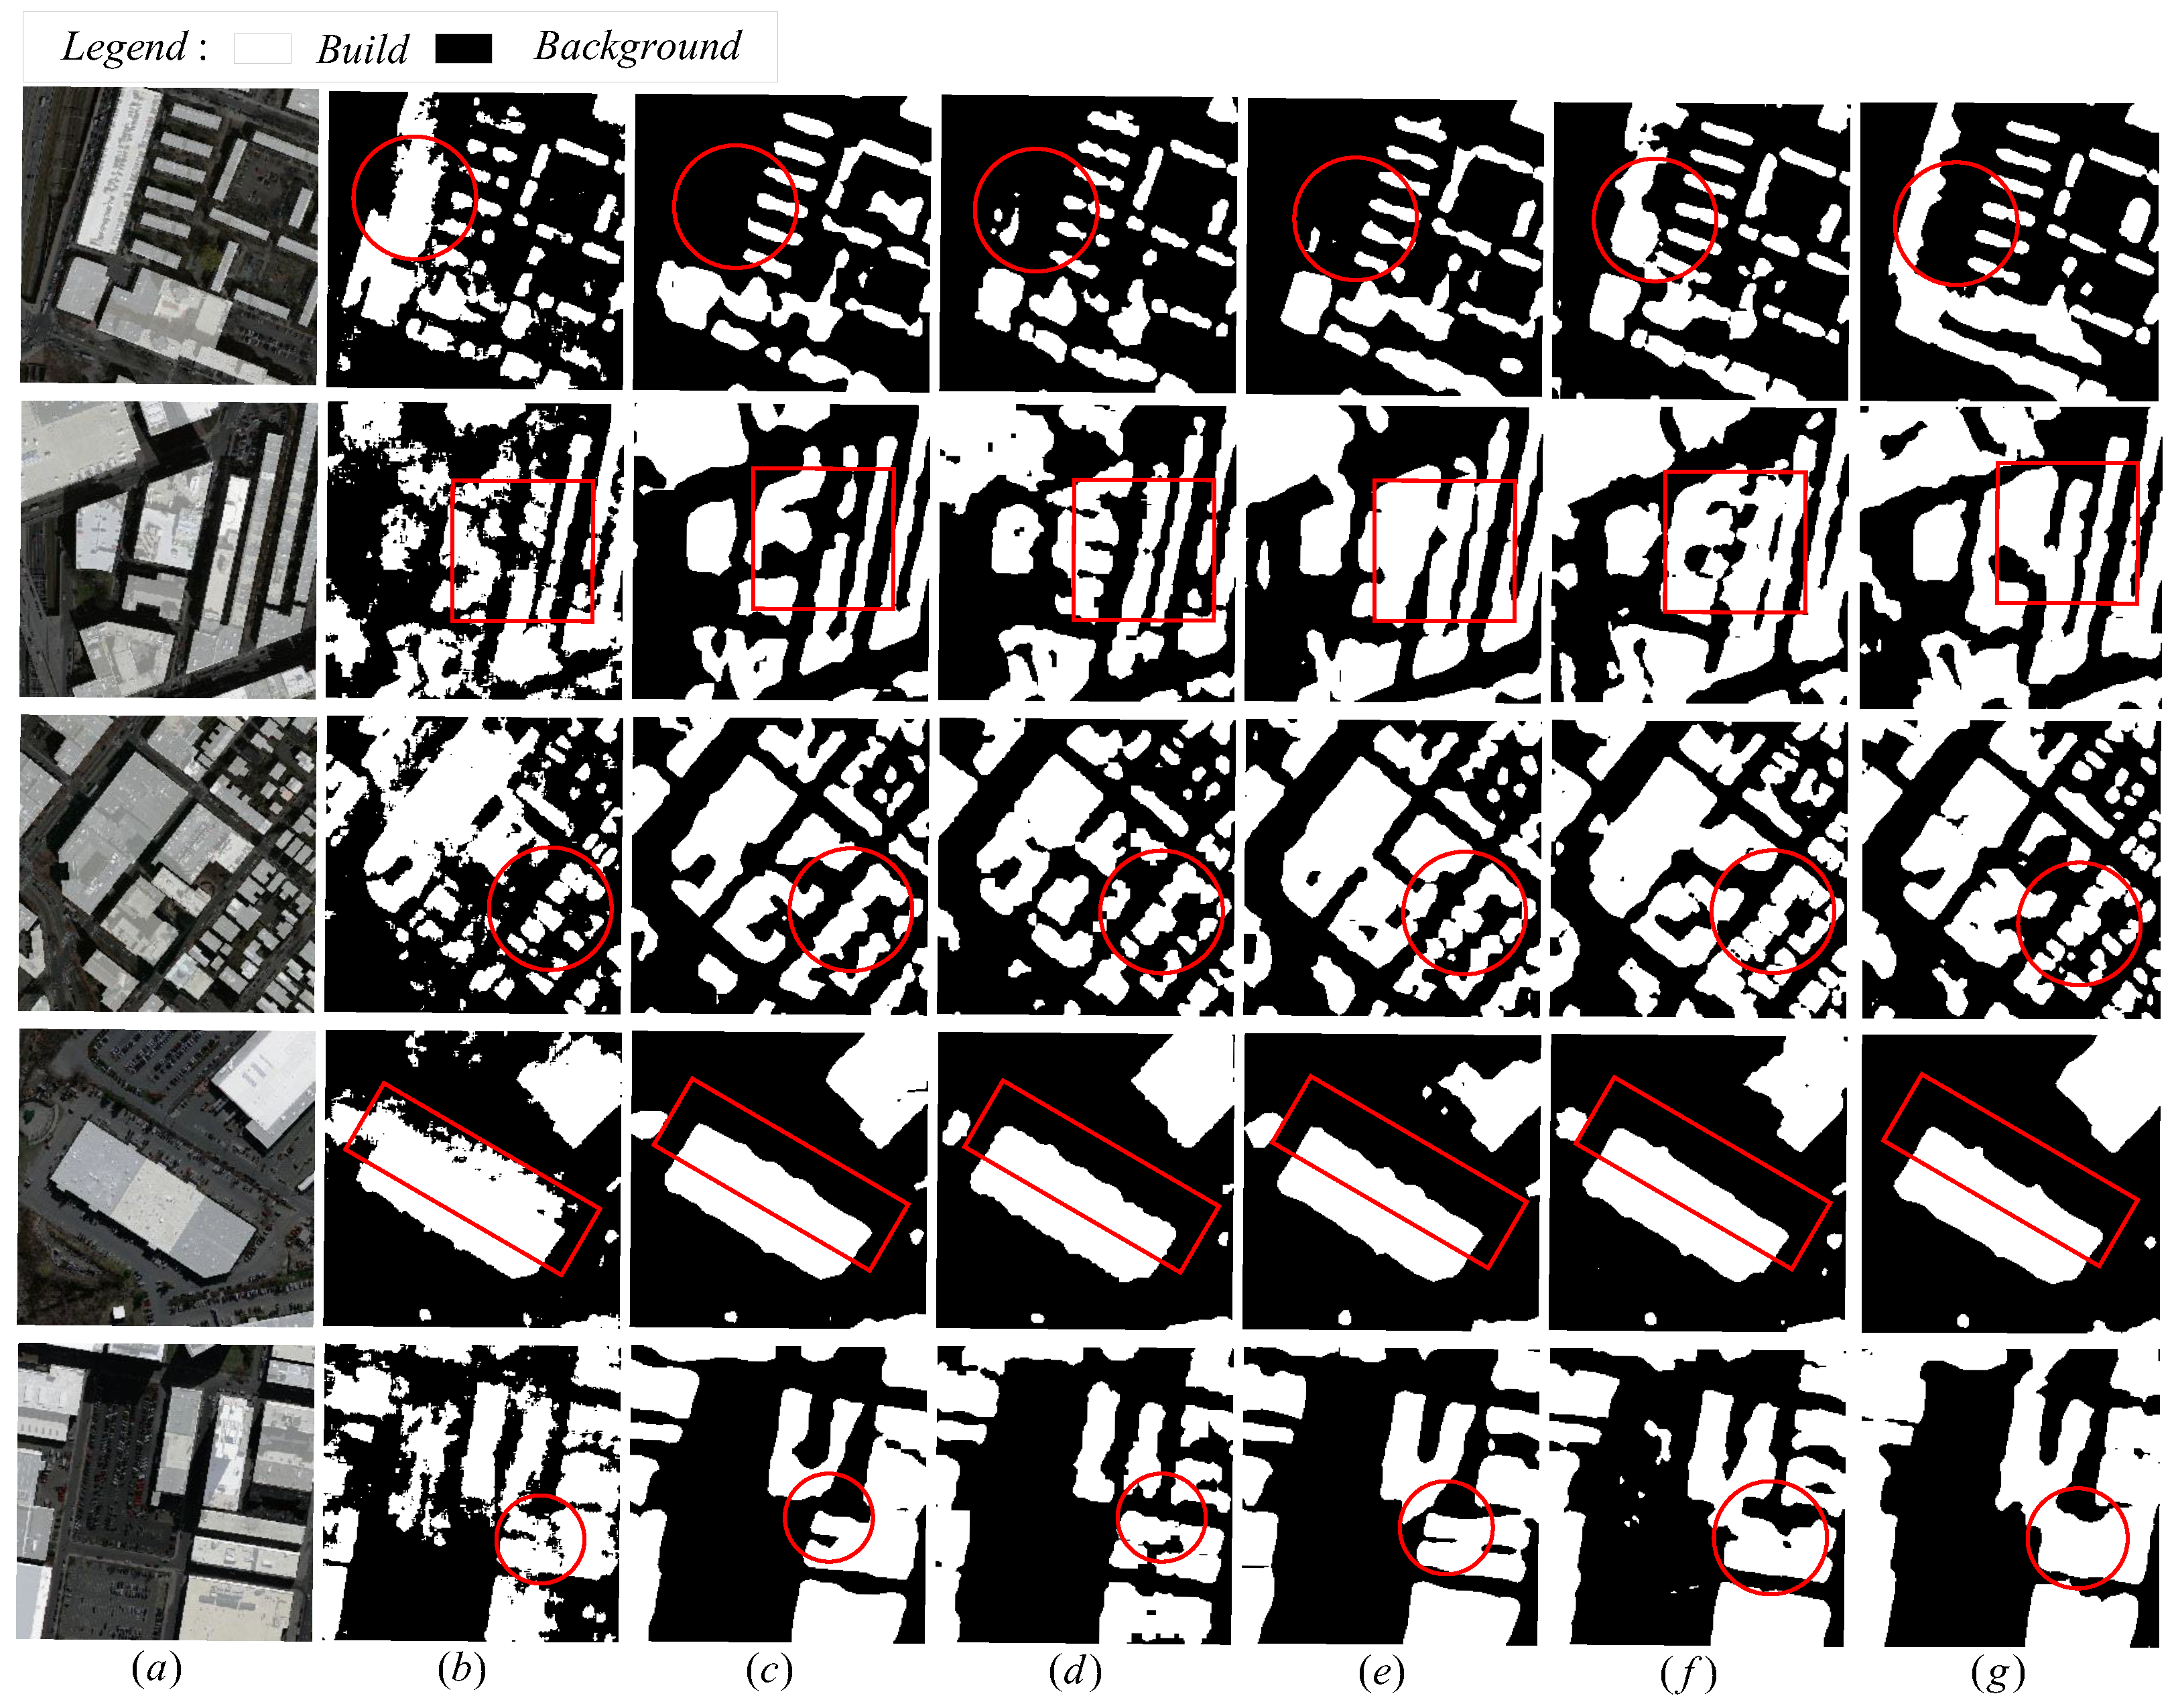
In order to intuitively compare the segmentation effect of the model, we show the effect picture in Figure 13. Through comparison, we can find that our proposed local feature search network (DSFNet) fully captures the horizontal direction and local location information, and greatly reduces the misclassification of buildings. Column g in Figure 13 is the effect picture of the building we predicted. It can be seen from the red circles and boxes in the picture that compared with other comparison models, the local features of the building we proposed are clearer, and there is no large area of misjudgment and noise. This is due to the excellent search ability of the model for local features. This is the result of the integration of the DAM module and SPM module with the backbone network feature map through the FAUM module. The fused feature map contains not only the rich location information of the backbone network, but also the horizontal direction and location information of the hidden feature map, which realizes the effective extraction of building contour and local features, and fully proves the effectiveness and good generalization ability of the model proposed by us.

4. Conclusions

This paper presents an application of local feature search network in the segmentation of buildings and water bodies in remote sensing images.The experimental results of our method on building and water data sets show that compared with the existing classical semantic segmentation model, the proposed method achieves 2.89% improvement on the indicator MIoU, and the final MIoU reaches 83.73%.Our network has the following advantages: (1) A discarding attention module (DAM) is proposed, which reads sensitive information through direction and location, discards irrelevant information, and enables the model to locate and identify the target area more accurately. It can not only capture cross channel information, but also integrate spatial coordinate information efficiently by embedding location information into channel attention, so that mobile networks can obtain larger regional information without introducing large overhead. So as to improve the misjudgment of large area buildings and local information loss in the process of water area segmentation. (2) The horizontal direction and position sensitive information extracted by the discarded attention module (DAM) and the slice pooling module (SPM) are effectively fused using the fused attention upsampling module (FAUM). This enables backbone networks to avoid establishing most unnecessary connections between locations that are far away from each other, so as to improve the ability to capture remote spatial dependencies and utilize inter channel dependencies, enhance the search ability of local information in the network, and ultimately improve the segmentation accuracy. (3) Several ablation experiments under different combination settings were conducted on the land cover dataset. The experimental results show that the introduced module can effectively improve the classification performance, and the optimization strategy can improve the stability and accuracy of the training process. To sum up, the network proposed by us has achieved good performance in land cover classification. In the future, we will ensure the effectiveness of network classification and effectively reduce the complexity of the network, so as to achieve fast and accurate land cover classification.

Author Contributions

Conceptualization, Z.M., M.X. and L.W.; methodology, Z.M. and M.X.; software, Z.M.; validation, Z.M., M.X. and H.L.; formal analysis, Z.M., M.X. and L.W.; investigation, Z.M. and M.X.; resources, M.X. and L.W.; data curation, L.W.; writing—original draft preparation, Z.M.; writing—review and editing, L.W. and H.L.; visualization, Z.M.; supervision, M.X.; project administration, L.W. and M.X.; funding acquisition, M.X. All authors have read and agreed to the published version of the manuscript.

Funding

This research was funded by the National Natural Science Foundation of China of grant number 42075130.

Institutional Review Board Statement

Not applicable.

Informed Consent Statement

Not applicable.

Data Availability Statement

The data and the code of this study are available from the corresponding author upon request. (xiamin@nuist.edu.cn).

Acknowledgments

The authors would like to thank the Assistant Editor of this article and anonymous reviewers for their valuable suggestions and comments.

Conflicts of Interest

No potential conflict of interest was reported by the author.

References

  1. Xia, M.; Qu, Y.; Lin, H. PANDA: Parallel asymmetric network with double attention for cloud and its shadow detection. J. Appl. Remote Sens. 2021, 15, 046512. [Google Scholar] [CrossRef]
  2. Miao, S.; Xia, M.; Qian, M.; Zhang, Y.; Liu, J.; Lin, H. Cloud/shadow segmentation based on multi-level feature enhanced network for remote sensing imagery. Int. J. Remote Sens. 2022, 43, 5940–5960. [Google Scholar] [CrossRef]
  3. Wang, Z.; Xia, M.; Lu, M.; Pan, L.; Liu, J. Parameter Identification in Power Transmission Systems Based on Graph Convolution Network. IEEE Trans. Power Deliv. 2022, 37, 3155–3163. [Google Scholar] [CrossRef]
  4. Xia, M.; Wang, Z.; Lu, M.; Pan, L. MFAGCN: A new framework for identifying power grid branch parameters. Electr. Power Syst. Res. 2022, 207, 107855. [Google Scholar] [CrossRef]
  5. Gao, J.; Weng, L.; Xia, M.; Lin, H. MLNet: Multichannel feature fusion lozenge network for land segmentation. J. Appl. Remote Sens. 2022, 16, 016513. [Google Scholar] [CrossRef]
  6. Liu, Y.; Gross, L.; Li, Z.; Li, X.; Fan, X.; Qi, W. Automatic building extraction on high-resolution remote sensing imagery using deep convolutional encoder-decoder with spatial pyramid pooling. IEEE Access 2019, 7, 128774–128786. [Google Scholar] [CrossRef]
  7. Liu, Y.; Zhou, J.; Qi, W.; Li, X.; Gross, L.; Shao, Q.; Zhao, Z.; Ni, L.; Fan, X.; Li, Z. ARC-Net: An efficient network for building extraction from high-resolution aerial images. IEEE Access 2020, 8, 154997–155010. [Google Scholar] [CrossRef]
  8. Pang, K.; Weng, L.; Zhang, Y.; Liu, J.; Lin, H.; Xia, M. SGBNet: An Ultra Light-weight Network for Real-time Semantic Segmentation of Land Cover. Int. J. Remote Sens. 2022, 43, 5917–5939. [Google Scholar] [CrossRef]
  9. Hu, K.; Jin, J.; Zheng, F.; Weng, L.; Ding, Y. Overview of behavior recognition based on deep learning. Artif. Intell. Rev. 2022, 1–33. [Google Scholar] [CrossRef]
  10. Hu, K.; Ding, Y.; Jin, J.; Weng, L.; Xia, M. Skeleton Motion Recognition Based on Multi-Scale Deep Spatio-Temporal Features. Appl. Sci. 2022, 12, 1028. [Google Scholar] [CrossRef]
  11. Li, H.; Li, Y.; Zhang, G.; Liu, R.; Huang, H.; Zhu, Q.; Tao, C. Global and local contrastive self-supervised learning for semantic segmentation of HR remote sensing images. IEEE Trans. Geosci. Remote Sens. 2022, 60, 5618014. [Google Scholar] [CrossRef]
  12. Lu, C.; Xia, M.; Qian, M.; Chen, B. Dual-Branch Network for Cloud and Cloud Shadow Segmentation. IEEE Trans. Geosci. Remote Sens. 2022, 60, 5410012. [Google Scholar] [CrossRef]
  13. Sariturk, B.; Seker, D.Z. A Residual-Inception U-Net (RIU-Net) Approach and Comparisons with U-Shaped CNN and Transformer Models for Building Segmentation from High-Resolution Satellite Images. Sensors 2022, 22, 7624. [Google Scholar] [CrossRef]
  14. Chen, J.; Yuan, Z.; Peng, J.; Chen, L.; Huang, H.; Zhu, J.; Liu, Y.; Li, H. DASNet: Dual attentive fully convolutional Siamese networks for change detection in high-resolution satellite images. IEEE J. Sel. Top. Appl. Earth Obs. Remote Sens. 2020, 14, 1194–1206. [Google Scholar] [CrossRef]
  15. Chen, B.; Xia, M.; Qian, M.; Huang, J. MANet: A multi-level aggregation network for semantic segmentation of high-resolution remote sensing images. Int. J. Remote Sens. 2022, 43, 5874–5894. [Google Scholar] [CrossRef]
  16. Song, L.; Xia, M.; Weng, L.; Lin, H.; Qian, M.; Chen, B. Axial Cross Attention Meets CNN: Bibranch Fusion Network for Change Detection. IEEE J. Sel. Top. Appl. Earth Obs. Remote Sens. 2023, 16, 32–43. [Google Scholar] [CrossRef]
  17. Song, L.; Xia, M.; Jin, J.; Qian, M.; Zhang, Y. SUACDNet: Attentional change detection network based on siamese U-shaped structure. Int. J. Appl. Earth Obs. Geoinf. 2021, 105, 102597. [Google Scholar] [CrossRef]
  18. Lu, C.; Xia, M.; Lin, H. Multi-scale strip pooling feature aggregation network for cloud and cloud shadow segmentation. Neural Comput. Appl. 2022, 34, 6149–6162. [Google Scholar] [CrossRef]
  19. Yu, M.; Chen, X.; Zhang, W.; Liu, Y. AGs-Unet: Building Extraction Model for High Resolution Remote Sensing Images Based on Attention Gates U Network. Sensors 2022, 22, 2932. [Google Scholar] [CrossRef]
  20. Long, J.; Shelhamer, E.; Darrell, T. Fully convolutional networks for semantic segmentation. In Proceedings of the IEEE Conference on Computer Vision and Pattern Recognition, Boston, MA, USA, 7–12 June 2015; pp. 3431–3440. [Google Scholar]
  21. Zhao, H.; Shi, J.; Qi, X.; Wang, X.; Jia, J. Pyramid scene parsing network. In Proceedings of the IEEE Conference on Computer Vision and Pattern Recognition, Honolulu, HI, USA, 21–26 July 2017; pp. 2881–2890. [Google Scholar]
  22. Ronneberger, O.; Fischer, P.; Brox, T. U-net: Convolutional networks for biomedical image segmentation. In Proceedings of the International Conference on Medical Image Computing and Computer-Assisted Intervention, Munich, Germany, 5–9 October 2015; Springer: Berlin/Heidelberg, Germany, 2015; pp. 234–241. [Google Scholar]
  23. Li, H.; Xiong, P.; An, J.; Wang, L. Pyramid attention network for semantic segmentation. arXiv 2018, arXiv:1805.10180. [Google Scholar]
  24. Xia, M.; Qian, J.; Zhang, X.; Liu, J.; Xu, Y. River segmentation based on separable attention residual network. J. Appl. Remote Sens. 2019, 14, 032602. [Google Scholar] [CrossRef]
  25. Hu, K.; Zhang, D.; Xia, M.; Qian, M.; Chen, B. LCDNet: Light-Weighted Cloud Detection Network for High-Resolution Remote Sensing Images. IEEE J. Sel. Top. Appl. Earth Obs. Remote Sens. 2022, 15, 4809–4823. [Google Scholar] [CrossRef]
  26. Hu, K.; Li, M.; Xia, M.; Lin, H. Multi-Scale Feature Aggregation Network for Water Area Segmentation. Remote Sens. 2022, 14, 206. [Google Scholar] [CrossRef]
  27. Xia, M.; Li, Y.; Zhang, Y.; Weng, L.; Liu, J. Cloud/snow recognition of satellite cloud images based on multiscale fusion attention network. J. Appl. Remote Sens. 2020, 14, 032609. [Google Scholar] [CrossRef]
  28. He, K.; Zhang, X.; Ren, S.; Sun, J. Deep residual learning for image recognition. In Proceedings of the IEEE Conference on Computer Vision and Pattern Recognition, Las Vegas, NV, USA, 27–30 June 2016; pp. 770–778. [Google Scholar]
  29. Krizhevsky, A.; Sutskever, I.; Hinton, G.E. Imagenet classification with deep convolutional neural networks. Commun. ACM 2017, 60, 84–90. [Google Scholar] [CrossRef]
  30. Simonyan, K.; Zisserman, A. Very deep convolutional networks for large-scale image recognition. arXiv 2014, arXiv:1409.1556. [Google Scholar]
  31. Szegedy, C.; Liu, W.; Jia, Y.; Sermanet, P.; Reed, S.; Anguelov, D.; Erhan, D.; Vanhoucke, V.; Rabinovich, A. Going deeper with convolutions. In Proceedings of the IEEE Conference on Computer Vision and Pattern Recognition, Boston, MA, USA, 7–12 June 2015; pp. 1–9. [Google Scholar]
  32. Howard, A.G.; Zhu, M.; Chen, B.; Kalenichenko, D.; Wang, W.; Wey, T.; Andreetto, M.; Adam, H. Efficient convolutional neural networks for mobile vision applications. arXiv 2017, arXiv:1704.04861. [Google Scholar]
  33. Zhang, X.; Zhou, X.; Lin, M.; Sun, J. Shufflenet: An extremely efficient convolutional neural network for mobile devices. In Proceedings of the IEEE Conference on Computer Vision and Pattern Recognition, Salt Lake City, UT, USA, 18–22 June 2018; pp. 6848–6856. [Google Scholar]
  34. Hou, Q.; Zhou, D.; Feng, J. Coordinate attention for efficient mobile network design. In Proceedings of the IEEE/CVF Conference on Computer Vision and Pattern Recognition, Virtual Conference, 19–25 June 2021; pp. 13713–13722. [Google Scholar]
  35. Srinivas, A.; Lin, T.Y.; Parmar, N.; Shlens, J.; Abbeel, P.; Vaswani, A. Bottleneck transformers for visual recognition. In Proceedings of the IEEE/CVF Conference on Computer Vision and Pattern Recognition, Virtual Conference, 19–25 June 2021; pp. 16519–16529. [Google Scholar]
  36. Qu, Y.; Xia, M.; Zhang, Y. Strip pooling channel spatial attention network for the segmentation of cloud and cloud shadow. Comput. Geosci. 2021, 157, 104940. [Google Scholar] [CrossRef]
  37. Hou, Q.; Zhang, L.; Cheng, M.M.; Feng, J. Strip pooling: Rethinking spatial pooling for scene parsing. In Proceedings of the IEEE/CVF Conference on Computer Vision and Pattern Recognition, Seattle, WA, USA, 14–19 June 2020; pp. 4003–4012. [Google Scholar]
  38. Xia, M.; Wang, T.; Zhang, Y.; Liu, J.; Xu, Y. Cloud/shadow segmentation based on global attention feature fusion residual network for remote sensing imagery. Int. J. Remote Sens. 2021, 42, 2022–2045. [Google Scholar] [CrossRef]
  39. Vaswani, A.; Shazeer, N.; Parmar, N.; Uszkoreit, J.; Jones, L.; Gomez, A.N.; Kaiser, Ł.; Polosukhin, I. Attention is all you need. arXiv 2017, arXiv:1706.03762. [Google Scholar]
  40. Yu, C.; Gao, C.; Wang, J.; Yu, G.; Shen, C.; Sang, N. Bisenet v2: Bilateral network with guided aggregation for real-time semantic segmentation. Int. J. Comput. Vis. 2021, 129, 3051–3068. [Google Scholar] [CrossRef]
  41. Park, H.; Sjösund, L.L.; Yoo, Y.; Bang, J.; Kwak, N. Extremec3net: Extreme lightweight portrait segmentation networks using advanced c3-modules. arXiv 2019, arXiv:1908.03093. [Google Scholar]
  42. Badrinarayanan, V.; Kendall, A.; SegNet, R.C. A deep convolutional encoder-decoder architecture for image segmentation. arXiv 2015, arXiv:1511.00561. [Google Scholar] [CrossRef] [PubMed]
  43. Wang, Y.; Zhou, Q.; Xiong, J.; Wu, X.; Jin, X. ESNet: An efficient symmetric network for real-time semantic segmentation. In Proceedings of the Chinese Conference on Pattern Recognition and Computer Vision (PRCV), Xi’an, China, 8–11 November 2019; Springer: Berlin, Germany, 2019; pp. 41–52. [Google Scholar]
  44. Yang, Q.; Chen, T.; Fan, J.; Lu, Y.; Zuo, C.; Chi, Q. Eadnet: Efficient asymmetric dilated network for semantic segmentation. In Proceedings of the ICASSP 2021–2021 IEEE International Conference on Acoustics, Speech and Signal Processing (ICASSP), Toronto, ON, Canada, 6–11 June 2021; pp. 2315–2319. [Google Scholar]
  45. Chaurasia, A.; Culurciello, E. Linknet: Exploiting encoder representations for efficient semantic segmentation. In Proceedings of the 2017 IEEE Visual Communications and Image Processing (VCIP), St. Petersburg, FL, USA, 10–13 December 2017; pp. 1–4. [Google Scholar]
  46. Chen, L.C.; Zhu, Y.; Papandreou, G.; Schroff, F.; Adam, H. Encoder-decoder with atrous separable convolution for semantic image segmentation. In Proceedings of the European Conference on Computer Vision (ECCV), Glasgow, UK, 23–28 August 2018; pp. 801–818. [Google Scholar]
  47. Yuan, Y.; Chen, X.; Chen, X.; Wang, J. Segmentation transformer: Object-contextual representations for semantic segmentation. arXiv 2019, arXiv:1909.11065. [Google Scholar]
  48. Dang, B.; Li, Y. MSResNet: Multiscale residual network via self-supervised learning for water-body detection in remote sensing imagery. Remote Sens. 2021, 13, 3122. [Google Scholar] [CrossRef]
  49. Hu, K.; Weng, C.; Zhang, Y.; Jin, J.; Xia, Q. An Overview of Underwater Vision Enhancement: From Traditional Methods to Recent Deep Learning. J. Mar. Sci. Eng. 2022, 10, 241. [Google Scholar] [CrossRef]
Figure 1. Local feature search network (DFSNet).
Sustainability 15 03034 g001
Figure 2. Residual structure.
Sustainability 15 03034 g002
Figure 3. Discard attention module.
Sustainability 15 03034 g003
Figure 4. Slice pooling module.
Sustainability 15 03034 g004
Figure 5. Fusion attention upsampling module.
Sustainability 15 03034 g005
Figure 6. Examples from land cover images and labels. In row (a), the red circle area is water, and the feedback spectrum of water body in different areas will be different. In line (b), the roads and containers marked with yellow circles are easily misjudged as buildings.
Sustainability 15 03034 g006
Figure 7. Boston—A data display; (a) Original image (b) Label image.
Sustainability 15 03034 g007
Figure 8. Comparison of visual effects of ablation experiment. (a) Overlay of original image and label; (b) Baseline; (c) Baseline+FAUM; (d) Baseline+FAUM+SPM; (e) Baseline+FAUM+DAM; (f) DSFNet (Ours).
Sustainability 15 03034 g008
Figure 9. Comparison of the effects of thermal maps of ablation experiments. (a) Test image; (b) Baseline; (c) Baseline+FAUM; (d) Baseline+FAUM+SPM; (e) Baseline+FAUM+DAM; (f) DSFNet (Ours).
Sustainability 15 03034 g009
Figure 10. Effect comparison of land cover test set; (a) Overlay of original image and label; (b) FCN8s; (c) SegNet; (d) LinkNet; (e) PAN; (f) EDANet; (g) ExtremeC3; (h) DSFNet (Ours).
Sustainability 15 03034 g010
Figure 11. Effect comparison of land cover test set. (a) Overlay of original image and label; (b) DeepLapV3+; (c) BiseNetV2; (d) EsNet; (e) UNet; (f) OcrNet; (g) PSPNet; (h) MSResNet; (i) DSFNet (Ours).
Sustainability 15 03034 g011
Figure 12. Comparison of thermodynamic diagram effects of different models. (a) Test image; (b) SegNet; (c) LinkNet; (d) EDANet; (e) EsNet; (f) PSPNet; (g) DSFNet (Ours).
Sustainability 15 03034 g012
Figure 13. Visual effect comparison of Massachusetts building test set. (a) Overlay of original image and label; (b) SegNet; (c) BiseNetV2; (d) PAN; (e) PSPNet; (f) DeepLapV3+; (g) DSFNet (Ours).
Sustainability 15 03034 g013
Table 1. Detailed parameter settings for ResNet-18.
Layer NameOutput18-LayerStrideSize
Layer-0 256 × 256 7 × 7 , 64
3 × 3 , m a x p o o l , 64
21/2
Layer-1 128 × 128 3 × 3 , 64 3 × 3 , 64 × 2 21/4
Layer-2 64 × 64 3 × 3 , 128 3 × 3 , 128 × 2 21/8
Layer-3 32 × 32 3 × 3 , 256 3 × 3 , 256 × 2 21/16
Layer-4 8 × 8 3 × 3 , 512 3 × 3 , 512 × 2 21/32
Table 2. The RGB values of dataset labels.
ClassRGB
Void000
Build255255255
Water0180255
Table 3. The RGB values of dataset labels.
ClassRGB
Void000
Build255255255
Table 4. Performance Comparison of DSFNet (Ours) and Different Attention Modules in Evaluation Indicators.
MethodDASPMFAUMMPA(%)PA(%)MIoU(%)
Baseline 83.7586.2172.68
Baseline+FAUM 89.9289.7880.84
Baseline+SPM+FAUM 88.6288.6379.49
Baseline+DA+FAUM 89.2588.6979.04
DSFNet (Ours)91.5291.0383.73
Table 5. Experimental results of land cover test set.
MethodBackboneMPA (%)PA (%)MIoU (%)
FCN8sVGG1680.9981.7165.35
SegNet-87.0687.7875.23
LinkNet-88.9588.3077.80
PANResNet-5087.1189.1277.86
EDANet-87.0489.2577.86
ExtremeC3-88.6088.3678.75
DeepLapV3+ResNet-10188.8886.4479.20
BiseNetV2-89.1789.5079.47
EsNet-90.1988.9579.65
UNet-90.4689.3579.98
OcrNet-89.3990.0680.49
PSPNetResNet-5088.8389.4980.85
MSResNetResNet-3490.7990.6382.07
DSFNet (Ours)ResNet-1891.5291.0383.73
Table 6. Experimental Results of Massachusetts Building Test Set.
MethodBackbonePA (%)MIoU (%)
SegNet-91.7081.83
BiseNetV2-92.6483.00
PAN-92.8383.08
PSPNet-92.7083.47
DeepLapV3+ResNet-10193.3384.35
DSFNet (Ours)ResNet-1893.4684.69
Disclaimer/Publisher’s Note: The statements, opinions and data contained in all publications are solely those of the individual author(s) and contributor(s) and not of MDPI and/or the editor(s). MDPI and/or the editor(s) disclaim responsibility for any injury to people or property resulting from any ideas, methods, instructions or products referred to in the content.

