1. Introduction
Sustainability, energy efficiency, and healthy aging communities are areas of growing concern [
1] as the world faces two major challenges today: climate emergency and population aging [
1,
2]. Worldwide, according to figures from the Economic Commission for Latin America and the Caribbean (CEPAL) [
3], the population aged 60 and over will increase from 900 million to more than 1.4 billion people between 2015 and 2030. However, the speed of the aging of the population will differ between regions of the world. Europe is the most aged continent at this time, but Latin America presents a faster aging process, going from 70 million people to 119 million between 2015 and 2030 [
3]. Given this current situation, studies are emerging that take these aspects into account in the face of new global challenges.
At the same time, the climate emergency will increase the prevalence of extremely hot summers and extremely cold winters. This scenario may force older people to use cooling and heating systems more frequently [
4]. Giamalaki and Kolokotsa [
5], who conducted a study in a Mediterranean climate in Greece, were able to demonstrate, based on ratings of thermal sensation (TSV), thermal comfort (TCV), and thermal satisfaction (TSAV), that older people felt colder in the heating season and hotter in the cooling season. In addition, very hot summers and very cold winters increase the risks of pneumonia, hypothermia (winter), heat stroke, dehydration, and hyperthermia (summer) in the elderly [
4]. However, instantaneous cold exposure is more dangerous than heat exposure, as their thermoregulatory system does not work effectively [
4,
6] to help their bodies reach thermal equilibrium in low temperatures.
The before mentioned differences in thermal sensation and preference compared to other age ranges were confirmed by Baquero and Forcada [
7], which showed statistical differences between the thermal sensation of elderly people (over 65 years of age) and younger adults (average 35 years of age). They presented a 2.4 °C difference in neutral temperature in summer conditions, being 25.6 °C in elderly people compared to 23.2 °C for adults. On the other hand, in warmer environments, older people were more tolerant than other adults. Therefore, the results affirm that older people are less sensitive to thermal changes [
7] and are more vulnerable to extreme temperature changes [
4].
Thermal perception depends on the physical, physiological, psychological, and contextual factors [
8], which can then be dissected into more specific factors. Older heat balance models will only consider physical and physiological factors, while adaptative comfort also includes some psychological and contextual factors [
9]. Regarding the comfort standards that currently exist, these are mainly based on the needs of younger adults [
10]. Thermal comfort models, for example, are potentially not adequate to predict the comfort range of the elderly [
2,
7], as it has been suggested that older adults would be less sensitive to temperature changes than that predicted by the predictive model (PMV) [
7]. The ASHRAE 55 standard [
11], which establishes acceptable thermal conditions for the occupant, states no difference between different age groups. However, subsequent research such as that of Schellen et al. [
12] has determined that the thermal sensation of older adults is generally 0.5 scale units lower (7-point thermal sensation scale) than the thermal sensation of younger adults. The differences in metabolic rate, body composition, and fitness between younger adults and older adults should indicate that a difference in thermal perception is to be expected. Therefore, the concern about the differences of thermal perception between the elderly and their caregivers arises.
Some differences in thermal comfort between young and older adults in other settings [
11,
12] have been found as well as differences in the thermal perception between the elderly and their caregivers in shared spaces [
6,
9].
In the context of this study, nursing homes are defined as residential and specialized care services aimed at people over 60 who have some level of physical and/or cognitive dependence, that is, they need the support of third parties to carry out activities of daily living. In the context of nursing, it has been shown that both types of occupants (older adults and caregivers) have different thermal sensations [
13]. The study by Forcada et al. [
13] conducted in Spain showed that residents and non-residents had different thermal sensations and preferences during winter. The research found that the resident older adults had lower metabolic rates compared with care personal, which in turn meant that they used clothing insulation as an adaptative strategy to find thermal comfort [
7]. That is, older people may require higher clothing insulation (clo) to have the same comfort level as younger people [
10].
Therefore, it can be concluded that a discussion of thermal comfort must also consider adaptive behavior used by older people to achieve better thermal conditions in nursing homes [
5]. The research by Jiao et al. [
14] conducted in Shanghai, China, consisted of studying the adaptive behavior of older adults in their homes in both winter and summer, in which clothing adjustment and window opening predominated, the latter being the most relevant in summer. These behaviors were also presented in the research of Giamalaki and Kolokotsa [
5], being the first strategies to be adopted by older adults in Greece. The cited research has been conducted in private homes. Therefore, it is hypothesized that their adaptative behavior would be restricted when they are in spaces shared by several simultaneous occupants or do not have the same capabilities to control the indoor environment. These restrictions in adaptative behavior have been seen in adults working in shared offices [
15], where it was concluded that distance to the elements (windows or switches) was a major determining factor.
As far as Chile is concerned, there is no research on thermal comfort in older adults. Research on school children [
16,
17] and on adults [
18] have shown differences between the comfort ranges based on surveys and calculations. Therefore, this research is exploratory in scope and has a quantitative approach. The objective of this research was to evaluate the thermal comfort of the occupants of nursing homes for older adults through the study of comfort gaps and adaptive behavior to project future research related to the well-being of older adults.
2. Materials and Methods
The methodology used to evaluate the thermal comfort of the occupants of nursing homes for older adults involved monitoring, surveying, and then the modeling of thermal comfort. The field work consisted of the monitoring of indoor temperature and relative humidity in common spaces used by both older adults and their caregivers in the nursing homes. Outdoor temperature and relative humidity were also recorded. Simultaneously, surveys were applied to evaluate the perception of thermal comfort from the perspective of the occupants. These measurements were performed in the common spaces in three nursing homes for older adults located in different communes of Greater Concepción: Hualpén, Coronel, and Tomé. The evaluation of thermal comfort was made through modeling. The conceptual framework of the study is presented in
Figure 1.
The comfort temperatures were calculated using the Griffiths equation:
Based on [
19], the value of
b = 0.5 was used in this study. The upper and lower limits of the neutral temperature were defined as ±2.5 °C according to [
20]. The resulting comfort temperatures for the elderly and caregivers group were then compared and contrasted.
Afterward, the results of the adaptative strategies survey were studied through descriptive statistics to find the most used strategies in each group of occupants (elderly and caregivers). Finally, the comfort temperatures and the adaptative strategies were contrasted to identify similarities and differences between both groups.
2.1. Context
In Chile, as life expectancy has increased, health problems are also spreading (about 93.1% is the rate of medical care for older adults) as is dependency (14.2% of the total number of older adults), according to CASEN [
21], which affects the quality of life of older adults. For example, the National Service for the Elderly [
22] has long-stay facilities for the elderly (ELEAM), which are nursing homes for elderly people in conditions of social, physical, and cognitive vulnerability.
2.2. Case Studies
The case studies include three nursing homes for the elderly in three municipalities of Gran Concepción, which were selected in relation to the similarity in heating systems and infrastructure and accessibility to them. The city and the three municipalities of Greater Concepción are characterized as Mediterranean-oceanic (Köppen Csb), according to the Köppen classification [
23]. The average temperature in winter (July) is 9.0 °C, while in summer (January), 16.3 °C registered in the year 2021, according to the Chilean Meteorological Directorate [
24]. Dwellings in this area are commonly equipped with heating systems in winter and no cooling devices.
Three cases were chosen that have centralized boiler heating systems, either gas or pellet. As for ventilation, this had to consist only of passive strategies by opening windows. Nursing homes in which the elderly were mostly bedridden and/or unable to answer surveys were excluded. The selected nursing homes had to have common spaces where both older adults and caregivers would spend time.
Table 1 shows the three cases studied.
All three cases worked under the supervision of SENAMA regarding the minimum infrastructure requirements for their operation. The type of heating, insulation, access, etc. are mandated by them. These requirements are not instated in privately operated nursing homes.
2.3. Characterization of the Nursing Homes
A characterization of the buildings was made including whether there is a roof and/or wall insulation, type of glazing, and type of heating system. Regarding the occupation of spaces, older adults frequented up to two common rooms, in which caregivers moved around to perform their care functions. Therefore, it was decided that temperature and relative humidity measurements would be taken from these common rooms.
The characterization in
Table 2 of the three facilities allows us to understand what elements could influence the thermal sensation, thermal preference, etc. of the occupants surveyed as well as the temperature of the air in which they found themselves.
2.4. Field Measurements
Field measurements included indoor air temperature and relative humidity (RH) and outdoor air temperature and relative humidity (RH), which were recorded during the winter season between August and September and during the spring in November–December. These measurements were performed with HOBO MX1101 devices placed in shared spaces (hall) near older adults and caregivers in the nursing homes and outdoors. In total, one to two temperature monitoring instruments were installed per room and one outside in each residence (
Figure 2). All indoor instruments were located at 1.1 m, as recommended by ISO 7726 [
25]. Care was taken to ensure that the occupants were close to these instruments during monitoring.
The instruments were installed before the first survey was taken and removed after the last survey was completed and were programmed to measure the indoor and outdoor temperature and relative humidity at intervals of once every 30 min.
2.5. Surveys
Simultaneously to the temperature and relative humidity measurements, surveys were conducted randomly among the occupants of shared spaces or rooms (i.e., where both older adults (people over 60 years of age, categorized as “residents”) and caregivers (workers under 60 years of age, categorized as “non-residents”) coexisted.
Surveys were conducted anonymously and randomly to a selected group of occupants. The cognitive capabilities of the occupants were informed by the manager of each nursery home. People with dementia or Alzheimer’s were excluded from the study. At the moment of survey, only the subjects that were present in the analyzed space were surveyed. An external surveyor was designated for each residence, who had to read the questions to each subject and then record the responses manually, in addition to reading the informed consent form. The surveys were administered by psychologists to corroborate that the residents could answer the surveys. Prior to starting the surveys, the surveyors had to comply with the protocols and sanitary equipment to prevent the spread of COVID-19, since deaths caused by this disease affect older adults in nursing homes more than the rest of the population [
26].
These surveys were conducted for 7 consecutive days, three times a day: once in the morning at 9:00 am, once at noon, and once in the afternoon at 3:00 pm. These hours were chosen, since it was found that there was a greater variability in the temperatures at these times and that after 15:00 h, the outside temperature was similar to that of the morning. In addition, this was the most appropriate for the schedules of older adults, who have the characteristic of starting and ending their days earlier. These measurements were taken both in winter and spring. In the rare cases that there were no occupants in the shared room, the measurements were resumed at the next time slot.
In total, 77 people participated in the winter season, both older adults (residents) and caregivers (non-residents). Regarding the spring season, a total of 102 participated. The increase in resident participants increased in the spring season, since they were more willing once they gained confidence. The age of the respondents ranged from 60 to 92 years of age among residents and 22 to 54 years of age among non-residents.
Table 3 details the respondent totals for both stages.
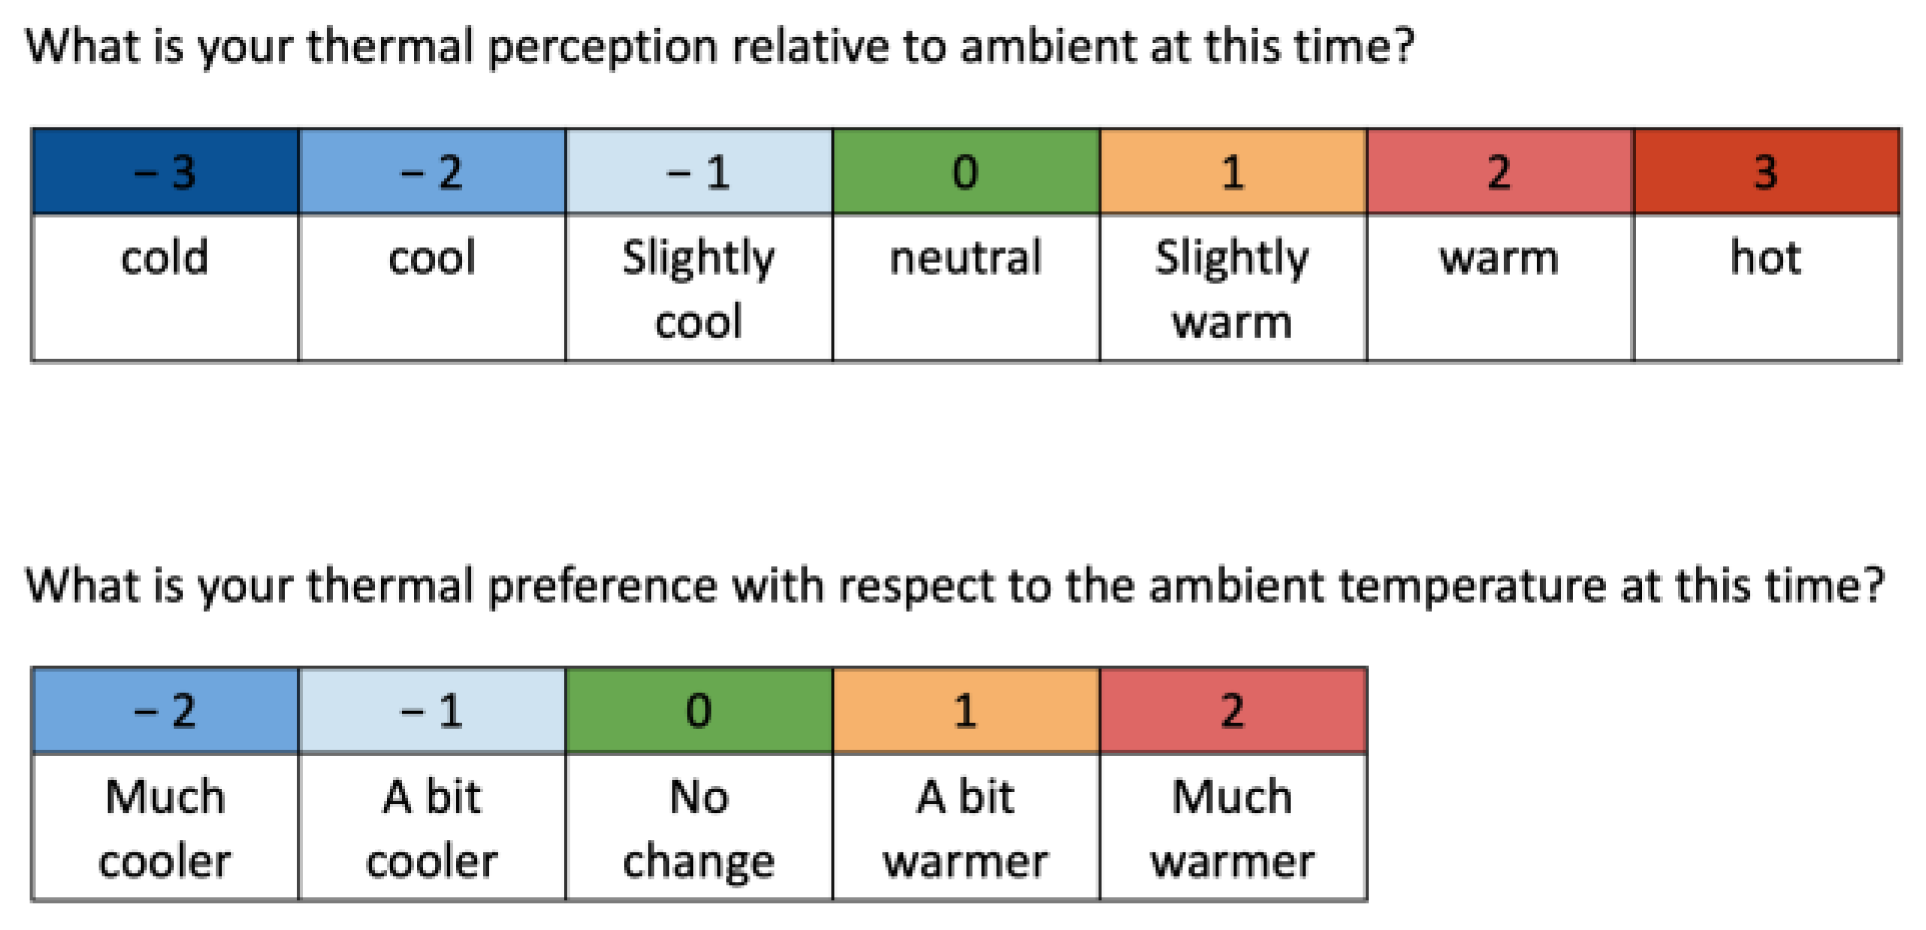
The survey consisted of measuring the thermal sensation (TS) using a 7-point scale (−3 cold, −2 cool, −1 slightly cool, 0 neutral, 1 slightly warm, 2 warm, 3 sweltering) and thermal preference voting (TPV) using a 5-point scale (−2 cooler, −1 slightly cooler, 0 unchanged, 1 slightly warmer, 2 warmer). For the development of these scales, the ASHRAE 55 standard [
12] was used as a reference. Then, values regarding clothing insulation (clo) and metabolic rate (met) obtained from the ASHRAE 55 standard [
12] (
Table 4) were specified and measured in the survey by multiple choice. Both the scales and the multiple choice had to be adapted from English to Spanish using [
8] as a reference for translation. A final stage of the survey consisted of asking what adaptive strategies the occupants adopted in the face of low temperatures or high temperatures, in order to thus understand the adaptative strategies occupants used to adapt to the thermal environment.
Previous research conducted by Baquero and Forcada [
7] and Chindapol [
27] used accompanying images to simplify the scales for older adults. Trebilcock et al. [
16,
28] used color scales and pictures for surveys with children [
17]. Drawing on this experience, it was decided to include color coding of the scale for the elderly, as presented in
Figure 3. In addition, the questions had to be adapted from English to Spanish, as shown in
Table 5. Follow-up questions were asked. The questions: “What is your thermal sensation at this moment”, was followed by “Do you think the environment is: very cold, cold, slightly cold, neutral, slightly warm, warm or suffocating?”; each of the options were indicated as they were read on the scale to facilitate the response by the residents.
3. Results
3.1. Temperature Measurements, Thermal Sensation, and Thermal Preference
Regarding the temperature measurements,
Table 6 shows the average indoor and outdoor temperature and relative humidity in each case study, both in the winter and spring seasons. Additionally, the mean thermal sensation vote and thermal preference for both residents and non-residents in both seasons were obtained.
During the winter season, an average indoor ambient temperature of 21.3 °C with a relative humidity of 50.92% was recorded. The average thermal sensation of residents resulted in a value of 0 (neutral), and non-residents showed a value of 0.42 (slightly warmer), therefore, the non-residents had a slightly higher thermal sensation than the older adults, with a difference of 0.42 on the 7-point scale. In terms of thermal preference, both residents and non-residents preferred a “slightly warmer” environment, with a value of 0.3 for residents and 0.12 for non-residents, relative to the 5-point scale.
For the spring season, an indoor ambient temperature of 22.11 °C with a relative humidity of 56.25% was recorded. The average thermal sensation of the residents resulted in a value of 0.00 (neutral) and non-residents in a value of 0.87 (slightly warm), therefore, the non-residents again had a higher thermal sensation, with a difference of 0.87 on the 7-point scale, higher than in the winter season. Regarding the thermal preference, residents presented a lower value compared to winter with 0.09, and the non-residents showed a value of 0.21 on the 5-point scale. In this case, there was a particular situation in which the non-residents preferred a warmer environment compared to the residents.
Regarding the thermal sensation (
Table 7), the resident’s votes were mostly concentrated in the value 0 (neutral) in both winter and spring. However, in spring, the neutral thermal sensation increased to 81.36% compared to winter (64.96%).
For non-residents, in spring, the thermal sensation of 0 (neutral) was maintained with a value of 33.75% in spring, however, unlike the residents, the votes were more dispersed between the values 0 (neutral) and 3 (sweltering).
For the thermal preference votes, again, the residents agreed, with a majority of 71.32% for winter and 82.46% for spring, with the value of 0 (no change) (i.e., they were satisfied with the ambient temperature). Only in winter did the votes tend to lean toward the value 1 (slightly warmer); therefore, in spring, they are more satisfied with the ambient temperature.
As for the non-residents, these values did not change much between the two seasons, but they did have a greater dispersion of votes among the options on the scale, unlike the residents, who concentrated their votes on the value 0 (neutral).
Table 8 shows the results of the total thermal sensation votes classified according to whether they were within or outside the comfort range of −1, 0, 1. Residents presented a higher percentage within the range with 83.94% in winter and 94.27% in spring. In the case of non-residents, there was no major difference between the two seasons, with a value of 64.29% in winter and 68.75% in spring. In other words, the thermal sensation of residents was closer to zero (neutral) than that of the non-residents.
3.1.1. Thermal Preference in Relation to Thermal Sensation
Regarding the thermal preference of the occupants, some residents, even if their thermal sensation vote was “neutral”, when asked about their thermal preference, opted for the preference of a “warmer” environment. In some cases, the residents preferred to vote thermal sensation as “neutral” and thermal preference as “no change”, but they were warmer than the caregivers (i.e., they presented a higher level of clothing insulation (clo), in addition to presenting a lower metabolic rate) (
Table 9).
From
Table 10, it can be observed that residents showed a greater insulation of clothing than the non-residents in both measurement periods. Regarding the metabolic factor, non-residents showed an increase in activity in spring, unlike the residents, who maintained almost the same level of activity as they were more sedentary and did not vary much over time.
Regarding the distribution and relationship between the thermal sensation and thermal preference in winter, the residents presented a higher concentration between a thermal sensation of value 0 (neutral) and a thermal preference of value 0 (no change), so most of the resident occupants were satisfied with the indoor environment temperatures (
Table 10). Although the non-residents also concentrated their votes in the thermal sensation value 0 and thermal preference value 0, their distribution of votes shows that their thermal sensation was greater than that of the older adults, since the latter had votes even in the value −3 (very cold) (
Table 11).
For the spring season, a similar situation occurred as in winter, but the residents were even more concentrated in the value 0 (neutral) for thermal sensation and value 0 (no change) for thermal preference (
Table 12). Thus, with temperatures during the spring, a higher level of conformity seems to be demonstrated. As for non-residents, the 0 values for thermal sensation and thermal preference were also maintained, but definitely, votes were no longer presented in the −3 (very cold) and −2 (cold) values of the thermal sensation scale (
Table 13).
3.1.2. Neutral Temperature and Comfort Ranges
From the neutral temperature calculated by the Griffiths’ method, the comfort range of the older adults and that of the caregivers was obtained. The thermal comfort range is determined by the neutral temperature; the neutral temperature minus 2.5 °C as the minimum comfort temperature and neutral temperature plus 2.5 °C as the maximum comfort temperature as the comfort limit temperatures defined for 90% acceptance [
20].
Table 12 presents the ranges for both occupant types.
The formula used to obtain the neutral temperature was as follows:
where Tn is the neutral temperature according to Griffiths’ method [
29], with a value of 0.5 K for the constant G, used in other research [
19].
The mean temperatures for both winter and spring used for the calculation of the neutral temperature are shown in
Table 14.
Residents recorded a neutral temperature of 21.3 °C in winter and 22.11 °C in spring. Non-residents recorded a neutral temperature of 20.5 °C in winter and 20.37 °C in spring. The difference between the two types of occupants was 0.8 °C in winter and 1.74 °C in spring; therefore, the gap between the two increased as the temperatures and their thermal sensation also increased.
3.2. Adaptive Response
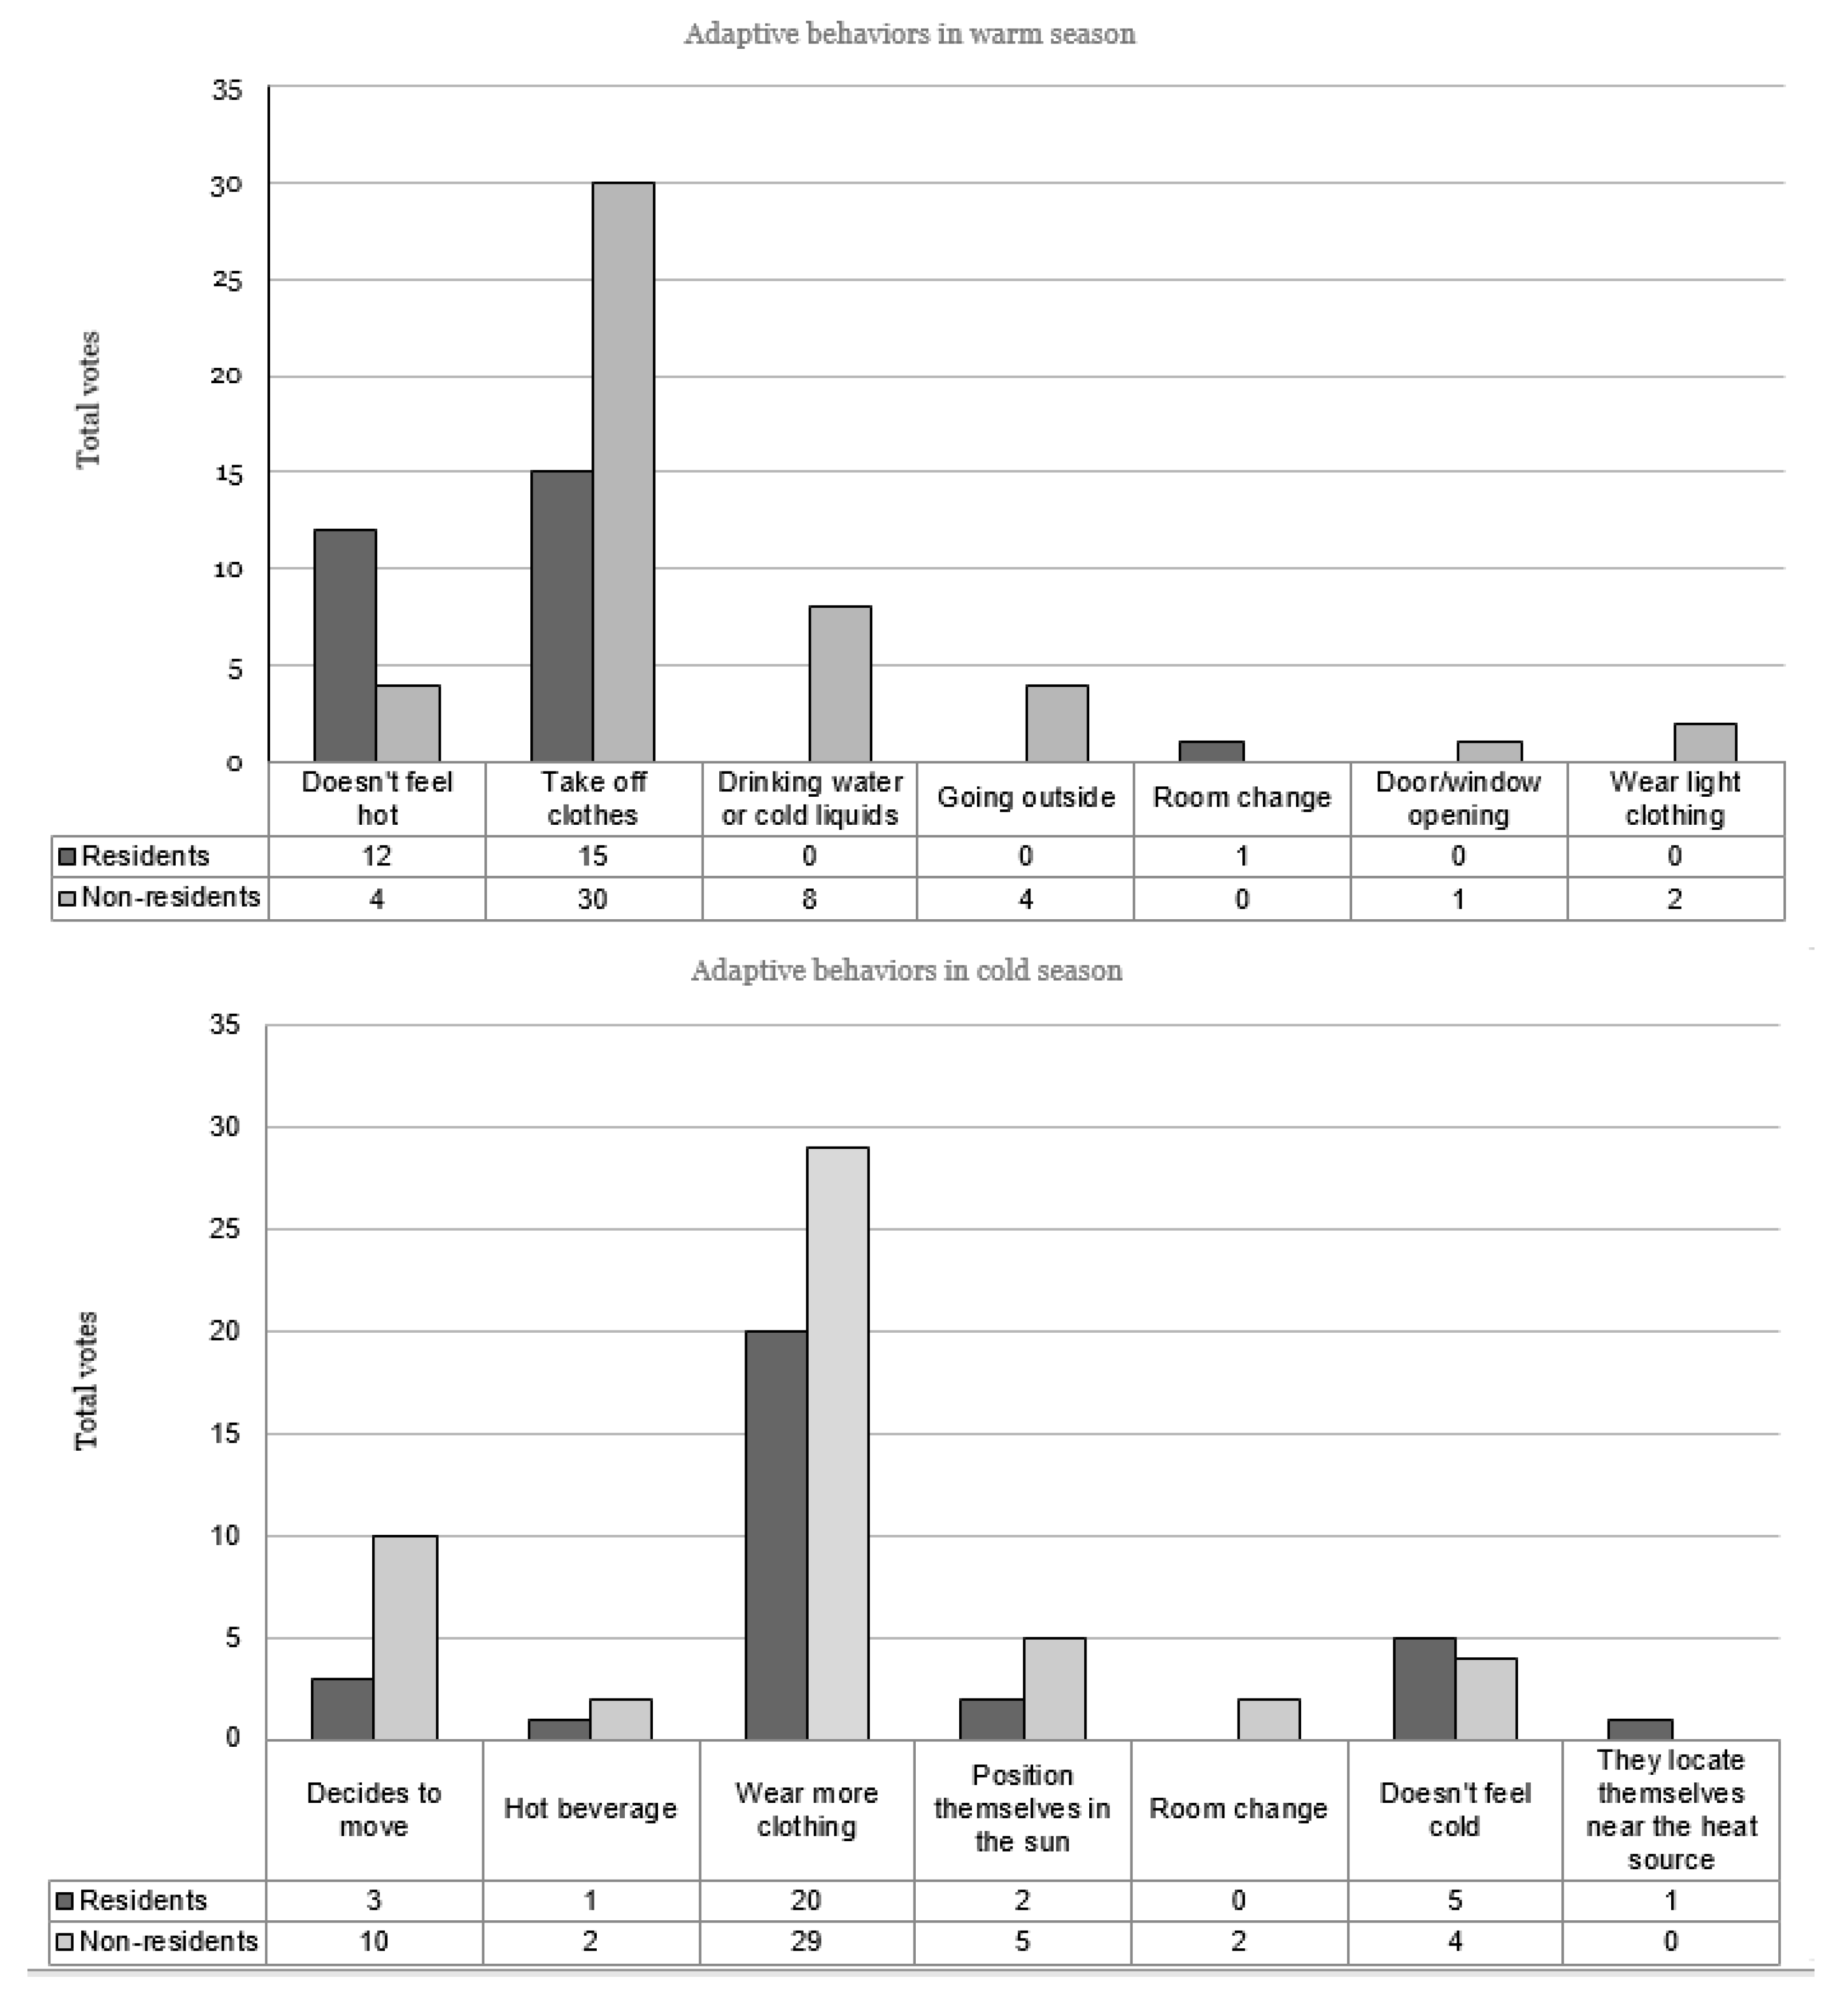
Regarding the last item consulted in the survey related to the adaptive response, this was understood as the actions that could be taken by each of the occupants to achieve their thermal comfort (
Figure 4). The residents expressed that their most common actions to achieve comfort in cold temperatures was to add more layers of clothing (increase the insulation of clothing). However, these actions often depends on the caregivers, who decide what clothes the elderly will wear. On the other hand, many older adults do not have the physical ability to move around to get into more comfortable clothes. Non-residents also preferred to increase their clothing and move around to warm up. This last strategy highlights the difference between residents and non-residents in terms of their ability to move; therefore, the same strategies were present in both types of occupants, but the difference was in the ability to carry them out freely. In addition, older adults tended to manipulate the air conditioning devices less [
30].
Regarding the adaptive response in hot weather, both older adults and caregivers responded that they preferred to take off clothes to reach their comfort temperature. However, a group of older adults also stated that they did not feel hot, so they did not have strategies to reach their comfort temperature in hot weather.
In none of the three nursing homes were the occupants able to control the heating systems. Even the caregivers were not always aware of how to set the boiler temperature. Only in Tomé could they opt for a wood stove as a backup heating system, since they considered that the boiler was not sufficient for heating during the winter. In addition, the caregivers could load wood in the stove if needed, rather than trying to control the boiler. In the three nursing homes, there was only one person in charge of boiler management and maintenance. Regarding the director of each residence, they had basic knowledge of how to turn the boiler on and off.
Regarding adaptive behavior, three situations were presented in both the residents and non-residents:
The ability to adapt on a personal level (adding or removing clothes, drinking hot or cold liquids);
Ability to control the indoor environment (control of heating, opening or closing windows);
Acceptance and not applying changes to the space (in a shared space, either out of consideration for others or other reasons).
Residents took more actions of personal level adaptation (in case they have the mobility and sufficient autonomy to do so) and acceptance to the indoor environment. As for the ability to control the outdoor environment, this was not present in the elderly group, mostly because they did not access the heating control in winter. In spring, they did not open the windows, either because they considered the preference of their companions with whom they shared the space, or because they had mobility problems. Non-residents did have the ability and mobility to control the interior space as well as the ability to adapt on a personal level. Acceptance was also present, with non-residents preferring adaptation on a personal level rather than control of the interior space if the residents did not need it.
4. Discussion
The results obtained through this research coincide with the findings of Baquero and Forcada [
7] regarding the difference in both the thermal sensation and thermal preference between older adults and their caregivers, in addition to the fact that older adults presented a greater tolerance to warmer environments.
Similarities were also presented in the values of the thermal sensation of the winter season, which presented a difference of 0.4 points on the thermal sensation scale. This value is similar to the mean recorded by Schellen et al. [
12], in which a difference of 0.5 points on the 7-point wind chill scale was recorded between older adults and caregivers.
In general, according to the study conducted by [
31], there are differences between 0.2 and 4 °C between the comfort ranges, so the differences in neutral temperature of 0.8 in winter and 1.74 in spring would be within the ranges studied.
Regarding adaptive behavior, three situations were presented in both the residents and non-residents:
The ability to adapt on a personal level (adding or removing clothes, drinking hot or cold liquids);
Ability to control the indoor environment (control of heating, opening or closing windows);
Acceptance and not applying changes to the space (in a shared space, either out of consideration for others or other reasons).
Similar findings were presented by Marín-Restrepo [
15], where the office occupants did not always change the conditions of the space as they considered the preferences of other occupants.
Among the limitations of the study are the difficulties involved in the study with older adults, especially due to the cognitive state of some of the participants, who could not always answer the surveys in their entirety, or their willingness to answer was affected by their distrust of answering surveys, which is why they showed a better disposition in the second stage (spring season). It should also be considered that since the research was exploratory in nature and the sample obtained was small, the values could vary as the sample size increased. As for the measurement of the indoor environment temperature, it did not consider radiant temperature, therefore, there may be differences in the case of using the operating temperature as a reference for the calculations of neutral temperature and comfort ranges.
5. Conclusions
This research consisted of collecting information on the comfort levels of older adults and determining the difference with the comfort levels of their caregivers in nursing homes in Gran Concepción, Chile. Indoor and outdoor temperature monitoring was performed as well as surveys on thermal sensation and thermal preference, in addition to considering clothing insulation (clo), metabolic rate (met), and the consideration of the most common adaptive responses to achieve comfort in cold and warm temperatures.
The results showed that differences do exist between the thermal sensation of older adults and caregivers as well as in their thermal preference. In all three case studies, residents were comfortable within a temperature range of 18.8–23.8 °C in winter and 19.6–23.6 °C in spring while the average indoor temperature was 21.3 °C in winter and 22.11 °C in spring. Non-residents were also comfortable within a range of 18.0–23.0 °C in winter and 17.9–22.9 °C in spring. However, the mean clothing insulation (clo) and metabolic rate of both groups were different as the residents presented a higher clothing insulation and lower metabolic rate than non-residents. It should be considered that non-residents are in constant movement to perform their work attending to the needs of the residents, being a much more strenuous activity in comparison. In addition, they spent less time in a single space, unlike the older adults.
While all of the mean temperatures in the case studies were in the comfort range, future research should consider the energy use due to an apparent lack of insulation in the building. It is relevant to note that these nursing homed work under the supervision of SENAMA, and therefore they are expected to have better conditions than privately operated nursing homes since the heating and insulation of the buildings are not required for privately operated nursing homes.
Differences in the coping strategies of both groups have also been highlighted, which showed that older adults had fewer options to reach their comfort temperature in winter due to reduced mobility. While neither group, both older adults and caregivers, had control over the heating and its programming, caregivers had the option of moving to get warm apart from modifying their clothing insulation (clo). Regarding the spring season, both groups agreed on adapting clothing insulation (clo) to reach a comfortable temperature, however, older adults also stated that they did not usually feel warm. Given these results, future research could consider how to allow or grant control options over the HVAC systems to occupants of a shared space, especially for older adults, who have fewer options to control them.
One of the limitations of the surveys was that they were only given to older adults who had the cognitive capacity to respond, according to information provided by the management of each residence. The number of respondents was considerably lower than the total number of occupants of the building due to the exclusion criterion regarding cognitive ability.
These results allow us to lay the foundation for thermal comfort in older adults on a local and global scale as well as to identify the constraints to the use of adaptative measures. This exploratory work could be expanded to define a model of thermal comfort for the elderly. It could also be used to develop retrofitting techniques that would allow for both the needs of the occupants and lower energy demand to be met. The results of this research will serve as a starting point to develop new products and strategies for personal comfort.


