Article

Effects of Mineral-Based Potassium Humate on Cadmium Accumulation in Rice (Oryza sativa L.) under Three Levels of Cadmium-Contaminated Alkaline Soils

1
Environment Research Institute, Shandong University, Qingdao 266237, China
2
Shandong General Station of Agricultural Environmental Protection and Rural Energy, Jinan 250100, China
3
Shandong Academy of Agricultural Sciences, Jinan 250100, China
4
College of Resources and Environment, Huazhong Agricultural University, Wuhan 430070, China
5
Institute of Agricultural Resources and Regional Planning, Chinese Academy of Agricultural Sciences, Beijing 100081, China
*
Authors to whom correspondence should be addressed.
Sustainability 2023, 15(3), 2836; https://doi.org/10.3390/su15032836
Submission received: 9 January 2023 / Revised: 29 January 2023 / Accepted: 31 January 2023 / Published: 3 February 2023
(This article belongs to the Special Issue Farmland Soil Pollution Control and Ecological Restoration)

Abstract

:
Humic acid amendments in the remediation of soils contaminated with heavy metals have received widespread attention. However, the impacts and related mechanisms of mineral-based humate substances on the remediation of alkaline paddy soils with different levels of cadmium (Cd) contamination are still unclear. Pot trials with four mineral-based potassium humate (MBPH) doses (0, 0.25%, 0.5%, 1%, w/w) and three Cd rates (slightly, moderately, and highly, 1, 2, and 4 mg Cd kg−1) were conducted to evaluate the effects of MBPH on rice. Results showed that the application of MBPH effectively reduced brown rice Cd concentrations of all Cd rates by 46.82–65.04%, 44.02–59.21%, and 15.84–43.99%, such that Cd in brown rice fell within the safe edible standards in the highly contaminated soils with the 0.5% and 1% MBPH applications. The application of MBPH significantly alleviated Cd toxicity by increasing soil solution pH, dissolved organic carbon (DOC), and potassium (K) and decreasing free Cd and the bioavailability of rhizosphere soil Cd, as reflected by promoting rice plant growth, photosynthesis, Fv/Fm, and antioxidant enzymes activities. Additionally, high dose applications (0.5% and 1%) of MBPH significantly reduced the translocation factor of Cd from flag leaf to brown rice. Furthermore, the application of MBPH enhanced the accumulation of mineral elements (iron, manganese, copper, zinc, potassium) in brown rice. Stepwise regression analysis revealed that soil solution K at maturity stage and soil solution DOC at tillering and filling stages were the most important factors affecting Cd accumulation in brown rice under slightly, moderately, and highly Cd-contaminated soils, respectively. Therefore, MBPH application on slightly and moderately Cd-contaminated alkaline soils contributed to achieving rice grains rich with mineral elements but Cd free and Cd safe in highly Cd-contaminated soil.

Graphical Abstract

1. Introduction

Cadmium (Cd) is recognized as a priority contaminant due to its high biological toxicity [1]. Agricultural products and public health are threatened by Cd accumulation in farmland soil and biomagnification in the food chain [2]. If there is excessive accumulation, Cd toxicity can reduce the uptake of nutrients by crops, disrupt the normal physiology of plant metabolism, and cause destructive damage to most organ systems of the human body [3,4]. Rice (Oryza sativa L.) is a staple food for many people worldwide [5]. However, rice has been shown to serve as the source most associated with human Cd intake globally [6]. Moreover, the results of large-scale surveys in many countries, such as China [7], Korea [8], Japan [9], Tanzania [10], and Thailand [11], showed that Cd exceeded the standard in varying degrees in the rice grain samples investigated. Thus, it is imperative to develop efficient strategies for reducing Cd activity and migration in soil, reducing Cd accumulation in rice, and ensuring food safety.
In situ immobilization and stabilization of soil remediation with soil amendment is an economically and ecologically friendly technology for remediating soil contaminated with Cd [12,13]. To meet the needs of green development and safe circulation, it is necessary to seek non-polluting, low-impact, and biodegradable heavy-metal-contaminated soil amendments. Humic acid is a macromolecular compound abundant in oxygen-containing functional groups, created by the chemical and microbial degradation of dead biota in soil, water, and sediments [14,15]. As an important component of humus, humic acid is a cost-effective and safe treatment that is essential for immobilizing metal contaminants [16]. According to previous studies, humic acid could influence the form and availability of heavy metals by modifying soil properties. For example, Khan et al. [17] found that applying humic acid to acidic and neutral soils could effectively lower the bioavailability of soil Cd by the significant increase in pH, as well as the Cd content in Brassica rapa ssp. chinensis L. (pak choi). Additionally, soil microaggregates could have less exchangeable Cd due to humic acid [18]. With the participation of functional groups, humic acids could form Cd2+ humus complexes through complexation or precipitation, reducing the Cd activity, therefore, affecting plant Cd accumulation [19]. Rashid et al. [20] reported that humic acid in soil could promote the formation of Cd2+ humus complexes, improve the growth performance of Cd-tolerant wheat cultivars, and reduce Cd accumulation in wheat. In contrast, humic acid significantly increased Cd availability and Cd uptake by the sorghum in sandy soils [21]. Although some research has been performed on the effects of humic acid on Cd availability, the differences caused by the humic acid source, plant species, and soil properties are still controversial.
Weathered coal, lignite, and peat are high in humic acid, but their traditional utilization methods (fuel and energy production) have drawbacks such as inefficient utilization and high environmental costs [22,23,24]. Mineral humic acid salt is produced by an innovative alkaline extraction process [25], which realizes the clean development and high value-added utilization of weathered coal, lignite, and peat resources. The Standardization Technical Committee of the China Humic Acid Industry Association proposed that mineral-based potassium humate (MBPH) is a water-soluble potassium humate prepared by reacting with potassium oxide from weathered coal, lignite, and peat rich in humic acid (T/CHAIA 4-2018). Previous studies showed that the addition of potassium humate made from lignite increased the levels of Cu and Fe in the aerial part of Carpobrotus aequilaterus and significantly decreased the levels of aluminum and arsenic in rapeseed [26,27]. The application of 1% (w/w) unaged potassium humate (balanced for 7 days) made from woody peat significantly reduced rice grain Cd on highly Cd-contaminated soil [28]. It had been confirmed that humic acid derivatives from mineral sources have a stronger immobilization effect on Cd than humic acid derivatives from biological sources [29]. However, the effects of MBPH on soils with varying levels of Cd contamination, particularly alkaline paddy soils, remain unidentified.
Therefore, a pot experiment was performed to test the modulation of MBPH on Cd absorption and translocation in rice with varying rates of recombinant MBPH applied at different Cd contamination levels (slightly, moderately, and high-Cd contaminated) in an attempt to eliminate the above-mentioned research gaps. The objective of this study involves exploring the effects of MBPH amendments on the rice growth, bioavailability of soil Cd, and Cd accumulation in various organs of rice under three levels of Cd-contaminated alkaline soils. Moreover, the research aims to evaluate the effect of the amendment on the physicochemical properties of soil solutions, photosynthesis, and anti-oxidant enzymes. It also aims to estimate the important contributing factors on Cd accumulation in brown rice at each soil Cd contamination level.

2. Materials and Methods

2.1. Soil Sampling and Characterization of Mineral-Based Potassium Humate

Topsoil (0–20 cm) samples was collected from Yutai County, Jining City, Shandong Province, China, which is a typical alkaline paddy field in the Huang-Huai-Hai Plain of China. The collected soil samples were air-dried, ground, and passed through a 2 mm nylon sieve prior to further analysis. The basic physicochemical characteristics of soils were as follows: pH 7.90, electrical conductivity 7.59 mS cm−1, soil organic matter 34.61 g kg−1, total Cd concentration 0.32 mg kg−1, available K 251.68 mg kg−1, available phosphorus 62.17 mg kg−1, and alkali-hydrolyzable nitrogen 143.00 mg kg−1. The MBPH used in this study was purchased from Ningxia Xingyuan Biotechnology Co., LTD of China in the shape of a black solid particle with its humic acid ≥ 65%, solubility in water ≥ 98%, potassium (as K2O dry matter) ≥ 10%, pH 10.54 ± 0.015, electrical conductivity 2.76 ± 0.012 mS cm−1, and total Cd 0.05 ± 0.00067 mg kg−1. To determine the surface morphology and elemental composition, a field emission scanning electron microscope (SEM, FEI, Quanta 250 FEG, USA) with an energy-dispersive spectrometer was employed. Attenuated total reflectance-Fourier transform infrared (ATR-FTIR, Thermo Fisher Scientific, Nicolet 6700, Waltham, MA, USA) was employed to examine functional groups of MBPH. The results of the SEM, EDS, and ATR-FTIR analyses of the MBPH were presented in Figure 1. The SEM results demonstrated that the surface of the MBPH had clear gaps and many aggregates with a porous structure (Figure 1A,B). MBPH consisted of large quantities of C and O (76.68%), small quantities of Na, Al, Si, Cl, and Ca (10.84% in total), and K accounted for 12.48% in the MBPH (Figure 1C). FTIR results showed that functional groups, including O-H, -COOH, C-O, and organic matter were enriched in MBPH (Figure 1D, Table S1).

2.2. Pot Experiments

2.2.1. Experimental Design

The pot experiment was carried out in a greenhouse located at the Qingdao Campus of Shandong University, China in 2021. There were twelve treatments, including three Cd rates (1, 2, and 4 mg kg−1, as CdSO4·8/3H2O) [30] and four MBPH application levels (0% (CK), 0.25%, 0.5%, and 1%, w/w). Three replicates were designed for each treatment, and a total of 36 pots were performed upon. According to the soil environmental quality standards (GB 15618-2018) and the single factor pollution index judgment, the Cd concentration of potted soil represents slightly (S-Cd), moderately (M-Cd), and highly (H-Cd) contaminated soil, respectively [31]. Then, each plastic pot (height of 36 cm, top diameter of 24 cm, bottom diameter of 21 cm) was filled with 6.0 kg of well air-dried soil. CH4N2O, (NH4)3PO4·3H2O, and K2SO4 were provided as the ground fertilizers at 72 mg N kg−1, 29.33 mg P2O5 kg−1, and 27 mg K2O kg−1 soil, respectively. Urea fertilizer (CH4N2O, 46 mg N kg−1 soil) was applied 15 days after the transplanting and tillering stage to supplement growth requirements. Meanwhile, MBPH was added, properly mixed, and submerged with water 2–3 cm above the soil surface for 30 days, based on the treatment [32]. Seven days after the rice seedlings were transplanted, rhizome soil moisture samplers (MOM, 19.21.21F, Rhizon, Wageningen, The Netherlands) were vertically inserted in the center of the pot to a depth of 10 cm below the soil surface.

2.2.2. Rice Cultivation

A conventional Japonica rice cultivar planted in Huang-Huai-Hai Plain, Zhongdao 1, which was identified as a high-Cd accumulation cultivar in our previous study [33], was selected. We used 30% hydrogen peroxide to sterilize the surface of the selected plump seeds for 15 min, followed by a distilled water wash and a 48-h soak in water at 25 °C. The soaked seeds were germinated in a dark incubator at 28 °C. The germinated seeds were buried 0.5 cm deep in the prepared nutritional soil. Three uniformly growing rice seedlings were transferred into each pot after 35 days of growth. The soil was kept inundated with water that was 2–3 cm deep throughout the growth phase (154 days). Rice was grown in an artificial greenhouse with a relative humidity ranging from 60 to 70%, temperatures between 25 and 30 °C on average, and controlled lighting with fluorescence lights following a 14 h/10 h light/dark cycles.

2.3. Collection and Analysis of Soil Solution

Rhizome soil solution samplers were used to collect about 20 mL of soil pore water at the tillering stage, filling stage, and maturity stage, respectively. The pH values were determined in the laboratory with a pH meter (PHS-2F, Shanghai INESA, Shanghai, China). A 0.45 μm polyethersulfone filter was used to filter soil solution samples. Dissolved organic carbon (DOC) was determined after removing inorganic carbon by acidifying (pH < 3) the appropriate sample with 1 M HCl [34]. DOC was measured by the dual-wavelength ultraviolet spectrophotometer method (L5S, Shanghai Yidian Analytical Instrument Co., Ltd., Shanghai, China). The relative content of DOC was calculated after measuring the soil solution’s absorbance at two wavelengths (270 nm and 350 nm) [35]. In addition, the total Cd and total potassium (K) were determined by a flame atomic absorption spectrophotometer (iCE 3500, Thermo Fisher Scientific, America) after an appropriate amount of concentrated nitric acid was added to approximately 5 mL of soil solution samples.

2.4. Measurement of SPAD Value, Photosynthetic Ability, and Chlorophyll Fluorescence Parameter

The photosynthetic rate and soil and plant analysis development (SPAD) values of the rice leaves were assessed at the tillering stage (the upper third leaf), filling stage (flag leaves), and maturity stage (flag leaves). The net photosynthetic rate (Pn, µmol mol−1), transpiration rate (Tr, µmol mol−1), substomatal CO2 concentration (Ci, mol m−2 s−1), and stomatal conductance (gs, mol m−2 s−1) were determined by a portable photosynthesis measurement system (Li-6800, Li-Cor, Lincoln, NE, USA) of the same leaves. In the leaf chamber, the following atmospheric conditions prevailed: the photon flow density through red and blue light was 100 μmol m−2 s−2, the CO2 concentration was 400 μmol mol−1, the leaf temperature was 25 °C, and the relative humidity was around 50%. Between 9:00 and 11:00 am, the aforementioned measurements were made. SPAD values were measured by a portable chlorophyll meter (SPAD-502 Plus, Japan). A fluorometer (PAM-2500, Walz, Efeltrich, Germany) was used to assess changes in a fundamental indicator of plant photosynthetic activity [36], namely, the maximum photochemical efficiency (Fv/Fm) of PS II. Since Fv/Fm is susceptible to environmental stress, it can reflect physiologic alterations in stressful situations [37]. To determine the antioxidant enzyme activity, measured leaves were collected at the tillering stage, first frozen utilizing liquid nitrogen, and then kept in the refrigerator at −80 °C.

2.5. Antioxidant Enzyme Assays

Rapid grinding of leaf samples in liquid nitrogen occurred, and the ground powder sample was weighed (0.25 g) and added to 9 mL of pre-cooled 0.1M phosphate buffer (pH 7.4). After mixing with a vortex mixer (MIULAB MIX-25P), centrifugation was performed at 3500 rpm at 4 °C for 10 min. To ascertain the level of enzyme activity, the supernatant was collected. Employing test kits, the activities of superoxide dismutase (SOD), peroxidase (POD), and catalase (CAT) were assessed (A001-3, A084-3-1, A007-1-1, Nanjing Jiancheng Bioengineering Institute, Nanjing, China). The absorbance of SOD, POD, and CAT were detected at 450 nm, 420 nm, and 405 nm, respectively, using an enzyme-labeled instrument (TECAN Infinite 200 PRO). Antioxidant enzyme activities were estimated following the instructions provided by the manufacturer of the kits.

2.6. Plant Harvest, Soil Sample Collection, and Measurement of Agronomic Traits

The plant height (PH), spike length (SL), and thousand kernel weight (TKW) of the rice were recorded at the maturity stage. Rice plant samples were separated into roots, stems, ordinary leaves, flag leaves, and grains. All samples were rinsed carefully with distilled water, deactivated at 105 °C for 15 min, and dried at 65 °C to a constant weight. The dry weights of roots (RDW), stems (SDW), ordinary leaves (OLDW), and flag leaves (FLDW) were measured. Hulling of rice grains using a hulling machine (TP-JLG-2018, Zhejiang Tuopu yunnong Technology Co., Ltd., Hangzhou, China) to obtain brown rice samples. All parts were ground for the subsequent determination. Soil adhering to the root surface was collected as a rhizosphere soil sample [38]. The rhizosphere soil was naturally dried, ground with ceramic mortar, and passed through a 2 mm nylon sieve to determine the soil’s available Cd.

2.7. Determination of Cd and Mineral Elements in Rice Organs

The plant sample was digested with HNO3-HClO4 (9:1 v/v) (GB 5009.15-2014) in an automatic digester (GD60S, APL, Beijing Pulitai Technology Instrument Co., Ltd, Beijing, China). The Cd concentration in the rice organs and the mineral elements contents (Iron (Fe), Manganese (Mn), Copper (Cu), Zinc (Zn), K) in the digested solution were determined by a flame atomic absorption spectrophotometer (iCE 3500, Thermo Fisher Scientific, Waltham, USA). Certified reference materials (GBW (E) 100378, and GBW10046) and blank specimens were included in the experimental procedure to ensure the reliability of the digestion method and the accuracy of the analysis. The determined results of all studied metals were within the certified range.

2.8. Soil Available Cd and ATR-FTIR Spectroscopic Analyses of Rhizosphere Soil

The soil availability of Cd (DTPA-Cd) was extracted with a DTPA solution (GB/T 23739-2009) and determined by a flame atomic absorption spectrophotometer (iCE 3500, Thermo Fisher Scientific, Waltham, MA, USA). The ATR-FTIR measurements of the rhizosphere soil were recorded using a Thermo Nicolet 6700 FTIR (Thermo Fisher Scientific, Nicolet 6700, Waltham, MA, USA) spectrometer outfitted with a mid-infrared liquid nitrogen-cooled MCT-A detector. The spectral range was 400–4000 cm−1 with a resolution of 4 cm−1 and 65 scans. The wavelength was standardized, and the baseline was adjusted by the OMNIC 8.2.0.387 software (Thermo Scientific, Waltham, MA, USA).

2.9. Data Analysis

Experimental data were arranged for statistical analysis employing Excel 2019 (Microsoft, Redmond, WA, USA) and SPSS Statistics 27 (IBM, Armonk, NY, USA). The Duncan test and Kruskal–Wallis test were utilized as parametric and non-parametric methods, respectively, to compare the disparity of indicators (growth characteristics, soil solution chemistry, photosynthetic and chlorophyll fluorescence characteristics, the enzyme activity of leaves, minerals in brown rice, Cd concentrations in various rice organs, translocation factors (TFs) between different rice organs, and soil DTPA-Cd among different categories with a significance level of p < 0.05. Correlations between brown rice Cd and the studied indicators were analyzed using the Spearman correlation tests in SPSS Statistics 27 (IBM, Armonk, NY, USA) and the R—4.2.2 software. Figures were drawn using Origin 2018, the R—4.2.2 software, and Adobe Illustrator CS6.
TFs were estimated by the following [39]:
TF root - stem = C stem / C root
TF stem - ordinary   leaf = C ordinary   leaf / C stem
TF stem - flag   leaf = C flag   leaf / C stem
TF stem - brown   rice = C brown   rice / C stem
TF ordinary   leaf - brown   rice = C brown   rice / C ordinary   leaf
TF flag   leaf - brown   rice = C brown   rice / C flag   leaf
where C (mg kg−1) is the Cd concentration in the root, stem, ordinary leaf, flag leaf, and brown rice.

3. Results

3.1. Growth Responses of Rice

The rice demonstrated various growth responses to MBPH under different Cd-contaminated levels. The eight agronomic traits of rice were exhibited in Table S2. For S-Cd soils, compared with no MBPH application (CK), application of MBPH (0.25%, 0.5%, and 1%) to the soil significantly increased the SL Cd by 9.03%, 7.26%, and 12.53%, respectively. The TKW significantly increased by 10.2% at 1% MBPH, respectively, whereas the SDW, ADMA, and RDW significantly increased by 22.9%, 25.0%, and 36.2%, respectively, at 0.5% MBPH. For M-Cd soils, application of 0.5 and 1.0% MBPH significantly enhanced the SDW by 24.4% and 27.1%, and the RDW increased by 26.7% and 27.7%, respectively, compared with the CK, while the SL, TKW, and FLDW presented no differences among different MBPH levels. In addition, applying 1% MBPH to the soil significantly increased the ADMA by 23.8% compared with the CK. For H-Cd soils, the SL significantly increased by 12.09% at 0.25% MBPH and by 10.31% at 0.5% MBPH. The SDW and ADMA significantly increased by 16.4% and 9.6%, respectively, with the addition of 0.5% MBPH, whereas the application of 1% MBPH enhanced the SDW by 24.8%, ADMA by 19.3%, and RDW by 22.7%, respectively, compared with the CK. However, there was no difference in the PH and OLDW of rice among S-Cd, M-Cd, and H-Cd soils regardless of MBPH levels (Table S2). At the same MBPH application level, rice growth was more promoted in the S-Cd and M-Cd soils (Table S2).

3.2. Effect on Soil Solution Chemistry

3.2.1. Change in Soil Solution pH

Different contaminated soils displayed different period features in the alterations to the soil solution pH (Figure S1A–C). When MBPH was not applied, the soil solution pH was kept at around 7.8–8.0 throughout the growth period of rice. For S-Cd soils, the treatments of 0.5% MBPH and 1% MBPH significantly increased the soil solution pH by 0.15 and 0.23 units, respectively, during the filling stage compared to CK (Figure S1A). For M-Cd soils, the pH with 0.25% MBPH and 0.5% MBPH was 0.36 and 0.33 units higher than the CK in the filling stage, respectively. At the maturity stage, the application of MBPH (0.5% and 1%) significantly increased the pH of the soil solution by 0.48 and 0.55 units, respectively, compared with the CK (Figure S1B). For H-Cd soils, the application of MBPH affected the soil solution pH in three typical growth stages of rice. At the tillering stage, supplementing the soil with 0.5%, MBPH significantly increased the soil solution pH by 0.15 units as compared to unamended soil (Figure S1C). Soil solution pH significantly increased with the increase in the MBPH addition at the filling and maturity stages.

3.2.2. Change in Soil Solution DOC

Soil solution DOC generally increased with the addition of MBPH (Figure S1D–F). The soil solution DOC of each treatment followed a pattern of increasing followed by decreasing with the growth of rice. In comparison to the tillering and maturity stages, the filling stage showed a higher DOC concentration. For S-Cd soils, compared with the CK, the addition of 0.5% and 1% MBPH significantly increased the soil solution DOC in all studied growth periods, and the addition of 0.25% MBPH significantly increased the DOC content in the soil solution at the filling stage (Figure S1D). For M-Cd soils, 0.5% and 1% MBPH applications also significantly increased the DOC at all stages, except for the 0.5% MBPH application at the maturity stage. Meanwhile, DOC was significantly reduced after applying the 0.25% MBPH treatment compared to the CK treatment at tillering stage (Figure S1E). For H-Cd soils, 0.5% and 1% MBPH applications significantly increased the DOC at tillering and all stages, respectively, compared with CK. However, the DOC concentration in the soil solution in the H-Cd soils was unaffected by the addition of 0.25% MBPH (Figure S1F).

3.2.3. Change in Soil Solution K and Cd

Regardless of soil Cd levels, soil solution K generally appeared to increase alongside MBHP levels at the three stages (Figure S1G–I). The highest levels of total K were observed in the soil solution during the filling stage, where they ranged from 16.52 to 58.52 (S-Cd), 13.64 to 45.22 (M-Cd), and 12.95 to 34.35 (H-Cd) mg L−1 for all treatments, respectively. The minimum value was reached at the maturity stage. For all three soil Cd levels, the highest soil solution K appeared at 1% MBHP during any stage of growth.
For S-Cd soils, soil solution Cd could not be detected throughout the entire rice growth cycle. Only within the tillering stage could soil solution Cd be detected for M-Cd and H-Cd soils (Figure 2). For M-Cd soils, application of MBPH (0.25%, 0.5%, and 1%) to the soil significantly decreased the soil solution Cd by 64.5%, 61.9%, and 86.5%, respectively, compared with the CK. For H-Cd soils, application of MBPH (0.25%, 0.5%, and 1%) significantly decreased the soil solution Cd by 16.6%, 51.0%, and 83.5%, respectively, compared with the CK, and significant differences were reached among MBPH levels. The impact of M-Cd soils on Cd reduction in soil solution was significantly superior to that of H-Cd soils at the same MBPH treatment dosage (Figure 2).

3.3. Photosynthetic Parameters, SPAD, and Chlorophyll Fluorescence of Rice Leaves

The photosynthetic parameters Pn, Tr, Ci, gs, and SPAD of the rice leaves at three growth stages under different concentrations of Cd are displayed in Table S3. For S-Cd soils, the application of 0.5% and 1% MBPH significantly increased the value of Pn by 23.4% and 18.7%, respectively, at the tillering stage. Except for the 0.25% MBPH at the tillering stage, the MBPH application increased the value of SPAD at all stages. For M-Cd soils, the application of MBPH, especially in the 0.25% MBPH treatment group, mainly increased the Pn, Tr, gs, and SPAD values at the filling stage and maturity stage. Under H-Cd soils, the addition of MBPH was effective in improving the photosynthetic characteristics of rice at the tillering and maturity stages. Comprehensively, the effect of the 0.25% application on MBPH was more prominent. It significantly increased the Pn by 44.5% and 256.5%, and the Tr by 45.3% and 528.8% at the tillering stage and maturity stage, respectively. In addition, it also significantly increased the Ci by 37.9% at maturity, gs by 74.3% at the tillering stage, and gs by 535.3% at the maturity stage, respectively. The SPAD values increased significantly at all stages after the treatment of MBPH, and the changing trend was the same at the tillering and maturity stages, i.e., the SPAD values gradually increased relative to CK with an increase in MBPH application. The application of the same dose of MBPH was more effective in increasing SPAD for each growth period in the S-Cd soils than in the M-Cd and H-Cd soils.
The chlorophyll fluorescence parameter Fv/Fm of rice leaves at three growth stages under different concentrations of Cd is shown in Table S3. Cd stress reduced the value of Fv/Fm in rice leaves. The effect of MBPH on the Fv/Fm value of rice leaves in the S-Cd and M-Cd soils was mainly reflected in the tillering stage and filling stage. The application of MBPH (0.25%, 0.5%, 1%) to S-Cd soils significantly increased the Fv/Fm by 3.93%, 5.68%, and 4.19% at tillering stage, while application of 1% MBPH increased the Fv/Fm by 4.83% at the filling stage. For M-Cd soils, the application of MBPH significantly increased Fv/Fm by 12.1–15.5% at tillering stage and 8.87–11.2% at the filling stage compared to CK. For H-Cd soils, the influence of MBPH on Fv/Fm value was mainly reflected in the filling and maturity stages, which were significantly increased by 8.10–12.6% and 42.7–63.0%, respectively. The influence of the same MBPH application dosage on the Fv/Fm of rice leaves growing on soils with different levels of Cd contamination was mainly observed at the filling stage, and the Fv/Fm possessed the greatest elevation in the M-Cd soils.

3.4. Rice Leaves Antioxidant Enzyme Activities

The activities of the antioxidant enzymes SOD, POD, and CAT were measured in rice leaves at the tillering stage and shown in Figure S2. The enzyme activities of rice leaves at the tillering stage all demonstrated a decreasing trend with an increase in soil Cd level. Leaf SOD activity for the S-Cd soils was significantly enhanced by 8.17% with a 0.5% MBPH application (Figure S2A). MBPH application treatments significantly increased the activity of SOD by 18.5% (0.25% MBPH), 11.4% (0.5% MBPH), and 5.02% (1% MBPH) in the H-Cd soils (Figure S2A), respectively. The application of MBPH (0.25%, 0.5%, and 1%) significantly increased POD activity in rice leaves by 18.4%–24.7% under S-Cd soils, and the enhancement effect was consistent among the three application levels; similar rules were also reflected in the H-Cd soils (37.1–41.4%) (Figure S2B). For M-Cd soils, all three levels of MBPH significantly increased POD activity in leaves (Figure S2B). Leaf CAT activity was significantly enhanced with the 0.25% and 0.5% MBPH applications for S-Cd soils by 47.8% and 18.5%, respectively (Figure S2C). However, a high dose of MBPH (1%) aggravated the negative effect on CAT activity in rice leaves under S-Cd soils (Figure S2C). The application of MBPH (0.25%, 0.5%, and 1%) significantly increased CAT activity by 37.5–44.7% under M-Cd soils and by 89.5–162% under M-Cd soils in rice leaves, respectively (Figure S2C). It seems that applying MBPH, especially 0.5% MBPH, to H-Cd soils could stimulate CAT activity enhancement in rice leaves. There was no difference in the effect of applying a low dose of MBPH (0.25%) on the enzyme activity of rice leaves on soils with different levels of Cd contamination (Figure S2). The application of high doses of MBPH (0.5% and 1%) was more conducive to increasing the enzyme activity of rice leaves in the S-Cd and H-Cd soils (Figure S2).

3.5. Effects on Mineral Elements of Brown Rice

The ability of brown rice to accumulate mineral elements was significantly reduced by Cd, and the detrimental impact was more pronounced as soil Cd content increased (Figure 3). In general, the addition of MBPH increased the brown rice mineral elements (Figure 3). For S-Cd soils, brown rice Fe and Mn with the 0.25% MBPH treatment were significantly increased by 63.1% and 23.6% over the CK, respectively, while Mn concentration was significantly increased by 16.3% under the 0.5% MBPH treatment (Figure 3A,B). Compared with the CK, applying the amendment (0.25%, 0.5%, and 1%) significantly enhanced the concentrations of Zn by 32.4–62.2% and K by 9.85–19.3% in brown rice in the S-Cd soils (Figure 3D,E). The application of 0.5% and 1% MBPH significantly increased the brown rice Cu in the S-Cd soils by 19.6% and 25.7%, respectively (Figure 3C). For M-Cd soils, the application of MBPH (0.25%, 0.5%, and 1%) significantly increased the brown Fe and Zn rice by 21.5–47.2% and 32.1–42.1%, respectively (Figure 3A,D). Mn and Cu concentrations in the 1% MBPH treatment were significantly increased by 33.9% and 81.6% over the CK, respectively, while the K concentration was significantly increased by 13.0% and 26.9% under the 0.5% and 1% MBPH treatments, respectively (Figure 3B,C,E). For H-Cd soils, the 0.5% MBPH treatment significantly increased Fe and Mn concentrations by 25.6% and 22.7%, respectively, in comparison to the CK (Figure 3A,B). The concentration of Cu was significantly increased by 59.6% under the 1% MBPH treatment, while that of the Zn was significantly increased by 36.3–67.2% under the MBPH treatments (0.25%, 0.5%, and 1%) (Figure 3C,D). The application of 0.5% and 1% MBPH significantly increased the brown rice K in the H-Cd soils by 24.6% and 29.3%, respectively (Figure 3E). The application of low doses of MBPH (0.25%) had been sufficient to achieve enhanced accumulation of brown rice mineral elements, especially Fe, Zn, and K in the S-Cd and M-Cd soils (Figure 3). A high dose of MBPH (1%) did not show an advantage in improving mineral elements accumulating in brown rice in the H-Cd soils but was more favorable to improving mineral elements in brown rice in the M-Cd soils (Figure 3).

3.6. Cadmium Concentrations in Plant Parts and Transport Factors of Cd in Brown Rice

3.6.1. Cd Concentrations in Various Organs of the Plant

The effects of MBPH doses on Cd concentrations in different parts of the plant varied and were associated with soil Cd levels (Figure 4). For S-Cd soils, compared with the CK, application of MBPH (0.25%, 0.5%, and 1%) significantly decreased the roots Cd by 31.9–79.4% and by 36.8–62.1% in ordinary leaves, and 0.5% MBPH and 1% MBPH treatments significantly decreased the stems Cd by 34.2–51.5% and 22.1–53.9% in the flag leaves, respectively (Figure 4A–D). Brown rice Cd was significantly reduced by 46.8%, 56.5%, and 65.0% after the 0.25%, 0.5%, and 1% MBPH treatments, respectively, and significant differences were achieved among treatments (Figure 4E). For M-Cd soils, the Cd in the roots significantly decreased by 56.1% after the 1% MBPH treatment, and Cd in the stems significantly reduced by 36.4% and 45.4% after the 0.5% and 1% MBPH treatments, respectively (Figure 4A,B). The application of MBPH (0.25%, 0.5%, and 1%) significantly decreased the ordinary leaves Cd by 22.2–69.9% and by 27.4–62.9% in flag leaves over the CK (Figure 4C,D). Brown rice Cd significantly reduced by 44.0%, 56.5%, and 59.2% after the 0.25%, 0.5%, and 1% MBPH treatments, respectively, and there was no difference in the reduction effect between 0.5% and 1% MBPH (Figure 4E). For H-Cd soils, compared with the CK, application of MBPH (0.25%, 0.5%, and 1%) significantly decreased the Cd contents by 38.8–80.2% in the roots, 24.6–56.1% in the stems, 8.78–34.1% in the ordinary leaves and 6.36–30.8% in the flag leaves (Figure 4A–D). Brown rice Cd was significantly reduced by 15.8%, 37.7%, and 44.0% after the 0.25%, 0.5%, and 1% MBPH treatments, respectively (Figure 4E). The brown rice Cd upon 0.5% and 1% MBPH treatments were lower than the maximum value allowed in the national standard (0.2 mg kg−1, GB 2762–2017) and there was no difference in the reduction affect between 0.5% and 1% MBPH treatment (Figure 4E).

3.6.2. Transfer Factors of Cd between Different Organs

The impact of MBPH treatment on Cd varied significantly between the different rice organs (Table S4). For S-Cd soils, the addition of 0.5% and 1% MBPH significantly increased the TFroot-stem. Except for 1% MBPH for TFordinary leaf-brown rice, the application of MBPH significantly decreased the TFordinary leaf-brown rice and TFflag leaf-brown rice. Moreover, there was no difference between 0.25% and 0.5% MBPH treatments in reducing TFordinary leaf-brown rice and TFflag leaf-brown rice. For M-Cd soils, the application of MBPH (0.25%, 0.5%, and 1%) significantly decreased TFstem-brown rice over the CK. For H-Cd soils, compared with the CK, except for the effect of 0.25% MBPH treatment on TFroot-stem and TFstem-brown rice, the application of MBPH significantly increased the TFroot-stem, TFstem-ordinary leaf, and TFstem-flag leaf. TFordinary leaf-brown rice and TFflag leaf-brown rice were significantly reduced after the 0.5% and 1% MBPH treatments. The application of a low dose of MBPH (0.25%) was more beneficial in inhibiting the transfer of Cd to the upper organs of rice in the S-Cd soils (Table S4). The high doses of MBPH 0.5 and 1% were more conducive to inhibiting the transfer of Cd from stems to ordinary leaves, flag leaves, and brown rice in the M-Cd soils and from ordinary leaves and flag leaves to brown rice in the H-Cd soils, respectively (Table S4).

3.7. Effect on Soil Available Cd of the Rhizosphere Soil

As illustrated in Figure 5, the soil DTPA-Cd of rhizosphere soil at the maturity stage of the rice at all contaminated levels significantly decreased upon MBPH application. For S-Cd soils, soil DTPA-Cd was significantly reduced with MBPH (0.25%, 0.5%, 1%) addition by 28.4–46.9%, while there was no difference among MBPH levels for soil DTPA-Cd. Similarly, for M-Cd soils, the rhizosphere soil DTPA-Cd significantly decreased with MBPH (0.25%, 0.5%, 1%) addition by 9.42–48.4%, while the reduction effect of 0.5% and 1% treatment was better than that of 0.25%. For H-Cd soils, the rhizosphere soil DTPA-Cd significantly decreased with increasing MBPH levels compared with CK by 19.9–73.0%, while it reached a significant difference in soil DTPA-extractable Cd among MBPH levels. The low dose application of MBPH (0.25%) was significantly more effective in reducing the DTPA-Cd of the rhizosphere soil in the S-Cd soils than in the M-Cd and H-Cd soils (Figure 5). In the M-Cd and H-Cd soils, high doses of MBPH (0.5% and 1%) did not affect reducing DTPA-Cd in the rhizosphere soil (Figure 5).

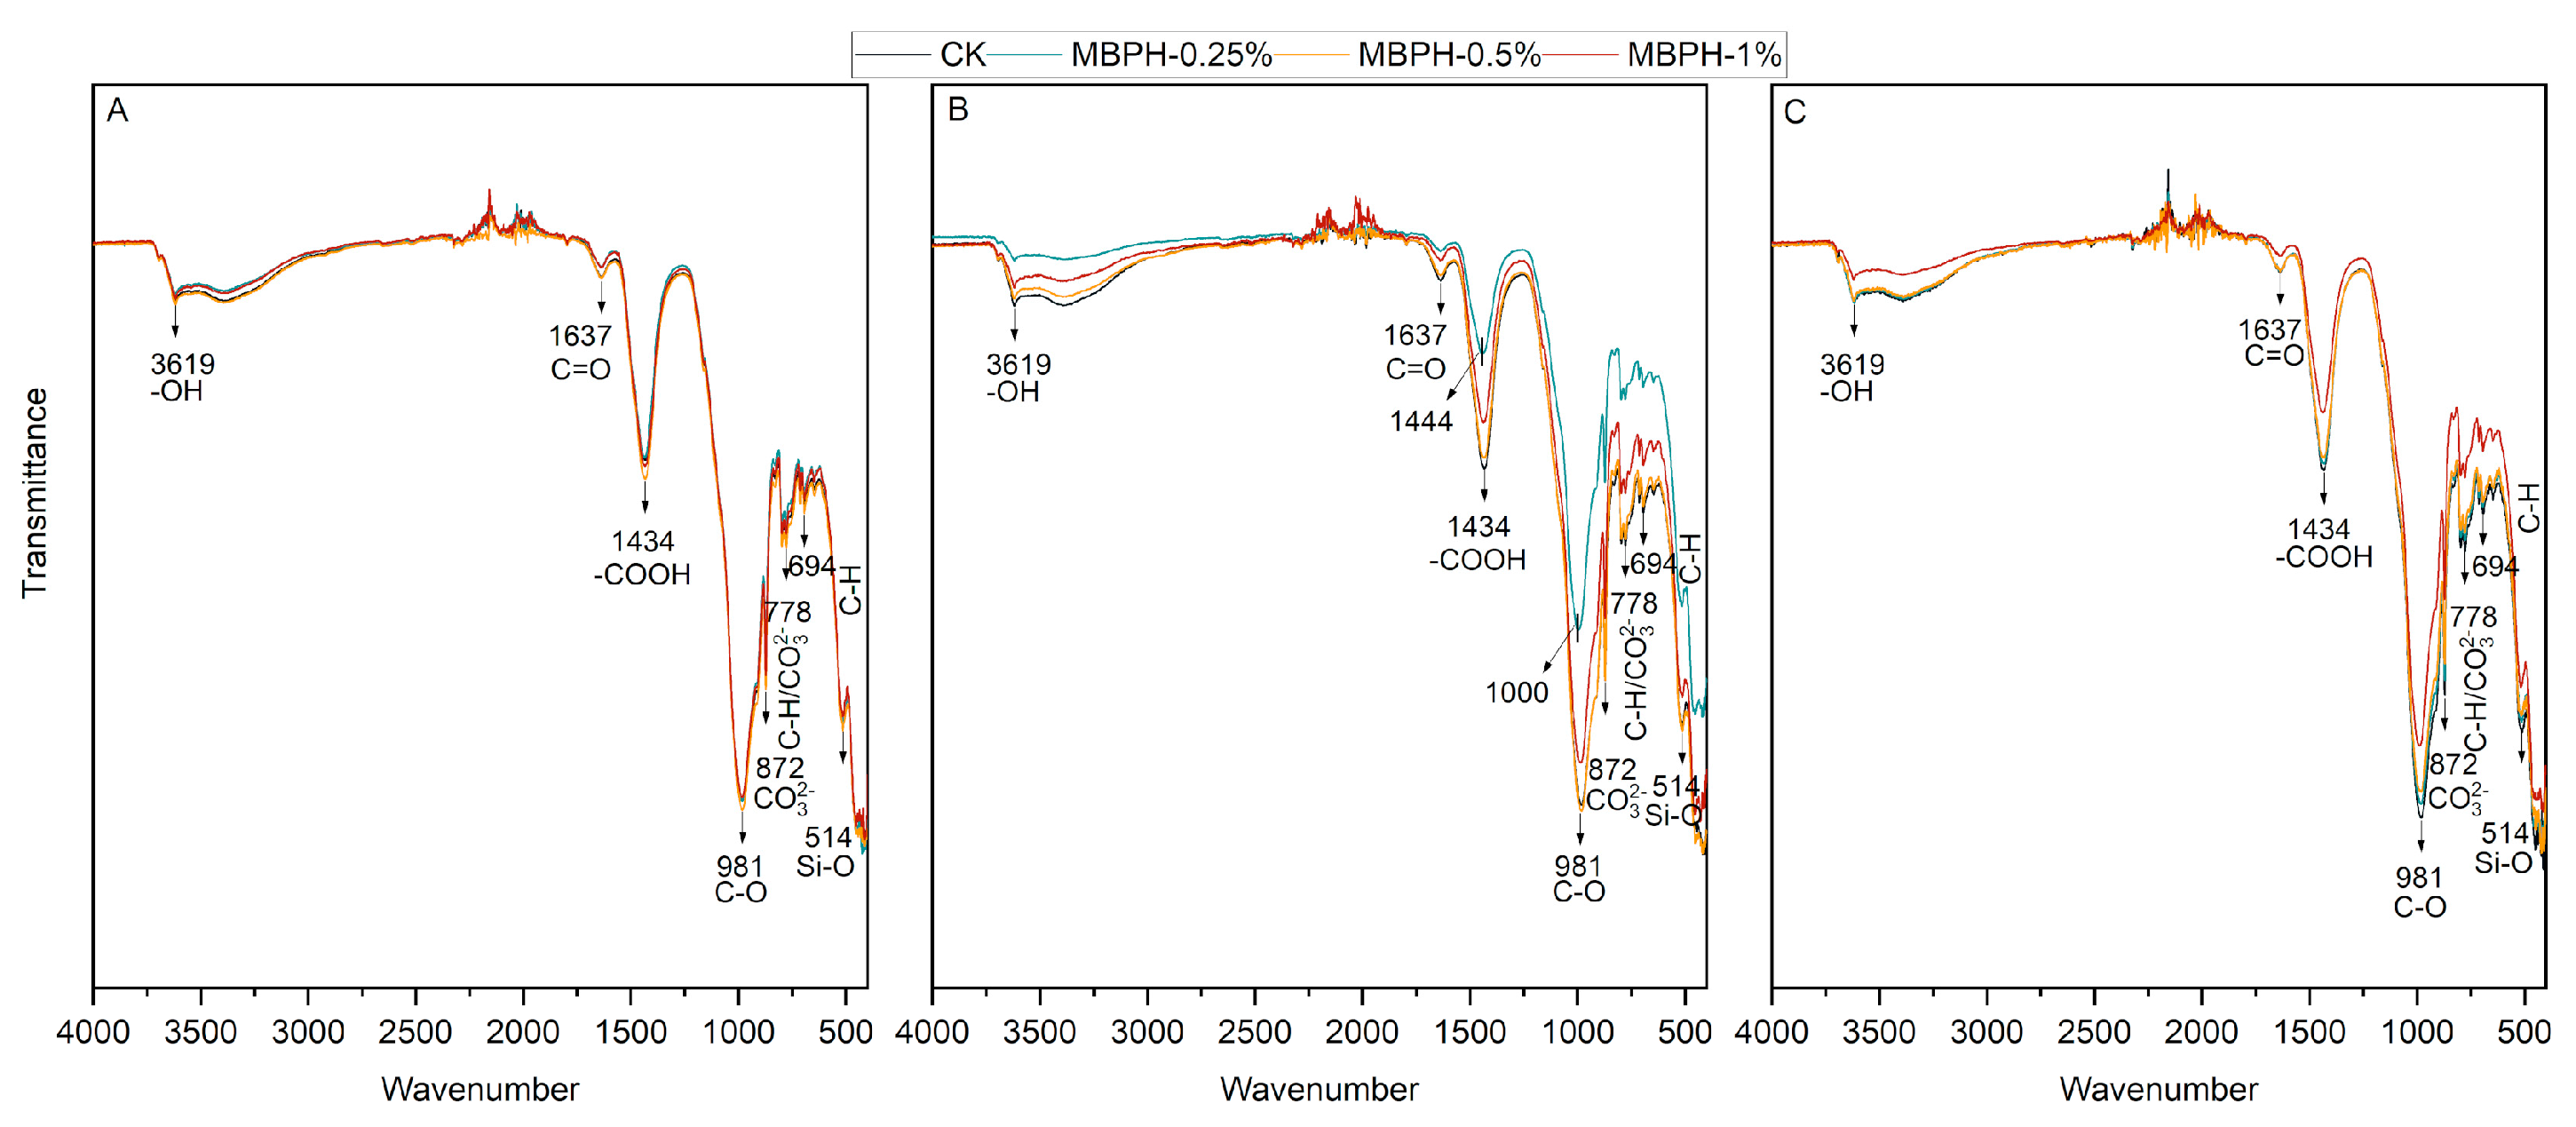
3.8. FTIR Spectra Analysis of the Rhizosphere Soil

To investigate the effects of MBPH on the major chemical function of the rhizosphere soil, FTIR spectrometry was performed (Figure 6). More information on the peaks was presented in Table S1. The results demonstrated that the application of MBPH on soils with different levels of Cd contamination did not affect the types of functional groups in the soil; however, it changed the intensity of some peaks. The infrared spectrum at the 3619 cm−1 and 1639 cm−1 peaks were the absorption peaks of the -OH in clay and C=O stretching vibration of the aromatic series. The peaks were observed at 1434 cm−1, 980 cm−1, 872 cm−1, and 778 cm−1, reflecting the stretching vibration of -COOH in carboxylate, C-O in cellulose, CO32− and CO32− or C-H, respectively. The peak values at 694 cm−1 and 514 cm−1 corresponded to C-H groups in the aromatic series and Si-O bending vibration. No significant changes were found in the FTIR spectra of the rhizosphere soil under the S-Cd soils in the presence of MBPH (Figure 6A). A higher transmittance of -OH, -COOH, C-O, and CO32− groups was observed under the action of MBPH in the M-Cd and H-Cd soils, and this alteration was more pronounced under M-Cd soils. In particular, the peaks at 1434 (-COOH) and 981 (C-O) cm−1 shifted to 1444 and 1000 cm−1, respectively, under the M-Cd soils.

3.9. Stepwise Regression Analysis

Many factors can influence the accumulation of Cd in brown rice. The present study investigated the key factors affecting the accumulation of brown rice Cd under different levels of Cd contamination by considering a total of 43 indicators, including soil solution chemistry, minerals in brown rice, photosynthetic and chlorophyll fluorescence characteristics, the enzyme activity of leaves, and soil DTPA-Cd. Quantities of 19, 19, 27, and 26 indicators were significantly positively or negatively correlated with brown rice Cd under the S-Cd, M-Cd, H-Cd soils and all data, respectively (Tables S5–S8). Based on the preferred associations between selected indicators and brown rice Cd, suitable multivariate equations can be established to quantify the contribution of specific parameters to brown rice Cd. The logarithm of the Cd content in brown rice was used as the dependent variable, and the logarithm of corresponding selected indicators was used as an independent variable to build a multiple linear regression model. The results of stepwise multiple linear regression analyses were presented in Table 1. All of the p values were less than 0.001, and the coefficients of determination (R2adj) of the models were greater than 0.9; this indicated that each equation was well adapted to comprehend and clarify the influence of parameters on brown rice Cd under specific contamination conditions (Table 1, (1)–(3)). The weight of the absolute value of the coefficient was used to evaluate the contribution rate of the parameter, and the results showed that the MK (56.90%) for S-Cd soils, the TDOC (93.37%) for M-Cd soils, and the FDOC (69.9%) for H-Cd soils could be identified as the factor with the highest contribution affecting brown rice Cd, respectively. All the data were integrated into the model (4). To examine the correlation between the logarithm of measured values and predicted values calculated from equations for brown rice Cd, scatter plots were developed (Figure S3). The results showed that most predicted values were consistent with the measured brown rice Cd, indicating that the respective models based on specific parameters accurately predict the brown rice Cd.

4. Discussion

4.1. Effects of Soil Solution Chemistry Characteristics on Brown Rice Cd

Cd in soil solutions and the DTPA-Cd can be used to assess soil Cd biological activity [40]. The Cd in the soil solution (Figure 2) and the DTPA-Cd (Figure 5) were significantly reduced by the MBPH treatments. The pH significantly affects the soil Cd phytoavailability. The application of MBPH significantly increased the soil solution pH in different growth periods (Figure S1A–C), and the key factor contributing to the increase in soil solution pH was the alkaline characteristic of MBPH [41]. Soil solution pH was negatively correlated with DTPA-Cd, regardless of the growth period or Cd level, and reached significant levels at the filling or maturity stage (Tables S5–S8). Similar findings were reported by Huang et al. [42]. With increasing soil pH, there were more OH- ions and negatively charged ions on the soil’s surface, which encouraged Cd adsorption and Cd precipitation formation [12], decreasing the soil solution Cd (Figure 2).
The bioavailability of heavy metals in the soil system can also be impacted by DOC. MBPH application generally increased the soil solution DOC during the growth stages studied in rice (Figure S1D–F). The release of polysaccharide and peptide fractions in MBPH forms macromolecular DOC [43], which is perhaps the main reason for the elevated soil solution DOC. In addition, it was shown that an increase in soil pH leads to a deprotonation process of weakly acidic functional groups in DOC molecules, which will increase the surface charge density and hydrophilicity of soil DOC molecules, thus, promoting the dissolution of soil DOC [44]. The DOC in soil solutions positively or significantly positively correlated with pH (Tables S5–S8), which was also confirmed in the study by Song et al. [45]. The macromolecular DOC is easily absorbed by the soil, which indicates the formation of new adsorption sites in the soil and changes the charged soil properties, thus, improving the soil’s ability to absorb heavy metals [46,47]. In this study, DOC demonstrated a negative or significantly negative correlation with soil DTPA-Cd and brown rice Cd at either soil Cd level (Tables S5–S8). This suggested that the elevation of DOC brought on by the application of MBPH reduced the availability of soil Cd and the accumulation of brown rice Cd. MBPH application increased the concentration of soil solution DOC (Figure S1D–F), and DOC was the main factor affecting Cd uptake in brown rice in the M-Cd and H-Cd soils through the process of influencing the soil Cd bioavailability (Table 1).
Potassium (K) is essential for the translocation and storage of assimilates, the activation of enzyme systems, fueling photosynthesis, regulating the photosynthetic stomata and substance transport, and protein synthesis in plants [48]. The application of MBPH significantly increased the soil solution K of rice (Figure S1G–I) and the correlation analysis showed a significant negative correlation between brown rice Cd and soil solution K (Tables S5–S8). This indicates that the increase in soil solution K in this study helped rice reduce Cd uptake, which was consistent with the result of Wang et al. [49]. Compared to the weak competition between K+ and Cd2+, the alleviation of Cd toxicity in K-supplemented plants was mainly attributed to increased antioxidant enzyme activity, photosynthesis, and chlorophyll fluorescence [50,51]. The significant positive correlations of K in a soil solution with photosynthetic characteristic factors, chlorophyll fluorescence, and antioxidant enzyme activities also confirmed this perspective (Tables S5–S8). The K fertilizer types had different effects on Cd accumulates in plants [52]. Results suggested that the use of mineral humic acid as a carrier of K could exert the effect of K in decreasing Cd in rice. The process of enhanced photosynthesis by MBPH through increasing K in soil solution may be the main Cd detoxification mechanism in rice in the S-Cd soils (Table 1).

4.2. Contribution of Humic Acid The Applications to the Healthy Growth of Rice by Supporting Photosynthesis and Chlorophyll Density and Enzyme Activities

Morphological, yield, and biomass are the most intuitive features to depict of the growth crops that are limited by excessive amounts of soil heavy metals [53]. Cd toxicity disrupts the ultrastructure of rice leaves, causing structural damage to the rice’s photosynthetic apparatus and, subsequently, affecting the normal growth, development, and dry matter accumulation of rice [54]. The application of humic acid can significantly improve the morphological characteristics of common bean plants (Phaseolus vulgaris L.) and chrysanthemum (Chrysanthemum morifolium R.) [55,56]. In the present study, the application of MBPH (0.25%, 0.5%, 1%) for S-Cd soils and 0.25% and 0.5% MBPH for H-Cd soils significantly increased the SL of rice, respectively (Table S2), and, specifically, there was a significantly negative correlation between Cd in brown rice and SL in the S-Cd soils (Figure S4A). This is in agreement with the findings of Arduini et al. [57] and Liu et al. [58], in which they studied the potential that crops with long spikes have to accumulate less Cd.
The application of humic acid enhanced the photosynthetic and chlorophyll fluorescent characteristics and antioxidant capacity of crops, therefore, promoting plant growth under abiotic stress [59,60,61]. In this study, higher photosynthetic parameters, SPAD and Fv/Fm, and antioxidant enzyme activities of rice leaves resulted from MBPH application (Table S3, Figure S2). Studies have demonstrated that increasing photosynthetic efficiency by accelerating the recovery of photoprotection can improve crop productivity [62] and that increased antioxidant enzyme activity can scavenge reactive oxygen species to defend against abiotic stresses and promote plant development [63]. Humic substances can be absorbed and transported into plant organs to participate in photosynthetic processes and benefit antioxidant enzyme systems [64]. For S-Cd soils, the application of 1% MBPH significantly increased the TKW of rice (Table S2), a typical component trait of yield [65], indicating that MBPH application on S-Cd soils had a yield-increasing effect. MBPH application could significantly increase the SDW, FLDW, ADMA, and RDW of rice, especially at 0.5% and 1% MBPH application rates (Table S2). Similar results have been demonstrated earlier: humic acid application significantly increased the above-ground fresh weight of lettuce (Lactuca sativa L.) and the shoot dry weight of tobacco (Nicotiana tabaccum L.) [66,67]. The increase in biomass mitigates the toxicity of Cd to rice through a dilution effect [68], as evidenced by the negative or significant negative correlation between brown rice Cd and biomass indicators (Figure S4). Additionally, humic substances can cause adjustments in a plant’s primary and secondary metabolism that are associated with abiotic stress tolerance, which together regulate plant development and encourage fitness [69].

4.3. A Key Mechanism of MBPH Affecting Cd Uptake in Rice

MBPH has a rich microporous structure (Figure 1) that is open and, thus, can exchange and adsorb Cd2+ ions [70], which is similar to the results of Huang et al. [71]. Coal-based potassium humates contain a variety of oxygen-containing functional groups as well as disordered structures of macromolecules, which facilitate the formation of good pore structures [72]. Moreover, it was shown that the reaction of KOH with active sites associated with the oxygen-containing groups of humic acid also has a pore-forming effect [71,73]. FTIR analyses indicated that MBPH application promoted the complexation of -OH, -COOH, and C-O groups with Cd and the formation of carbonates from CO32− groups with Cd in soil (Figure 6), especially in the M-Cd and H-Cd contaminated soils. Heavy metal ion absorption and immobilization are facilitated by oxygen-containing functional groups through ion exchange and complexation, generating stable Cd-humate complexes, thus, reducing the soil Cd bioavailability [74]. The clear shifts of -COOH and C-O groups found in the M-Cd soils suggest that this effect is more pronounced in the M-Cd soils (Figure 6B). FTIR analysis shows a decrease in CO32− bands at 872 cm−1 and 778 cm−1 compared to CK (Figure 6B,C), which predicted more formation of carbonates precipitation in the soil [75]. Thus, these reactions help to immobilize soluble Cd in situ, which is one of the key processes in the solidification of Cd in soil.

4.4. The Importance of Decreasing Cadmium and Increasing Mineral Elements in the Quality of Brown Rice

The application of various doses of MBPH led to a significant decrease in the accumulation of brown rice Cd at all three soil Cd contamination levels as compared to the CK (Figure 4E). Under the 0.5% and 1% MBPH treatments, the brown rice Cd fell to 0.18 mg kg−1 and 0.16 mg kg−1 in the H-Cd soils, respectively, both below the national cadmium limit for rice (0.2 mg kg−1, GB 2762-2017). Thus, the rice became safe to eat (Figure 4E). This reduction in Cd accumulation in edible parts was also obtained in a previous study of the effect of humic acid on wheat [76]. Under the MBPH treatment, the roots’ Cd was significantly reduced (Figure 4A), which probably can be brought on by the soil’s low Cd activity. This lower Cd availability was caused by an increase in the soil solution pH and DOC, a decrease in soil solution Cd, and the formation of Cd-humate complexes [77]. The MBPH supplementation also had an impact on the Cd translocation factors (TFs) of rice. Studies have shown that the phloem transport of Cd is the most important process that determines the Cd concentration in brown rice, and the phloem transport includes TFstem-brown rice, TFordinary leaf-brown rice, and TFflag leaf-brown rice [78]. Among the TFs of various organs, TFordinary leaf-brown rice and TFflag leaf-brown rice values were significantly reduced upon MBPH addition regardless of soil Cd levels (Table S4), displaying that the decrease in brown rice Cd was primarily caused by the reduction in the TFordinary leaf-brown rice and TFflag leaf-brown rice.
One of the major features in establishing the quality of brown rice is in its level of minerals [79]. In addition to decreasing Cd in brown rice, the application of MBPH improved the mineral elements qualities of rice in three Cd contaminated soils (Figure 3); Çelik et al. [80] and Tapia et al. [27] obtained similar results on hybrid maize (Zea mays L.) and Carpobrotus aequilaterus. There are multiple reasons for the increased concentration of mineral elements in brown rice. Firstly, there is a competitive relationship between Cd and mineral element uptake by brown rice [81]; however, the applied MBPH reduced the soil Cd bioavailability, thus, lessening the detrimental effect on the uptake of mineral elements. The reduction in Cd uptake by the roots led to more transport of mineral elements from roots to brown rice, increasing the brown rice mineral elements [82]. Secondly, applying the MBPH can increase the availability of mineral elements, such as Cu, Mn, and Zn [21] in the soil, which then promotes the uptake of mineral elements by rice. At the same time, MBPH significantly increased biomass as compared to CK, particularly the dry weight of rice roots (Table S2), which facilitated the high biomass roots to phytoextract these mineral elements [26]. As well, MBPH may enhance microbial and biochemical activity, which contributed to increasing the soluble fraction of mineral elements in the rhizosphere soil [83]. The production of soluble complexes of humic substances and micronutrients is frequently reported as a way to enhance plant nutrition through mineral elements [69]. Studies have confirmed that humus could act as a chelator and biostimulant to enhance plant iron nutrition [84]. MBPH contains element K, leading to a significant increase in soil solution K (Figure S1G–I), which is probably the main reason for the significant increase in brown rice K (Figure 3E).
In the S-Cd and M-Cd soils, although the brown rice Cd without MBPH application did not exceed the national Cd limit for rice grains (Figure 4E), Cd, as a toxic heavy metal element harmful to the human body, is very necessary for it to accumulate less in brown rice. More importantly, it is estimated that many people are deficient in micronutrients as a consequence of the low availability of mineral elements in the soil or the low accumulation of the edible parts of mineral elements [85,86]. Research on the screening of rice cultivars rich in mineral elements, especially Fe, but free of Cd and the breeding of Cd-tolerant and biofortified cultivars, has been an important issue in the field of agriculture [87,88]. The application of MBPH as a remediation measure in this study may facilitate the achievement of this goal. Meanwhile, rice fortification with micronutrients is a cost-effective public health intervention to prevent and control micronutrient deficiencies in humans, as proposed by the World Health Organization [89].

5. Conclusions

A pot experiment was performed with a mineral-based potassium humate (MBPH) to investigate its impact on Cd accumulation in rice under three Cd-contaminated soil levels. The application of MBPH was able to significantly reduce the absorption and accumulation of Cd in rice. The reduction in brown rice Cd increased with increasing doses of MBPH application; A significant reduction had been achieved by applying MBPH 0.25% on slightly and moderately contaminated soils and MBPH 0.5% and 1% on highly contaminated soils, which reduced the brown rice Cd to within the food safety standard (GB 2762-2012). MBPH application mitigated Cd toxicity by modifying the pH, DOC, and K of the soil solution, resulting in a reduction in Cd absorption and transport, and by enhancing the photosynthetic parameters, SPAD, chlorophyll fluorescence, and antioxidant enzymes in rice leaves to improve plant growth. In addition, the application of MBPH increased the mineral elements in brown rice, which improved the quality of brown rice. The rich microporous structure of MBPH, and its contribution to the formation of complexes and carbonates of soil oxygenated functional groups and CO32− with Cd, plays a key role in fixing Cd in the soil. Therefore, the amendment could be regarded as an ecologically friendly and efficient material that can be applied to Cd-contaminated soils, especially in slightly and moderately contaminated areas, to enhance rice growth while reducing Cd concentrations and improving mineral elements in brown rice.

Supplementary Materials

The following supporting information can be downloaded at: https://www.mdpi.com/article/10.3390/su15032836/s1, Table S1: FTIR spectroscopic functional group attribution of mineral-based potassium humate (MBPH) and soils; Table S2: Effects of application of mineral-based potassium humate (MBPH) on the growth of Oryza sativa L. under different soil contaminated levels; Table S3: Effects of application of mineral-based potassium humate (MBPH) on photosynthetic parameters and SPAD under different soil contaminated levels; Table S4: Effects of application of mineral-based potassium humate (MBPH) on transfer factors (TFs) of Cd between different organs of rice under different soil contaminated levels; Table S5: Spearman correlation among soil solution chemistry, minerals in brown rice, photosynthetic and chlorophyll fluorescence characteristics, enzyme activity of leaves, soil DTPA-Cd and Cd in brown rice under S-Cd soils; Table S6: Spearman correlation among soil solution chemistry, minerals in brown rice, photosynthetic and chlorophyll fluorescence characteristics, enzyme activity of leaves, soil DTPA-Cd and Cd in brown rice under M-Cd soils; Table S7: Spearman correlation among soil solution chemistry, minerals in brown rice, photosynthetic and chlorophyll fluorescence characteristics, enzyme activity of leaves, soil DTPA-Cd and Cd in brown rice under H-Cd soils; Table S8: Spearman correlation among soil solution chemistry, minerals in brown rice, photosynthetic and chlorophyll fluorescence characteristics, enzyme activity of leaves, soil DTPA-Cd and Cd in brown rice using all the data; Figure S1: Effects of application of mineral based potassium humate (MBPH) on pH (A-C), DOC (D-F), and K (G-I) in soil solution at different growth stages of rice under different soil contaminated levels. DOC, dissolved organic carbon; S-Cd, slightly contaminated soil (1 mg kg−1); M-Cd, moderately contaminated soil (2 mg kg−1); H-Cd, highly contaminated soil (4 mg kg−1). Lowercase letters indicate significant differences in different MBPH levels under the same Cd-contaminated soil; capital letters indicate significant differences among different Cd-contaminated soils at the same level of MBPH application (p < 0.05, Duncan test and Kruskal–Wallis test); Figure S2: Effects of application of mineral based potassium humate (MBPH) on the antioxidant enzyme activities of rice leaves at tillering stage under different soil contaminated levels. SOD (A), superoxide dismutase; POD (B), peroxidase, CAT (C), catalase; S-Cd, slightly contaminated soil (1 mg kg−1); M-Cd, moderately contaminated soil (2 mg kg−1); H-Cd, highly contaminated soil (4 mg kg−1). Lowercase letters indicate significant differences in different MBPH levels under the same Cd-contaminated soil; capital letters indicate significant differences among different Cd-contaminated soils at the same level of MBPH application (p < 0.05, Duncan test and Kruskal–Wallis test); Figure S3: Prediction equation validation in S-Cd (A), slightly contaminated soil (1 mg kg−1); M-Cd (B), moderately contaminated soil (2 mg kg−1); H-Cd (C), highly contaminated soil (4 mg kg−1); all the data (D); Figure S4: Spearman correlation matrix for Cd concentration in brown rice and agronomic traits of rice. Diagonal shows the variable distribution diagram; the top right of the diagonal shows the Spearman correlation coefficient the level of significance (p < 0.05 *; p < 0.01 **; p < 0.001 ***). S-Cd (A), slightly contaminated soil (1 mg kg−1); M-Cd (B), moderately contaminated soil (2 mg kg−1); H-Cd (C), highly contaminated soil (4 mg kg−1); all the data (D). Cd, Cd concentration in brown rice; PH, Plant height; SL, spike length; TKW, thousand kernel weight; SDW, stem dry weight; OLDW, ordinary leaves dry weight; FLDW, flag leaves dry weight; ADMA, dry matter accumulation of aboveground; RDW, root dry weight. References [90,91,92,93,94,95,96,97,98,99,100,101,102,103] are cited in the Supplementary Materials.

Author Contributions

Conceptualization, S.L., X.H. and S.C.; Data curation, S.L. and J.D.; Formal analysis, S.L., X.H. and J.D.; Funding acquisition, J.D.; Methodology, S.L., X.H., G.L., K.Z., L.B., H.H., S.C. and J.D.; Resources, G.L.; Software, S.L.; Supervision, J.D.; Writing—original draft, S.L.; Writing—review and editing, S.L., X.H., G.L., K.Z., L.B., H.H., S.C. and J.D. All authors have read and agreed to the published version of the manuscript.

Funding

This research was supported by the National Natural Science Foundation of China [41977144], the Agricultural Major Technology Collaborative Promotion Plan of Shandong Province [SDNYXTTG-2022-22], and the Shandong Provincial Key Research and Development Program of China [2018GSF117024].

Institutional Review Board Statement

Not applicable.

Informed Consent Statement

Not applicable.

Data Availability Statement

Data available on request due to restrictions, e.g., privacy or ethical.

Acknowledgments

Thanks to the National Natural Science Foundation of China [41977144], the Agricultural Major Technology Collaborative Promotion Plan of Shandong Province [SDNYXTTG-2022-22], and the Shandong Provincial Key Research and Development Program of China [2018GSF117024] for their support.

Conflicts of Interest

The authors declare no conflict of interest.

References

  1. World Health Organization; Food and Agriculture Organization of the United Nations; Joint FAO/WHO Expert Committee on Food Additives. Evaluation of Certain Food Additives and Contaminants: Seventy-Third 73rd Report of the Joint FAO/WHO Expert Committee on Food Additives; World Health Organization: Geneva, Switzerland, 2011. [Google Scholar]
  2. Uddin, M.M.; Zakeel, M.C.M.; Zavahir, J.S.; Marikar, F.M.M.T.; Jahan, I. Heavy metal accumulation in rice and aquatic plants used as human food: A general review. Toxics 2021, 9, 360. [Google Scholar] [CrossRef]
  3. Bernhoft, R.A. Cadmium toxicity and treatment. Sci. World J. 2013, 2013, 394652. [Google Scholar] [CrossRef] [PubMed]
  4. Haider, F.U.; Cai, L.Q.; Coulter, J.A.; Cheema, S.A.; Wu, J.; Zhang, R.Z.; Ma, W.J.; Farooq, M. Cadmium toxicity in plants: Impacts and remediation strategies. Ecotoxicol. Environ. Saf. 2021, 211, 111887. [Google Scholar] [CrossRef] [PubMed]
  5. Sen, S.; Chakraborty, R.; Kalita, P. Rice-not just a staple food: A comprehensive review on its phytochemicals and therapeutic potential. Trends Food Sci. Technol. 2020, 97, 265–285. [Google Scholar] [CrossRef]
  6. Uraguchi, S.; Fujiwara, T. Rice breaks ground for cadmium-free cereals. Curr. Opin. Plant Biol. 2013, 16, 328–334. [Google Scholar] [CrossRef] [PubMed]
  7. Lu, A.X.; Li, B.R.; Li, J.; Chen, W.; Xu, L. Heavy metals in paddy soil-rice systems of industrial and township areas from subtropical China: Levels, transfer and health risks. J. Geochem. Explor. 2018, 194, 210–217. [Google Scholar] [CrossRef]
  8. Lee, S.-B.; Kang, D.-W.; Yoo, J.-H.; Park, S.-W.; Oh, K.S.; Lee, J.; Cho, I.K.; Moon, B.-C.; Kim, W.-I.J.O.S.J. Determination of bioconcentration factor of heavy metal (loid)s in rice grown on soils vulnerable to heavy metal (loid)s contamination. Ocean Sci. J. 2017, 50, 106–114. [Google Scholar] [CrossRef]
  9. Koizumi, N.; Ohashi, F.; Ikeda, M. Lack of correlation between cadmium level in local brown rice and renal failure mortality among the residents: A nation-wide analysis in Japan. Int. Arch. Occup. Environ. Health 2010, 83, 333–339. [Google Scholar] [CrossRef]
  10. Mng’ong’o, M.; Munishi, L.K.; Ndakidemi, P.A.; Blake, W.; Comber, S.; Hutchinson, T.H. Accumulation and bioconcentration of heavy metals in two phases from agricultural soil to plants in Usangu agroecosystem-Tanzania. Heliyon 2021, 7, e07514. [Google Scholar] [CrossRef]
  11. Sriprachote, A.; Kanyawongha, P.; Ochiai, K.; Matoh, T. Current situation of cadmium-polluted paddy soil, rice and soybean in the Mae Sot District, Tak Province, Thailand. Soil Sci. Plant Nutr. 2012, 58, 349–359. [Google Scholar] [CrossRef]
  12. Hussain, B.; Umer, M.J.; Li, J.M.; Ma, Y.B.; Abbas, Y.; Ashraf, M.N.; Tahir, N.; Ullah, A.; Gogoi, N.; Farooq, M. Strategies for reducing cadmium accumulation in rice grains. J. Clean Prod. 2020, 286, 125557. [Google Scholar] [CrossRef]
  13. Ahmed, N.; Shah, A.R.; Danish, S.; Alharbi, K.; Datta, R. Acidified carbon with variable irrigation sources impact on rice growth and yield under Cd toxic alkaline Soil conditions. Sustainability 2022, 14, 10086. [Google Scholar] [CrossRef]
  14. Pandey, A.K.; Pandey, S.D.; Misra, V. Stability constants of metal–humic acid complexes and its role in environmental detoxification. Ecotoxicol. Environ. Saf. 2000, 47, 195–200. [Google Scholar] [CrossRef] [PubMed]
  15. Asli, S.; Neumann, P.M. Rhizosphere humic acid interacts with root cell walls to reduce hydraulic conductivity and plant development. Plant Soil 2010, 336, 313–322. [Google Scholar] [CrossRef]
  16. Singh, S.; Kumar, V.; Anil, A.G.; Romero, R.; Ramamurthy, P.C.; Singh, J. Biodegradation of phorate by bacterial strains in the presence of humic acid and metal ions. J. Basic Microbiol. 2022, 62, 498–507. [Google Scholar] [CrossRef]
  17. Khan, K.Y.; Ali, B.; Cui, X.Q.; Feng, Y.; Stoffella, P.J.; Tang, L.; Yang, X.E. Effect of humic acid amendment on cadmium bioavailability and accumulation by pak choi (Brassica rapa ssp. chinensis L.) to alleviate dietary toxicity risk. Arch. Agron. Soil Sci. 2017, 63, 1431–1442. [Google Scholar] [CrossRef]
  18. Zhao, K.Q.; Yang, Y.; Peng, H.; Zhang, L.H.; Zhou, Y.Y.; Zhang, J.C.; Du, C.Y.; Liu, J.W.; Lin, X.; Wang, N.Y.; et al. Silicon fertilizers, humic acid and their impact on physicochemical properties, availability and distribution of heavy metals in soil and soil aggregates. Sci. Total Environ. 2022, 822, 153483. [Google Scholar] [CrossRef]
  19. Ding, H.J.; Tang, L.; Nie, Y.N.; Ji, H.B. Characteristics and interactions of heavy metals with humic acid in gold mining area soil at a upstream of a metropolitan drinking water source. J. Geochem. Explor. 2019, 200, 266–275. [Google Scholar] [CrossRef]
  20. Rashid, I.; Murtaza, G.; Dar, A.A.; Wang, Z.Y. The influence of humic and fulvic acids on Cd bioavailability to wheat cultivars grown on sewage irrigated Cd-contaminated soils. Ecotoxicol. Environ. Saf. 2020, 205, 111347. [Google Scholar] [CrossRef]
  21. Shaheen, S.M.; Shams, M.S.; Khalifa, M.R.; El-Dali, M.A.; Rinklebe, J. Various soil amendments and environmental wastes affect the (im) mobilization and phytoavailability of potentially toxic elements in a sewage effluent irrigated sandy soil. Ecotoxicol. Environ. Saf. 2017, 142, 375–387. [Google Scholar] [CrossRef]
  22. Dmitrieva, E.; Efimova, E.; Siundiukova, K.; Perelomov, L. Surface properties of humic acids from peat and sapropel of increasing transformation. Environ. Chem. Lett. 2015, 13, 197–202. [Google Scholar] [CrossRef]
  23. Doskocil, L.; Burdikova-Szewieczkova, J.; Enev, V.; Kalina, L.; Wasserbauer, J. Spectral characterization and comparison of humic acids isolated from some European lignites. Fuel 2018, 213, 123–132. [Google Scholar] [CrossRef]
  24. Zhou, L.P.; Yuan, L.; Zhao, B.Q.; Li, Y.T.; Lin, Z.A. Structural characteristics of humic acids derived from Chinese weathered coal under different oxidizing conditions. PLoS ONE 2019, 14, e0217469. [Google Scholar] [CrossRef] [PubMed]
  25. Zara, M.; Ahmad, Z.; Akhtar, J.; Shahzad, K.; Sheikh, N.; Munir, S. Extraction and characterization of humic acid from Pakistani lignite coals. Energy Sources Part A Recovery Util. Environ. Eff. 2017, 39, 1159–1166. [Google Scholar] [CrossRef]
  26. Shaheen, S.M.; Rinklebe, J. Phytoextraction of potentially toxic elements by Indian mustard, rapeseed, and sunflower from a contaminated riparian soil. Environ. Geochem. Health 2015, 37, 953–967. [Google Scholar] [CrossRef] [PubMed]
  27. Tapia, Y.; Bustos, P.; Salazar, O.; Casanova, M.; Castillo, B.; Acuna, E.; Masaguer, A. Phytostabilization of Cu in mine tailings using native plant Carpobrotus aequilaterus and the addition of potassium humates. J. Geochem. Explor. 2017, 183, 102–113. [Google Scholar] [CrossRef]
  28. Yu, Y.; Wan, Y.N.; Camara, A.Y.; Li, H.F. Effects of the addition and aging of humic acid-based amendments on the solubility of Cd in soil solution and its accumulation in rice. Chemosphere 2018, 196, 303–310. [Google Scholar] [CrossRef]
  29. Li, B.; Zhu, Q.H.; Zhang, Q.; Zhu, H.H.; Huang, D.Y.; Su, S.M.; Wang, Y.N.; Zeng, X.B. Cadmium and arsenic availability in soil under submerged incubation: The influence of humic substances on iron speciation. Ecotoxicol. Environ. Saf. 2021, 225, 112773. [Google Scholar] [CrossRef]
  30. Wang, Y.F.; Ying, Y.Q.; Lu, S.G. Si-Ca-K-Mg amendment reduces the phytoavailability and transfer of Cd from acidic soil to rice grain. Environ. Sci. Pollut. Res. 2020, 27, 33248–33258. [Google Scholar] [CrossRef]
  31. Jorfi, S.; Maleki, R.; Jaafarzadeh, N.; Ahmadi, M. Pollution load index for heavy metals in Mian-Ab plain soil, Khuzestan, Iran. Data Brief 2017, 15, 584–590. [Google Scholar] [CrossRef]
  32. Wang, M.Y.; Chen, A.K.; Wong, M.H.; Qiu, R.L.; Cheng, H.; Ye, Z.H. Cadmium accumulation in and tolerance of rice (Oryza sativa L.) varieties with different rates of radial oxygen loss. Environ. Pollut. 2011, 159, 1730–1736. [Google Scholar] [CrossRef]
  33. Li, S.; Li, G.; Huang, X.; Chen, Y.; Lv, C.; Bai, L.; Zhang, K.; He, H.; Dai, J. Cultivar-specific response of rhizosphere bacterial community to uptake of cadmium and mineral elements in rice (Oryza sativa L.). Ecotoxicol. Environ. Saf. 2023, 249, 114403. [Google Scholar] [CrossRef] [PubMed]
  34. Peacock, M.; Evans, C.D.; Fenner, N.; Freeman, C.; Gough, R.; Jones, T.G.; Lebron, I. UV-visible absorbance spectroscopy as a proxy for peatland dissolved organic carbon (DOC) quantity and quality: Considerations on wavelength and absorbance degradation. Environ. Sci. Process. Impacts 2014, 16, 1445–1461. [Google Scholar] [CrossRef] [PubMed]
  35. Carter, H.T.; Tipping, E.; Koprivnjak, J.F.; Miller, M.P.; Cookson, B.; Hamilton-Taylor, J. Freshwater DOM quantity and quality from a two-component model of UV absorbance. Water Res. 2012, 46, 4532–4542. [Google Scholar] [CrossRef] [PubMed]
  36. Liu, J.H.; Hou, H.; Zhao, L.; Sun, Z.J.; Li, H. Protective Effect of foliar application of sulfur on photosynthesis and antioxidative defense system of rice under the stress of Cd. Sci. Total Environ. 2020, 710, 136230. [Google Scholar] [CrossRef]
  37. Tan, X.F.; Guo, X.; Guo, W.H.; Liu, S.N.; Du, N. Invasive Rhus typhina invests more in height growth and traits associated with light acquisition than do native and non-invasive alien shrub species. Trees Struct. Funct. 2018, 32, 1103–1112. [Google Scholar] [CrossRef]
  38. Wieland, G.; Neumann, R.; Fau-Backhaus, H.; Backhaus, H. Variation of microbial communities in soil, rhizosphere, and rhizoplane in response to crop species, soil type, and crop development. Appl. Environ. Microbiol. 2001, 67, 5849–5854. [Google Scholar] [CrossRef]
  39. Li, H.H.; Liu, Y.T.; Tang, S.Y.; Yu, Z.C.; Cai, X.Z.; Xu, S.P.; Chen, Y.H.; Wang, M.K.; Wang, G. Mechanisms for potential Pb immobilization by hydroxyapatite in a soil-rice system. Sci. Total Environ. 2021, 783, 147037. [Google Scholar] [CrossRef] [PubMed]
  40. Qu, M.; Chen, J.; Huang, B.; Zhao, Y. Exploring the spatially varying relationships between cadmium accumulations and the main influential factors in the rice-wheat rotation system in a large-scale area. Sci. Total Environ. 2020, 736, 139565. [Google Scholar] [CrossRef] [PubMed]
  41. Janos, P.; Vavrova, J.; Herzogova, L.; Pilarova, V. Effects of inorganic and organic amendments on the mobility (leachability) of heavy metals in contaminated soil: A sequential extraction study. Geoderma 2010, 159, 335–341. [Google Scholar] [CrossRef]
  42. Huang, Y.; Sheng, H.; Zhou, P.; Zhang, Y.Z. Remediation of Cd-contaminated acidic paddy fields with four-year consecutive liming. Ecotoxicol. Environ. Saf. 2020, 188, 109903. [Google Scholar] [CrossRef]
  43. Neff, J.C.; Asner, G.P. Dissolved organic carbon in terrestrial ecosystems: Synthesis and a model. Ecosystems 2001, 4, 29–48. [Google Scholar] [CrossRef]
  44. Smebye, A.; Ailing, V.; Vogt, R.D.; Gadmar, T.C.; Mulder, J.; Cornelissen, G.; Hale, S.E. Biochar amendment to soil changes dissolved organic matter content and composition. Chemosphere 2016, 142, 100–105. [Google Scholar] [CrossRef] [PubMed]
  45. Song, X.W.; Lyu, S.; Wang, J.; Sun, K.; Gao, Y.; Wen, X.F. High dissolved organic carbon deposition is buffered by surface soil in a headwater catchment of a subtropical plantation. J. Hydrol. 2022, 607, 127557. [Google Scholar] [CrossRef]
  46. Kaiser, K.; Zech, W. Rates of dissolved organic matter release and sorption in forest soils. Soil Sci. 1998, 163, 714–725. [Google Scholar] [CrossRef]
  47. Calace, N.; Massimiani, A.; Petronio, B.M.; Pietroletti, M. Municipal landfill leachate-soil interactions: A kinetic approach. Chemosphere 2001, 44, 1025–1031. [Google Scholar] [CrossRef] [PubMed]
  48. Shamsi, I.H.; Jilani, G.; Zhang, G.P.; Wei, K. Cadmium stress tolerance through potassium nutrition in soybean. Asian J. Chem. 2008, 20, 1099–1108. [Google Scholar]
  49. Wang, K.; Fu, G.P.; Yu, Y.; Wan, Y.A.; Liu, Z.; Wang, Q.; Zhang, J.S.; Li, H.F. Effects of different potassium fertilizers on cadmium uptake by three crops. Environ. Sci. Pollut. Res. 2019, 26, 27014–27022. [Google Scholar] [CrossRef]
  50. Naciri, R.; Lahrir, M.; Benadis, C.; Chtouki, M.; Oukarroum, A. Interactive effect of potassium and cadmium on growth, root morphology and chlorophyll a fluorescence in tomato plant. Sci. Rep. 2021, 11, 5384. [Google Scholar] [CrossRef]
  51. De Anicesio, E.C.A.; Monteiro, F.A. Potassium reduces oxidative stress in tanzania guinea grass under cadmium toxicity. Environ. Sci. Pollut. Res. 2022, 29, 1184–1198. [Google Scholar] [CrossRef]
  52. Wu, J.W.; Li, R.J.; Lu, Y.; Bai, Z.Q. Sustainable management of cadmium-contaminated soils as affected by exogenous application of nutrients: A review. J. Environ. Manag. 2021, 295, 113081. [Google Scholar] [CrossRef]
  53. Arif, N.; Sharma, N.C.; Yadav, V.; Ramawat, N.; Dubey, N.K.; Tripathi, D.K.; Chauhan, D.K.; Sahi, S. Understanding heavy metal stress in a rice crop: Toxicity, tolerance mechanisms, and amelioration strategies. J. Plant Biol. 2019, 62, 239–253. [Google Scholar] [CrossRef]
  54. Rizwan, M.; Ali, S.; Adrees, M.; Rizvi, H.; Zia-ur-Rehman, M.; Hannan, F.; Qayyum, M.F.; Hafeez, F.; Ok, Y.S. Cadmium stress in rice: Toxic effects, tolerance mechanisms, and management: A critical review. Environ. Sci. Pollut. Res. 2016, 23, 17859–17879. [Google Scholar] [CrossRef]
  55. Fan, H.M.; Wang, X.W.; Sun, X.; Li, Y.Y.; Sun, X.Z.; Zheng, C.S. Effects of humic acid derived from sediments on growth, photosynthesis and chloroplast ultrastructure in chrysanthemum. Sci. Hortic. 2014, 177, 118–123. [Google Scholar] [CrossRef]
  56. Meganid, A.S.; Al-Zahrani, H.S.M.; Selim, M.M.; Arabia, S. Effect of Humic acid application on growth and chlorophyll contents of common bean plants (Phaseolus vulgaris L.) under salinity stress conditions. Int. J. Innov. Res. Sci. Eng. Technol. 2015, 4, 2651–2660. [Google Scholar] [CrossRef]
  57. Arduini, I.; Masoni, A.; Mariotti, M.; Pampana, S.; Ercoli, L. Cadmium uptake and translocation in durum wheat varieties differing in grain-Cd accumulation. Plant Soil Environ. 2014, 60, 43–49. [Google Scholar] [CrossRef]
  58. Liu, N.; Huang, X.M.; Sun, L.M.; Li, S.S.; Chen, Y.H.; Cao, X.Y.; Wang, W.X.; Dai, J.L.; Rinnan, R. Screening stably low cadmium and moderately high micronutrients wheat cultivars under three different agricultural environments of China. Chemosphere 2020, 241, 125065. [Google Scholar] [CrossRef] [PubMed]
  59. Gholami, H.; Samavat, S.; Ardebili, Z.O. The alleviating effects of humic substances on photosynthesis and yield of Plantago ovate in salinity conditions. Int. Res. J. Appl. Basic Sci. 2013, 4, 1683–1686. [Google Scholar]
  60. Ozfidan-Konakci, C.; Yildiztugay, E.; Bahtiyar, M.; Kucukoduk, M. The humic acid-induced changes in the water status, chlorophyll fluorescence and antioxidant defense systems of wheat leaves with cadmium stress. Ecotoxicol. Environ. Saf. 2018, 155, 66–75. [Google Scholar] [CrossRef] [PubMed]
  61. Song, X.; Chen, M.; Chen, W.; Jiang, H.; Yue, X. Foliar application of humic acid decreased hazard of cadmium toxicity on the growth of Hybrid Pennisetum. Acta Physiol. Plant. 2020, 42, 129. [Google Scholar] [CrossRef]
  62. Kromdijk, J.; Glowacka, K.; Leonelli, L.; Gabilly, S.T.; Iwai, M.; Niyogi, K.K.; Long, S.P. Improving photosynthesis and crop productivity by accelerating recovery from photoprotection. Science 2016, 354, 857–861. [Google Scholar] [CrossRef]
  63. Foyer, C.H.; Noctor, G. Oxidant and antioxidant signalling in plants: A re-evaluation of the concept of oxidative stress in a physiological context. Plant Cell Environ. 2005, 28, 1056–1071. [Google Scholar] [CrossRef]
  64. Nardi, S.; Pizzeghello, D.; Muscolo, A.; Vianello, A. Physiological effects of humic substances on higher plants. Soil Biol. Biochem. 2002, 34, 1527–1536. [Google Scholar] [CrossRef]
  65. Liu, W.X.; Leiser, W.L.; Reif, J.C.; Tucker, M.R.; Losert, D.; Weissmann, S.; Hahn, V.; Maurer, H.P.; Wurschum, T. Multiple-line cross QTL mapping for grain yield and thousand kernel weight in triticale. Plant Breed. 2016, 135, 567–573. [Google Scholar] [CrossRef]
  66. Haghighi, M.; Kafi, M.; Khoshgoftarmanesh, A. Effect of humic acid application on cadmium accumulation by lettuce leaves. J. Plant Nutr. 2013, 36, 1521–1532. [Google Scholar] [CrossRef]
  67. Yu, Y.; Wan, Y.N.; Wang, Q.; Li, H.F. Effect of humic acid-based amendments with foliar application of Zn and Se on Cd accumulation in tobacco. Ecotoxicol. Environ. Saf. 2017, 138, 286–291. [Google Scholar] [CrossRef] [PubMed]
  68. Sarwar, N.; Saifullah; Malhi, S.S.; Zia, M.H.; Naeem, A.; Bibi, S.; Farid, G. Role of mineral nutrition in minimizing cadmium accumulation by plants. J. Sci. Food. Agric. 2010, 90, 925–937. [Google Scholar] [CrossRef] [PubMed]
  69. Canellas, L.P.; Olivares, F.L.; Aguiar, N.O.; Jones, D.L.; Nebbioso, A.; Mazzei, P.; Piccolo, A. Humic and fulvic acids as biostimulants in horticulture. Sci. Hortic. 2015, 196, 15–27. [Google Scholar] [CrossRef]
  70. Chen, Y.J.; Bai, X.; Ye, Z.F. Recent progress in heavy metal ion decontamination based on metal-organic frameworks. Nanomaterials 2020, 10, 1481. [Google Scholar] [CrossRef] [PubMed]
  71. Huang, G.X.; Kang, W.W.; Xing, B.L.; Chen, L.J.; Zhang, C.X. Oxygen-rich and hierarchical porous carbons prepared from coal based humic acid for supercapacitor electrodes. Fuel Process. Technol. 2016, 142, 1–5. [Google Scholar] [CrossRef]
  72. Hu, G.X.; Tang, B.; Min, X. Synthesis and characterization of alternated (humic acid/Fe3+) (n) multilayer film on alumina fiber. Surf. Coat. Technol. 2012, 206, 3586–3594. [Google Scholar] [CrossRef]
  73. Jiang, Z.D.; Zhang, C.X.; Qu, X.X.; Xing, B.L.; Huang, G.X.; Xu, B.; Shi, C.L.; Kang, W.W.; Yu, J.; Hong, S.W. Humic acid resin-based amorphous porous carbon as high rate and cycle performance anode for sodium-ion batteries. Electrochim. Acta 2021, 372, 137850. [Google Scholar] [CrossRef]
  74. Nzediegwu, C.; Prasher, S.; Elsayed, E.; Dhiman, J.; Mawof, A.; Patel, R. Biochar applied to soil under wastewater irrigation remained environmentally viable for the second season of potato cultivation. J. Environ. Manag. 2020, 254, 109822. [Google Scholar] [CrossRef] [PubMed]
  75. Sun, J.K.; Lian, F.; Liu, Z.Q.; Zhu, L.Y.; Song, Z.G. Biochars derived from various crop straws: Characterization and Cd (II) removal potential. Ecotoxicol. Environ. Saf. 2014, 106, 226–231. [Google Scholar] [CrossRef] [PubMed]
  76. Ren, Y.J.; Ma, J.J. The ecological effects of humic acid fertilizer on the spring wheat under cadmium stress. Appl. Mech. Mater. 2013, 295–298, 1204–1208. [Google Scholar] [CrossRef]
  77. Ratie, G.; Chrastny, V.; Guinoiseau, D.; Marsac, R.; Vankova, Z.; Komarek, M. Cadmium isotope fractionation during complexation with humic acid. Environ. Sci. Technol. 2021, 55, 7430–7444. [Google Scholar] [CrossRef]
  78. Luo, Q.H.; Bai, B.; Xie, Y.H.; Yao, D.P.; Zhang, D.M.; Chen, Z.; Zhuang, W.; Deng, Q.Y.; Xiao, Y.H.; Wu, J. Effects of Cd uptake, translocation and redistribution in different hybrid rice varieties on grain Cd concentration. Ecotoxicol. Environ. Saf. 2022, 240, 113683. [Google Scholar] [CrossRef]
  79. Zeng, Y.; Wang, L.; Fau-Du, J.; Du, J.; Fau-Liu, J.; Liu, J.; Fau-Yang, S.; Yang, S.; Fau-Pu, X.; Pu, X.; et al. Elemental content in brown rice by inductively coupled plasma atomic emission spectroscopy reveals the evolution of Asian cultivated rice. J. Integr. Plant Biol. 2009, 51, 466–475. [Google Scholar] [CrossRef]
  80. Celik, H.; Katkat, A.V.; Asik, B.B.; Turan, M.A. Effect of foliar-applied humic acid to dry weight and mineral nutrient uptake of maize under calcareous soil conditions. Commun. Soil Sci. Plant Anal. 2011, 42, 29–38. [Google Scholar] [CrossRef]
  81. Yamaji, N.; Xia, J.X.; Mitani-Ueno, N.; Yokosho, K.; Ma, J.F. Preferential delivery of zinc to developing tissues in rice is mediated by P-Type heavy metal ATPase OsHMA2. Plant Physiol. 2013, 162, 927–939. [Google Scholar] [CrossRef]
  82. Jiang, Y.; Zhou, H.; Gu, J.F.; Zeng, P.; Liao, B.H.; Xie, Y.H.; Ji, X.H. Combined amendment improves soil health and brown rice quality in paddy soils moderately and highly co-contaminated with Cd and As. Environ. Pollut. 2022, 295, 118590. [Google Scholar] [CrossRef]
  83. Malandrino, M.; Abollino, O.; Buoso, S.; Giacomino, A.; La Gioia, C.; Mentasti, E. Accumulation of heavy metals from contaminated soil to plants and evaluation of soil remediation by vermiculite. Chemosphere 2011, 82, 169–178. [Google Scholar] [CrossRef]
  84. Zanin, L.; Tomasi, N.; Cesco, S.; Varanini, Z.; Pinton, R. Humic substances contribute to plant iron nutrition acting as chelators and biostimulants. Front. Plant Sci. 2019, 10, 00675. [Google Scholar] [CrossRef] [PubMed]
  85. Nakandalage, N.; Seneweera, S. Chapter 12—Micronutrients use efficiency of crop-plants under changing climate. In Plant Micronutrient Use Efficiency; Hossain, M.A., Kamiya, T., Burritt, D.J., Phan Tran, L.-S., Fujiwara, T., Eds.; Academic Press: Cambridge, MA, USA, 2018; pp. 209–224. [Google Scholar]
  86. Bracci, E.L.; Keogh, J.B.; Milte, R.; Murphy, K.J. A comparison of dietary quality and nutritional adequacy of popular energy-restricted diets against the Australian Guide to Healthy Eating and the Mediterranean Diet. Br. J. Nutr. 2022, 128, 1357–1370. [Google Scholar] [CrossRef] [PubMed]
  87. Gao, L.; Chang, J.D.; Chen, R.J.; Li, H.B.; Lu, H.F.; Tao, L.X.; Xiong, J. Comparison on cellular mechanisms of iron and cadmium accumulation in rice: Prospects for cultivating Fe-rich but Cd-free rice. Rice 2016, 9, 39. [Google Scholar] [CrossRef]
  88. Kailasam, S.; Peiter, E. A path toward concurrent biofortification and cadmium mitigation in plant-based foods. New Phytol. 2021, 232, 17–24. [Google Scholar] [CrossRef] [PubMed]
  89. Giasuddin, A.S.M.; Jhuma, K.A.; Hossain, M.S.; Haq, A.M.M.J.B.J.o.M.S. Considerations for rice (Oryza sativa) fortification with essential micronutrients in public health intervention. Bangladesh J. Med. Sci. 2020, 19, 189–193. [Google Scholar] [CrossRef]
  90. Calderon, F.J.; Reeves, J.B.; Collins, H.P.; Paul, E.A. Chemical differences in soil organic matter fractions determined by diffuse-reflectance mid-infrared spectroscopy. Soil Sci. Soc. Am. J. 2011, 75, 568–579. [Google Scholar] [CrossRef]
  91. Zhao, J.; Huang, X.; Shi, Y.; Song, X.; Qin, Z.; Tang, J. FTIR characteristics of rhizosphere soil of multi-generation continuous Eucalyptus plantation in South Subtropical Region. Ecol. Environ. Sci. 2022, 31, 688–694. (In Chinese) [Google Scholar]
  92. Ma, F.; Du, C.W.; Zhou, J.M.; Shen, Y.Z. Investigation of soil properties using different techniques of mid-infrared spectroscopy. Eur. J. Soil Sci. 2019, 70, 96–106. [Google Scholar] [CrossRef]
  93. Cui, L.Q.; Pan, G.X.; Li, L.Q.; Bian, R.J.; Liu, X.Y.; Yan, J.L.; Quan, G.X.; Ding, C.; Chen, T.M.; Liu, Y.; et al. Continuous immobilization of cadmium and lead in biochar amended contaminated paddy soil: A five-year field experiment. Ecol. Eng. 2016, 93, 1–8. [Google Scholar] [CrossRef]
  94. Janik, L.J.; Skjemstad, J.O.; Shepherd, K.D.; Spouncer, L.R. The prediction of soil carbon fractions using mid-infrared-partial least square analysis. Aust. J. Soil Res. 2007, 45, 73–81. [Google Scholar] [CrossRef]
  95. Hall, S.J.; Berhe, A.A.; Thompson, A. Order from disorder: Do soil organic matter composition and turnover co-vary with iron phase crystallinity? Biogeochemistry 2018, 140, 93–110. [Google Scholar] [CrossRef] [Green Version]
  96. Zhang, M.Y.; Zhu, Z.L.; Li, H.H.; Feng, C.L.; An, S.S. Comparison and application of different fourier transform infrared spectroscopy to soil spectral characteristics analysis. Res. Soil Water Conserv. 2022, 29, 121–128. (In Chinese) [Google Scholar] [CrossRef]
  97. Srivastava, M.; Mishra, A.K. Comparative responses of diazotrophic abundance and community structure to the chemical composition of paddy soil. Environ. Sci. Pollut. R. 2018, 25, 399–412. [Google Scholar] [CrossRef]
  98. Li, T.; Zhao, S.W.; Li, X.X.; M, S. Characters of soil organic matter functional groups in the fields planted with alfalfa (Medi-cago sativa) for different years in hilly regions of South Ningxia, Northwest China. Chin. J. Appl. Environ. Biol. 2012, 23, 3266–3272. (In Chinese) [Google Scholar] [CrossRef]
  99. Li, Z.; Liu, S.; Liu, J.; Li, D.; Liu, F. Characteristics and influencing factors of soil organic carbon functional groups in coastal wetlands with different. Chin. J. Appl. Ecol. 2022, 28, 276–282. (In Chinese) [Google Scholar] [CrossRef]
  100. Wu, W.X.; Yang, M.; Feng, Q.B.; McGrouther, K.; Wang, H.L.; Lu, H.H.; Chen, Y.X. Chemical characterization of rice straw-derived biochar for soil amendment. Biomass Bioenerg. 2012, 47, 268–276. [Google Scholar] [CrossRef]
  101. Nkoumbou, C.; Villieras, F.; Barres, O.; Bihannic, I.; Pelletier, M.; Razafitianamaharavo, A.; Metang, V.; Ngoune, C.Y.; Njopwouo, D.; Yvon, J. Physicochemical properties of talc ore from Pout-Kelle and Memel deposits (Central Cameroon). Clay Miner. 2008, 43, 317–337. [Google Scholar] [CrossRef]
  102. Du, C.W.; Zhou, J.M.; Goyne, K.W. Organic and inorganic carbon in paddy soil as evaluated by mid-infrared photoacoustic spectroscopy. PLoS ONE 2012, 7, e43368. [Google Scholar] [CrossRef]
  103. Wang, S.; Wang, N.; Yao, K.; Fan, Y.C.; Li, W.H.; Han, W.H.; Yin, X.H.; Chen, D.Y. Characterization and interpretation of Cd (II) adsorption by different modified rice straws under contrasting conditions. Sci. Rep. 2019, 9, 17868. [Google Scholar] [CrossRef] [PubMed] [Green Version]
Figure 1. Scanning electron microscope image ((A), ×2000 magnification; (B), ×10,000 magnification), energy dispersive spectra (C) and Fourier transform infrared spectra (D) of mineral-based potassium humate (MBPH).
Sustainability 15 02836 g001
Figure 2. Effects of the application of mineral-based potassium humate (MBPH) on Cd in soil solution at the tillering stage of rice for M-Cd and H- Cd soils. M-Cd, moderately contaminated soil (2 mg kg−1); H-Cd, highly contaminated soil (4 mg kg−1). Lowercase letters indicate significant differences in different MBPH levels under the same Cd-contaminated soil (p < 0.05, Duncan test and Kruskal–Wallis test); asterisks (*) indicate significant differences among different Cd-contaminated soils at the same level of MBPH application (** p < 0.01, *** p < 0.001, T-test).
Sustainability 15 02836 g002
Figure 3. Effects of the application of mineral-based potassium humate (MBPH) on the mineral nutrients (Fe (A), Mn (B), Cu (C), Zn (D), K (E)) of brown rice under different soil contaminated levels. SCd, slightly contaminated soil (1 mg kg−1); M-Cd, moderately contaminated soil (2 mg kg−1); H-Cd, highly contaminated soil (4 mg kg−1). Lowercase letters indicate significant differences in different MBPH levels under the same Cd-contaminated soil; capital letters indicate significant differences among different Cd-contaminated soils at the same level of MBPH application (p < 0.05, Duncan test and Kruskal–Wallis test).
Sustainability 15 02836 g003
Figure 4. Effects of the application of mineral-based potassium humate (MBPH) on Cd concentration in rice roots (A), stems (B), ordinary leaves (C), flag leaves (D), and brown rice (E) under different soil contaminated levels. SCd, slightly contaminated soil (1 mg kg−1); M-Cd, moderately contaminated soil (2 mg kg−1); H-Cd, highly contaminated soil (4 mg kg−1). Lowercase letters indicate significant differences in different MBPH levels under the same Cd-contaminated soil; capital letters indicate significant differences among different Cd-contaminated soils at the same level of MBPH application (p < 0.05, Duncan test and Kruskal–Wallis test).
Sustainability 15 02836 g004
Figure 5. Effects of the application of mineral-based potassium humate (MBPH) on the soil DTPA−Cd of rhizosphere soil at the maturity stage of rice under different soil contaminated levels. S-Cd, slightly contaminated soil (1 mg kg−1); M-Cd, moderately contaminated soil (2 mg kg−1); H-Cd, highly contaminated soil (4 mg kg−1). Lowercase letters indicate significant differences in different MBPH levels under the same Cd-contaminated soil; capital letters indicate significant differences among different Cd-contaminated soils at the same level of MBPH application (p < 0.05, Duncan test and Kruskal–Wallis test).
Sustainability 15 02836 g005
Figure 6. Effects of the application of mineral-based potassium humate (MBPH) on the Fourier transform infrared spectra of rhizosphere soil at the maturity stage of rice under different soil contaminated levels. S-Cd (A), slightly contaminated soil (1 mg kg−1); M-Cd (B), moderately contaminated soil (2 mg kg−1); H-Cd (C), highly contaminated soil (4 mg kg−1).
Sustainability 15 02836 g006
Table 1. Model summary of stepwise multiple linear regression.
Soil Cd
Contaminated Level
Stepwise Multiple Linear Regression aANOVA bAll ParametersNo.
EquationR2adjFpp
S-CdLog [CCd in brown rice] = −0.811 − 0.367log [CMK] − 0.278log [VMPn]0.969171.96.7648 × 10−8 ***<0.01(1)
M-CdLog [CCd in brown rice] = −0.902 − 3.014log [CTDOC] − 0.214log [CFK]0.9782481.3467 × 10−8 ***<0.05(2)
H-CdLog [CCd in brown rice] = 2.532 − 0.664log [VTFstem-flag leaf] − 0.666log [CK in brown rice] –3.09log [CFDOC]0.975141.642.8481 × 10−7 ***<0.05(3)
AllLog [CCd in brown rice] = 0.727 − 0.826log [CZn in brown rice] + 0.428log [VTFstem-flag leaf] + 0.458log [Csoil DTPA-Cd] + 0.581log [VTFstem-brown rice]0.939136.213.3602 × 10−19 ***<0.01(4)
a R2adj. = Adjusted R square, coefficient of determination. b p = Prob > F. F-test showed the significant differences between the two groups of data. S-Cd, slightly contaminated soil (1 mg kg−1); M-Cd, moderately contaminated soil (2 mg kg−1); H-Cd, highly contaminated soil (4 mg kg−1); T, Tillering stage; F, Filling stage; M, Maturity stage. *** represents p values less than 0.001.
Disclaimer/Publisher’s Note: The statements, opinions and data contained in all publications are solely those of the individual author(s) and contributor(s) and not of MDPI and/or the editor(s). MDPI and/or the editor(s) disclaim responsibility for any injury to people or property resulting from any ideas, methods, instructions or products referred to in the content.

