Article

Prediction of Changes to the Suitable Distribution Area of Fritillaria przewalskii Maxim. in the Qinghai-Tibet Plateau under Shared Socioeconomic Pathways (SSPs)

1
School of Geography Science, Qinghai Normal University, Xining 810008, China
2
School of Life Science, Qinghai Normal University, Xining 810008, China
3
School of Chemistry and Chemical Engineering, Qufu Normal University, Jining 273165, China
4
School of Chemistry and Chemical Engineering, Qinghai Normal University, Xining 810008, China
*
Author to whom correspondence should be addressed.
These authors contributed equally to this work.
Sustainability 2023, 15(3), 2833; https://doi.org/10.3390/su15032833
Submission received: 26 December 2022 / Revised: 22 January 2023 / Accepted: 2 February 2023 / Published: 3 February 2023
(This article belongs to the Section Sustainability, Biodiversity and Conservation)

Abstract

:
The Qinghai–Tibet Plateau has given birth to many indigenous highland plants due to its special geographical location and sensitivity to climate change. Relevantly, the impact of climate change on species distribution has been a hot issue for research in biogeography. Using the maximum entropy (MaxEnt) model, the spatial distribution of habitat suitability for Fritillaria przewalskii Maxim. (FPM) on the Tibetan Plateau was predicted and ranked by combining ecological data and information on its actual current geographical distribution. The potential distribution and trends of FPM on the Tibetan Plateau from 2021 to 2040, 2041 to 2060, 2061 to 2080 and 2081 to 2100 under four current and future climate scenarios (SSP126, SSP245, SSP370 and SSP585) were also predicted. The predictions were found to be highly accurate with AUC values of 0.9645 and 0.9345 for the training and test sets, respectively. A number of conclusions could be drawn from the results. Firstly, the main ecological factors limiting the growth distribution of FPM were the Vegetation types, NPP (net primary production), Soil types, Bio7 (temperature annual range), Pop (population), Slope, GDP, Aspect, Bio1 (annual mean temperature) and Elevation, with a cumulative contribution of 97.6%. Secondly, in the recent past period of 1970–2000, the total suitable distribution area of FPM accounted for 5.55% of the plateau’s total area, which was about 14.11 × 10⁴ km2, concentrated in its eastern and central regions. Thirdly, compared to the previous period, the aforementioned distribution area will, for the period spanning 2021–2040, increase by 14.48%, 16.23%, 16.99%, and 21.53% in the SSP126, SSP245, SSP370, and SSP585 scenarios, respectively. This comes with an overall expansion trend, and the areas predicted to be affected are concentrated in the eastern and central-western parts of the Tibetan Plateau. The other three future periods 2041–2060, 2061–2080, and 2081–2100 also show increases in these total areas to varying degrees. It is noteworthy that in the future periods 2061–2080 and 2081–2100, under the SSP370 and SSP585 scenarios, the area of high suitable distribution decreases or even disappears. Lastly, under the four climate scenarios, the FPM suitable distribution area will shift towards the western part of the Tibetan Plateau.

1. Introduction

The Tibetan Plateau is the most unique geo-ecological unit on Earth today. It possesses a distinct set of biological resources, and holds an important place in the world’s biodiversity map [1]. It has undergone complex and large-scale environmental evolution throughout its geological history, particularly during an uplift process which caused regional and global climate change [2]. A series of geological movements and evolutions have contributed to and shaped its unique climatic patterns and those of its surrounding areas. It is important to understand the environmental development of southwest China’s monsoon climate, which has typically been characterized by seasonal precipitation, from ancient times through to the present day [3]. Over the course of the region’s environmental evolution, many factors, including changes to topographic and climatic conditions, have led to a series of transformations to the organisms which inhabit the region. In turn, this has resulted in a transition in the distribution of various species (seed plant species) thereby affecting biodiversity, with some becoming more suitable for survival, while others, unable to adapt to the environmental changes, migrated to other areas or became extinct [4].
The plants of the Tibetan Plateau region are generally short, sparse, and tolerant to cold and drought conditions, forming a complex ecosystem of flora. FPM is a perennial herb of the genus Fritillaria in the family Phyllanthaceae. FPM is one of the main sources of the herb ‘Chuanbei’, an effective medicine for alleviating fevers, dryness in the lungs, reducing phlegm, and relieving coughing. The 2020 edition of the Chinese Pharmacopoeia records, that in addition to Fritillaria przewalskii Maxim., the original plant of Chuanbei Mu also includes F. cirrhosa D. Don, F. unibracteata Hsiao et K. C. Hsia, and F. delavayi Franch [5]. It is regarded as one of the most valuable Chinese medicinal plants [5]. In recent years, due to the rapid expansion of the Chinese medicine industry, the demand for medicinal herbs has grown significantly. An adverse effect of this is the serious over-harvesting and gradual scarcity of original plant resources of Fritillaria. Some scholars in China have conducted research on the conservation of endangered plants [6]. However, because of the long growth cycle of Fritillaria plants, its low yield and a lack of seeds produced under natural conditions, the artificial cultivation and management of this species has proven difficult, and is also coupled with high initial investment costs [7]. Therefore, the study of the Chinese herbal medicine, Chuanbei Mu’s different basal origins and their habitat suitability, as well as the clarification of their suitable range, has become an urgent problem [8].
In the context of global warming, both precipitation and atmospheric water content have steadily increased in Northwestern China [9], while in recent years, the climate of the Tibetan Plateau has also gradually become warmer and more humid [10]. Furthermore, climate change can also cause changes in the distribution of suitable areas for plant growth. Species-distribution models (SDMs) are an important method to simulate the spatial distribution of species, assess the potential response of organisms to climate change, and determine the geographical distribution of species under specific spatial–temporal conditions based on environmental variables [11]. Among all SDMs, the maximum entropy (MaxEnt) model has relatively high prediction accuracy, and a small quantity of data can be used to determine species distribution range according to environmental variables [12]. In recent years, with the rapid development of the Traditional Chinese Medicine (TCM) health industry, the economic benefits of medicinal plant resources are becoming more and more significant. However, the scarcity of wild resources and people’s indiscriminate mining has led to the exhaustion of FPM resources. As one of the endangered plants, the distribution of FPM in the natural environment is particularly important. MaxEnt is a predictive model which applies the principle of maximum entropy, wherein an entity is closest to its true form when in a state with the highest entropy, which is closest to its real state. Based on incomplete information concerning the geographical distribution of existing species, the probability distribution with the highest entropy (i.e., the most uniform distribution) is identified as the optimal one. In other words, the model predicts the most suitable area for a species to be distributed now and in the future [13]. Studies have shown that the MaxEnt model, combined with GIS spatial analysis techniques, has shown unique advantages for the simulation of habitat suitability for plants [14], such as Oryza sativa L. [15], Stipa purpurea [16], Cornus officinalis [17], and Parnassia wightiana [18].
The wild plant resources of FPM are predominantly distributed in the high-altitude mountainous areas or plateau grasslands across the eastern Tibetan Plateau and its margins. These areas overlap with the distribution areas of other Fritillaria plants, making it difficult to determine the taxonomic boundaries of the species [19]. Therefore, field surveys were used to identify distribution points, the sample points obtained from which were more reliable and closer to real patterns. The MaxEnt model was applied to the results in combination with climate data, soil types, vegetation types, topographic data, and social economy data, each for different future periods (2021–2040, 2041–2060, 2061–2080, and 2081–2100). Bioclimatic data simulate global climate change in the next 80 years based on different social economic pathways (SSPs). Different SSP modes represent different carbon-dioxide emission backgrounds. They include four scenarios (SSP126, SSP245, SSP370, and SSP585). On this basis, the habitat suitability distribution of FPM was studied to provide reference for the work of planting zoning and site selection of FPM. As one of the endangered plants, it has become an urgent problem to study the habitat suitability of FPM and clarify its suitable range. In this work, the MaxEnt model was used to draw the potential distribution map of FPM under current and future climate conditions, and its characteristics were analyzed to provide theoretical basis for the protection of FPM primary habitat and biogeography research.

2. Materials and Methods

2.1. Study Area

The Qinghai–Tibet Plateau extends from the Pamir Plateau in the west to the Hengduan Mountains in the east, and from the southern edge of the Himalayas in the south to the northern side of the Kunlun–Qilian Mountains in the north. Specifically, it ranges from 25°59′37′′ N to 39°49′33′′ N and from 73°29′56′′ E to 104°40′20′′ E, with a total boundary length of 11745.96 km, total area of 2.542 × 10⁴ km2, and an average altitude of over 4000 m [20]. Due to the unique geographical and climatic conditions, the plateau has developed very particular ecosystems and biodiversity which show characteristics typical of alpine regions [21]. The last few decades have seen the suitable distribution areas of many endemic species on the Tibetan Plateau shrink due to climate change, making it a hotspot for conservation efforts for endangered organisms [22]. FPM is primarily distributed in the eastern part of the Tibetan Plateau (such as southern Gansu Province, in the Taohe Valley, eastern and southern Qinghai Province, and western Sichuan), where it grows in thickets or grasslands at altitudes of 2800–4400 m [23]. In addition, its flower is usually single, pale yellow, with black-purple speckles. Bracts are leafy, apex slightly curled or not curled. The nectary fossae of perianth segments are not obvious. Anthers’ subbase, filaments papillate. Stigma lobes are usually very short, wings on capsule ribs are very narrow, blooming from June to July, fruiting in August [5].

2.2. Data Collection

Due to the overlap between the distribution areas of FPM and various other Fritillaria plants, some errors have been reported in the literature [24]. To ensure the accuracy of the data, the actual distribution sample points for FPM were obtained from fieldwork, which, relating to the Tibetan Plateau, are shown in Figure 1 (52 sample points). The distribution of FPM in the natural environment is sparse and the distribution area is relatively uncertain, so there is no standard method in the literature for reference when collecting the FPM samples. The actual investigation showed that the distribution of FPM was relatively dispersed in small areas, and the number of plants in each distribution area was quite different. FPM prefer to be distributed in shrublands, so each sampling site temporarily referred to the delineation of shrublands’ quadrate and made appropriate adjustments when collecting samples. The quadrate had 10 replicates, and each area was a 5 × 5 m2 survey area [25]. The spatial distance of each sampling site was greater than 5 km. The respective latitude and longitude coordinates, as provided by the BeiDou Navigation Satellite System (BDS), and elevation information are listed in Table A1.
The model data sources were shown in Table A2, including the scope and boundary of the Qinghai–Tibetan Plateau, Elevation data, Soil types, Vegetation types, NDVI (normalized difference vegetation index) [26], NPP (net primary production), Population [27], and Gross Domestic Product (GDP) [28]. Slope and Aspect data were extracted from Elevation data in ArcGIS 10.6 (ArcToolBox-Spatial Analysis-Surface analysis-Slope or Aspect (planar method). Multi-year average climate data for the recent past (1970–2000), and future periods (2021–2040, 2041–2060, 2061–2080, and 2081–2100), were obtained from WorldClim (https://www.worldclim.org/, accessed on 4 November 2022) at a spatial resolution of 2.5′ (~4 km) [29]. The data required covered 19 bioclimatic factors based on thermal and water conditions, including mean annual temperatures and annual precipitation, temperatures and precipitation for all seasons, temperatures during the coldest and warmest months, and precipitation during the wet and dry seasons. The data for future periods and the relevant climate date were based on the latest shared socio-economic pathway climate scenarios published by the IPCC (i.e., SSP126, SSP245, SSP370 and SSP585) and the Sixth International Coupled Model Comparison Program (SICP) implemented by the World Climate Research Program (WCRP) (Sixth International Coupled Model Comparison Program (CMIP 6)) with a spatial resolution of 2.5′ [30]. Climate data for the future acquired from the BCC-CSM2-MR (Beijing Climate Center, Climate System Model) atmospheric circulation model were also used and this model is more suitable for the simulation and prediction in China [31]. The different experimental scenarios in the experiment were rectangular combinations of different shared socioeconomic pathways (SSPs) and radiative-forcing representative concentration pathway (RCP). They were designed to provide critical data support for mechanistic studies into future climate change as well as climate change mitigation and adaptation studies. The four scenario models are represented as follows [32,33]:
(1)
SSP126: upgrade of RCP 2.6 scenario from SSP1 (low forcing scenario) (radiative forcing of 2.6 W/m2 in 2100);
(2)
SSP245: upgrade of the RCP 4.5 scenario from SSP2 (medium forcing scenario) (radiative forcing of 4.5 W/m2 by 2100);
(3)
SSP370: new RCP 7.0 emission pathway based on SSP3 (medium forcing scenario) (radiative forcing of 7.0 W/m2 in 2100);
(4)
SSP585: an upgrade to the RCP 8.5 scenario (8.5 W/m2 in 2100) based on the SSP5 (high forcing scenario).

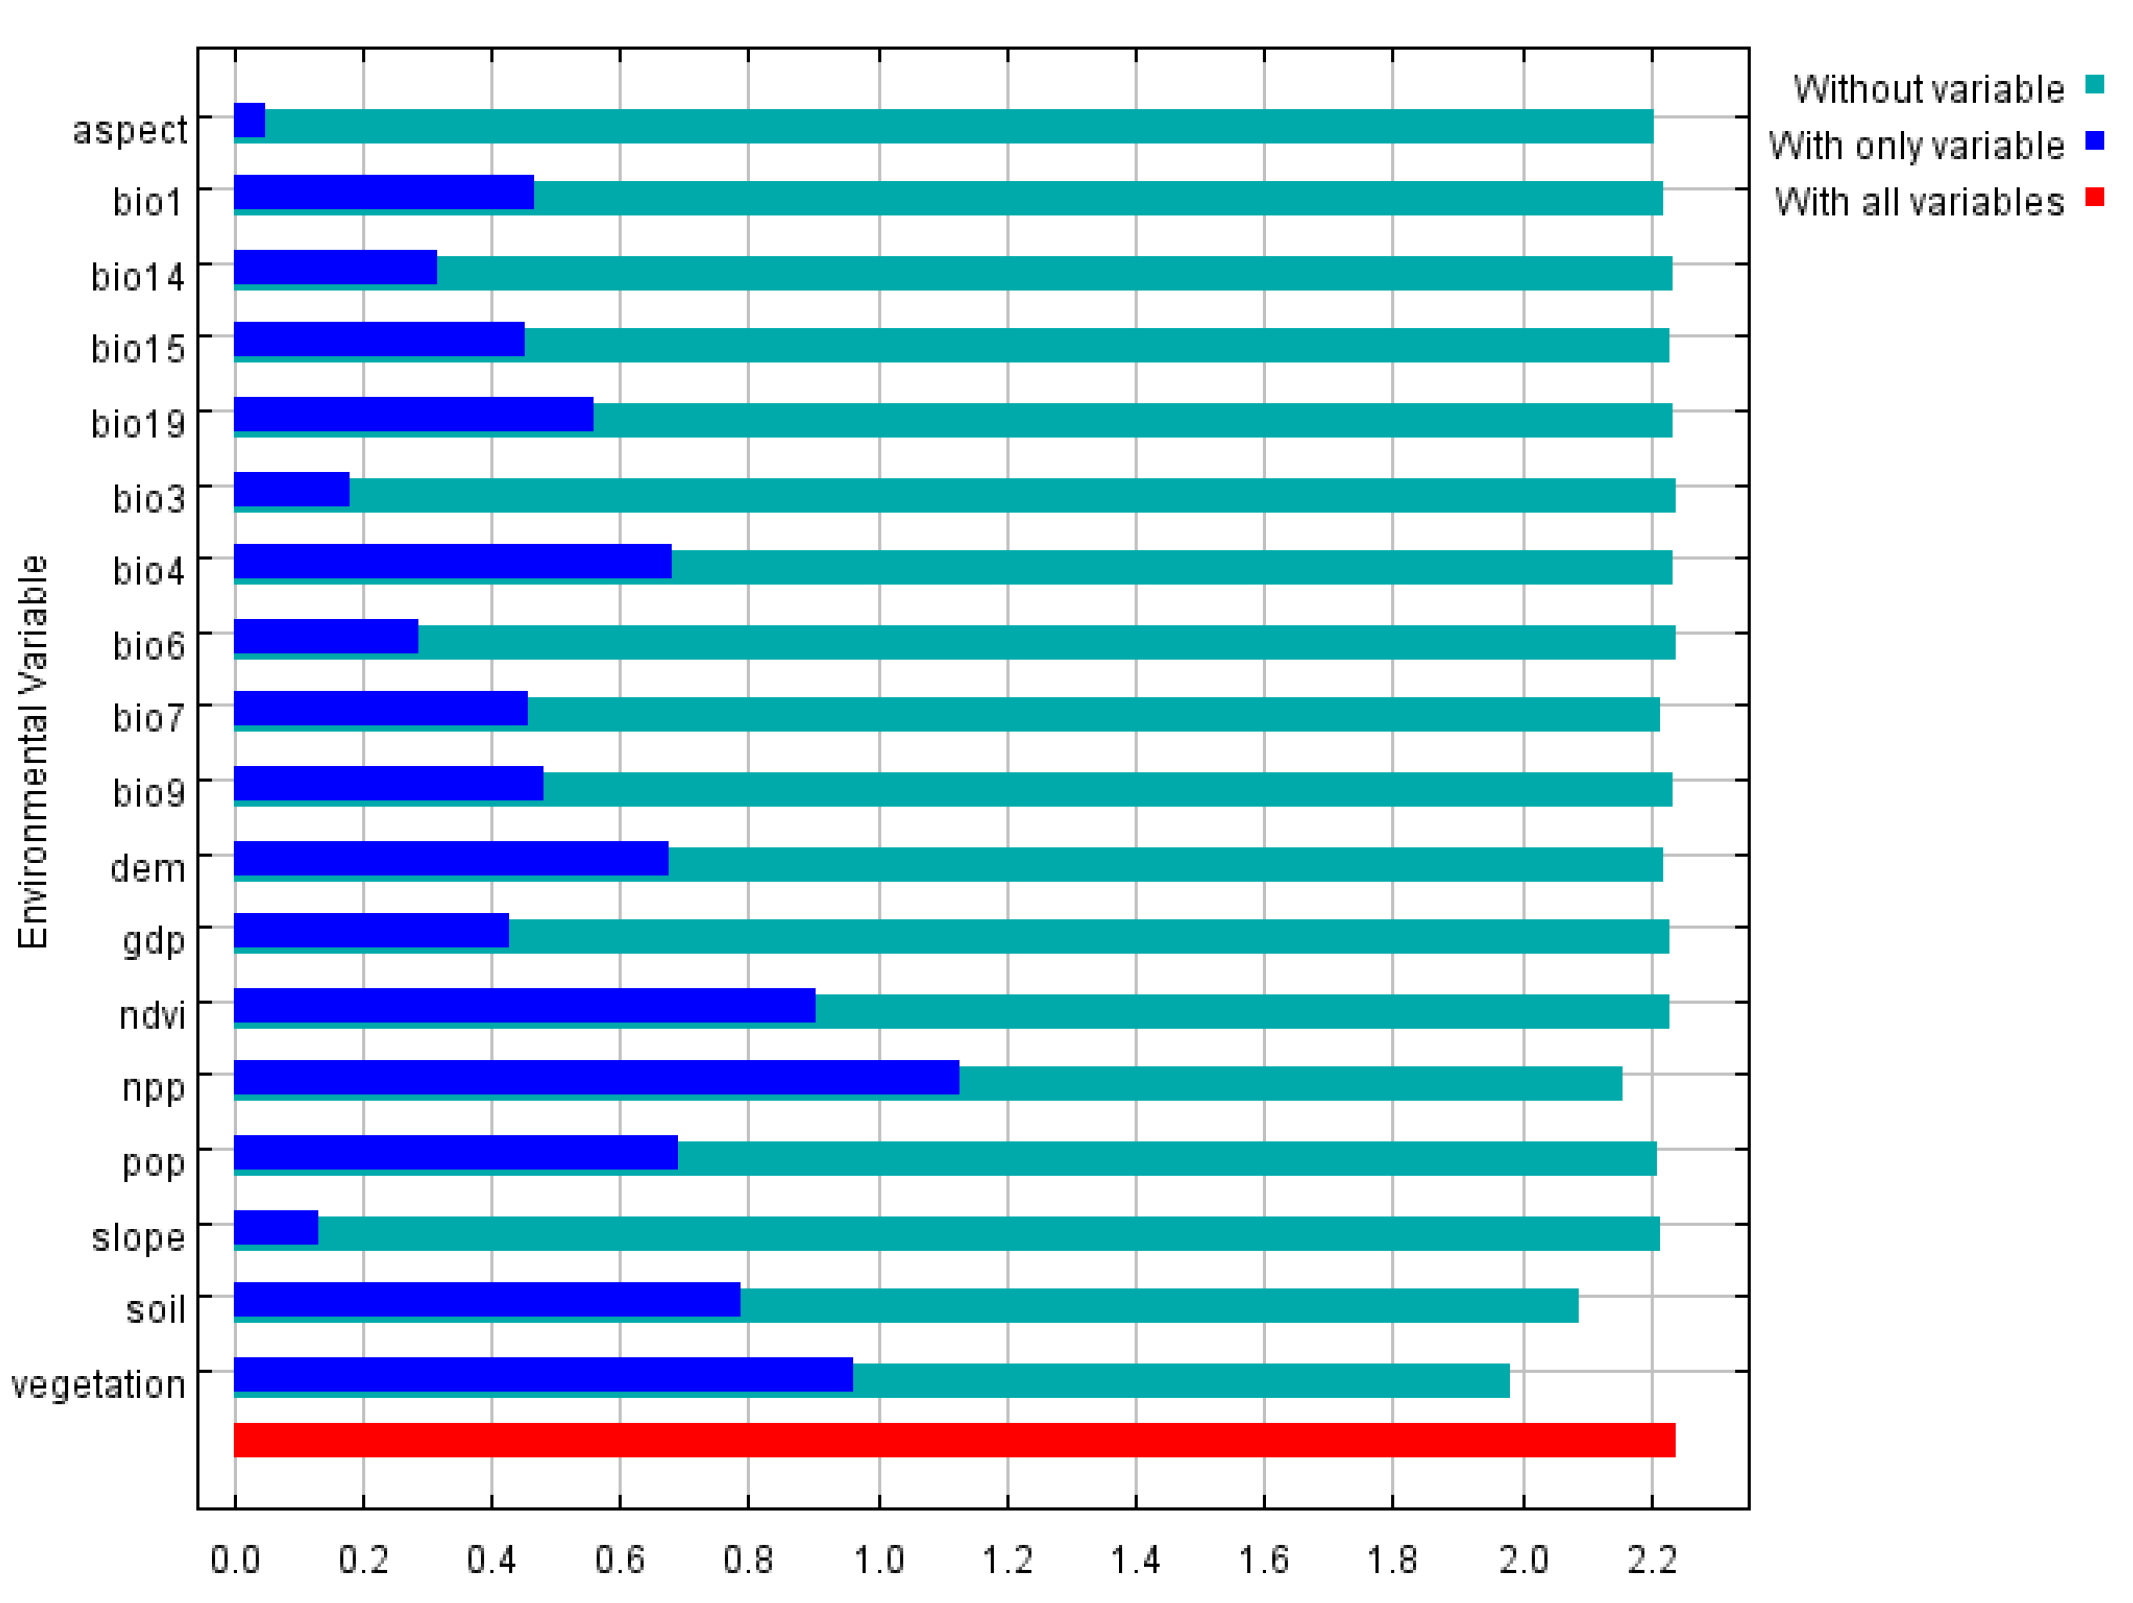
2.3. Screening of Environment Variables

To ensure a strong correlation among the various environmental variables used for model prediction and with the FPM distribution, the 28 candidate factors, which are provided in Table A3, were screened as per the following process.
There were two steps to screen for strongly correlated factors. The first step was to create 1000 random points within the boundary of the Tibetan Plateau, followed by extracting all the factor data contained in these random points. All extracted data were first entered into SPSS 25.0, and the ‘Pearson correlation analyses’ and ‘two-sided test’ options were selected through the analysis, correlation, and bivariate steps. This evaluated the correlation coefficients of each candidate factor with other factors and removed those with correlation coefficients greater than 0.8. ArcGIS 10.6 software was used to extract and convert the raster data from the environmental information to obtain the .asc format file required for running the MaxEnt model. The sample points and all candidate factor layers were then input into MaxEnt 3.4.1 [34] and run ten times to remove those factors with low contribution to the FPM distribution. The contribution rates of the initially screened factors are given in Table 1.
The correlation coefficient data for the screened factors were input into Origin 2021 to obtain a correlation analysis heat map (see Figure 2), for which the final screened factor contribution rates are listed in Table 2.

2.4. Model Construction

The MaxEnt model gave the percentage contribution to the distribution of the species for each factor. The percentage contribution indicates the value of the contribution of each factor to the distribution of the species. The magnitude of the receiver operating characteristic curve (ROC) and area under the curve (AUC) were used as measures of model prediction accuracy. The higher AUC value represents the higher accuracy of the model’s prediction results and the parameters of Maxent model were set according to the literature [35]. All data were resampled to the same resolution(1 km) before model running. The AUC values (to which the Cloglog output model was applied) ranged from (0,1), with a higher value representing a stronger model: 0.6~0.7 represented poor; 0.7~0.8 fair; 0.8~0.9 good; and 0.9~1.0 very good [36,37,38]. This determined the suitability of FPM across the Tibetan Plateau during the recent past period, i.e., the potential distribution area. The common parameters of the model were set as follows: the regularization multiplier was set to 1.1; 25% of the sampled points were taken as the model operation’s validation subset while the other 75% formed the training subset; the model was subject to 10 repeating calculations; Max number of background points was subject to 10,000; Other parameters were as follows: Maximum iterations (500); Convergence threshold (0.00001); Adjust sample radius (0); Default prevalence (0.5). Threads (1); Lq to lap threshold (80); Linear to lq threshold (10); Hinge threshold (15); Beta threshold (−1); Beta categorical (−1); Beta lqp (−1); Beta hinge (−1). In this work, 52 sample points were analyzed. Linear, Quadratic and Hinge Features were used to run the model. In the future model, the filtered factors were imported into the model and model parameters remained in the historical period model. According to the criteria of possibility classification in reference evaluation and existing research results [35,39], the 10 percentile training presence was the cut-off for the unsuitable area (i.e., 0% ≤ p < 30.7%). For the suitable area, there were three levels, namely the minimally (30.7% ≤ p < 65%), moderately (65% ≤ p < 85%), and highly (85% ≤ p < 1) suitable areas.

3. Results

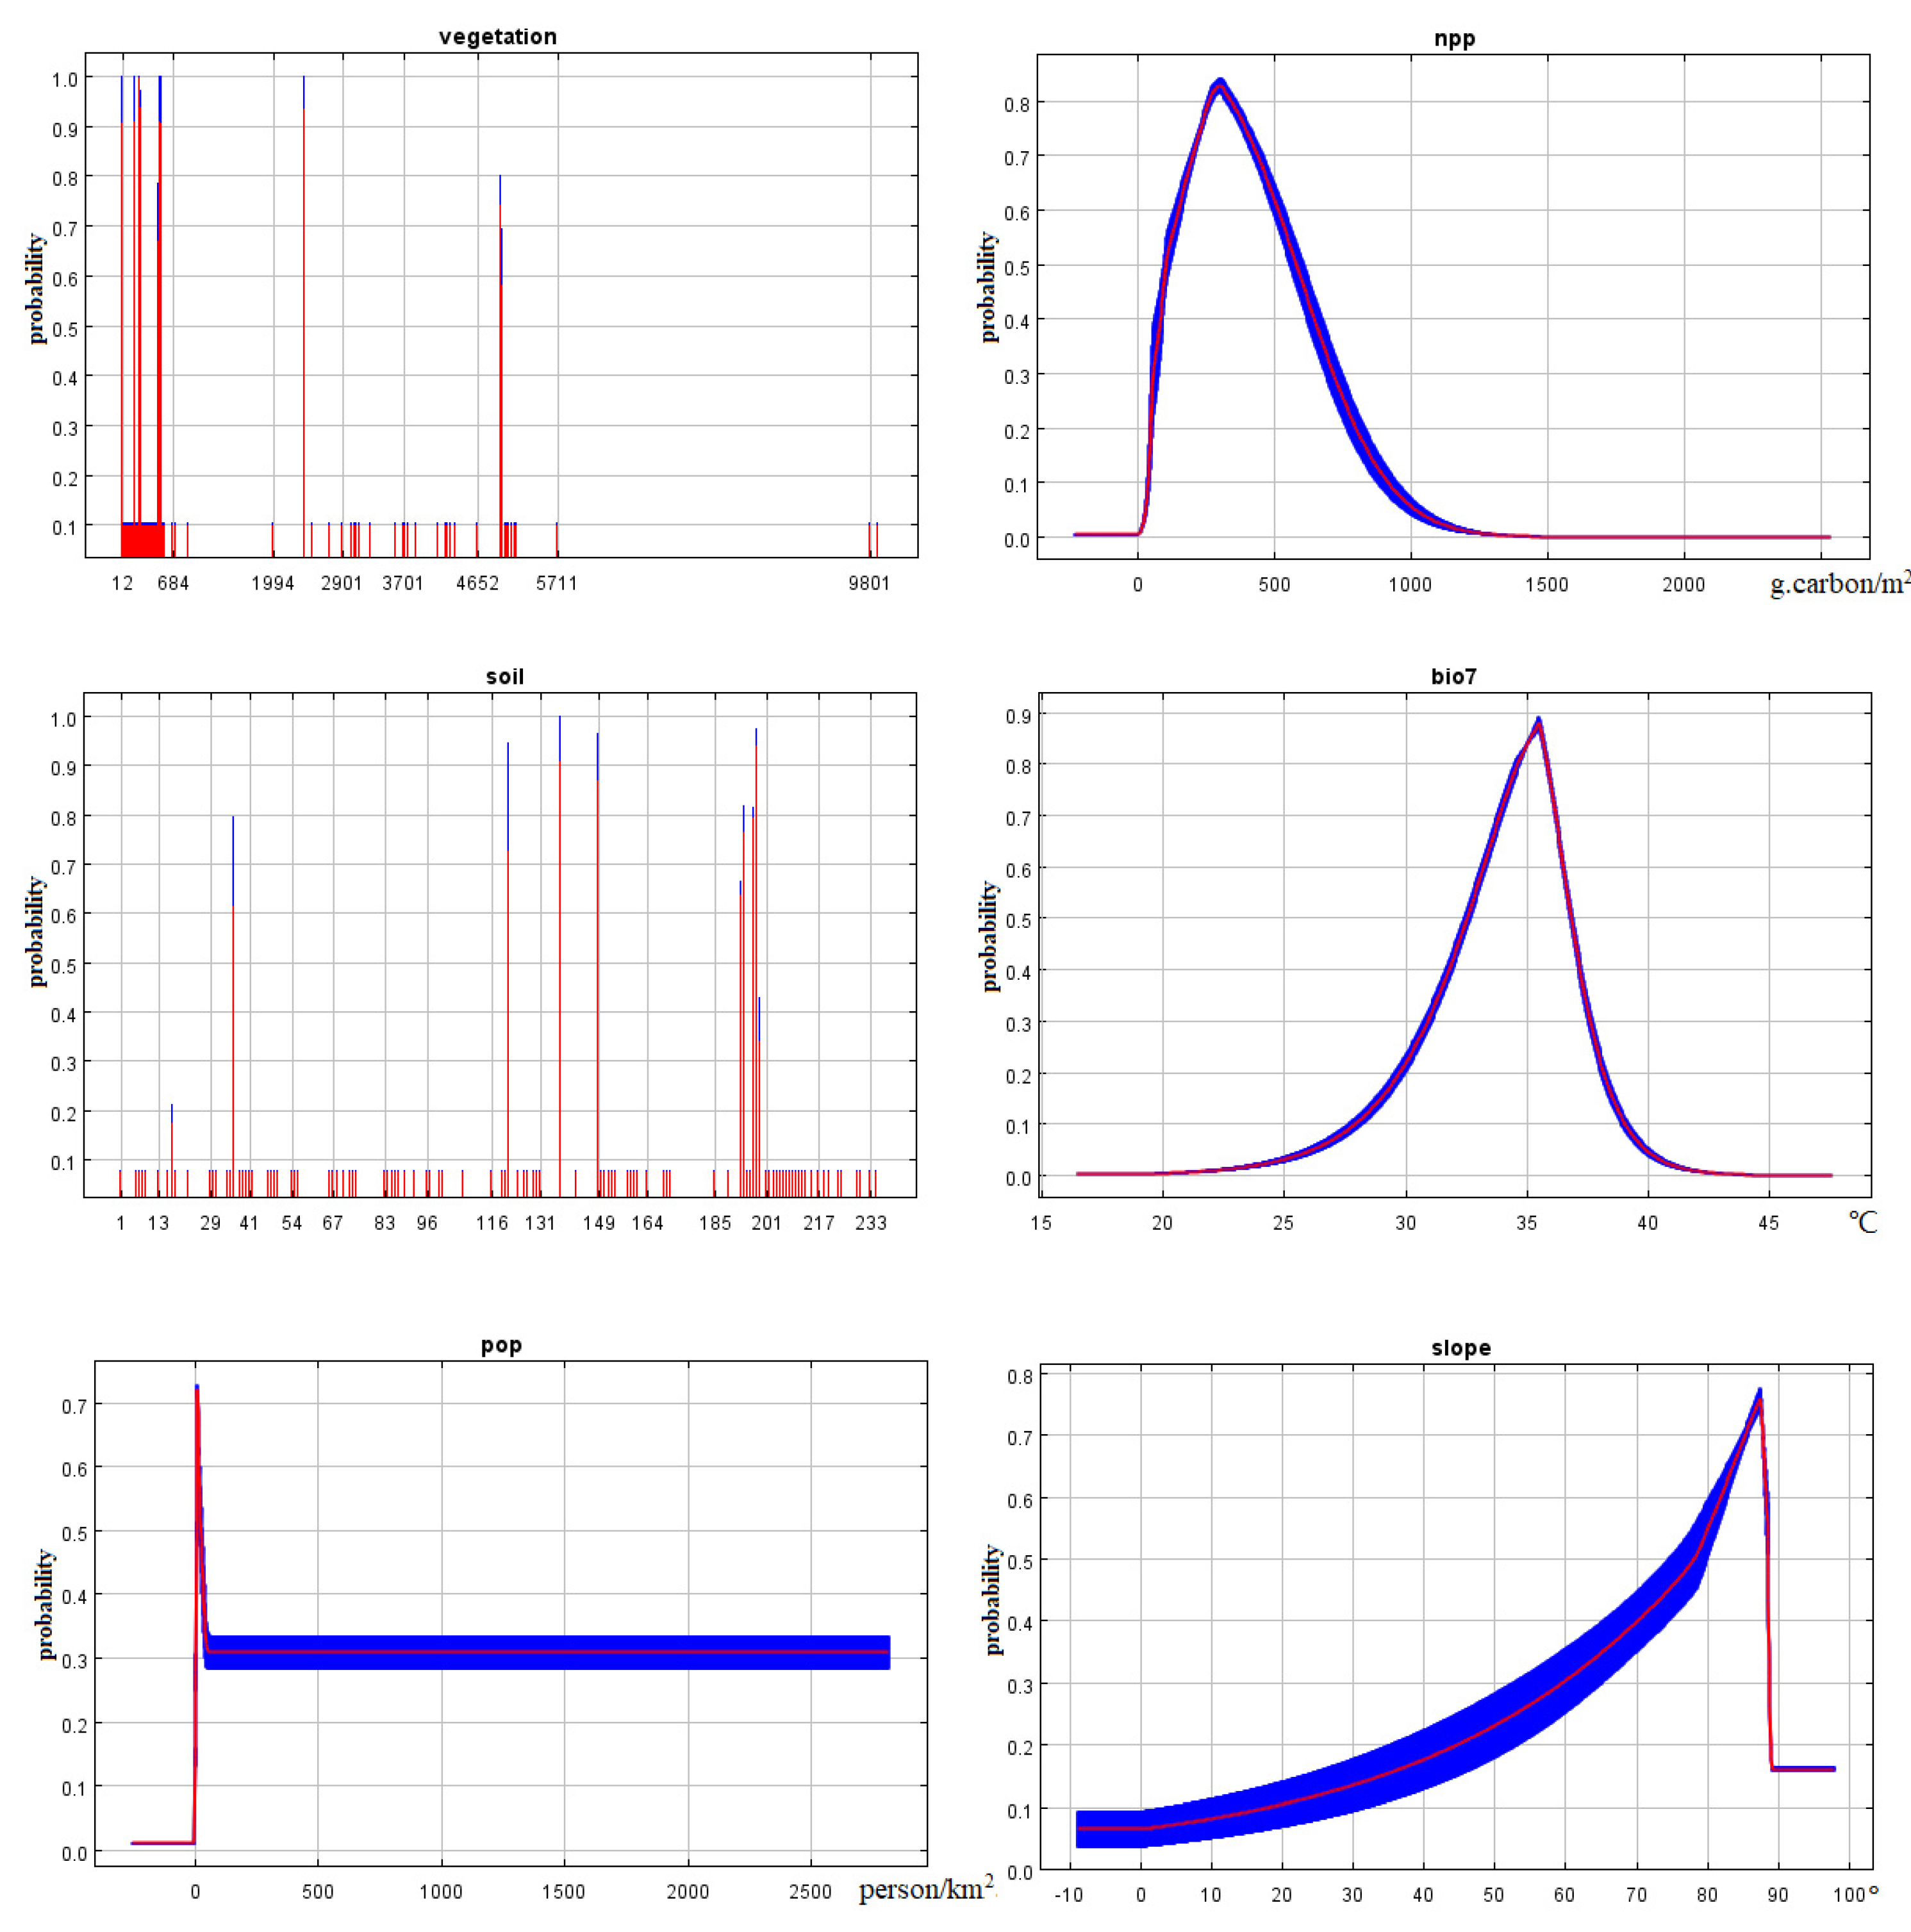
3.1. Suitable Distribution Areas and the Main Environmental Factors in the Historical Period

The model returned values of 0.9645 and 0.9345 for the training and test AUCs, respectively, indicating the model performed to a sufficient standard and its predictions were accurate (see Figure A1). From the results of the MaxEnt (see Figure 3), it can be seen the FPM was primarily distributed across the eastern part of the Tibetan Plateau during the recent past period, with a lower incidence in the northeastern and central areas. In terms of the distribution area, the highly, moderately, and minimally suitable areas covered areas of 8661.06 km2 (accounting for 0.34% of the Tibetan Plateau’s total area), 42,342.96 km2 (1.66%), and 90,158.05 km2 (3.55%), respectively. In total, the suitable distribution area measured 14.12 × 10⁴ km2 which constituted 5.55% of the Tibetan Plateau.
A test plot of the importance of the 18 relevant factors on the FPM distribution was obtained from the Jackknife method in the MaxEnt model (see Figure A2). The blue, green, and red bands indicated the regularization values of training sgain of the species distribution-fitting model only using the climate factor, of removing this climate factor when constructing the model, and of including all climate factors. The model also allowed the calculation of the percentage contribution for each environmental factor to the construction of the model. As observed in Table 2, the main factors contributing to the FPM were Vegetation types, NPP (net primary production), Soil types, Bio7 (temperature annual range), Pop (population), Slope, Bio1 (annual mean temperature), GDP, Aspect, Bio9 (mean temperature of the driest quarter), and elevation. The sum of their overall contributions amounted to 97.6%, and the comprehensive evaluation showed Vegetation types, NPP, and Soil types were the most influential environmental factors. The blue, green, and red bands indicated the regularization training gain values of the species distribution fitting model only using the climate factor, of removing this climate factor when constructing the model, and of including all climate factors. A single-factor response curve was used to investigate the relationship between the potential distribution probability of FPM and the main environmental factors. When the potential distribution probability of FPM was >0.5, the vegetation type was shrub, NPP was 100–600 g.carbon/m2, soil type was alpine soil, the temperature annual range (bio 7) was 33–37 °C; population (pop) was <50 person/km2, and slope was >78°. It should be noted that altitude is not a major environmental factor, but it is also an important feature of the FPM distribution. The slope direction is distributed in all directions. According to the analysis of major environmental factors, FPM mainly prefer to be distributed in high altitude areas with rich soil organic matter, a large temperature difference between day and night, and a large slope (Figure A3).

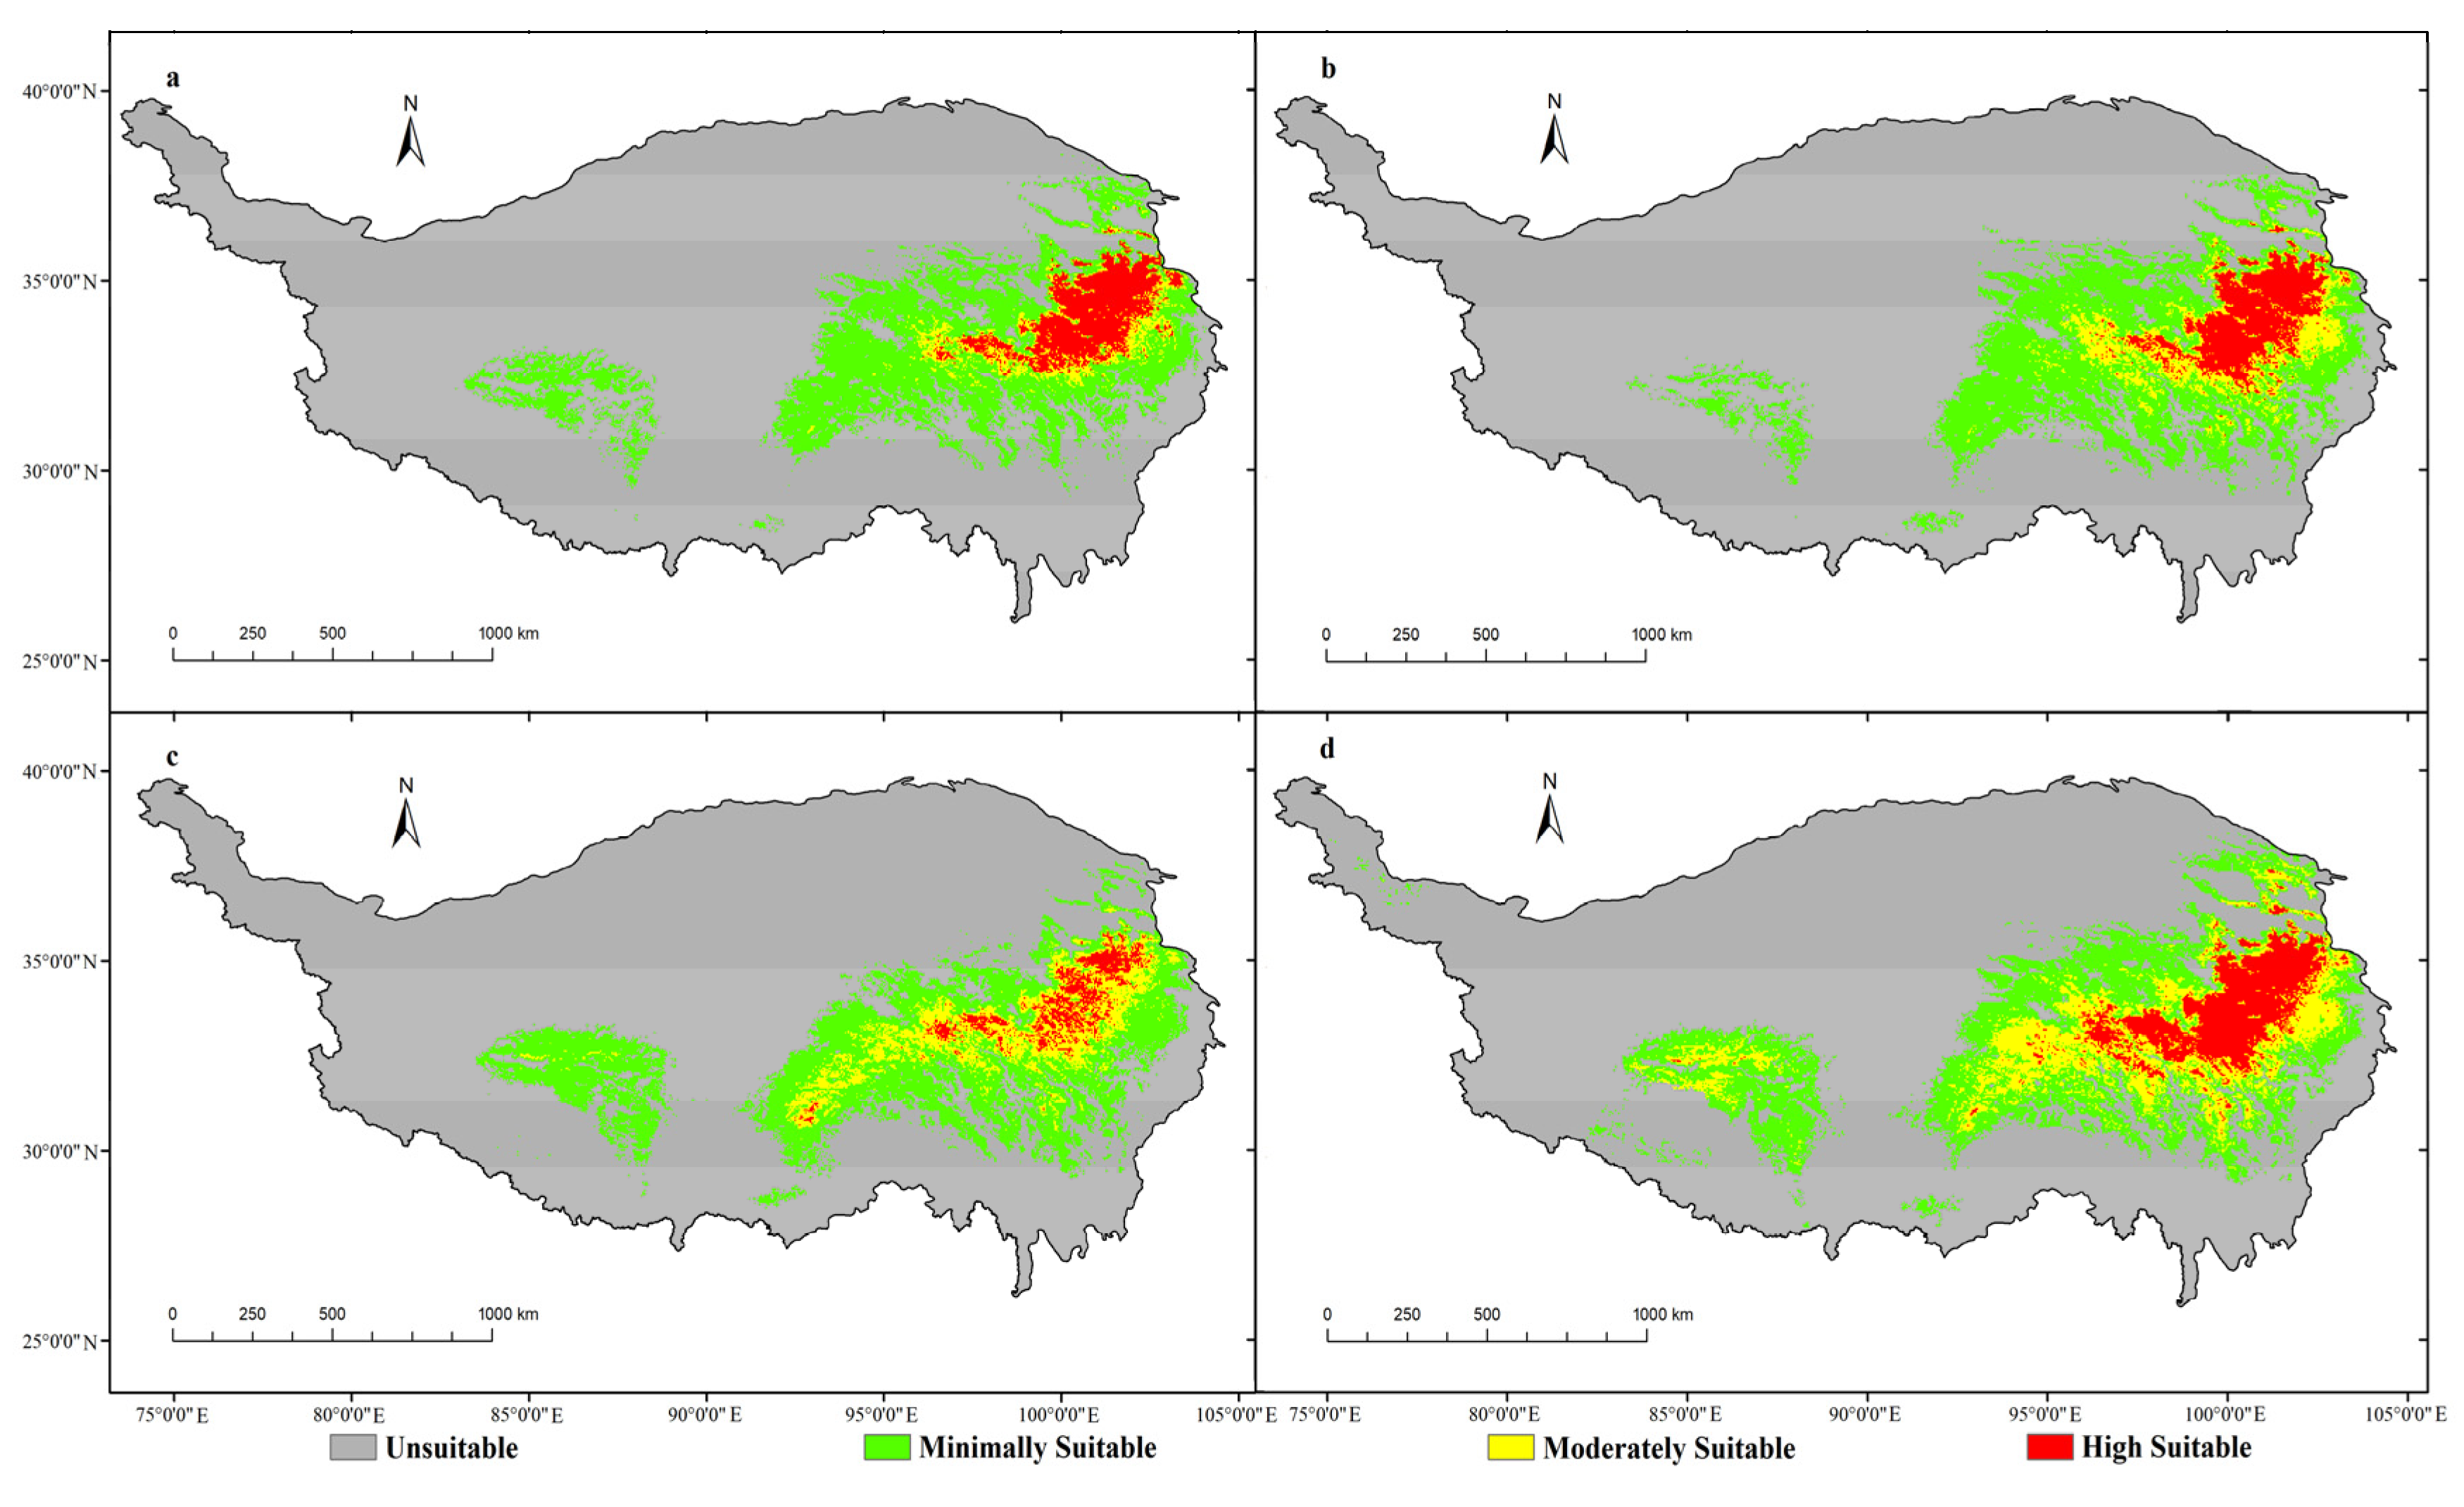
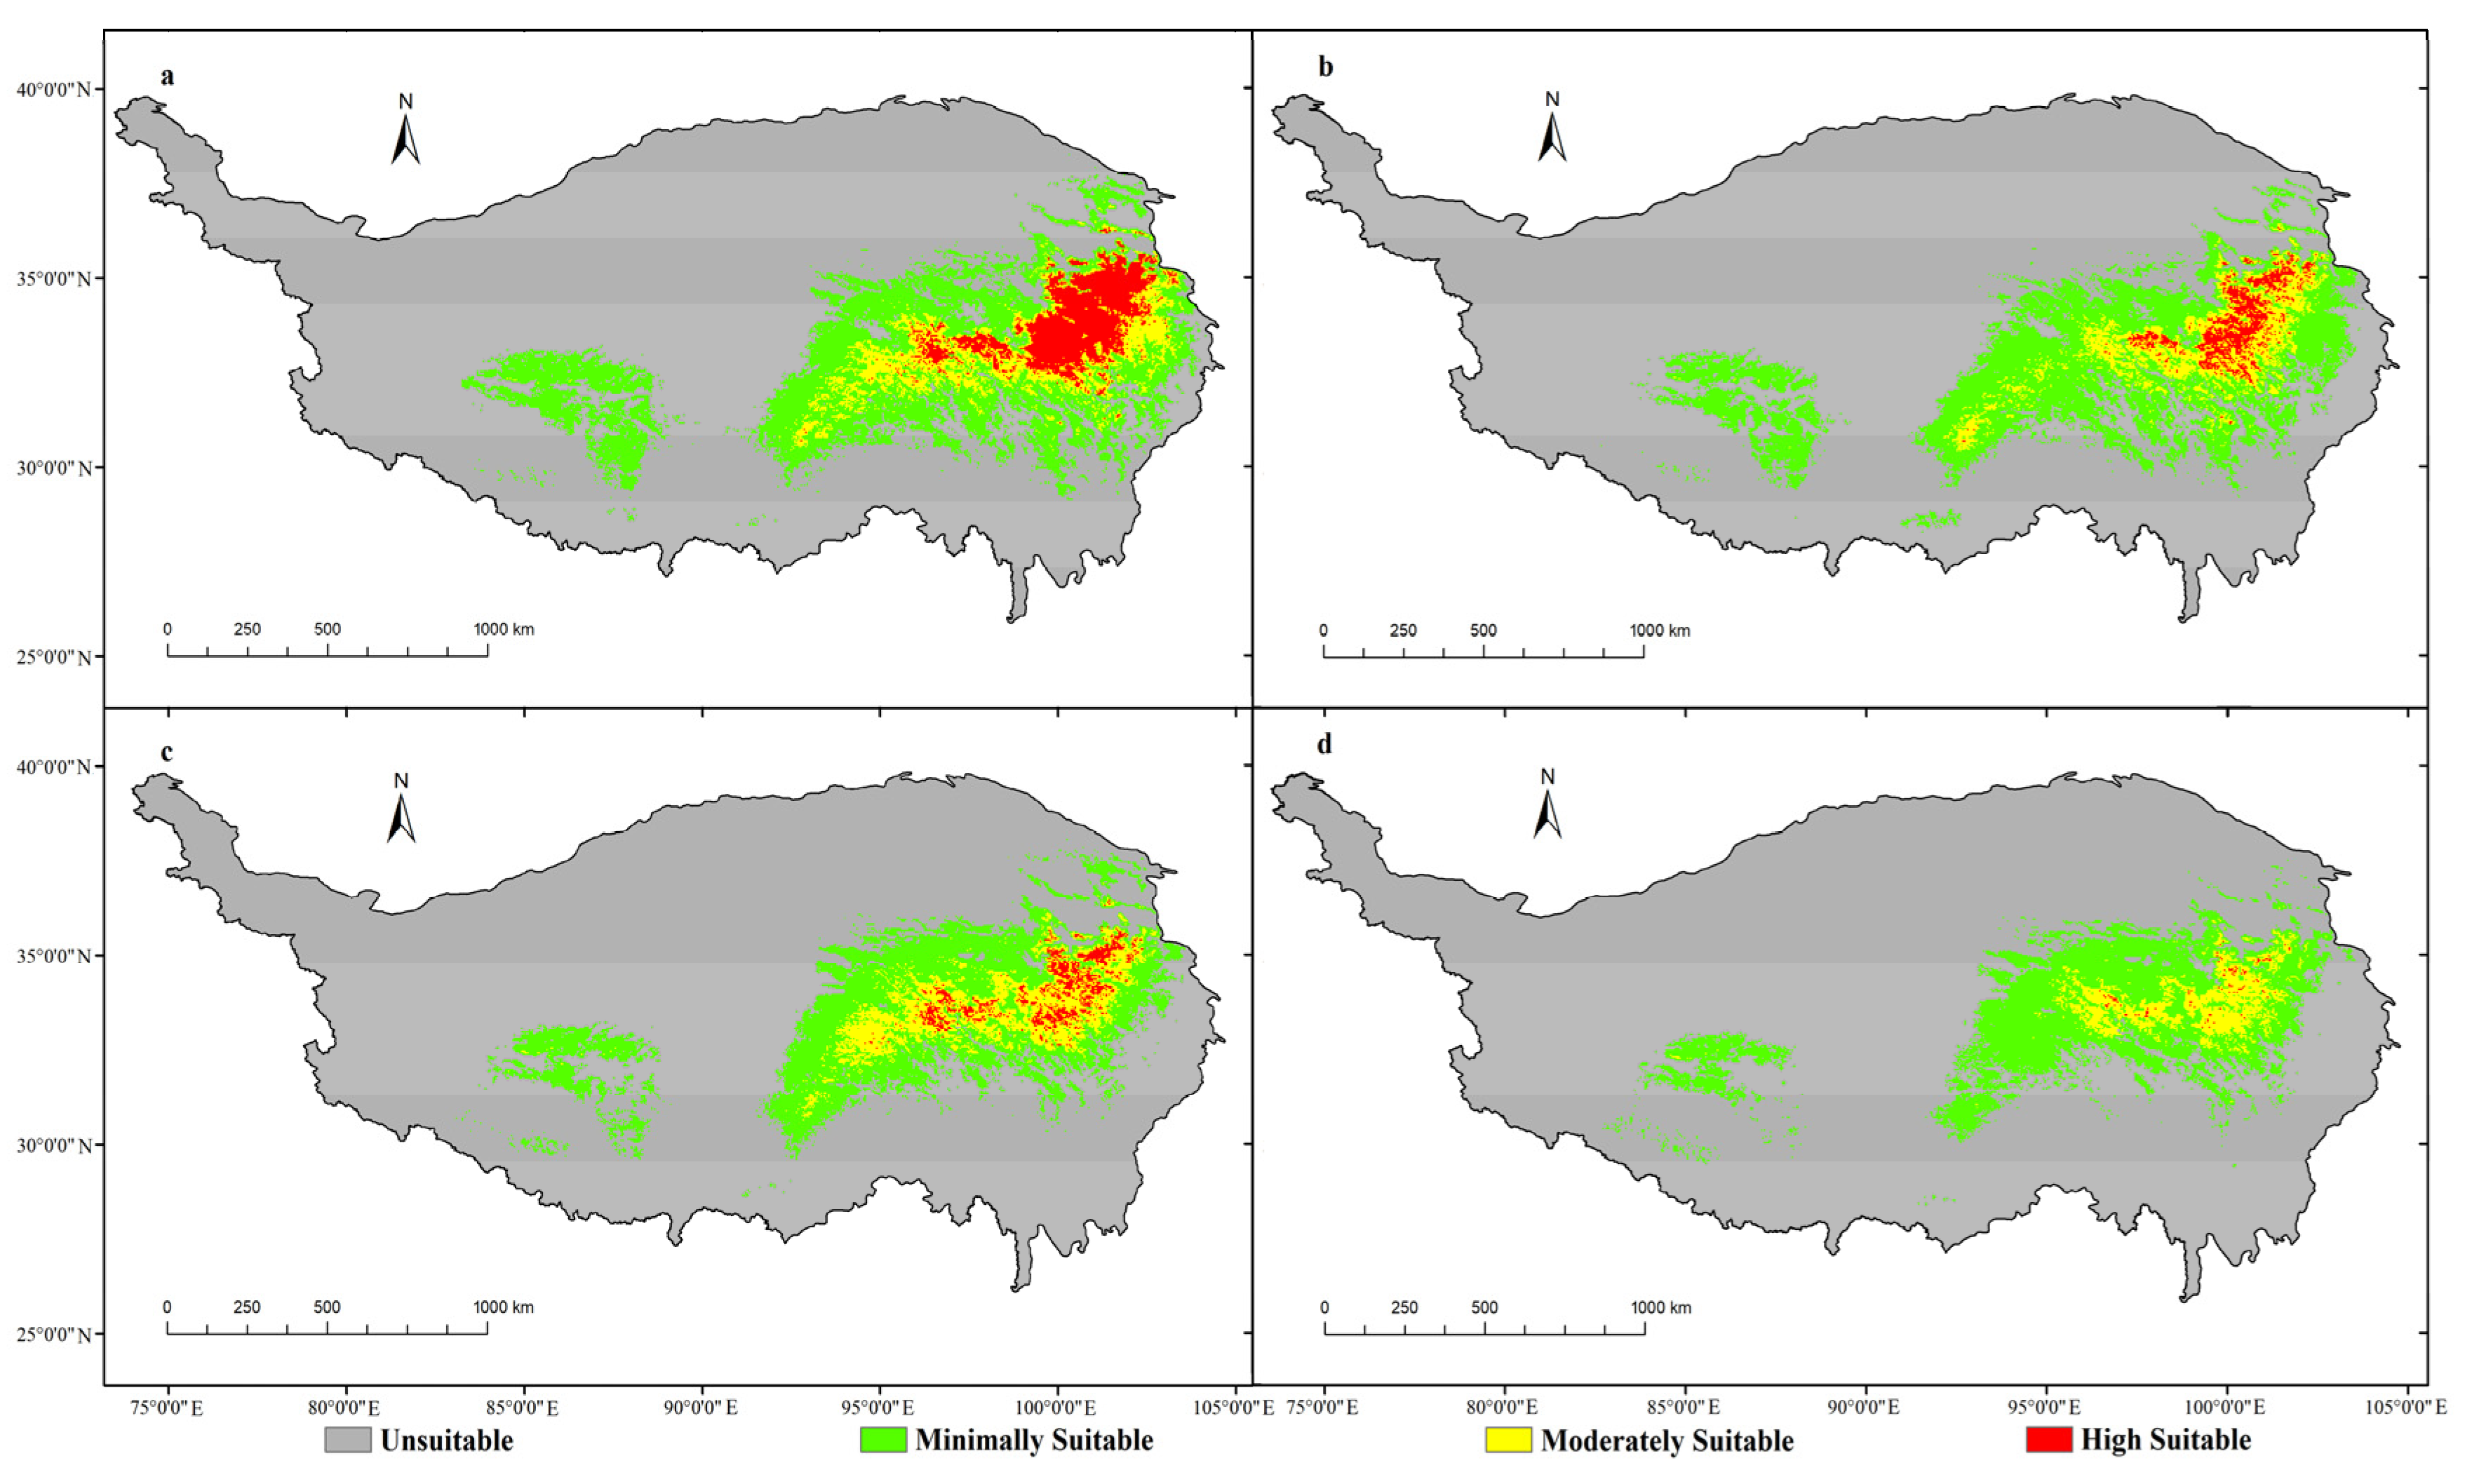
3.2. Potential Suitable Areas for FPM in Future Climate Change Scenarios

In the following section, all percentage results, where listed, are provided with respect to the scenario models in numerical order unless otherwise stated (i.e., in order of SSP126, SSP245, SSP370, and SSP585).
The suitable distribution areas, as percentages of the Tibetan Plateau’s total area, for the climate model’s future and recent past periods’ results are provided in Table A4. The future period (2021–2040) was modeled with four scenarios, SSP126 (see Figure 4a), SSP245 (Figure 4b), SSP370 (Figure 4c), and SSP585 (Figure 4d). Compared to the recent past period, the suitable distribution area under the SSP126 scenario was concentrated in the eastern region, i.e., in eastern and southern Qinghai Province, northwestern and northern Sichuan Province, and northeastern and central Tibet, with Qinghai Province being the most dominant distribution area for FPM. The total area increased by approximately 14.79%, with variations in the minimally, moderately, and highly suitable areas of 11.27%, 0.24%, and 2.96%, respectively. The SSP245 scenario was similar to SSP126, but, on the other hand, the highly suitable area under SSP370 decreased compared to SSP126 and SSP245, though it was still an increase (of 1.26%) on the distribution area of the recent past period. The area in the highly suitable area under SSP585 was the largest, accounting for 4.61% of the plateau’s total area, which was 4.26% higher than during the recent past.
The future period (2041–2060) was modeled with four scenarios, SSP126 (see Figure 5a), SSP245 (Figure 5b), SSP370 (Figure 5c), and SSP585 (Figure 5d). Compared to the recent past period, the distribution area as a whole expanded to the northwest, with the total suitable areas predicted by the scenarios increasing by 16.05%, 16.06%, 15.98%, and 17.16%. Among them, the minimally suitable areas increased significantly, by 11.79%, 15.77%, 13.45% and 18.39%, particularly in the eastern and central-western parts of the Tibetan Plateau. The moderately suitable areas saw a less notable expansion of 2.88%, 1.54%, 1.64%, and 1.79%, largely in the eastern part of the Tibetan Plateau, except for isolated areas in the south-central and central-western parts in the SSP370 and SSP585 scenarios. Moreover, the highly suitable areas returned a different trend, with slight increases of 1.96% and 2.29% in SSP126 and SSP245, but slight increases of 0.88% and 0.48% in SSP370 and SSP585, respectively.
The future period (2061–2080) was modeled with four scenarios, SSP126 (see Figure 6a), SSP245 (Figure 6b), SSP370 (Figure 6c), and SSP585 (Figure 6d). Compared to the recent past period, the forecast distribution area as a whole expanded westwards, with some low suitability areas (i.e., minimally suitable) appearing in the central and western regions. The total area of the suitable distribution area grew by 18.19%, 14.55%, 13.66%, and 9.19% across the four scenario models. Compared to the previous two periods, the trend of growth in the minimally suitable area slowed down, with expansions by 12.45%, 11.67%, 10.09%, and 8.63% against the four scenarios, respectively. This increase was concentrated in the eastern and central-western regions with expansion towards the northwest. The moderately suitable areas increased slightly by 2.50%, 1.90%, 2.76%, and 0.81%, with the distribution regions centered in the east. Lastly, the highly suitable area was again more unusual, with slight increases of 3.23%, 0.097%, and 0.81%in the SSP126, SSP245, and SSP370 scenarios, but decreases of 0.25% in the SSP585 scenarios. The latter, in particular, accounted for only 0.0886% of the total area of the Tibetan Plateau.
The future period (2081–2100) was modeled with four scenarios, SSP126 (see Figure 7a), SSP245 (Figure 7b), SSP370 (Figure 7c), and SSP585 (Figure 7d). The SSP126 and SSP245 models showed a trend of expansion to the south and northwest, respectively. The total area of suitable distribution increasing by 14.79%, 20.99%, 7.99%, and 5.54% under the four scenario models, respectively. The minimally suitable area grew by 11.98%, 14.98%, 7.72%, and 7.28%. However, for the moderately suitable area, it increased by 1.69% in SSP126, 3.16% in SSP245, and 0.403% in SSP370, but was reduced by 1.39% in SSP585. The highly suitable area saw slight gains, by 1.106% and 2.83% in the SSP126 and SSP245 scenarios, respectively, but was diminished by 1.38% in the SSP370 model. It is noteworthy that the highly suitable area disappeared completely in the SSP585 scenario.

4. Discussion

4.1. Key Factors Affecting the Distribution of FPM

In terms of habitat, FPM is found most often in environments with shrubs, which tend to provide some shelter from the wind, rain, and light to varying extents, to prevent withering and death from direct sunlight. However, small populations of the plant can be found in grassland-type environments where it tends to be shorter due to the lack of plants which provide shade. Forest and desert types of vegetation are not suitable for FPM’s growth.
In terms of environmental factors which contribute significantly to FPM’s ability to flourish, the contribution rate of NPP and vegetation was 30.5% and 26.5%, respectively. The NPP factor is defined as the amount of organic matter accumulated by green plants per unit area per unit time. It directly reflects the productivity and quality of the ecosystem [40], indicating FPM is generally more demanding on the local environment where it is located. On the one hand, the spatial distribution of NPP laterally reflects the types of vegetation in the environment, with a general trend of forest > shrub > grassland > desert [41]. However, on the other hand, the climatic factors affecting NPP are mostly related to temperature and precipitation. It has been shown the correlation between NPP and temperature is gradually lowered from the center (where the correlation is predominantly positive) to the periphery (predominantly negative correlation). The analogous trend in precipitation gradually rises from the center to the periphery, from negative to positive correlation, respectively [42]. In recent years, NPP and NDVI have been increasing year by year in the Qinghai–Tibet Plateau [43]. In other words, the vegetation coverage of the plateau is increasing year by year, which is related to the warming and humidification of the plateau in recent years. However, the contribution rate of NDVI in this study is very small. This may be because NDVI simply and directly reflects the general situation of vegetation distribution, and the higher average altitude of the Qinghai–Tibet Plateau is conducive to the accumulation of organic carbon, which more directly affects the distribution of FPM.
The third contributing factor reported was soil types, which included: luvisols; caliche; arid and desert; skeletal primitive; hydromorphic; saline; anthrosols; alpine; and others. It was observed that the majority of soil types in which FPMs grow were alpine soils, with a small number of skeletal primitive soils. One of the distinctive features of the alpine soils is, that among all types of soil, it has the lowest bulk density. This is caused by its presence at higher altitudes and the related cold climate does not facilitate the decomposition of organic matter, resulting in higher organic matter content and low bearing capacity of soil types [44]. The Tibetan Plateau is one of the most sensitive regions to climate change, and organic matter is the most sensitive opponent to climate change in soil [45].
The fourth contributing factor was noted to be bio7 (temperature, annual range), which largely influences the types of vegetation distribution [46]. Temperature variation objectively reflects the suitability of a certain area for plant distribution, where the greater the temperature variation is, the natural environment becomes harsher and thus less suitable for plant growth. It also affects the soil fertility [47]. The shrub-growing season for plants on the Tibetan Plateau is short, generally from June to September [48], in contrast to much longer periods of wintry temperatures. The season best suited to growth for FPM is June–July, which may be due to the low average temperature in the Tibetan Plateau region.
The fifth most influential factor was pop (population). The majority of medicinal plants on the Tibetan Plateau are distributed across the eastern and southeastern regions, which overlaps spatially in a large part with the suitable distribution area of FPM. Relevant to pop, human activity has a significant impact on medicinal plant diversity and endemism [49]. Due to FPM’s importance as an herbal ingredient, it has high value and market and is widely used in the medicinal industry. However, due to its short growth period but long growth cycles, and slow population renewal and proliferation rates, the naturally occurring plants growing in the wild are very vulnerable to anthropogenic over-harvesting. As might be expected, this has led to a decline in wild resources, rendering the species highly susceptible to disturbance by human activity. Studies have shown human activity is negatively correlated with the potential distribution of medicinal plants, with larger local populations causing reductions in the potential extent of the plants’ distribution, as well as fragmenting their range [50].
FPM is found most commonly on high mountain slopes at altitudes in the range of 3000–4400 m. The Tibetan Plateau region has an average altitude of around 4000 m and a wide distribution of various types of mountainous terrain, making the topography ideal for the natural distribution of FPM. In mountain ecosystems, altitude is the main cause of changes in hydrothermal conditions. On the one hand, altitude is a comprehensive factor which influences other factors such as temperature, thus leading to changes in types of vegetation. On the other hand, altitude and temperature influence functional traits including plant dry-matter content and water content, thereby indirectly having an effect upon the suitable distribution areas of plants [51].
In general, the high suitable areas are closely related to soil types (alpine soil) and vegetation types (shrub or grass), while the other suitable distribution areas are related to meadows (grass), skeletol primitive soils, hydromorphic soils, and dark semi-hydromorphic soils. The other soil types and vegetation types are not suitable for the growth of FPM. The main environmental factors affecting plant distribution in the Qinghai–Tibet Plateau are not the same. For example, Swertia przewalskii Pissjauk. has strong adaptability to the environment, and the main environmental factor affecting its distribution area is altitude, followed by temperature [52]. Stipa purpurea, which grows in an alpine environment, is one of the most important representative communities of alpine vegetation, and it is the most important plant type with the largest distribution area in alpine grassland. The main environmental factors affecting its distribution over the Qinghai–Tibet Plateau are precipitation factors, including annual precipitation, precipitation of the wettest quarter, and precipitation of the warmest quarter. The contribution rates of elevation and temperature to plant growth were relatively small, indicating that the species was mainly distributed in areas with high annual precipitation, especially in the growing season [53]. However, in this study, the growth cycle of FPM was long (3–4 years) and the plants themselves were relatively fragile, so they had high requirements of the habitat, which also restricted the distribution area of FPM to a certain extent. In contrast to other plants, as medicinal plants, the key medicinal part of FPM is the underground part, namely the root of the plant. This also confirms from another aspect that NPP is the main factor affecting the distribution area, while external factors such as temperature and precipitation have little influence on the underground part.

4.2. Trends of Suitable Distribution Area of FPM under Four Climate Scenarios

The four climate scenarios considered future changes to temperatures and levels of precipitation primarily by budgeting for emissions of greenhouse gases (namely, carbon dioxide). The four models were based on varying conditions as follows: sustainable and low radiative-forcing future (SSP126); no significant change in social-economic patterns compared to the past and moderate radiative-forcing (SSP245); low levels of economic growth, severe environmental degradation, and moderate to high radiative-forcing (SSP370); and a highly industrialized, fossil fuel-based, and high radiative-forcing future (SSP585). In particular, the fourth scenario modelled the adoption of resource- and energy-intensive lifestyles worldwide, trends which will also have a significant impact on the natural distribution of plants. As CO2 emissions increase in intensity, the patterns of rising temperatures in the four scenarios ranged from weak to strong through SSP126 to SSP245 to SSP370 and, finally, to SSP585. Meanwhile, forecasts of levels of precipitation on the Tibetan Plateau in the future also show an overall increase, suggesting the region’s future climate is evolving via warming and humidification [54].
In terms of regions, under the SSP126 model, the most suitable and highly suitable areas for FPM will mainly be located in Bayan Kala Mountain and the eastern Anemachin Mountain range, and the peak will be reached around 2061–2080. A new suitable distribution area was found in the Tanggula Mountains region. Minimally suitable areas have a trend of expansion to the south and southwest directions of the Bayan Khara Mountains (Tanggula Mountains and Nianqin Tanggula Mountains). In contrast to the past, new areas with the potential for the existence of FPM have emerged in the northeast of the Gangdise Mountains located in the southwest of the Tibetan Plateau. The expansion trend of the SSP245 model is similar to that of the SSP126 model, but differs in that minimally suitable areas have a trend of expansion to the north of the Tangura Mountains, which may move towards higher elevation areas during the process. Under the SSP370 model, the distribution range of the central and eastern Tibetan Plateau was similar to the first two models, but the suitable distribution area of the northeastern region of the Gangdises Mountains was significantly higher than the first two models, but with the passage of time, this part of the region was gradually reduced. In the SSP585 model, the distribution of FPM will expand greatly in the short term (2021–2040), but the suitable distribution area will shrink as time goes by. From 2080 to 2100, the distribution of FPM will no longer be suitable in the northeastern Tibetan Plateau (Qilian Mountains) and the southern Bayankala Mountains. This may be because human activities in this model are relatively intense, which seriously affects the distribution area of FPM.
Due to the variety in wild plants’ adaptative behaviors in response to climatic factors, the suitable distribution areas of FPM show trends of expansion, reduction, or migration under the different future climate models. In addition, patterns in the suitable distribution areas of different species can diverge under the same climatic conditions. For example, Gastrodiae Rhizoma showed a reduction in the total suitable area under three of the models’ conditions (SSP126, SSP245, and SSP370), while the SSP585 scenario alone showed an increasing trend, while suitable distribution areas migrated towards higher latitudes [55]. Rhodiola crenulata, on the other hand, exhibited a high level of vulnerability in the SSP585 climate scenario, with a significantly increased risk of extinction [56].
The results of this study allow a conclusion to be drawn that the total area of the suitable distribution area for FPM expands in all four sets of the future climate models’ conditions. For the periods which span 2021–2040, 2041–2060, 2061–2080, and 2081–2100, the total suitable area tended to expand and then contract in the SSP126 model over time, reaching its maximum in 2061–2080. The overall decreasing trend in the total suitable area in the SSP370 model was probably due to the shrinking of the suitable distribution area, thanks to the increased radiation intensity, and a similar conclusion could be drawn for SSP585, where the suitable area drops to a minimum in 2081–2100. Overall, the sustainable and low radiative-forcing future model (SSP126) displayed the greatest potential for the natural distribution of FPM, contributing to its expansion across the Tibetan Plateau to some extent. The SSP245 model also showed such a trend, though to a lesser degree. However, in the case of a future with severe environmental degradation and moderate to high radiative-forcing (SSP370), the area affected the most was the highly suitable area. A similar conclusion can be also drawn for the SSP585 model, while the suitable areas of distribution degraded most seriously in this model. At present, the quantity of wild resources in FPM is decreasing day by day, and the contradiction between current protection and utilization is becoming more and more obvious. How to effectively protect wild resources in the future is an important direction. Therefore, it is very important to establish nature reserves in suitable distribution areas combined with reasonable mining control measures. By this means, the wild Fritillaria population can finally be protected and the needs of TCM for disease prevention and treatment be met.

5. Conclusions

Using the maximum entropy model, the present study estimates the spatial distribution of habitat suitability for FPM on the Qinghai–Tibet Plateau. The primary environmental factors which affect the distribution of FPM on the Tibetan Plateau were determined to be Vegetation types, NPP, and Soil types, accounting for 30.7%, 26.6%, and 23.2% of the effects, respectively. Of lesser significance were the contributions of Bio7 and Pop (8.1% and 3.6%, respectively) while the contributions of topographical factors were smaller still. Thus, the main factors contributing to the distribution of FPM were concluded to be Vegetation types, NPP, Soil types, Bio7, Pop, Slope, Gdp, Aspect, Bio1, Elevation and Bio19. During the recent past period, the total suitable distribution region of FPM on the Tibetan Plateau accounted for 5.55% of the total area (approximately 14.11 × 10⁴ km2), which was concentrated towards the east (Bayan Khara Mountain and Animachen Mountain area).
The impact of the climate in the future on FPM’s suitable distribution area shows varying trends under different scenarios, including periods of time. The total area of suitable distribution increased to contrasting degrees in each scenario and period. In the short term (2021–2040), the suitable area predicted by SSP585 was the largest, but it decreased over time until the highly suitable area disappeared completely. From a sustainability perspective, the future model with sustainable and low radiative-forcing (SSP126) proved to be the most suitable for the natural distribution of FPM and was at least partially contributory to the expansion of its range on the Tibetan Plateau. Under all of the four future climate scenarios, the suitable distribution area of FPM demonstrated a general westward shift on the Tibetan Plateau, indicating it transitioned towards higher altitudes in response to the expected future warming and humidification.

Author Contributions

D.S. conducted the research study, analyzed the data, and wrote the paper; Z.L. collected plant samples in the field; Y.Q. made suggestions for the paper; T.W. helped to edit the paper; H.H. and Z.C. guided the research study and performed extensive updating of the manuscript. All authors have read and agreed to the published version of the manuscript.

Funding

This research study was funded by The Key research and development and transformation project fund of Qinghai Province (2022-SF-142) and the Qinghai Provincial Key Laboratory of Medicinal Animal and Plant Resources of the Qinghai–Tibetan Plateau (2020-ZJ-Y04).

Institutional Review Board Statement

Not applicable.

Informed Consent Statement

Not applicable.

Data Availability Statement

All data and materials are available upon request.

Acknowledgments

We are particularly indebted to Zhen Chen and Qi Song from Qinghai Normal University and Professor Yang Bai from Xishuangbanna Tropical Botanical Garden Chinese Academy of Sciences for their constructive suggestion on MaxEnt and ArcGIS training guidance of this paper.

Conflicts of Interest

The authors declare no conflict of interest.

Appendix A

Figure A1. Receiver operating characteristic curve of FPM in MaxEnt model.
Sustainability 15 02833 g0a1
Figure A2. Regularized training gain of environment factors on the distribution of FPM during the simulated historical period (1970–2000) by the Jackknife method in the MaxEnt model.
Sustainability 15 02833 g0a2
Figure A3. Response curves of major environmental factors (The curves show the mean response of the 10 replicate Maxent runs (red) and and the mean +/− one standard deviation (blue, two shades for categorical variables)).
Sustainability 15 02833 g0a3
Table A1. Geographical coordinates of sampling points.
Sampling PointLongitude (°E)Latitude (°N)Elevation (m)Sampling PointLongitude (°E)Latitude (°N)Elevation (m)
Zeku1101.88035.3013195Shiqu298.05932.9744271
Guide1101.56236.3033171Shiqu398.03932.6404447
Guinan1101.25935.0963797Dege198.55832.2684025
Xinghai199.92335.8333772Dege298.98832.0794186
Xinghai299.80535.4983600Ganzi199.59031.7283867
Tongde1100.31735.4013673Ganzi2100.17131.6033847
Tongde2100.87034.9184010Luhuo100.73131.7444026
Maqin1100.47034.5373710Seda1100.46732.0833713
Maqin2100.29334.2983959Seda2100.38732.5054433
Dari199.69833.7463942Banma100.56832.6883825
Jiuzhi1100.75833.2753844Dari2100.41533.2794163
Jiuzhi2100.87233.3024286Dari399.69033.7523946
Jiuzhi3101.03333.7793672Gande1100.23434.2244307
Maqin3100.13134.7763955Gande2100.46734.2013876
Guide2101.58936.2593386Aba1101.46633.1693622
Tongde3100.31735.4063700Aba2102.11732.7113859
Xinghai399.83635.4053819Hongyuan102.99932.9713555
Yushu196.52633.4454007Songpan103.45132.9083400
Yushu296.45733.4124072Jiuzhaigou103.51633.6413869
Yushu396.69532.8934432Diebu103.12534.2503531
Yushu496.61332.7083984Luqu1102.32334.4943559
Yushu596.44732.5474225Luqu2102.48134.5513310
Nangqian96.51131.9754260Maqu102.10934.0733629
Yushu696.70932.8964385Luqu3102.18234.0963674
Chengduo97.45832.1154076Henan101.99334.5083386
Shiqu197.96332.0864166Zeku2101.85035.2253463
Table A2. Data and sources.
Data NameTime
Resolution
Spatial
Resolution
Data Source
The Scope and Boundary of the Qinghai–Tibet Plateau2014-Global Change Scientific Research Data
Publishing System
http://www.geodoi.ac.cn
(accessed on 1 November 2022)
Elevation 2000250 mResource and Environment Science and Data Center, Chinese Academy of Science
https://www.resdc.cn/
(accessed on 2 November 2022)
Soil types19951 kmResource and Environment Science and Data Center, Chinese Academy of Science
https://www.resdc.cn/
(accessed on 2 November 2022)
Vegetation types20011 kmResource and Environment Science and Data Center, Chinese Academy of Science
https://www.resdc.cn/
(accessed on 2 November 2022)
NDVI20191 kmResource and Environment Science and Data Center, Chinese Academy of Science
https://www.resdc.cn/
(accessed on 2 November 2019)
NPP20191 kmResource and Environment Science and Data Center, Chinese Academy of Science
https://www.resdc.cn/
(accessed on 2 November 2022)
Population20191 kmResource and Environment Science and Data Center, Chinese Academy of Science
https://www.resdc.cn/
(accessed on 2 November 2022)
Gross Domestic Product20191 kmResource and Environment Science and Data Center, Chinese Academy of Science
https://www.resdc.cn/
(accessed on 2 November 2022)
Climate Model Data1970–20002.5 minWorldClim
https://www.worldclim.org
(accessed on 4 November 2022)
Future climate Model Data2021–2040
2041–2060
2061–2080
2081–2100
2.5 minWorldClim
https://www.worldclim.org
(accessed on 5 November 2022)
Table A3. Climate factors used in this study.
FactorMeaningFactorMeaning
bio1Annual mean temperatureBio15Precipitation seasonality
bio2Mean diurnal rangeBio16Precipitation of wettest quarter
bio3IsothermalityBio17Precipitation of driest quarter
bio4Temperature seasonalityBio18Precipitation of warmest quarter
bio5Max temperature of warmest monthBio19Precipitation of coldest quarter
bio6Min temperature of coldest monthElevationAltitude
bio7Temperature annual rangeSlopeThe degree of steepness of the surface unit
bio8Mean temperature of wettest quarterAspectThe direction of the projection of a slope normal onto a horizontal plane
bio9Mean temperature of driest quarterNDVINormalized Difference Vegetation Index
bio10Mean temperature of warmest quarterNPPNet Primary Production
bio11Mean temperature of coldest quarterSoilType of soil
bio12Annual precipitationVegetationType of vegetation
bio13Precipitation of wettest monthPopulationPopulation distribution per square kilometer (pop)
bio14Precipitation of driest monthGDPGross Domestic Product
Table A4. Proportion of suitable area of FPM in historical and future.
UnsuitableMinimally
Suitable
Moderately
Suitable
High
Suitable
Historical Percent (%)94.453.541.670.34
Future climate scenarios2021–2040SSP12679.9714.821.913.31
SSP24578.2214.973.343.46
SSP37077.4516.234.711.61
SSP58572.9115.437.054.61
2041–2060SSP12678.3915.343.952.30
SSP24578.3915.773.202.63
SSP37078.4716.993.311.22
SSP58577.3318.393.460.82
2061–2080SSP12676.2516.014.173.57
SSP24579.8915.223.571.32
SSP37080.7813.634.431.15
SSP58585.2512.182.480.0886
2081–2100SSP12679.6615.533.361.45
SSP24573.4618.534.833.17
SSP37086.4611.272.0680.202
SSP58588.9110.830.2670

References

  1. Deng, T.; Wu, F.X.; Su, T.; Zhou, Z. Tibetan Plateau: An evolutionary junction for the history of modern biodiversity. Sci. China Earth Sci. 2020, 63, 172–187. (In Chinese) [Google Scholar] [CrossRef]
  2. Zheng, D.; Yao, T.D. Uplifting of Tibetan Plateau with Its Environmental Effects. Adv. Earth Sci. 2006, 21, 451–458. (In Chinese) [Google Scholar]
  3. Xing, Y.W.; Utescher, T.; Jacques, F.M.B.; Su, T.; Liu, Y.S.; Huang, Y.J.; Zhou, Z.K. Paleoclimatic estimation reveals a weak winter monsoon in southwestern China during the late Miocene: Evidence from plant macrofossils. Palaeogeogr. Palaeoclimatol. Palaeoecol. 2012, 358–360, 19–26. [Google Scholar] [CrossRef]
  4. Huang, J.H.; Huang, J.H.; Liu, C.R.; Zhang, J.L.; Lu, X.H.; Ma, K.P. Diversity hotspots and conservation gaps for the Chinese endemic seed flora. Biol. Conserv. 2016, 198, 104–112. [Google Scholar] [CrossRef]
  5. Chinese Pharmacopoeia Commission. Pharmacopoeia of the People’s Republic of China (Part 1); China Medical Science Press: Beijing, China, 2020; pp. 38–39.
  6. Zhao, C.Y.; Liu, H.; Su, J.S.; Li, X.H.; Jia, M.R.; Zhang, Y.; Zhang, J. Endangered situation and conservation strategy of Tibetan medicine in Qinghai-Tibet Plateau. China J. Chin. Materia Med. 2016, 41, 4451–4455. (In Chinese) [Google Scholar] [CrossRef]
  7. Xia, J.C.; Zhuo, M.; Zhang, C.; Ren, B. A Preliminary Study of Cultivation Techniques for Fritillaria cirrhosa. J Sichuan For. Sci. Tech. 2017, 38, 53–57+72. (In Chinese) [Google Scholar] [CrossRef]
  8. Xiong, H.R.; Ma, Z.X.; Guo, H.; Yang, Z.A.; Zhao, C.; Yang, G. Research progress on wild source plant resources distribution and conservation of Fritillariae Cirrhosae Bulbus. Chin. Tradit. Herb. Drugs. 2020, 51, 2573–2579. (In Chinese) [Google Scholar] [CrossRef]
  9. Wang, C.H.; Zhang, S.N.; Zhang, F.M.; Li, K.C.; Yang, K. On the increase of precipitation in the Northwestern China under the global warming. Adv. Earth Sci. 2021, 36, 980–989. (In Chinese) [Google Scholar] [CrossRef]
  10. Li, L.; Li, H.M.; Shen, H.Y.; Liu, C.H.; Ma, Y.C.; Zhao, Y.C. The truth and inter-annual oscillation causes for climate change in the Qinghai-Tibet Plateau. J. Glaciol. Geocryol. 2018, 40, 1079–1089. (In Chinese) [Google Scholar] [CrossRef]
  11. Guillera-Arroita, G.; Lahoz-Monfort, J.J.; Elith, J.; Gordon, A.; Kujala, H.; Lentini, P.E.; McCarthy, M.A.; Tingley, R.; Wintle, B.A. Is my species distribution model fit for purpose? Matching data and models to applications. Global Ecol. Biogeogr. 2015, 24, 276–292. [Google Scholar] [CrossRef]
  12. Pramanik, M.; Paudel, U.; Mondal, B.; Chakraborti, S.; Deb, P. Predicting climate change impacts on the distribution of the threatened Garcinia indica in the Western Ghats, India. Clim. Risk Manag. 2018, 19, 94–105. [Google Scholar] [CrossRef]
  13. Phillips, S.J.; Anderson, R.P.; Schapire, R.E. Maximum entropy modeling of species geographic distributions. Ecol. Model. 2006, 190, 231–259. [Google Scholar] [CrossRef]
  14. Yan, H.Y.; Feng, L.; Zhao, Y.F.; Feng, L.; Wu, D.; Zhu, C.P. Prediction of the spatial distribution of Alternanthera philoxeroides in China based on ArcGIS and MaxEnt. Glob. Ecol. Conserv. 2020, 21, e00856. [Google Scholar] [CrossRef]
  15. Yu, X.; Tao, X.; Liao, J.; Liu, S.C.; Xu, L.; Yuan, S.; Zhang, Z.L.; Wang, F.; Deng, N.Y.; Huang, J.L.; et al. Predicting potential cultivation region and paddy area for ratoon rice production in China using Maxent model. Field. Crop. Res. 2022, 275, 108372. [Google Scholar] [CrossRef]
  16. Ma, B.; Sun, J. Predicting the distribution of Stipa purpurea across the Tibetan Plateau via the MaxEnt model. BMC Ecol. 2018, 18, 10. [Google Scholar] [CrossRef]
  17. Cao, B.; Bai, C.K.; Zhang, L.L.; Li, G.S.; Mao, M.C. Modeling habitat distribution of Cornus officinalis with Maxent modeling and fuzzy logics in China. J. Plant Ecol. 2016, 9, 742–751. [Google Scholar] [CrossRef]
  18. Dai, X.S.; Wu, W.; Ji, L.; Tian, S.; Yang, B.; Guan, B.C.; Wu, D. MaxEnt model-based prediction of potential distributions of Parnassia wightiana (Celastraceae) in China. Biodivers. Data J. 2022, 10, e81073. [Google Scholar] [CrossRef]
  19. Luo, Y.B.; Chen, X.Q. A Revision of Fritillaria L.(liliaceae) in the hengduan Mountains and adjacent regions, China(1)-A study of Fritillaria cirrhosa D. Don and its related species. J. Syst. Evol. 1996, 34, 304–312. (In Chinese) [Google Scholar]
  20. Zhang, Y.L.; Li, B.Y.; Zheng, D. Datasets of the boundary and area of the Tibetan Plateau. Acta Geogr. Sin. 2014, 69, 164–168. (In Chinese) [Google Scholar] [CrossRef]
  21. Yu, H.B.; Deane, D.C.; Sui, X.H.; Fang, S.Q.; Chu, C.J.; Liu, Y.; He, F.L. Testing multiple hypotheses for the high endemic plant diversity of the Tibetan Plateau. Global. Ecol. Biogeogr. 2019, 28, 131–144. [Google Scholar] [CrossRef]
  22. Hu, H.W.; Wei, Y.Q.; Wang, W.Y.; Suonan, J.; Wang, S.X.; Chen, Z.; Guan, J.H.; Deng, Y.F. Richness and distribution of endangered orchid species under different climate scenarios on the Qinghai-Tibetan Plateau. Front. Plant Sci. 2022, 13, 948189. [Google Scholar] [CrossRef]
  23. Delectis Flora Reipublicae Popularis Sinicae Agendae Academiae Sinicae Edita. Liliaceae (1). Flora Reipublicae Popularis Sinicae; Wang, F.Z.; Tang, J. (Eds.) Science Press: Beijing, China, 1980; Tomus 14; pp. 107–109. [Google Scholar]
  24. Song, Y.C.; Che, P.; Zhao, X.L.; Qi, Y.D.; Wei, X.P.; Tang, Z.H.; Zhang, B.G. Resource Investigation on Fritillariae Cirrhosae Bulbus on Tibetan Plateau and Its Adjacent Regions. Mod. Chin. Med. 2021, 23, 611–618+626. [Google Scholar] [CrossRef]
  25. Jin, Y.L.; Wang, H.Y.; Wei, L.F.; Hou, Y.; Hu, J.; Wu, K.; Xia, H.J.; Xia, J.; Zhou, B.R.; Li, K.; et al. A plot-based dataset of plant community on the Qingzang Plateau. Chin. J. Plant Ecol. 2022, 46, 846–854. [Google Scholar] [CrossRef]
  26. Xu, X.L. China Annual Vegetation Index (NDVI) Spatial Distribution Dataset; Data Registration and Publishing System of Resource and Environmental Science Data Center, Chinese Academy of Sciences: Beijing, China, 2018. [Google Scholar] [CrossRef]
  27. Xu, X.L. China’s Population Spatial Distribution Kilometer Grid Dataset; Resource and Environmental Science Data Registration and Publishing System: Beijing, China, 2017. [Google Scholar] [CrossRef]
  28. Xu, X.L. China’s GDP Spatial Distribution Kilometer Grid Dataset; Resource and Environmental Science Data Registration and Publishing System: Beijing, China, 2017. [Google Scholar] [CrossRef]
  29. Fick, S.E.; Hijmans, R.J. WorldClim 2: New 1km spatial resolution climate surfaces for global land areas. Int. J. Climatol. 2017, 37, 4302–4315. [Google Scholar] [CrossRef]
  30. Boer, G.J.; Smith, D.M.; Cassou, C.; Doblas-Reyes, F.; Danabasoglu, G.; Kirtman, B.; Kushnir, Y.; Kimoto, M.; Meehl, G.A.; Msadek, R.; et al. The Decadal Climate Prediction Project (DCPP) contribution to CMIP6. Geosci. Model Dev. 2016, 9, 3751–3777. [Google Scholar] [CrossRef]
  31. Yi, D.Y. Simulation and Analysis of Runoff in the Source Region of the Yellow River Based on CMIP6 Climate Model. Master Thesis, North West Agriculture and Forestry University, Yangling, China, 2022. (In Chinese). [Google Scholar]
  32. Thrasher, B.; Wang, W.L.; Michaelis, A.; Melton, F.; Lee, T.; Nemani, R. NASA Global Daily Downscaled Projections, CMIP6. Sci. Data 2022, 9, 262. [Google Scholar] [CrossRef]
  33. Li, S.Y.; Miao, L.J.; Jiang, Z.H.; Wang, G.J.; Gnyawali, K.R.; Zhang, J.; Zhang, H.; Fang, K.; He, Y.; Li, C. Projected drought conditions in Northwest China with CMIP6 models under combined SSPs and RCPs for 2015–2099. Adv. Clim. Chang. Res. 2020, 11, 210–217. [Google Scholar] [CrossRef]
  34. Phillips, S.J.; Dudík, M.; Schapire, R.E. Maxent Software for Modeling Species Niches and Distributions (Version 3.4.1). Available online: http://biodiversityinformatics.amnh.org/open_source/maxent/ (accessed on 12 January 2023).
  35. Zhao, W.L.; Chen, H.G.; Lin, L.; Cui, Z.J.; JIN, L. Distribution of habitat suitability for different sources of Fritillariae Cirrhosae Bulbus. Chin. J. Ecol. 2018, 37, 1037–1042. (In Chinese) [Google Scholar] [CrossRef]
  36. Yang, X.Q.; Kushwaha, S.P.S.; Saran, S.; Xu, J.C.; Roy, P.S. Maxent modeling for predicting the potential distribution of medicinal plant, Justicia adhatoda L. in Lesser Himalayan foothills. Ecol. Eng. 2013, 51, 83–87. [Google Scholar] [CrossRef]
  37. Khan, A.M.; Li, Q.T.; Saqib, Z.; Khan, N.; Habib, T.; Khalid, N.; Majeed, M.; Tariq, A. MaxEnt Modelling and Impact of Climate Change on Habitat Suitability Variations of Economically Important Chilgoza Pine (Pinus gerardiana Wall.) in South Asia. Forests 2022, 13, 715. [Google Scholar] [CrossRef]
  38. Yang, S.L.; Wang, H.M.; Tong, J.P.; Bai, Y.; Alatalo, J.M.; Liu, G.; Fang, Z.; Zhang, F. Optimizing MaxEnt model in the prediction of species distribution. Sci. Total Environ. 2022, 836, 155356. [Google Scholar] [CrossRef]
  39. Yin, H.; Tian, C.; Ma, Q.Q.; Lv, G.H.; Zeng, F.J. Variation characteristics of potential distribution patterns of Alhagi sparsifolia Shap. under climate change and human disturbance. Acta Ecol. Sin. 2022, 42, 7349–7361. [Google Scholar] [CrossRef]
  40. Wei, X.D.; Yang, J.; Luo, P.P.; Lin, L.G.; Lin, K.L.; Guan, J.M. Assessment of the variation and influencing factors of vegetation NPP and carbon sink capacity under different natural conditions. Ecol. Indic. 2022, 138, 108834. [Google Scholar] [CrossRef]
  41. Wang, L.X.; Ding, H.L.; Liu, Z.; Zhang, S.C.; Kong, J.L. Spatiotemporal Change of NPP Based on CASA Model and Its Response to Climate Change in Jing River Basin. Res. Soil. Water. Conserv. 2022, 29, 190–196. (In Chinese) [Google Scholar] [CrossRef]
  42. Lan, Y.F.; Li, C.H. Spatiotemporal Pattern of Vegetation Net Primary Productivity(NPP) and Its Response to Climate Change in Qilian Mountains during the past 16 Years. Acta Agrestia Sin. 2022, 30, 188–195. (In Chinese) [Google Scholar] [CrossRef]
  43. Li, W.H.; Zhao, X.Q.; Zhang, X.Z.; Shi, P.L.; Wang, X.D.; Zhao, L. Change mechanism in main ecosystems and its effect of carbon source/sink function on the Qinghai-Tibetan Plateau. Chin. J. Nat. 2013, 35, 172–178. (In Chinese) [Google Scholar] [CrossRef]
  44. Dad, J.M. Organic carbon stocks in mountain grassland soils of northwestern Kashmir Himalaya: Spatial distribution and effects of altitude, plant diversity and land use. Carbon Manag. 2019, 10, 149–162. [Google Scholar] [CrossRef]
  45. Ali, S.; Begum, F.; Hayat, R.; Bohannan, B.J.M. Variation in soil organic carbon stock in different land uses and altitudes in Bagrot Valley, Northern Karakoram. Acta Agr. Scand B-S. P. 2017, 67, 551–561. [Google Scholar] [CrossRef]
  46. Piao, S.L.; Nan, H.J.; Huntingford, C.; Ciais, P.; Friedlingstein, P.; Sitch, S.; Peng, S.S.; Ahlström, A.; Canadell, J.G.; Cong, N.; et al. Evidence for a weakening relationship between interannual temperature variability and northern vegetation activity. Nat. Commun. 2014, 5, 5018. [Google Scholar] [CrossRef] [Green Version]
  47. Ma, Z.L.; Zhao, W.Q.; Zhao, C.Z.; Liu, M.; Zhu, P.; Liu, Q. Responses of soil inorganic nitrogen to increased temperature and plant removal during the growing season in a Sibiraea angustata scrub ecosystem of eastern Qinghai-Xizang Plateau. Chin. J. Plant Ecol. 2018, 42, 86–94. (In Chinese) [Google Scholar] [CrossRef]
  48. Zhu, J.B.; He, H.D.; Li, H.Q.; Zhang, F.W.; Li, Y.N.; Yang, Y.S.; Zhang, G.R.; Wang, C.Y.; Luo, F.L. The Response of CO2 Fluxes in Different Months to the Amplitude of Diurnal Temperature in Alpine Shrubland on the Qinghai-Tibetan Plateau During the Growing Season From 2003 to 2016. Acta Ecol. Sin. 2020, 40, 8773–8782. (In Chinese) [Google Scholar] [CrossRef]
  49. Klein, J.A.; Harte, J.; Zhao, X.Q. Decline in Medicinal and Forage Species with Warming is Mediated by Plant Traits on the Tibetan Plateau. Ecosystems 2008, 11, 775–789. [Google Scholar] [CrossRef]
  50. He, P.; Li, J.Y.; Li, Y.F.; Xu, N.; Gao, Y.; Guo, L.F.; Huo, T.T.; Peng, C.; Meng, F.Y. Habitat protection and planning for three Ephedra using the MaxEnt and Marxan models. Ecol. Indic. 2021, 133, 108399. [Google Scholar] [CrossRef]
  51. Feng, X.Y.; Zhao, W.Z.; Lin, P.F.; Wang, C. The main woody plant functional traits and altitude differences on the northern slope of Qilian Mountains. Acta Ecol. Sin. 2022, 42, 10. (In Chinese) [Google Scholar] [CrossRef]
  52. Cao, Q.; Gao, Q.B.; Guo, W.J.; Zhang, Y.; Wang, Z.H.; Ma, X.L.; Zhang, F.Q.; Chen, S.L. Impacts of human activities and environmental factors on potential distribution of Swertia przewalskii Pissjauk., an endemic plant in Qing-Tibetan Plateau, using MaxEnt. Plant Sci. J. 2021, 39, 22–31. (In Chinese) [Google Scholar] [CrossRef]
  53. Hu, Z.J.; Zhang, Y.L.; Yu, H.B. Simulation of Stipa purpurea distribution pattern on Tibetan Plateau based on MaxEnt model and GIS. Chin. J. Appl. Ecol. 2015, 26, 505–511. (In Chinese) [Google Scholar] [CrossRef]
  54. Cuo, L.; Zhang, Y.X.; Li, N. Historical and future vegetation changes in the degraded frozen soil and the entire Tibetan Plateau and climate drivers. J. Geophys. Res. Biogeo. 2022, 127, e2022JG006987. [Google Scholar] [CrossRef]
  55. Guo, Y.B.; Mo, K.; Wang, G.R.; Zhang, Y.; Zhang, W.; Zhou, J.G.; Sun, Z.R. Analysis of Prediction and Spatial-temporal Changes of Suitable Distribution of Gastrodiae Rhizoma under Future Climate Conditions. Chin. J. Inf. Tradi. Chin. Med. 2022, 29, 1–7. (In Chinese) [Google Scholar] [CrossRef]
  56. Wang, W.T.; Yang, T.T.; Jin, L.; Jiang, J.M. Vulnerability of two Rhodiola species under climate change in the future. Biodivers. Sci. 2021, 29, 1620–1628. [Google Scholar] [CrossRef]
Figure 1. The location of the study area.
Sustainability 15 02833 g001
Figure 2. The correlation analysis of modeling variables.
Sustainability 15 02833 g002
Figure 3. Climate suitable area of FPM distribution in historical.
Sustainability 15 02833 g003
Figure 4. Distribution of potential suitable areas for FPM on the Qinghai–Tibet Plateau in the 2021–2040 period ((a): SSP126, (b): SSP245, (c): SSP370, (d): SSP585).
Sustainability 15 02833 g004
Figure 5. Distribution of potential suitable areas for FPM on the Qinghai–Tibet Plateau in the 2041–2060 period ((a): SSP126, (b): SSP245, (c): SSP370, (d): SSP585).
Sustainability 15 02833 g005
Figure 6. Distribution of potential suitable areas for FPM on the Qinghai–Tibet Plateau in the 2061–2080 period ((a): SSP126, (b): SSP245, (c): SSP370, (d): SSP585).
Sustainability 15 02833 g006
Figure 7. Distribution of potential suitable areas for FPM on the Qinghai–Tibet Plateau in the 2081–2100 period ((a): SSP126, (b): SSP245, (c): SSP370, (d): SSP585).
Sustainability 15 02833 g007
Table 1. The contribution rates of each factor obtained by preliminary screening.
FactorContributionFactorContribution
Vegetation30.7Bio100.2
NPP26.6Bio30.2
Soil23.2bio140.2
Bio78.1NDVI0.2
Pop3.6Bio60.1
Slope2Bio40.1
GDP1.1Bio20
Aspect1Bio80
Bio10.8Bio130
Elevation0.5Bio110
Bio190.4Bio180
Bio50.4Bio160
Bio90.3Bio170
Bio150.2Bio120
Table 2. The contribution rates of each factor obtained by final screening.
FactorContributionFactorContribution
Vegetation30.5Bio90.7
NPP26.5Elevation0.5
Soil23Bio190.4
Bio779Bio150.3
Pop3.5Bio30.3
Slope2.1Bio140.2
Bio11.8NDVI0.2
GDP1.1Bio40.1
Aspect1Bio60.1
Disclaimer/Publisher’s Note: The statements, opinions and data contained in all publications are solely those of the individual author(s) and contributor(s) and not of MDPI and/or the editor(s). MDPI and/or the editor(s) disclaim responsibility for any injury to people or property resulting from any ideas, methods, instructions or products referred to in the content.

