
Spatial-Temporal Distribution Pattern and Tourism Utilization Potential of Intangible Cultural Heritage Resources in the Yellow River Basin
Abstract
:1. Introduction
2. Literature Review
2.1. Concept of ICH
2.2. ICH Tourism
2.3. Application of GIS in the Study of ICH
2.4. Tourism Utilization Potential of ICH Resources
3. Materials and Methods
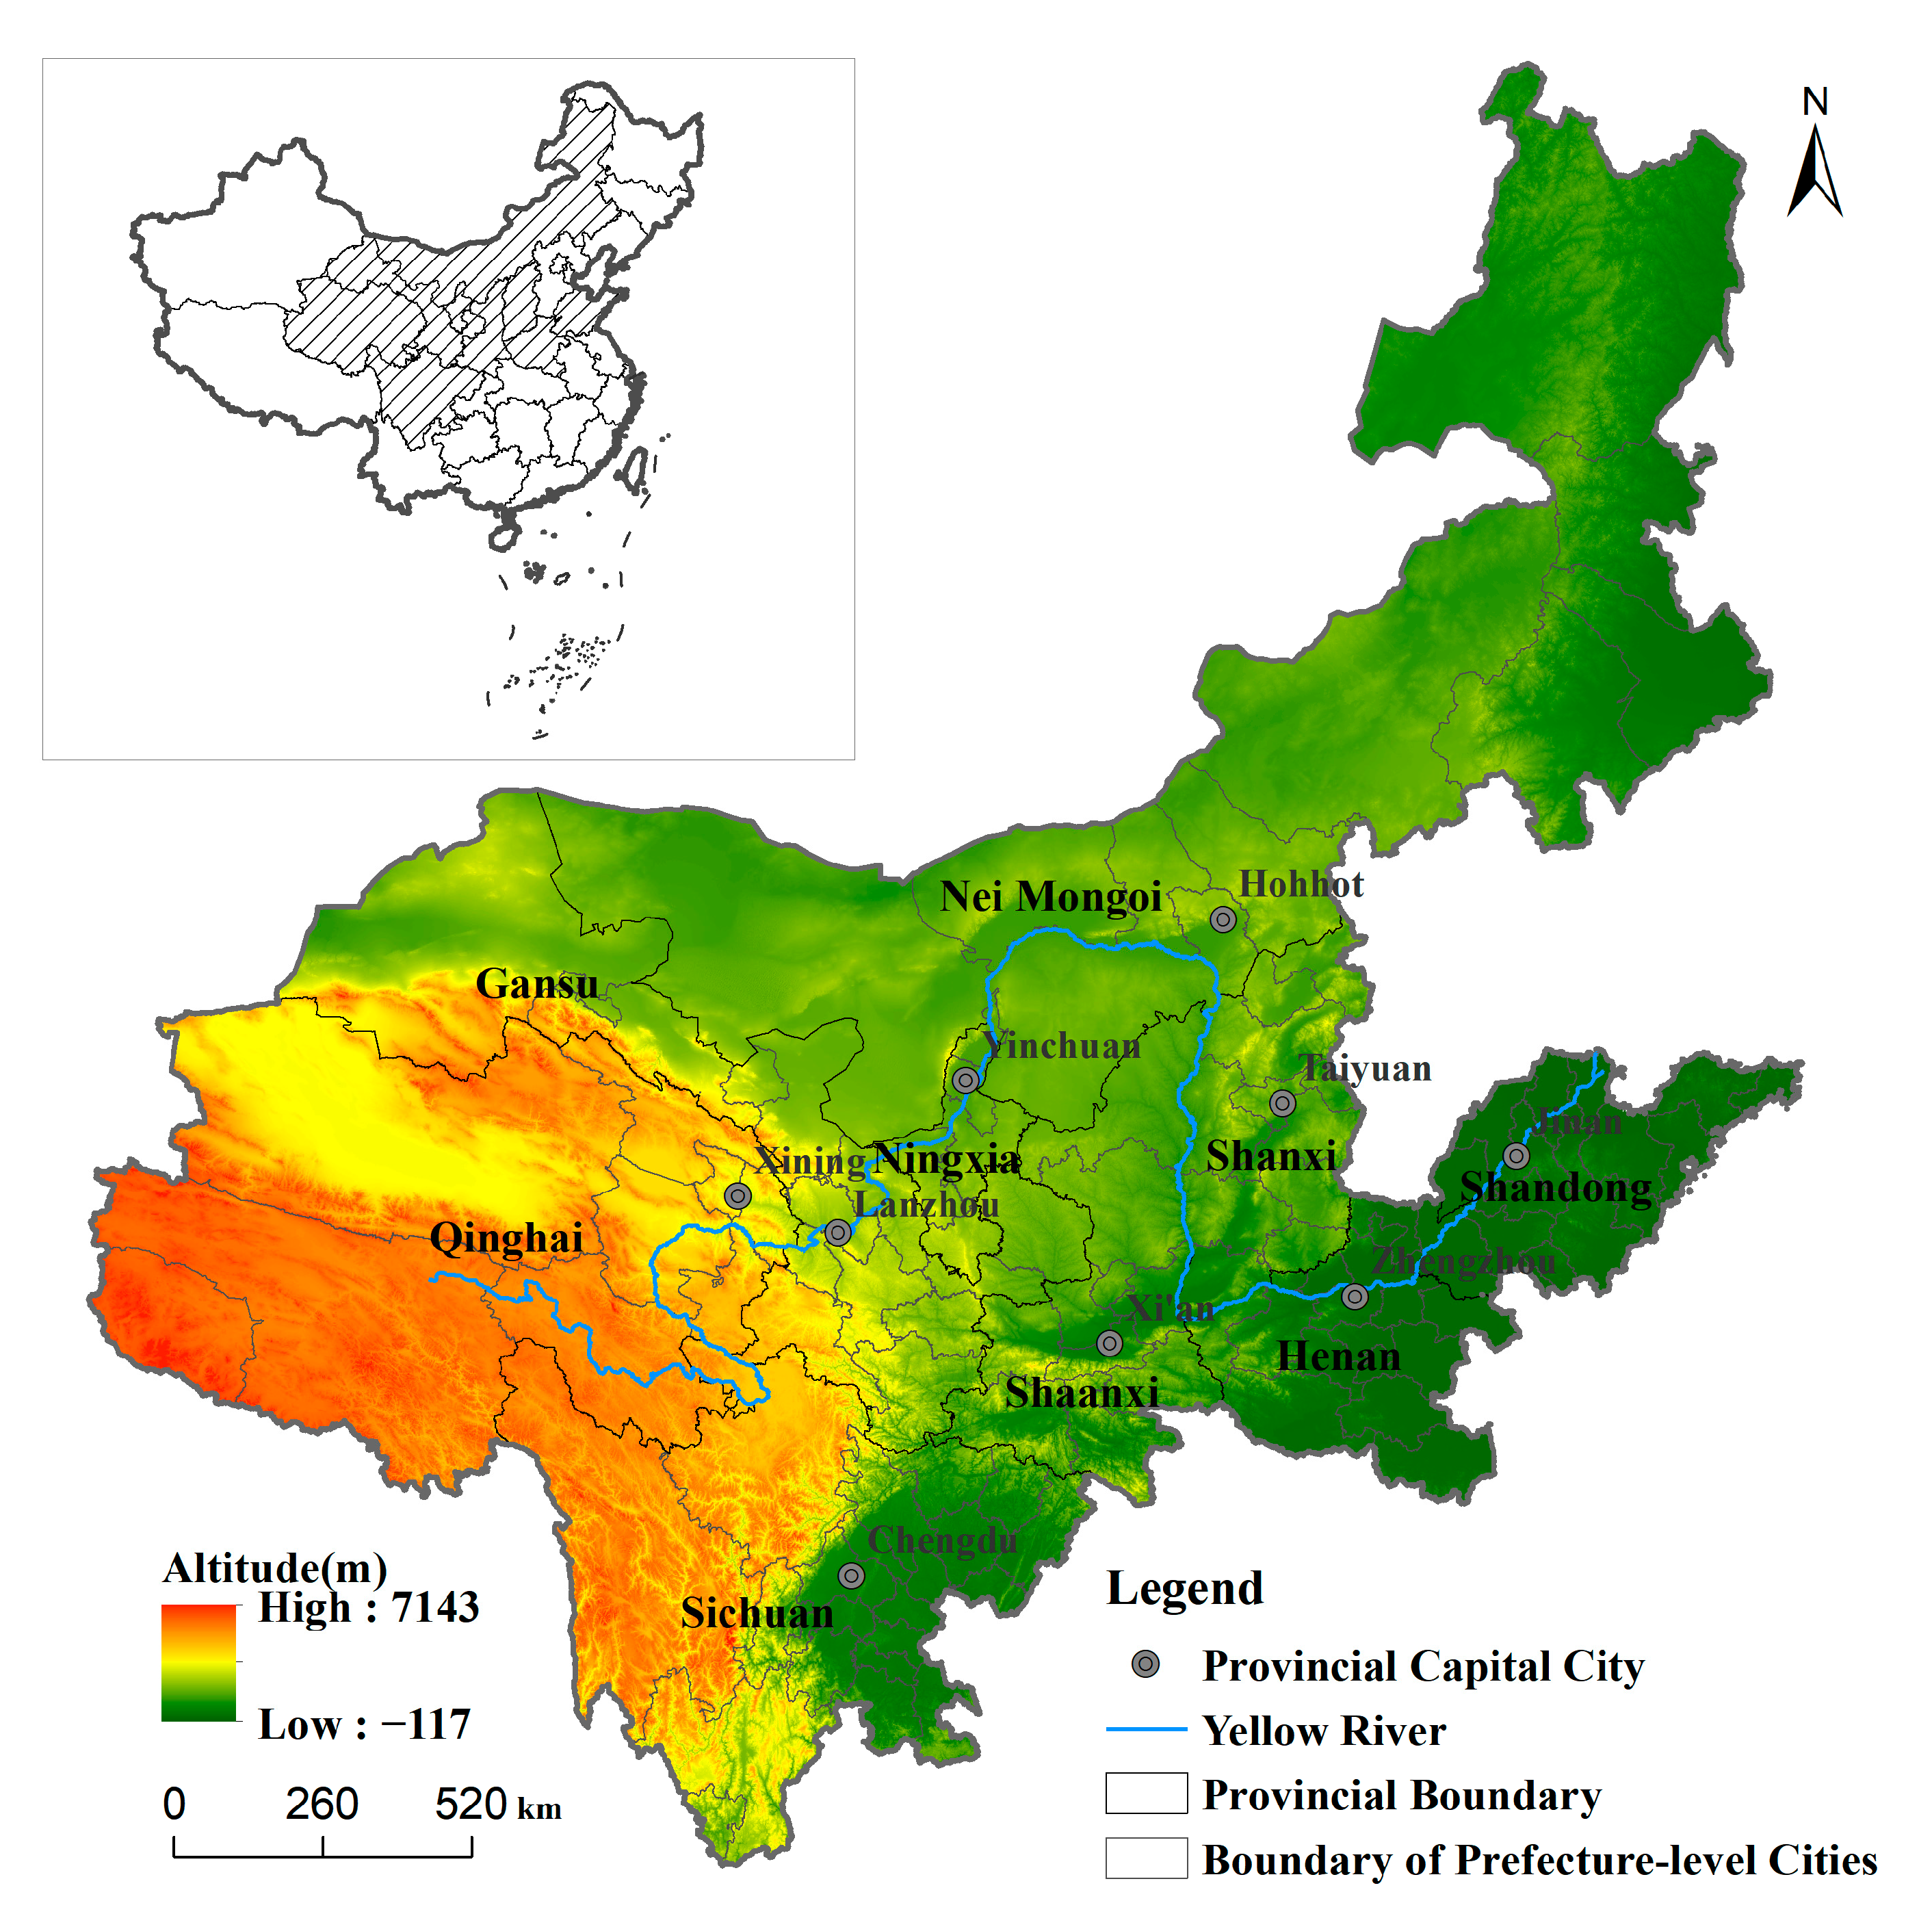
3.1. Study Area
3.2. Data Sources
3.3. Methods
3.3.1. Nearest Neighbor Index
3.3.2. Kernel Density Analysis
3.3.3. Standard Deviation Ellipse
3.3.4. Spatial Autocorrelation
3.3.5. RMP Analysis
3.3.6. Entropy Weight Method
4. Results and Analysis
4.1. Temporal and Spatial Pattern of National ICH Resources
4.1.1. Spatial Distribution Pattern
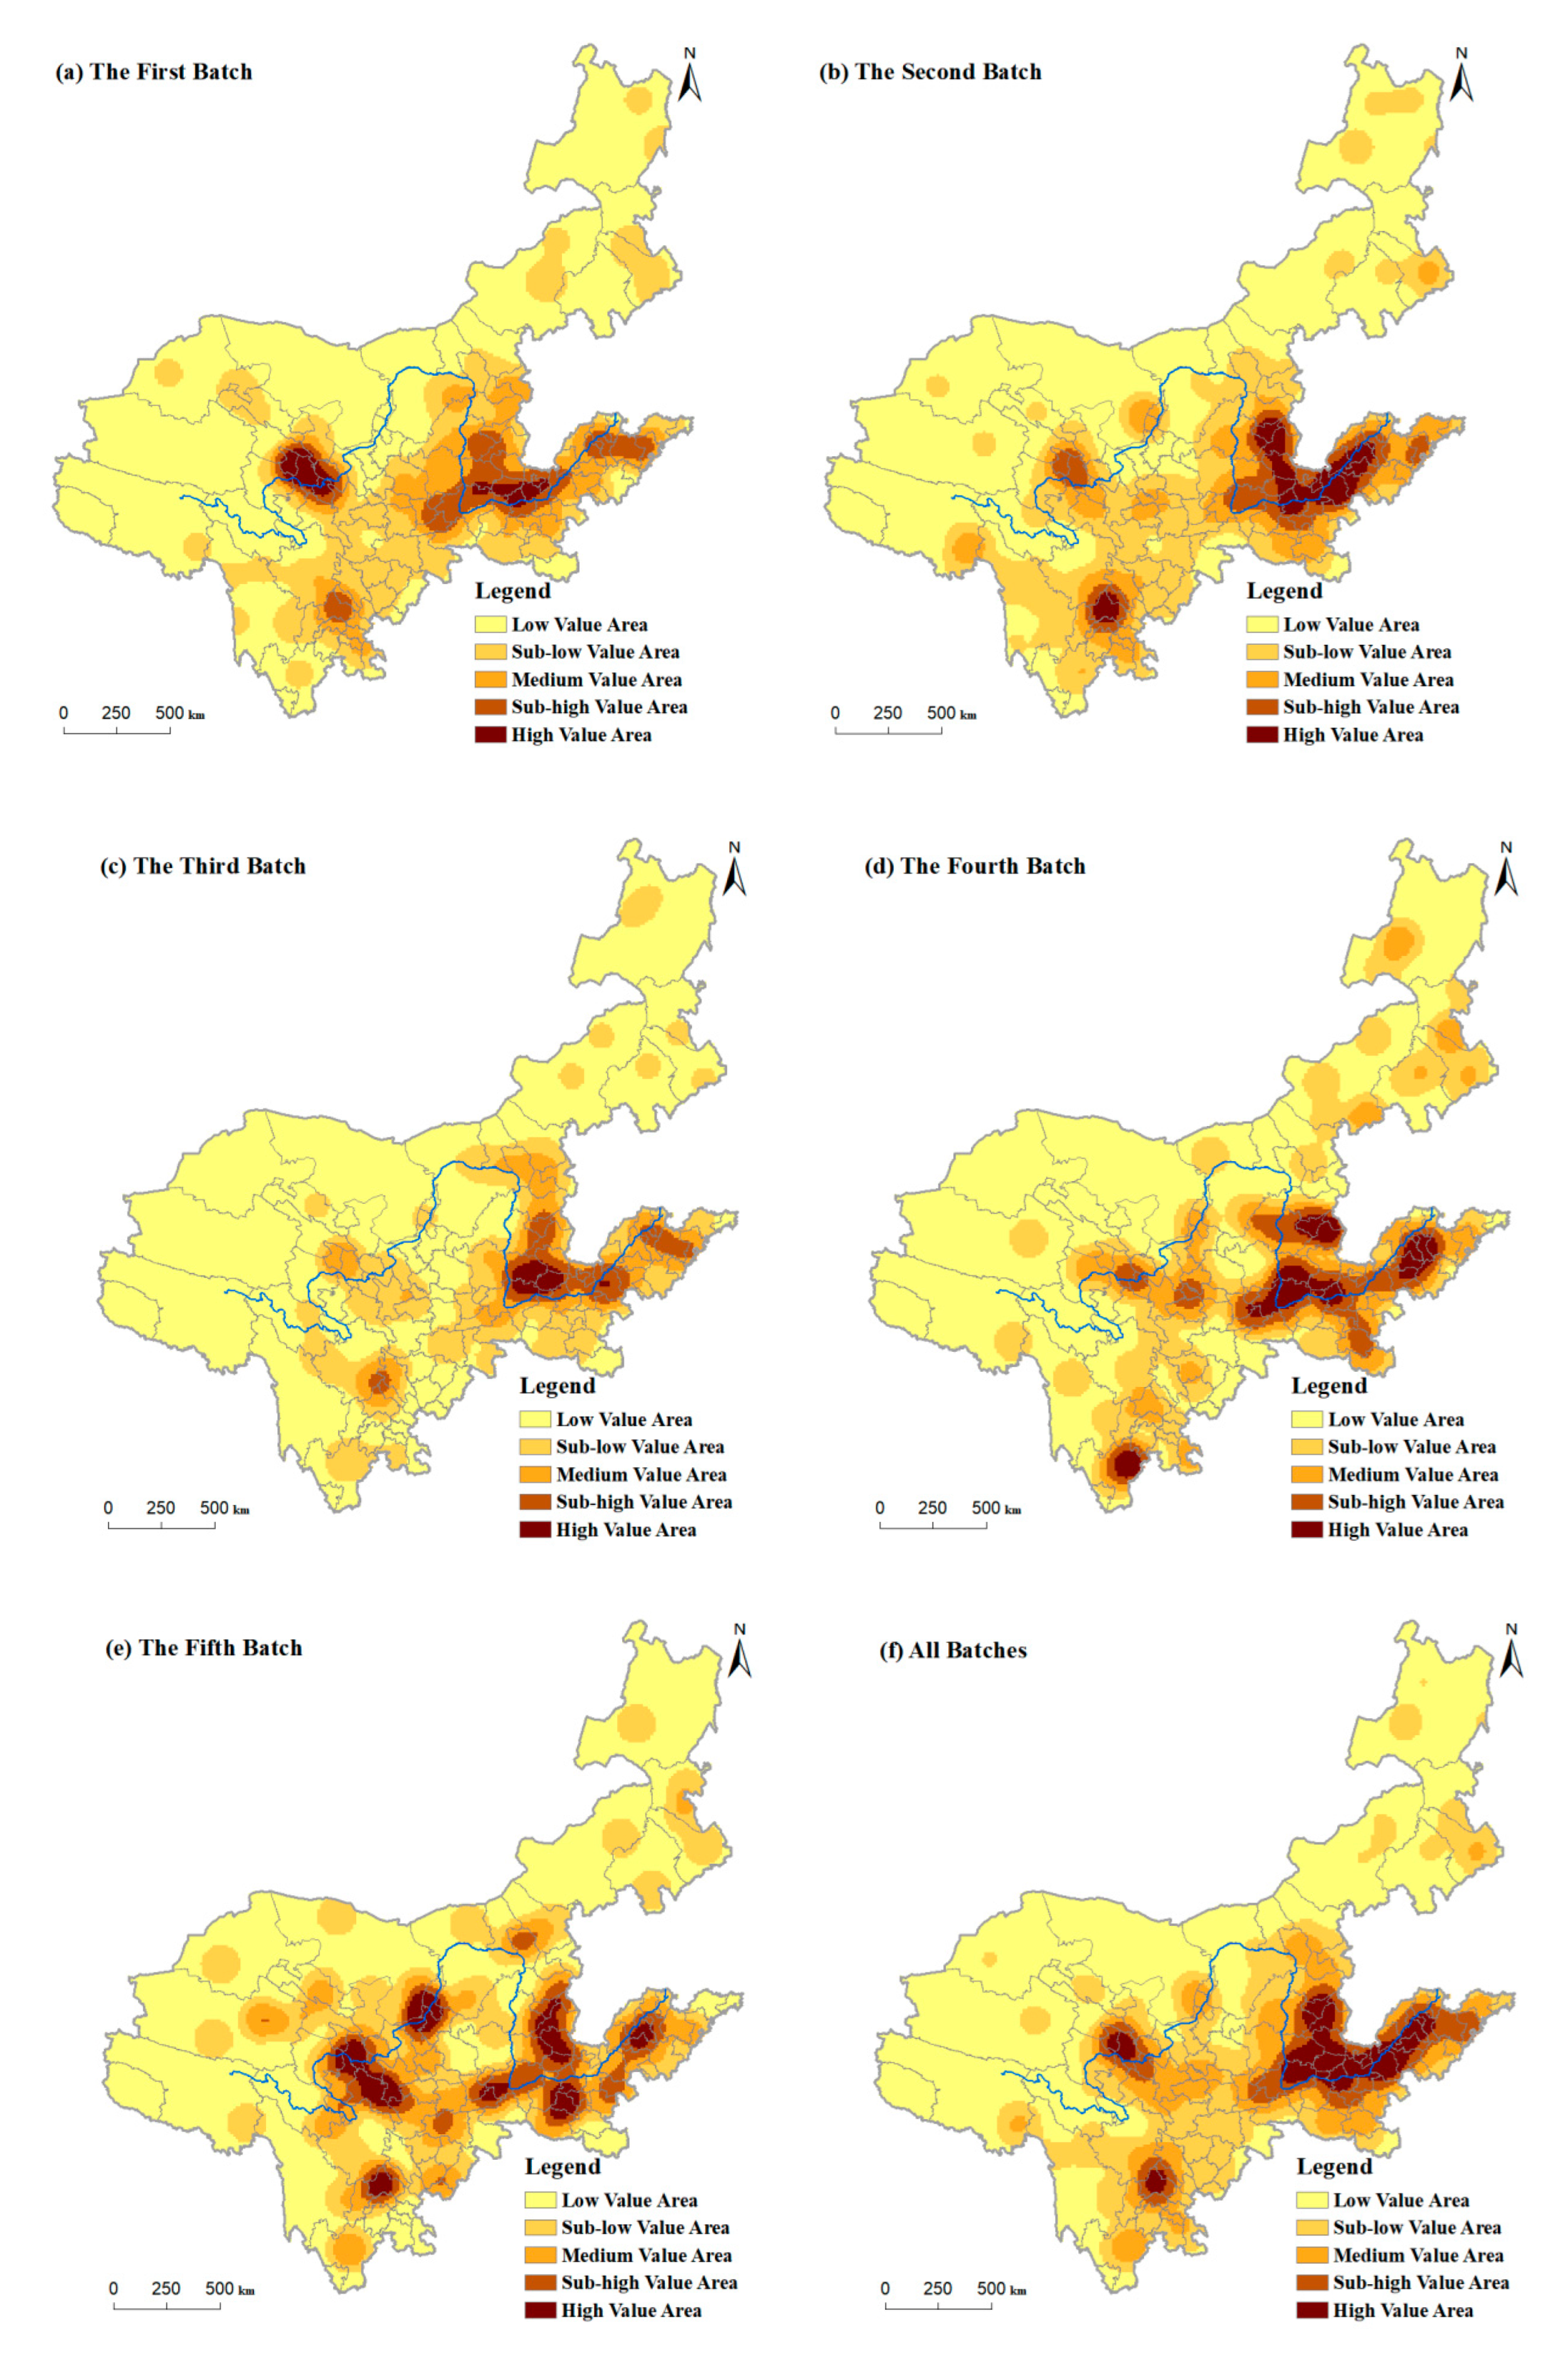
4.1.2. Spatial Distribution Density

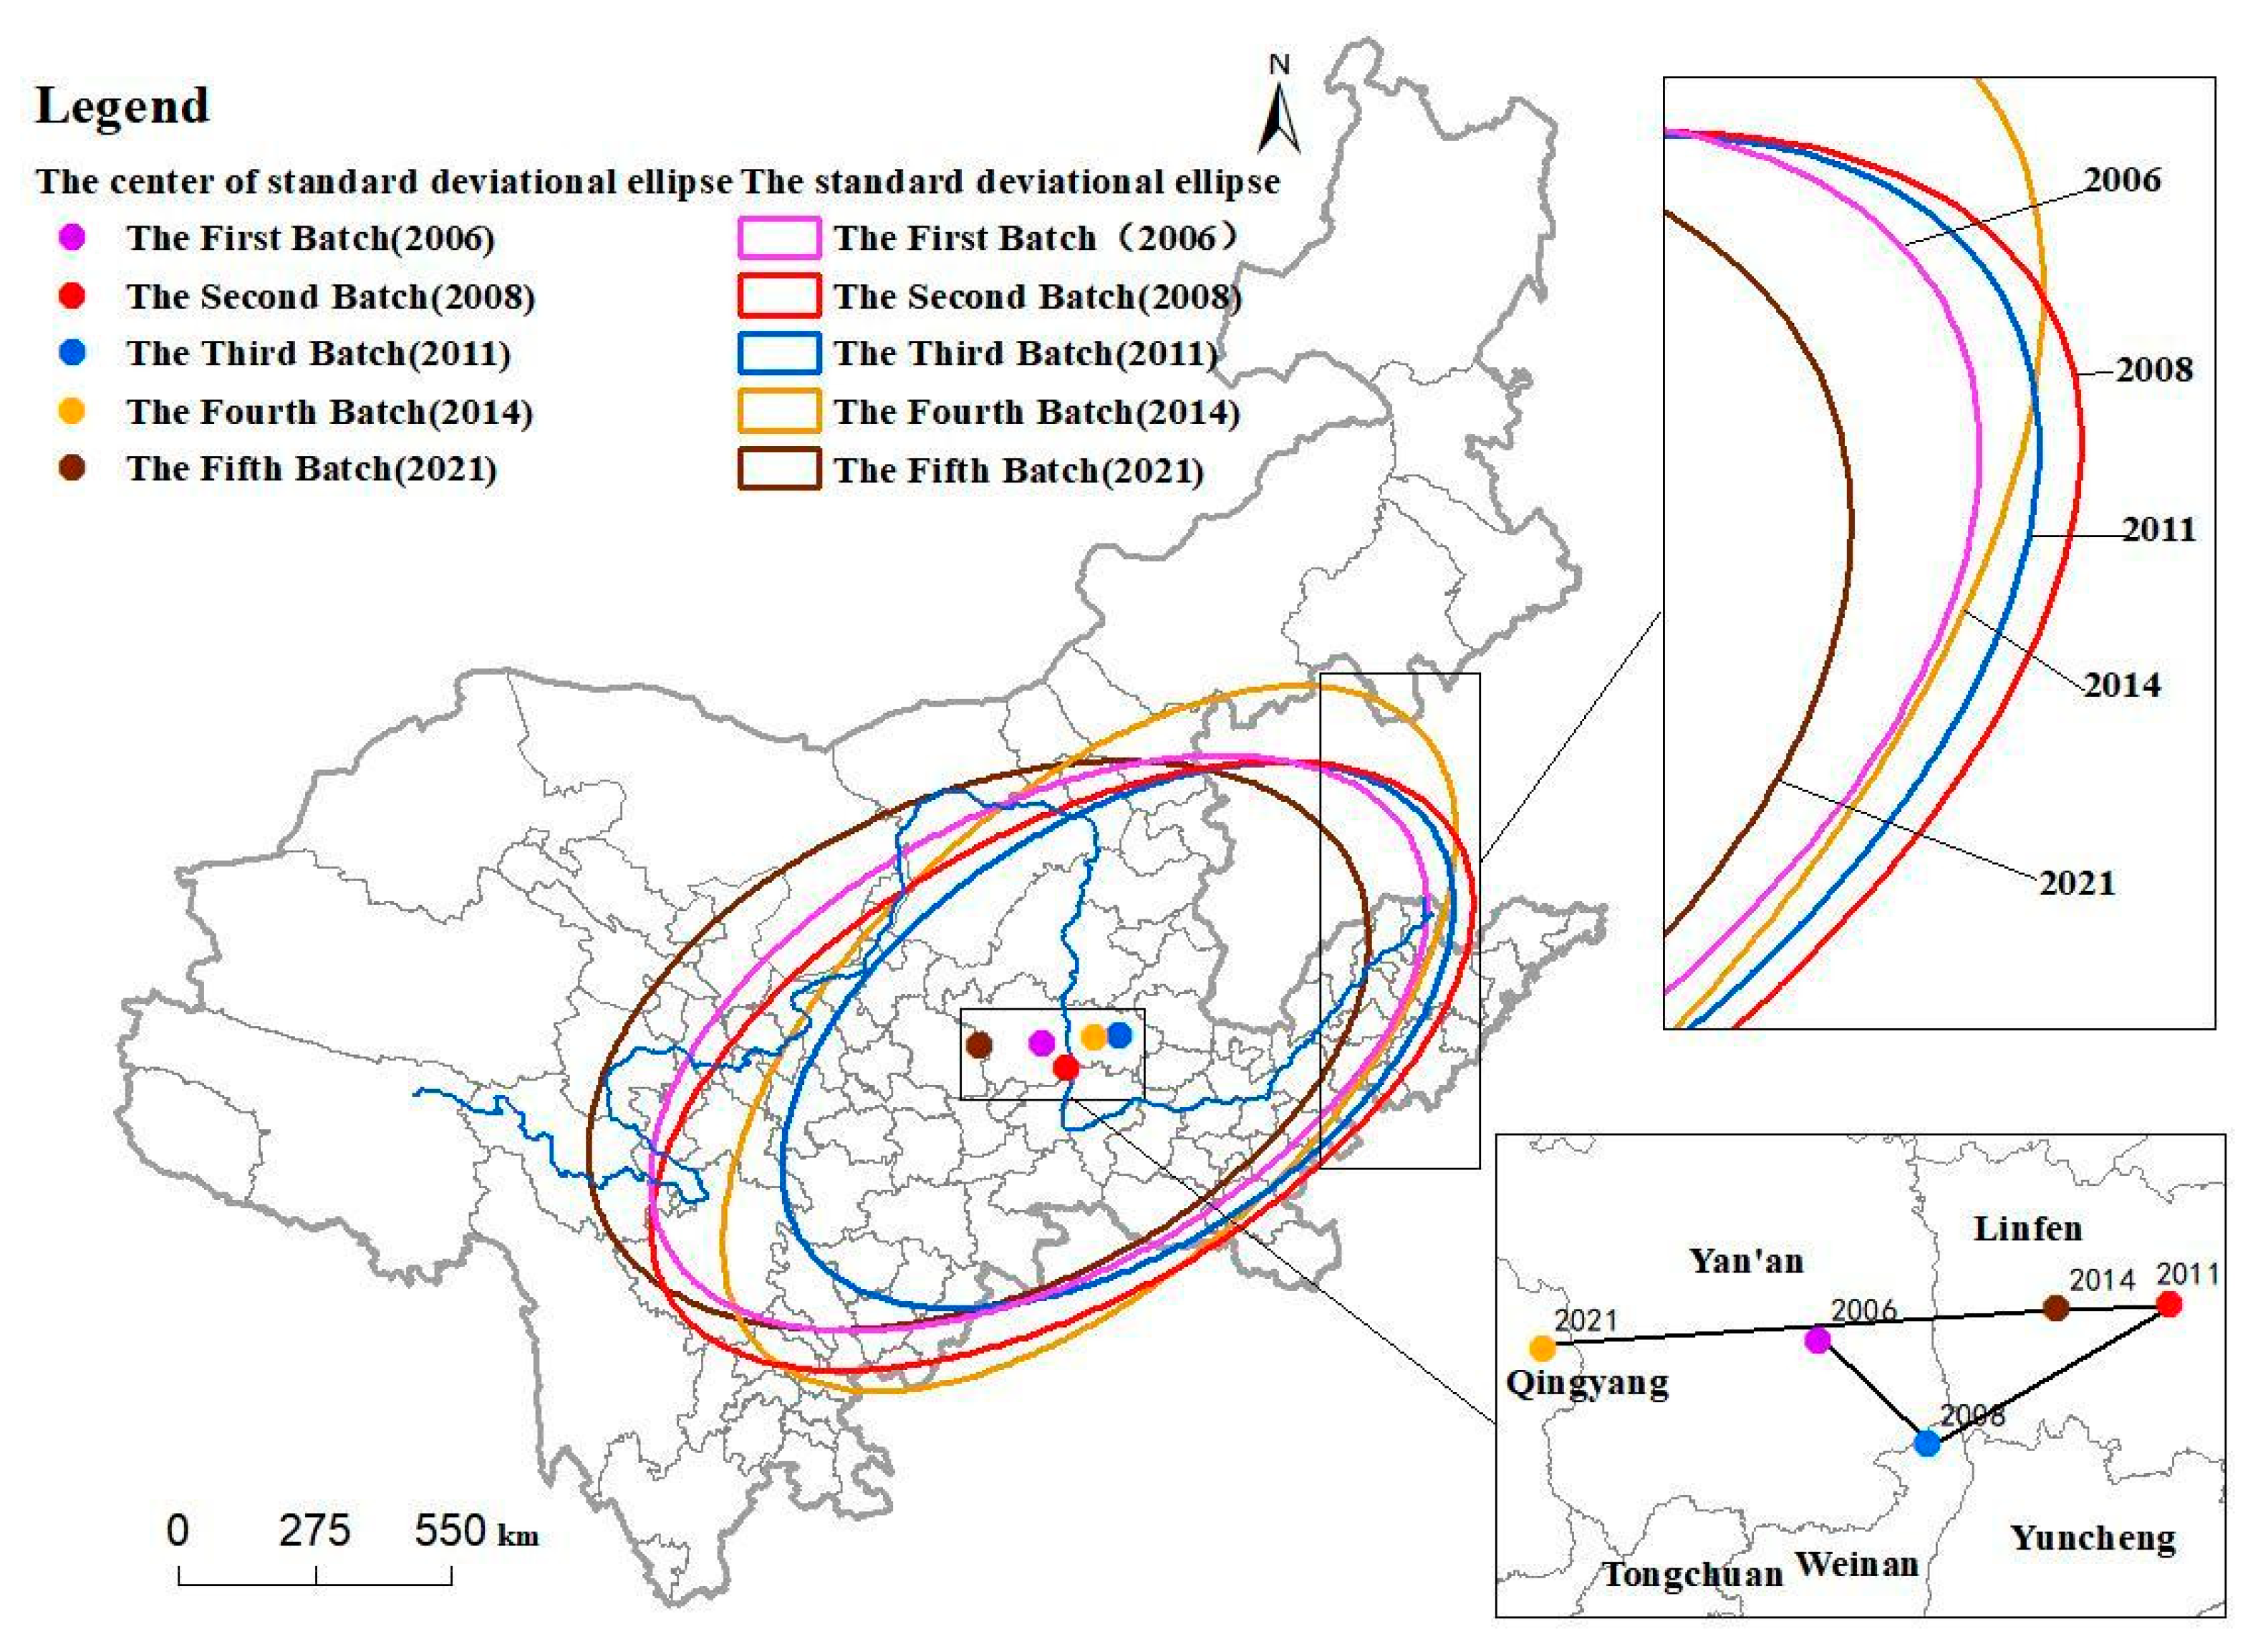
4.1.3. Spatial Differentiation Characteristics
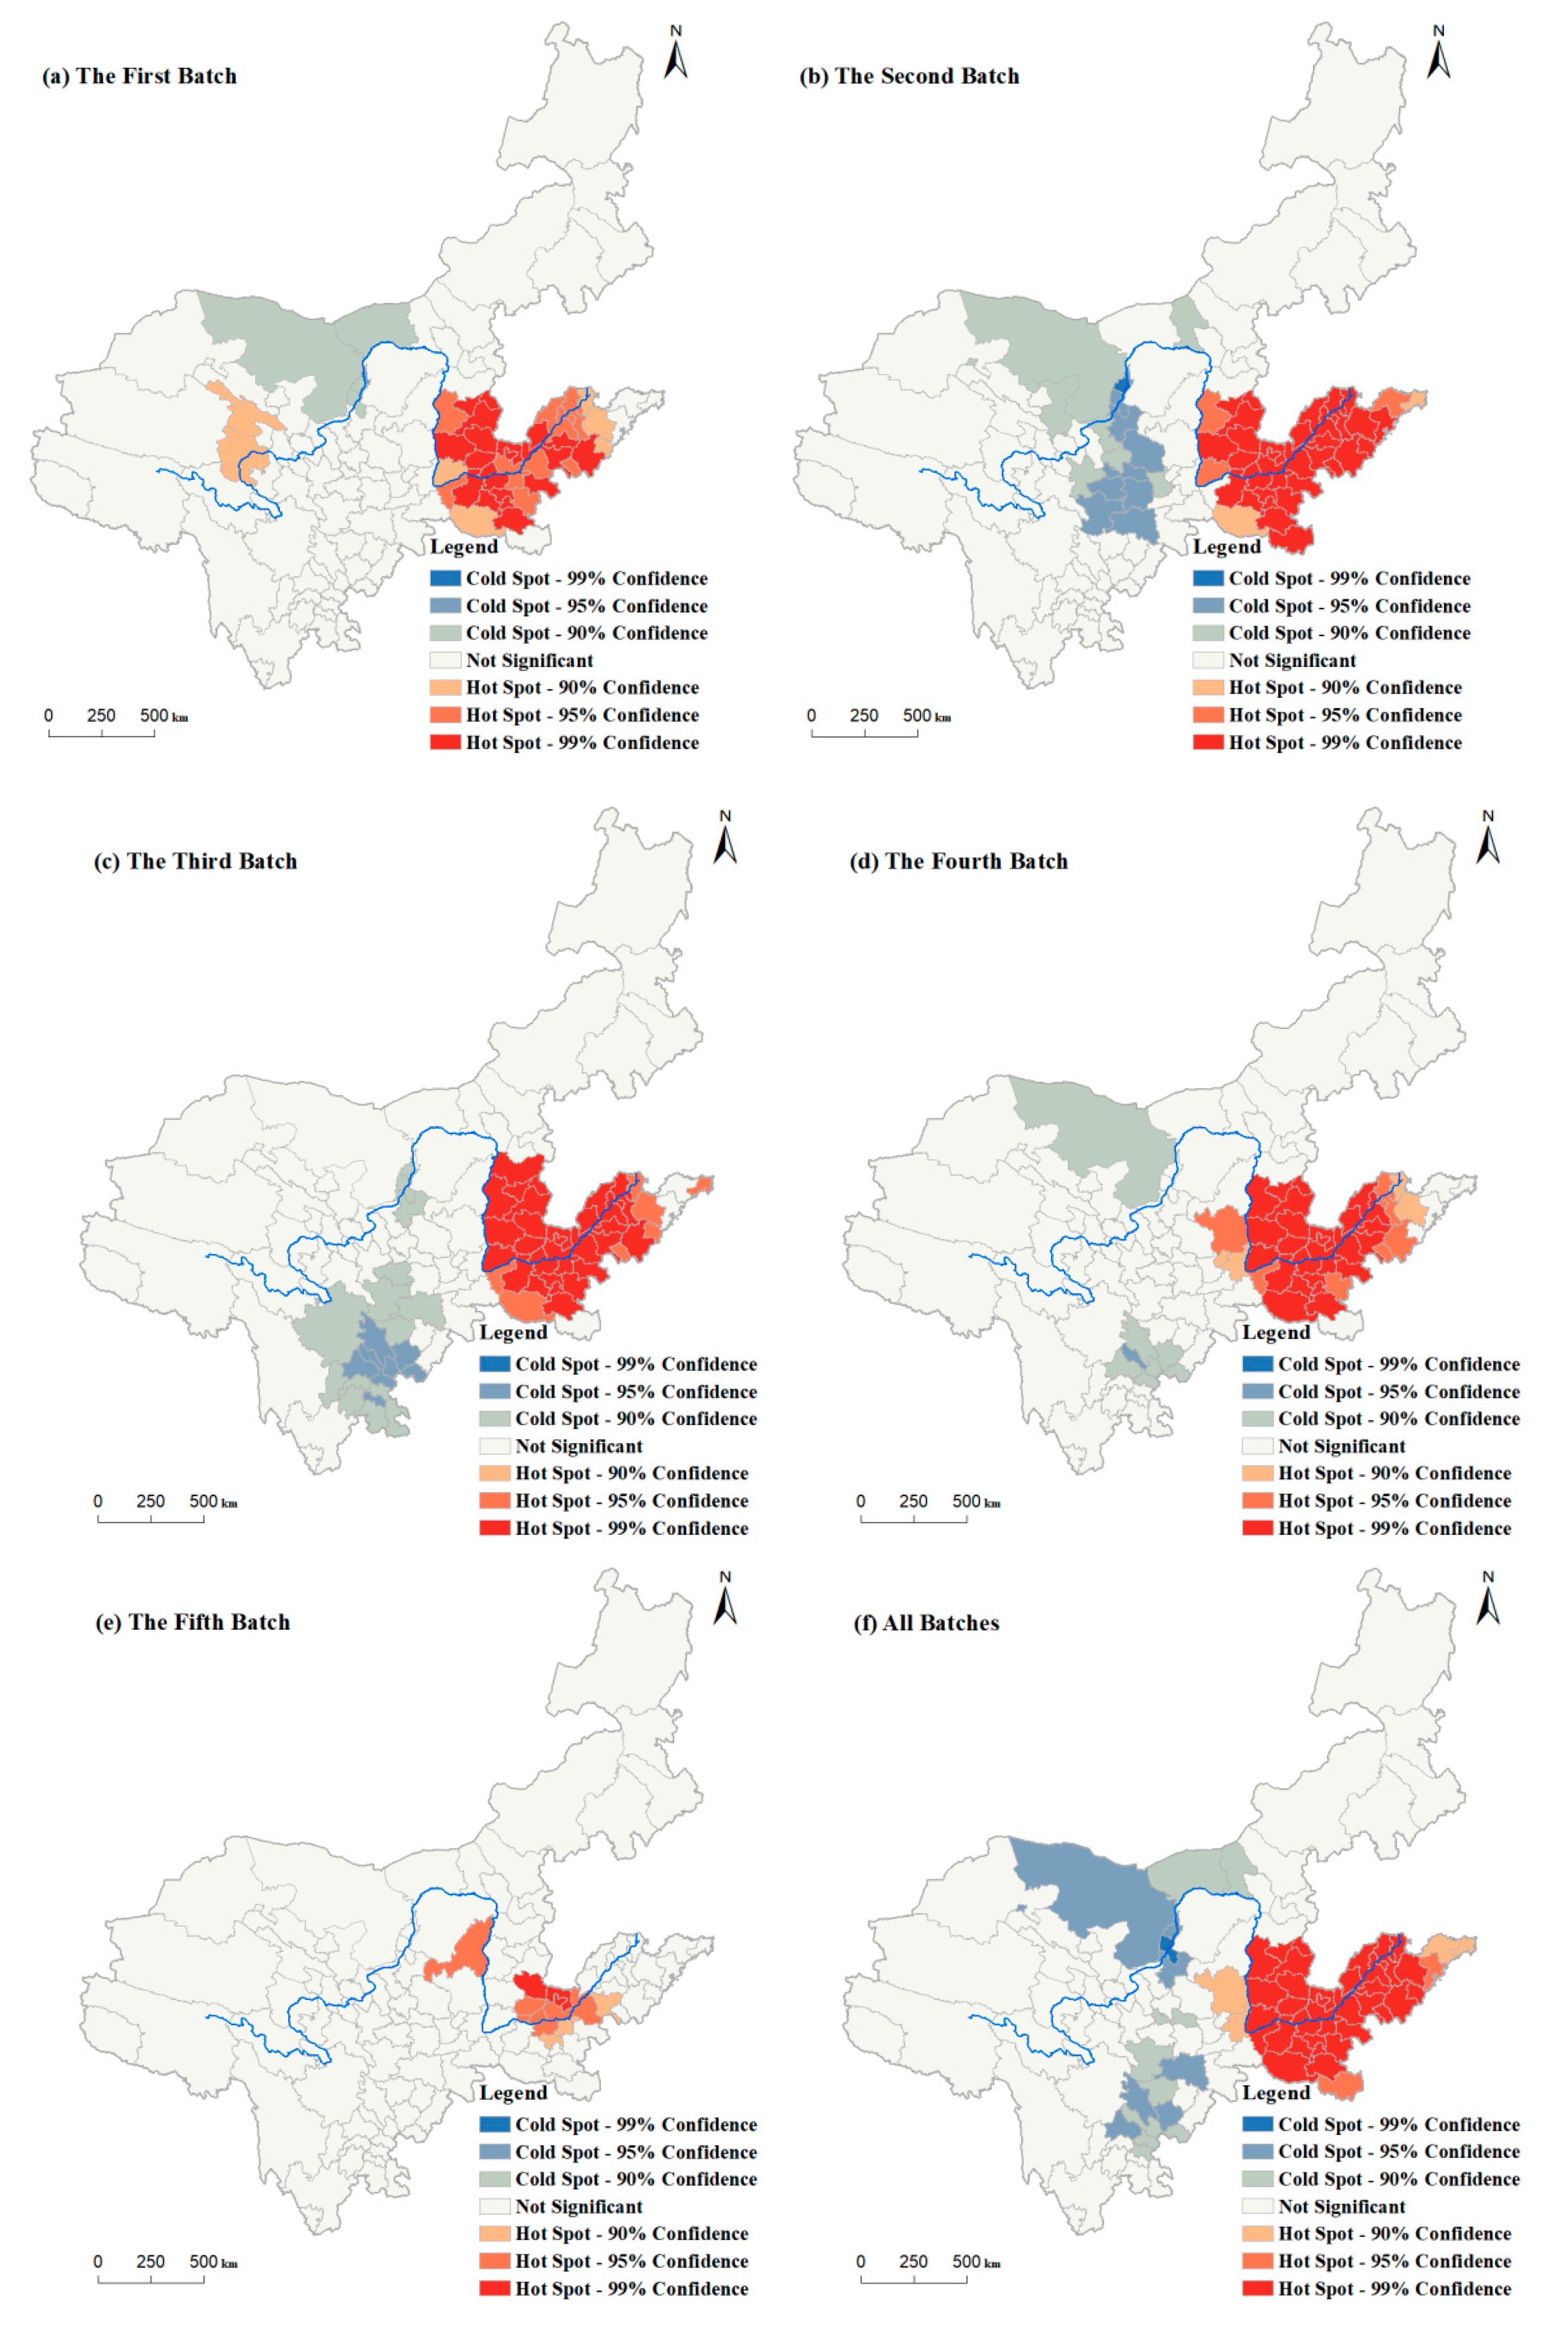
4.1.4. Spatial Autocorrelation Characteristics
4.2. Evaluation of Tourism Utilization Potential of National ICH Resources
4.2.1. Index System for Evaluation of Tourism Utilization Potential of ICH
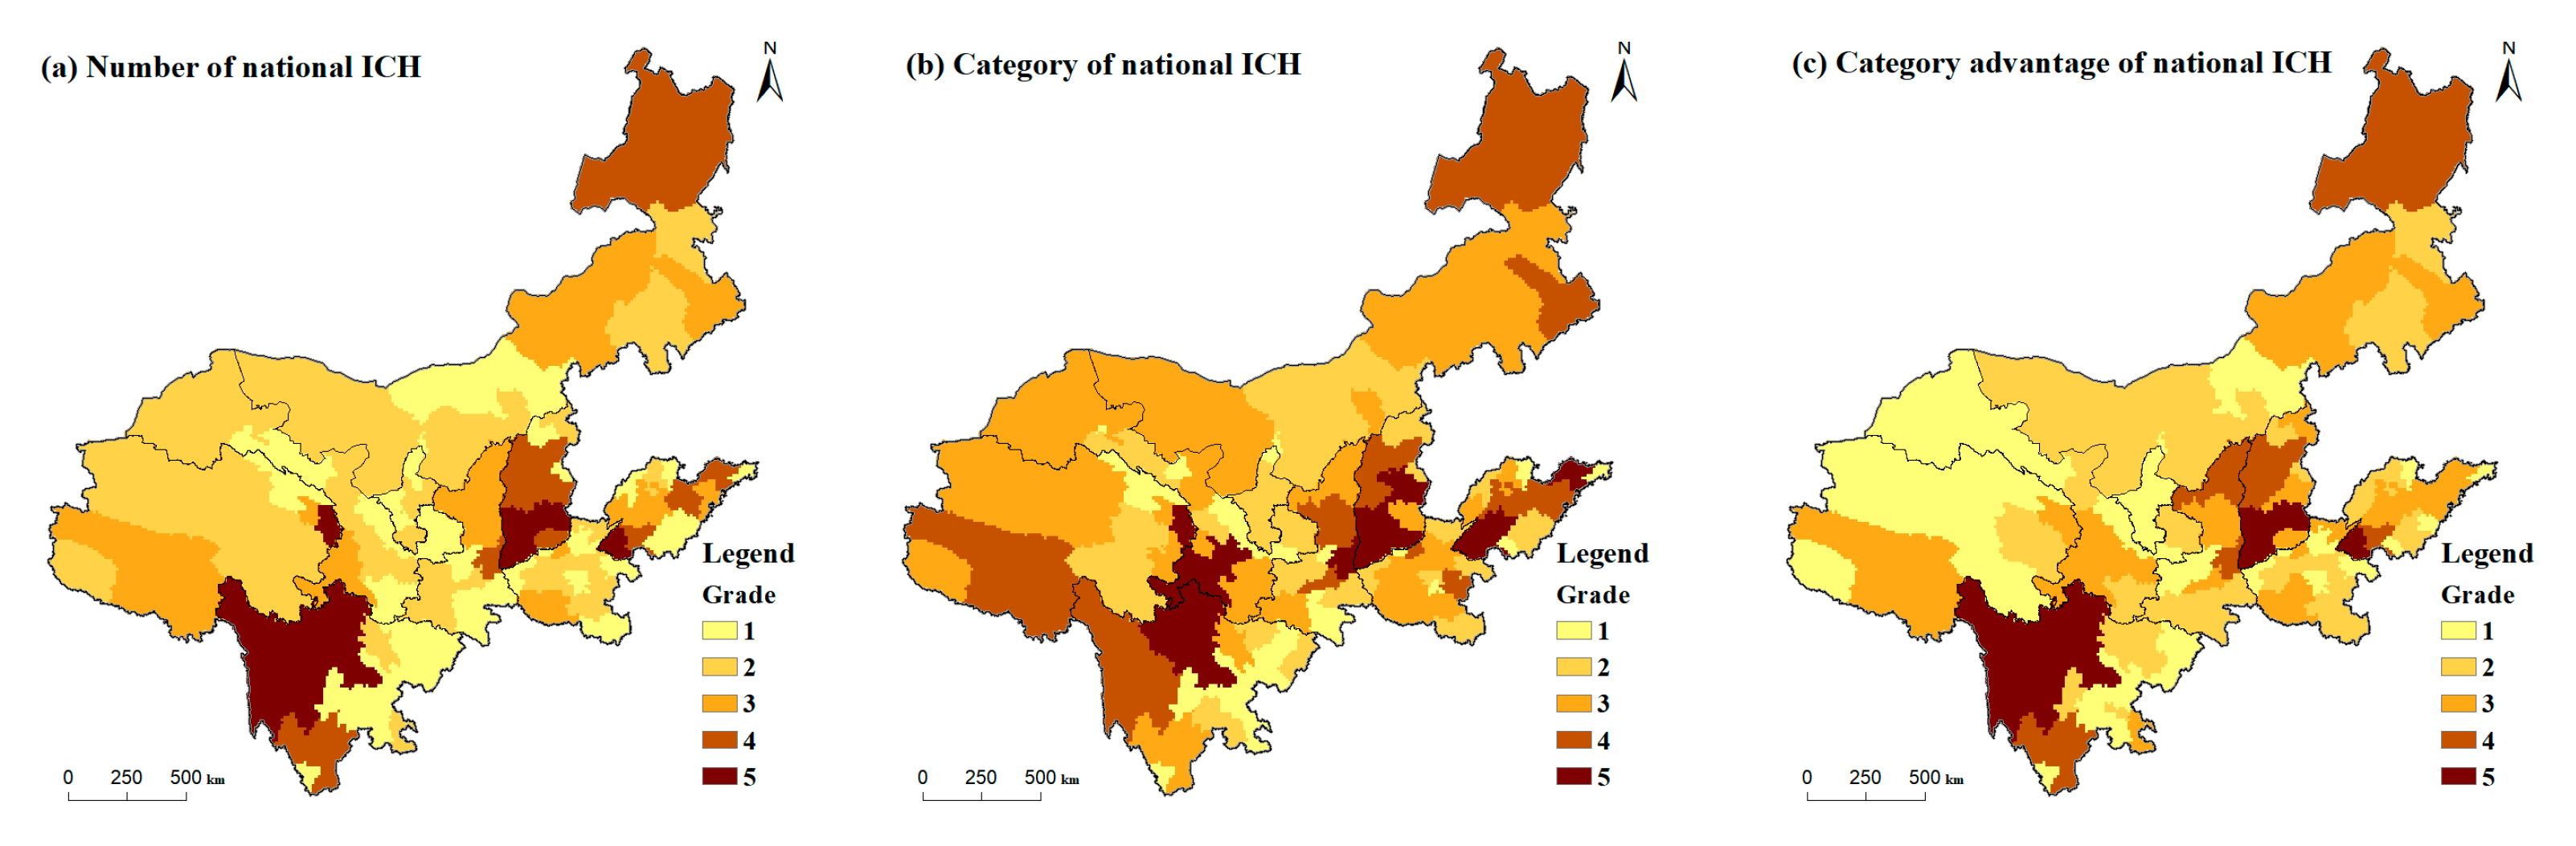
4.2.2. Grading of Single Factor Evaluation
- (1)
- Core resources
- (2)
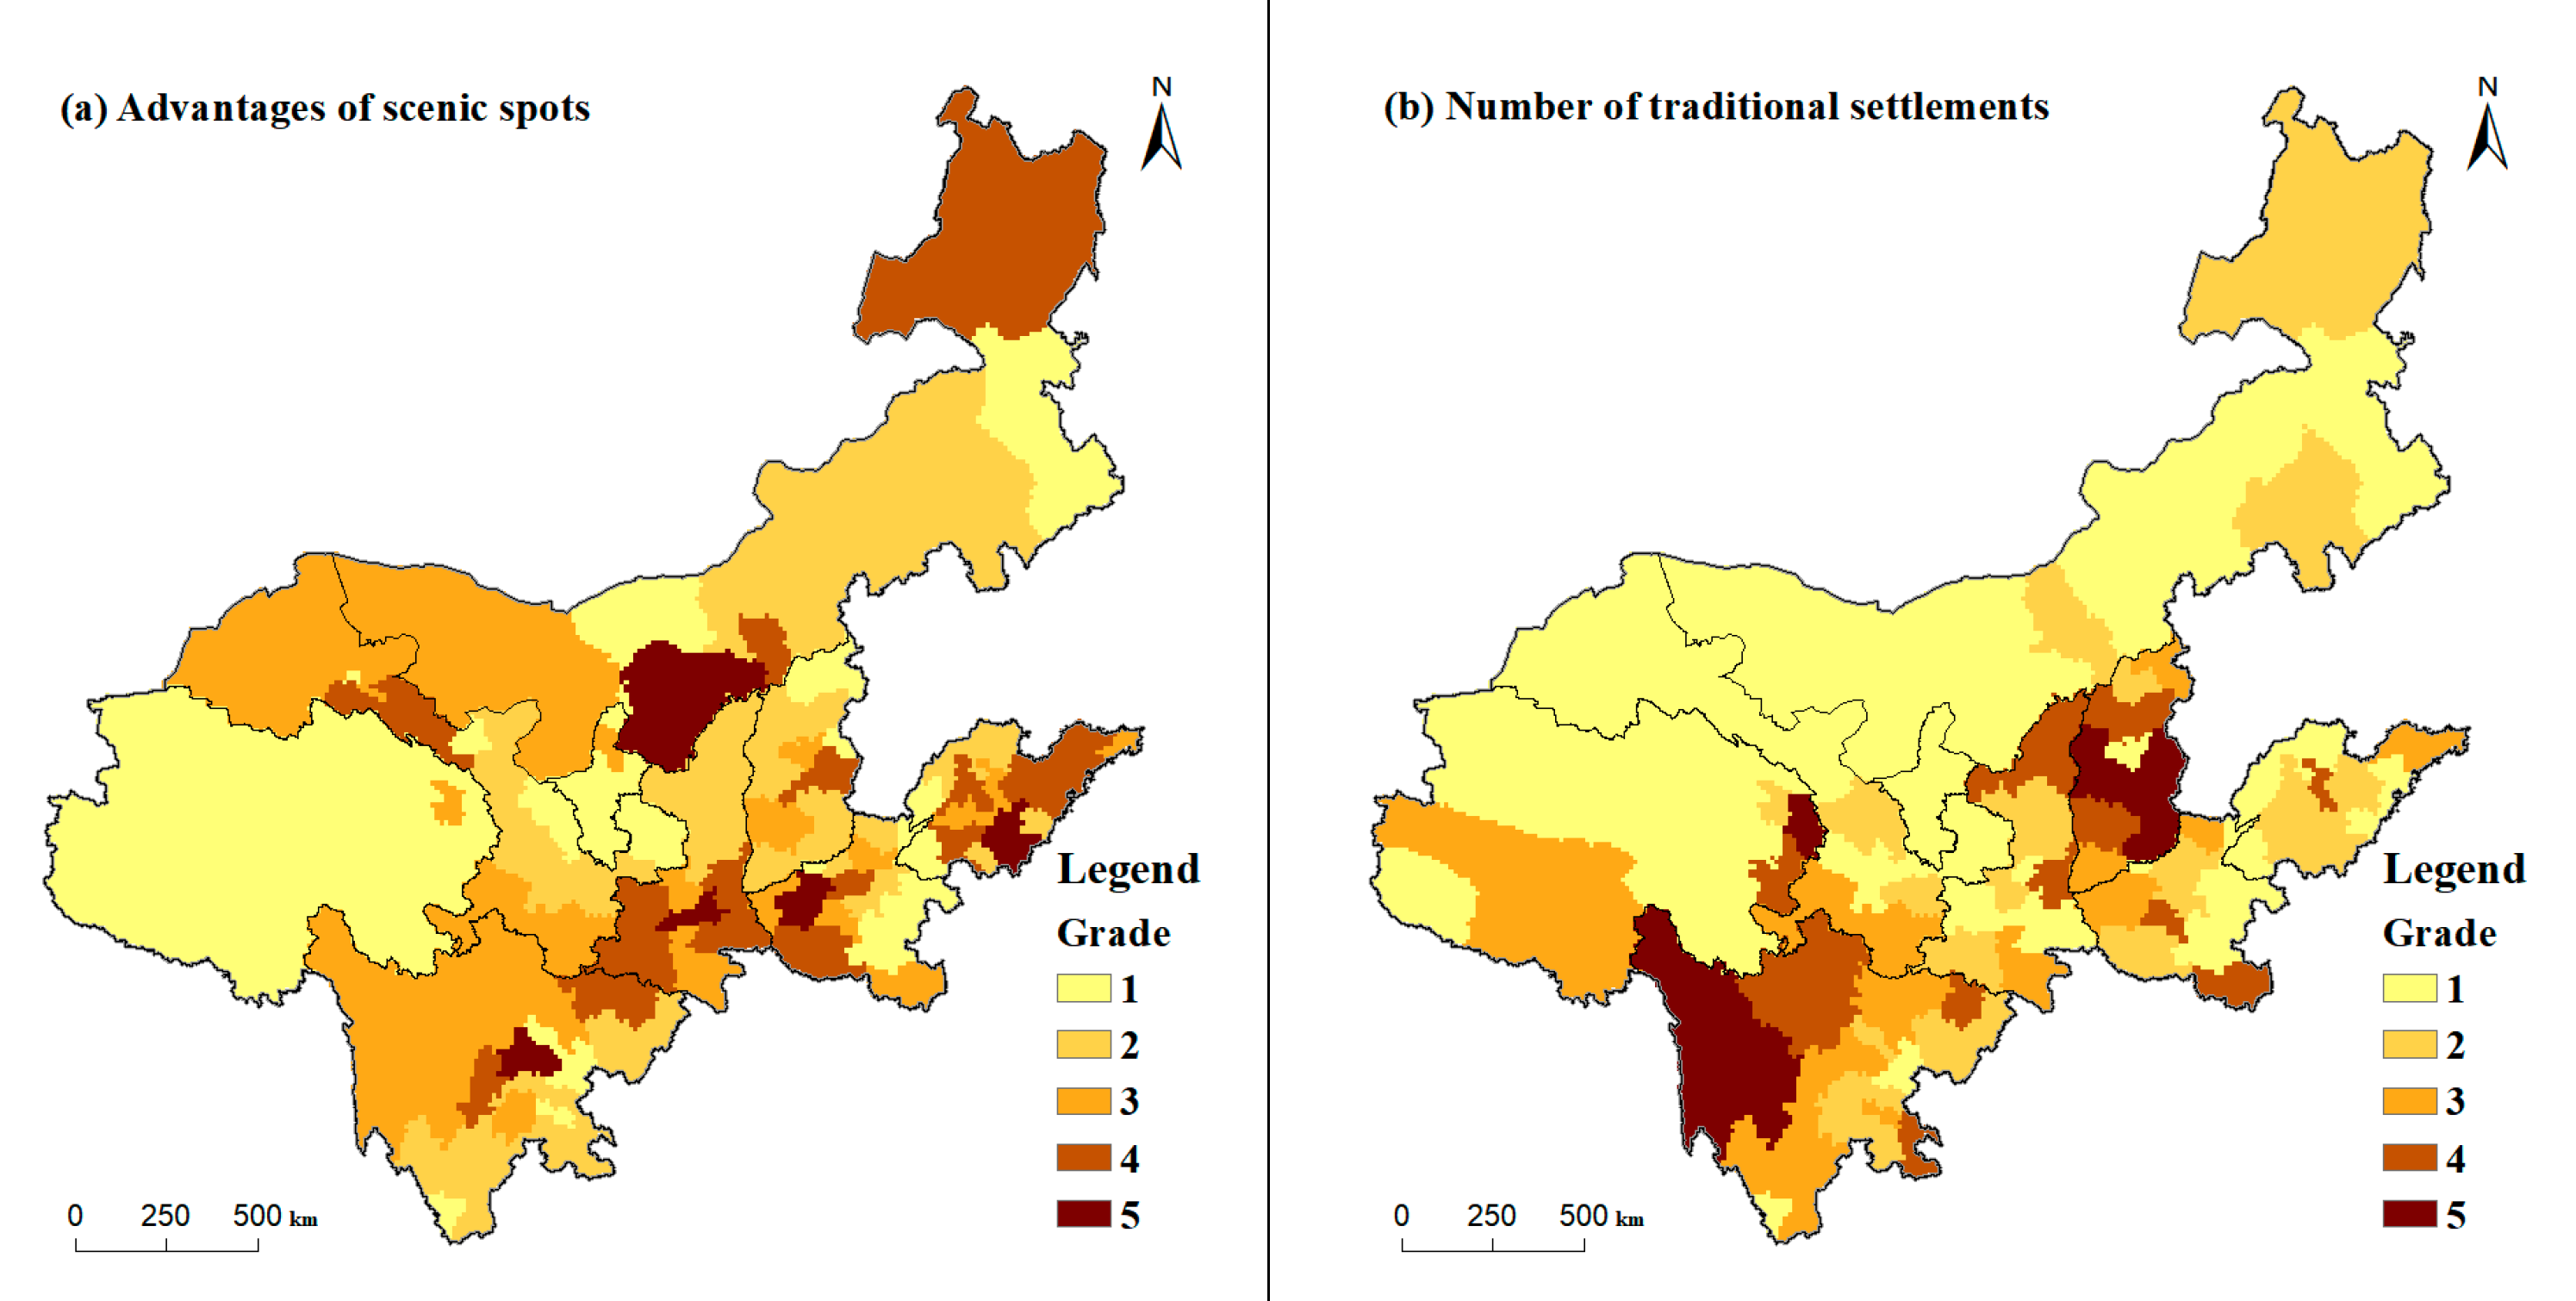
- Tangible carrier
- (3)
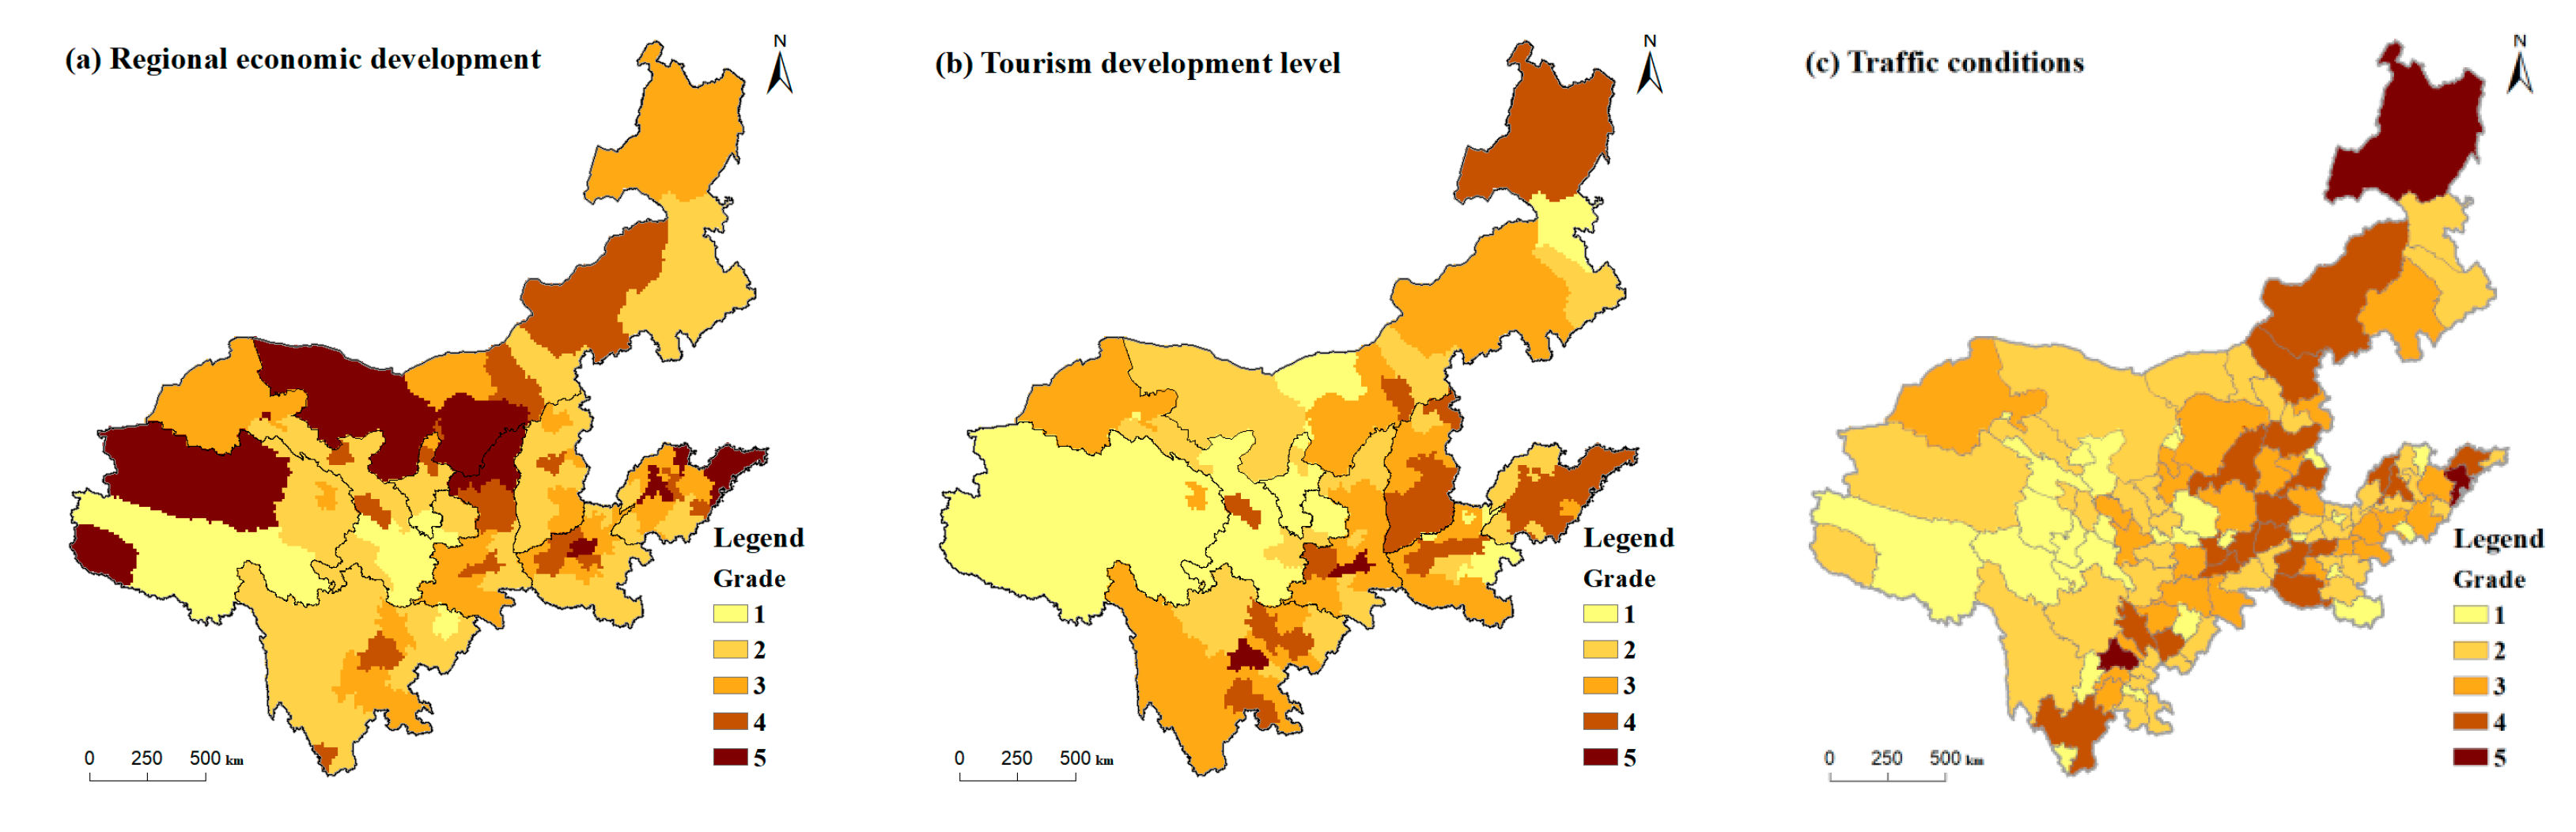
- External environment
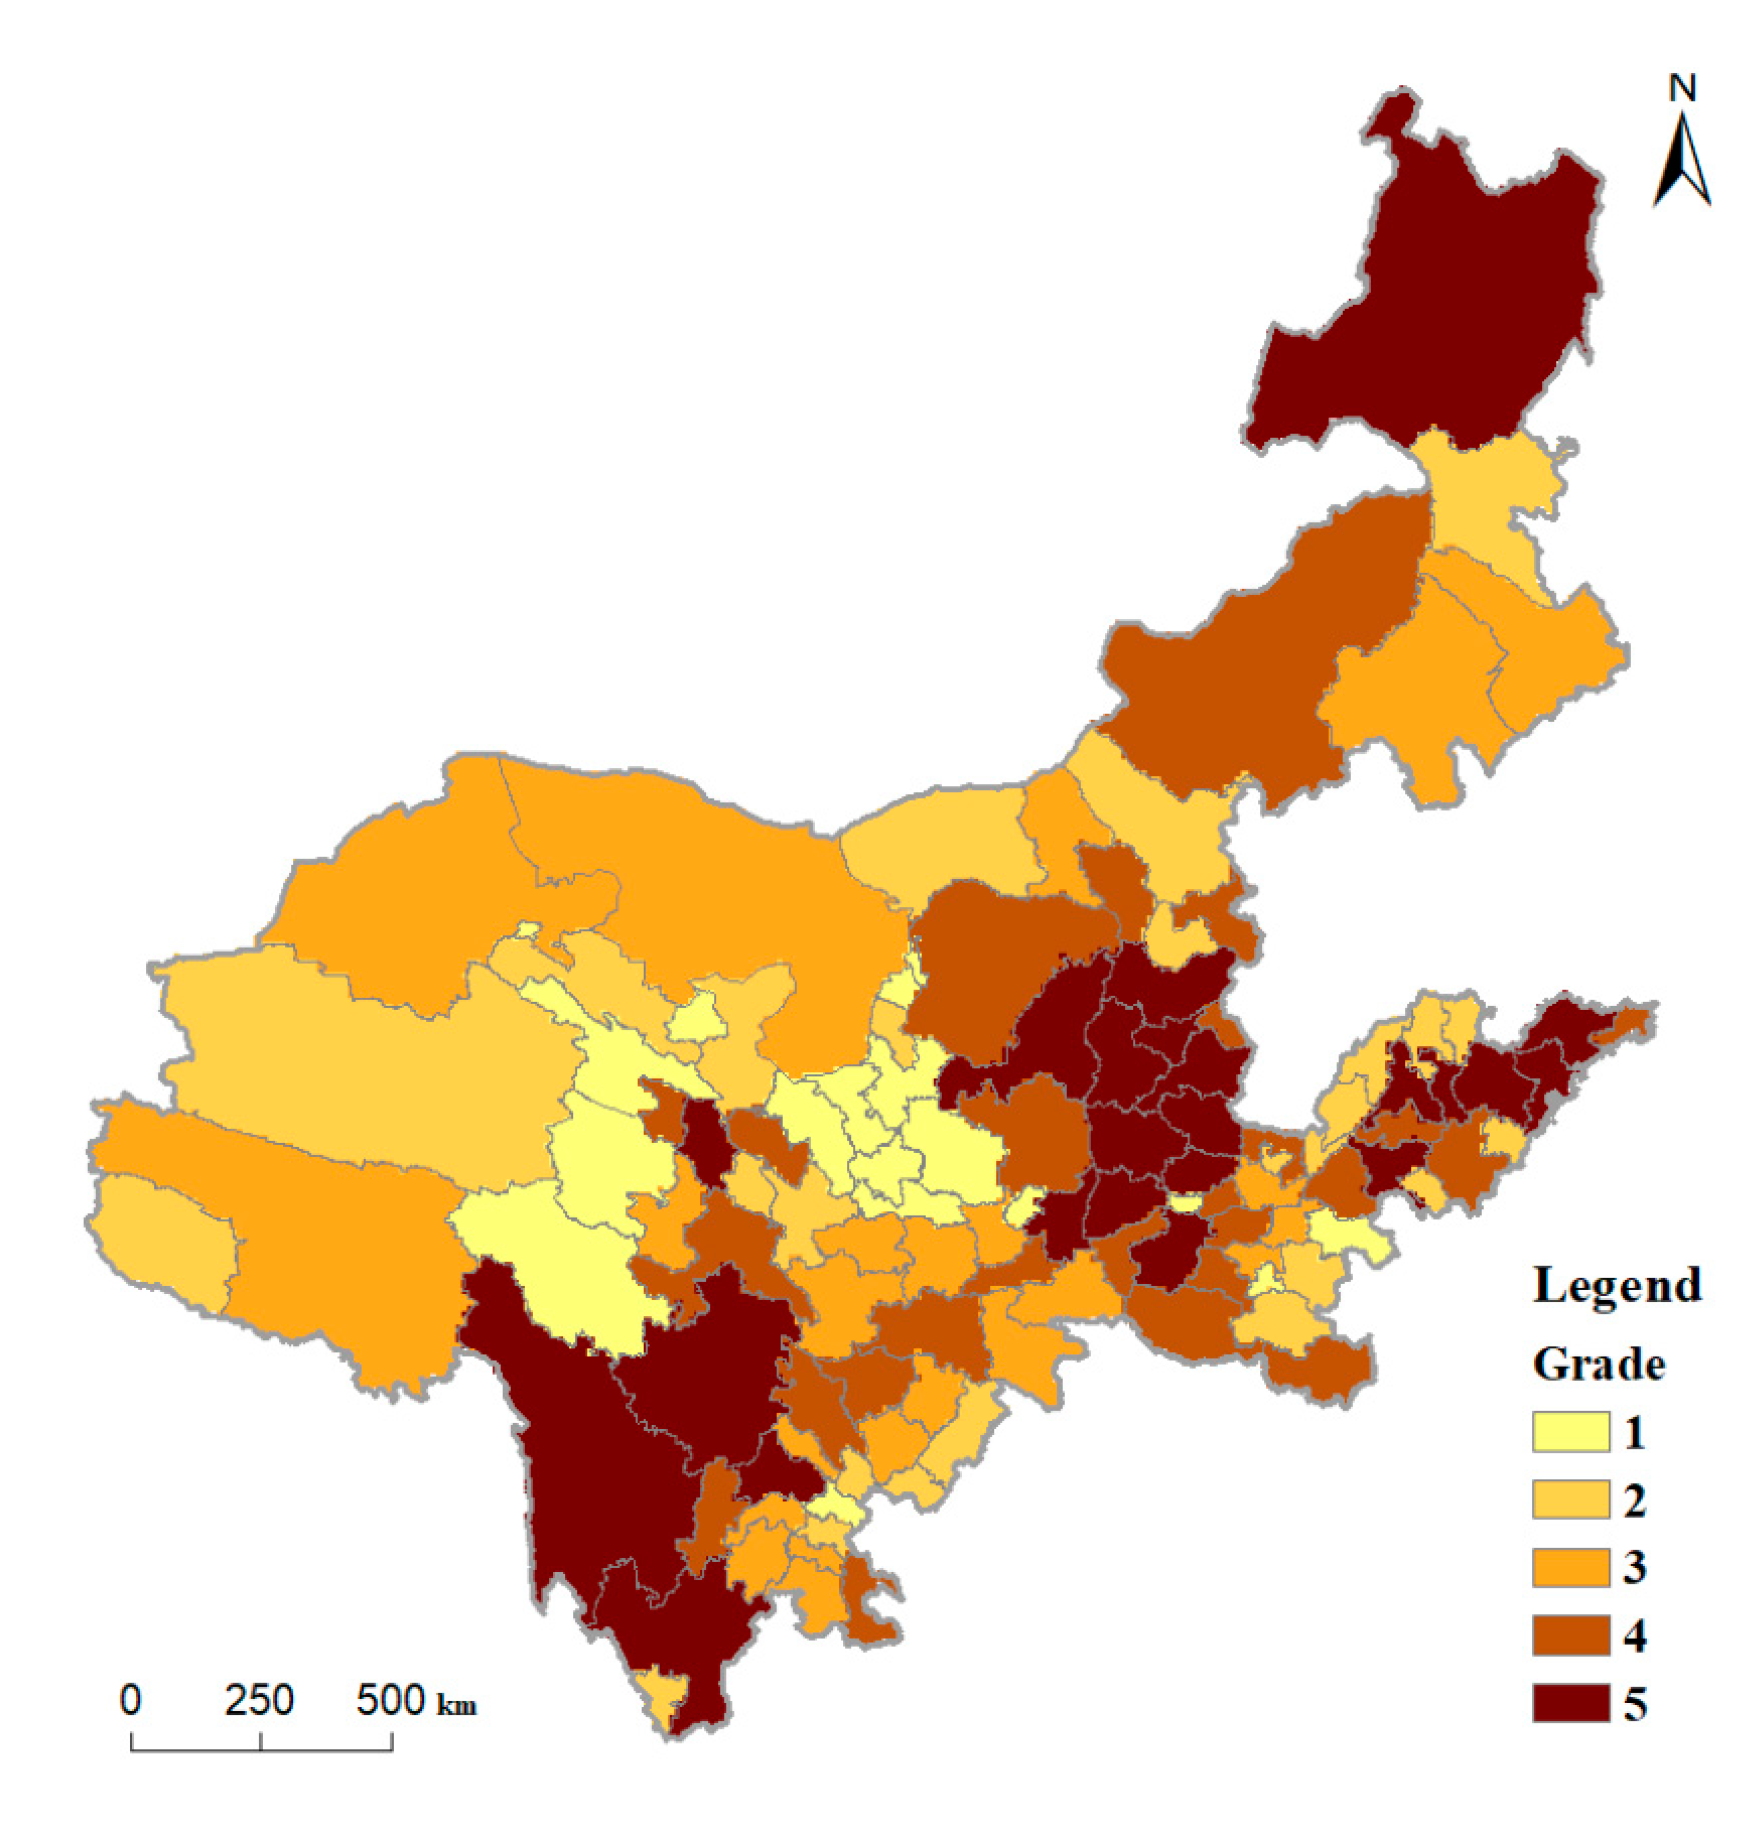
4.2.3. Grading of Comprehensive Evaluation
5. Discussion
5.1. Discussion on Spatial-Temporal Pattern of National ICH Resources
5.2. Discussion on the Tourism Utilization Potential of National ICH Resources
5.2.1. Development Strategies of ICH Tourism Utilization Potential
- (1)
- Regional differentiated development
- (2)
- Regional linkage development
5.2.2. Strategies to Avoid the Commercialization of ICH Tourism
6. Conclusions
Author Contributions
Funding
Institutional Review Board Statement
Informed Consent Statement
Data Availability Statement
Acknowledgments
Conflicts of Interest
References
- UNESCO. The Convention for the Safeguarding of Intangible Cultural Heritage. In Proceedings of the 32th Session General Conference, Paris, France, 17 October 2003. [Google Scholar]
- Lenzerini, F. Intangible Cultural Heritage: The Living Culture of Peoples. Eur. J. Int. Law 2011, 22, 101–120. [Google Scholar] [CrossRef]
- Petronela, T. The Importance of the Intangible Cultural Heritage in the Economy. Procedia Econ. Financ. 2016, 39, 731–736. [Google Scholar] [CrossRef]
- Nuryanti, W. Heritage and Postmodern Tourism. Ann. Tour. Res. 1996, 23, 249–260. [Google Scholar] [CrossRef]
- Li, M.; Wu, B.; Cai, L. Tourism Development of World Heritage Sites in China: A Geographic Perspective. Tour. Manag. 2008, 29, 308–319. [Google Scholar] [CrossRef]
- Skowron-Markowska, S.; Nowakowska, M. Chinese Destinations Related to Martial Arts Tourism from the UNESCO Perspective. Sustainability 2021, 13, 7581. [Google Scholar] [CrossRef]
- Aas, C.; Ladkin, A.; Fletcher, J. Stakeholder Collaboration and Heritage Management. Ann. Tour. Res. 2005, 32, 28–48. [Google Scholar] [CrossRef]
- Malek, N.M.; Masood, S. Tourism Causes Uneven Development: A Case Study of Natural and Cultural Heritage Tourism in Pakistan. J. Adv. Res. Soc. Sci. Humanit. 2018, 4, 6–14. [Google Scholar] [CrossRef]
- Kim, S.; Whitford, M.; Arcodia, C. Development of Intangible Cultural Heritage as a Sustainable Tourism Resource: The Intangible Cultural Heritage Practitioners’ Perspectives. J. Herit. Tour. 2019, 14, 422–435. [Google Scholar] [CrossRef]
- Ma, Z.Y.; Liu, Y.Y. Research on the Protection and Development Path of Chinese Rural Vitalization and Traditional Craft inTangible Cultural Heritage. Cult. Herit. 2020, 2, 19–29. [Google Scholar] [CrossRef]
- Yang, C.H.; Lin, H.L.; Han, C.C. Analysis of International Tourist Arrivals in China: The Role of World Heritage Sites. Tour. Manag. 2010, 31, 827–837. [Google Scholar] [CrossRef]
- China Intangible Cultural Heritage Network. Available online: https://www.ihchina.cn/project#target1 (accessed on 26 November 2022).
- Ma, X.; Yang, Z.; Zheng, J. Analysis of Spatial Patterns and Driving Factors of Provincial Tourism Demand in China. Sci. Rep. 2022, 12, 2260. [Google Scholar] [CrossRef] [PubMed]
- Xiang, Y. On the Globalization Context and International Contributions of China’s Intangible Cultural Heritage Protection. Int. Commun. Chin. Cult. 2022, 9, 5–16. [Google Scholar] [CrossRef]
- Liu, S.C. Intangible Cultural Heritage: A Major Cultural Tourism Resource. Res. Financ. Econ. Issues 2019, 6, 139–145. [Google Scholar] [CrossRef]
- The General Office of the State Council of the People’s Republic of China. Opinions on Further Strengthening the Protection of Intangible Cultural Heritage. Available online: http://www.gov.cn/zhengce/2021-08/12/content_5630974.htm (accessed on 26 November 2022).
- The State Council of the People’s Republic of China. Outline of the Plan for Ecological Protection and High Quality Development of the Yellow River Basin. Available online: http://www.gov.cn/gongbao/content/2021/content_5647346.htm (accessed on 26 November 2022).
- Agency for Cultural Affairs of Japan. Law for the Protection of Cultural Property. Available online: https://en.unesco.org/sites/default/files/japan_law_protectionproperty_entno.pdf (accessed on 26 November 2022).
- UNESCO. Convention Concerning the Protection of the World Cultural and Natural Heritage. In Proceedings of the 17th Session General Conference, Paris, France, 17 October 1972. [Google Scholar]
- UNESCO. Recommendation on the Safeguarding of Traditional Culture and Folklore. In Proceedings of the 25th Session General Conference, Paris, France, 15 November 1989. [Google Scholar]
- UNESCO. Regulations Relating to the Proclamation of “Masterpieces of the Oral and Intangible Heritage of Humanity”. In Proceedings of the 155th Executive Board Meeting, Paris, France, 6 November 1998. [Google Scholar]
- UNESCO. Masterpieces of the Oral and Intangible Heritage of Humanity. In Proceedings of the General Conference, Paris, France, 18 May 2001. [Google Scholar]
- The General Office of the State Council of the People’s Republic of China. Opinions on Enhancing Preservation of Intangible Cultural Heritage. Available online: http://www.gov.cn/gongbao/content/2005/content_63227.htm (accessed on 26 November 2022).
- Order of the President of the People’s Republic of China. Law of the People’s Republic of China on Intangible Cultural Heritage. Available online: http://www.npc.gov.cn/zgrdw/huiyi/lfzt/fwzwhycbhf/2011-05/10/content_1729844.htm (accessed on 26 November 2022).
- Wang, Y.P. A study on Kinmen Residents’ Perception of Tourism Development and Cultural Heritage Impact. Eurasia J. Math. Sci. Technol. Educ. 2016, 12, 2909–2920. [Google Scholar] [CrossRef]
- Potocnik, T.J. Cultural Events as Tools of Developing Sustainable Tourism in Rural Areas-the Case of Sevnica in Slovenia. Ann. Anal. Za Istrske Mediter. Stud. Ser. Hist. Et Sociol. 2021, 31, 245–258. [Google Scholar] [CrossRef]
- Terkenli, T.S.; Georgoula, V. Tourism and Cultural Sustainability: Views and Prospects from Cyclades, Greece. Sustainability 2022, 14, 307. [Google Scholar] [CrossRef]
- Esfehani, M.H.; Albrecht, J.N. Roles of Intangible Cultural Heritage in Tourism in Natural Protected Areas. J. Herit. Tour. 2018, 13, 15–29. [Google Scholar] [CrossRef]
- Giudici, E.; Melis, C.; Dessì, S. Is Intangible Cultural Heritage Able to Promote Sustainability in Tourism? Int. J. Qual. Serv. Sci. 2013, 5, 101–114. [Google Scholar] [CrossRef]
- Reguant-Aleix, J.; Arbore, M.R.; Bach, F.A.; Serra-Majem, L. Mediterranean Heritage: An Intangible Cultural Heritage. Public Health Nutr. 2009, 12, 1591–1594. [Google Scholar] [CrossRef]
- Smith, C.; Bansal, S. Intellectual Property, Cultural Property and Intangible Cultural Heritage. Antiquity 2019, 93, 1694–1695. [Google Scholar] [CrossRef]
- Wang, Y.; Bramwell, B. Heritage Protection and Tourism Development Priorities in Hangzhou, China: A political economy and governance perspective. Tour. Manag. 2012, 33, 988–998. [Google Scholar] [CrossRef]
- Deacon, H. Intangible Heritage in Conservation Management Planning: The Case of Robben Island. Int. J. Herit. Stud. 2004, 10, 309–319. [Google Scholar] [CrossRef]
- Ubertazzi, B. EU Geographical Indications and Intangible Cultural Heritage. IIC Int. Rev. Intellect. Prop. Compet. Law 2017, 48, 562–587. [Google Scholar] [CrossRef]
- Cheng, L.; Yuan, Y. Intellectual Property Tools in Safeguarding Intangible Cultural Heritage: A Chinese Perspective. Int. J. Semiot. Law Rev. Int. De Sémiotique Jurid. 2021, 34, 893–906. [Google Scholar] [CrossRef]
- Cominelli, F.; Greffe, X. Intangible Cultural Heritage: Safeguarding for Creativity. City Cult. Soc. 2012, 3, 245–250. [Google Scholar] [CrossRef]
- Ramsey, D.; Everitt, J. If You Dig It, They will Come! Archaeology Heritage Sites and Tourism Development in Belize, Central America. Tour. Manag. 2008, 29, 909–916. [Google Scholar] [CrossRef]
- Yoshida, K. The Museum and the Intangible Cultural Heritage. Mus. Int. 2004, 56, 108–112. [Google Scholar] [CrossRef]
- Kennedy, L. Transmission and Maintenance of the Intangible Heritage. Mus. Int. 2007, 56, 78–83. [Google Scholar]
- Zhang, Y.; Han, M.; Chen, W. The Strategy of Digital Scenic Area Planning from the Perspective of Intangible Cultural Heritage Protection. Eurasip J. Image Video Process. 2018, 1, 130. [Google Scholar] [CrossRef]
- Cozzani, G.; Pozzi, F.; Dagnino, F.M.; Katos, A.V.; Katsouli, E.F. Innovative Technologies for Intangible Cultural Heritage Education and Preservation: The Case of i-Treasures. Pers. Ubiquitous Comput. 2017, 21, 253–265. [Google Scholar] [CrossRef]
- Huang, W.; Xiang, H.; Li, S. The Application of Augmented Reality and Unity 3D in Interaction with Intangible Cultural Heritage. Evol. Intell. 2019, 12, 1–9. [Google Scholar] [CrossRef]
- Skublewska-Paszkowska, M.; Milosz, M.; Powroznik, P.; Lukasik, E. 3D Technologies for Intangible Cultural Heritage Preservation-Literature Review for Selected Databases. Herit. Sci. 2022, 10, 3. [Google Scholar] [CrossRef]
- Murad, A.A. Creating a GIS Application for Health Services at Jeddah City. Comput. Biol. Med. 2007, 37, 879–889. [Google Scholar] [CrossRef] [PubMed]
- Zolfaghari, A.; Heath, A.C. A GIS Application for Assessing Landslide Hazard over a Large Area. Comput. Geotech. 2008, 35, 278–285. [Google Scholar] [CrossRef]
- Khatami, S.; Khazaei, B. Benefits of GIS Application in Hydrological Modeling: A Brief Summary. VATTEN J. Water Manag. Res. 2014, 70, 41–49. [Google Scholar]
- Banerjee, S.; Chakraborty, C.; Das, D. An Approach Towards GIS Application in Smart City Urban Planning. In Internet of Things and Secure Smart Environments, 1st ed.; Uttam, G., Danda, B.R., Raja, D., Al-Sakib, K.P., Eds.; Chapman and Hall/CRC: New York, NY, USA, 2007; Volume 2, pp. 40–68. [Google Scholar]
- Xu, B.C.; Pan, J.H. Analysis of Structural Characteristics and Spatial Distribution of the National Intangible Cultural Heritage in China and Its Policy Implications. Sci. Cold Arid. Reg. 2019, 11, 389–406. [Google Scholar] [CrossRef]
- Yuan, C.; Gan, L.; Zhuo, H. Coupling Mechanisms and Development Patterns of Revitalizing Intangible Cultural Heritage by Integrating Cultural tourism: The Case of Hunan Province, China. Sustainability 2022, 14, 6994. [Google Scholar] [CrossRef]
- Wang, X.F.; Zhan, S.W. Exploring the Spatial Distribution of ICH by Geographic Information System (GIS). Mob. Inf. Syst. 2022, 2022, 8689113. [Google Scholar] [CrossRef]
- Zhang, X.Y.; Hui, X.; Liu, R. Spatial Pattern and Influencing Factors of Intangible Cultural Heritage of Music in Xiangxi, Central China. Herit. Sci. 2022, 10, 39. [Google Scholar] [CrossRef]
- Meng, L.; Zhu, C.; Pu, J.; Wen, B.; Si, W. Study on the Influence Mechanism of Intangible Cultural Heritage Distribution from Man-land Relationship Perspective: A Case Study in Shandong Province. Land 2022, 11, 1225. [Google Scholar] [CrossRef]
- Nie, X.; Xie, Y.; Xie, X.; Zheng, L. The Characteristics and Influencing Factors of the Spatial Distribution of Intangible Cultural Heritage in the Yellow River Basin of China. Herit. Sci. 2022, 10, 121. [Google Scholar] [CrossRef]
- Zhang, Z.W.; Li, Q.; Hu, S.X. Intangible Cultural Heritage in the Yellow River Basin: Its Spatial-temporal Distribution Characteristics and Differentiation Causes. Sustainability 2022, 14, 11073. [Google Scholar] [CrossRef]
- Yu, Q.Y. Research on the Structural Model and Measurement of Tourism Industry Development Potential. J. East China Norm. Univ. Philos. Soc. Sci. 2009, 41, 114–119. [Google Scholar] [CrossRef]
- Ma, Y.; Dong, G.Z. Research on the Potential Model of Regional Tourism Sustainable Development. Tour. Trib. 1997, 4, 36–40. [Google Scholar]
- Yin, H.G.; Peng, X.Z.; Yu, J. Construction of the Evaluation Index System of the Tourism Exploitation Potential of Intangible Cultural Heritage. J. Hunan Univ. Soc. Sci. 2009, 23, 101–106. [Google Scholar] [CrossRef]
- Del Barrio, M.J.; Devesa, M.; Herrero, L.C. Evaluating Intangible Cultural Heritage: The Case of Cultural Festivals. City Cult. Soc. 2012, 3, 235–244. [Google Scholar] [CrossRef]
- Zhang, X.Y.; Yu, H.; Chen, T.; Wang, X.G.; Wang, F.Y. Evaluation of Tourism Development Value of Intangible Culture Heritage Resources: A Case study of Suzhou City. Prog. Geogr. 2016, 35, 997–1007. [Google Scholar] [CrossRef]
- Barrientos, F.; Martin, J.; De Luca, C.; Tondelli, S.; Gómez-García-Bermejo, J.; Casanova, E.Z. Computational Methods and Rural Cultural & Natural Heritage: A Review. J. Cult. Herit. 2021, 49, 250–259. [Google Scholar] [CrossRef]
- Wang, P.; Liu, M.; Liu, H.D. Evaluation of the Development Potential of the Intangible Heritage Tourism in Shanxi Province. Areal Res. Dev. 2017, 36, 92–98. [Google Scholar] [CrossRef]
- Clark, P.J.; Evans, F.C. Distance to Nearest Neighbor as a Measure of Spatial Relationships in Populations. Ecology 1954, 35, 445–453. [Google Scholar] [CrossRef]
- Parzen, E. On Estimation of a Probability Density Function and Mode. Ann. Math. Stat. 1962, 33, 1065–1076. [Google Scholar] [CrossRef]
- Tang, G.A.; Yang, X. ArcGIS Geographic Information System Spatial Analysis Experiment Course, 2nd ed.; Science Press: Beijing, China, 2019; pp. 204–206. [Google Scholar]
- Ledo, A.; Montes, F.; Condés, S. Different Spatial Organization Strategies of Woody Plant Species in a Montane Cloud Forest. Acta Oecologica 2012, 38, 49–57. [Google Scholar] [CrossRef]
- Wang, J.F.; Liao, Y.L.; Liu, X. Spatial Data Analysis Tutorial, 2nd ed.; Science Press: Beijing, China, 2019; pp. 54–78. [Google Scholar]
- Wu, B.H. An Analytic Framework of RMP for Regional Tourism Development: Case Study of Luoyang City. Geogr. Res. 2001, 20, 103–110. [Google Scholar] [CrossRef]
- Zhu, X.A.; Wei, G.D. Discussion on Excellent Standard of Dimensionless Method in Entropy Method. Stat. Decis. 2015, 2, 12–15. [Google Scholar] [CrossRef]
- The General Office of the State Council of the People’s Republic of China. Suggestions on the Fourteenth Five Year Plan for National Economic and Social Development and the Long Term Goals for the Year 2035. Available online: http://www.gov.cn/zhengce/2020-11/03/content_5556991.htm (accessed on 26 December 2022).


| Batch | Quantity (Item) | Average Nearest-Neighbor Distance (km) | Expected Nearest-Neighbor Distance (km) | NNI | Z-Score | p-Value | Spatial Distribution Pattern |
|---|---|---|---|---|---|---|---|
| First | 174 | 44.466 | 80.801 | 0.550 | −11.348 | 0.000 | clustered |
| Second | 427 | 21.783 | 54.034 | 0.403 | −23.595 | 0.000 | clustered |
| Third | 145 | 49.995 | 82.244 | 0.608 | −9.033 | 0.000 | clustered |
| Fourth | 127 | 60.565 | 88.773 | 0.682 | −6.851 | 0.000 | clustered |
| Fifth | 113 | 79.198 | 91.392 | 0.867 | −2.713 | 0.007 | clustered |
| All | 986 | 11.368 | 36.022 | 0.316 | −41.115 | 0.000 | clustered |
| Province | Quantity (Item) | Average Nearest-Neighbor Distance (km) | Expected Nearest-Neighbor Distance (km) | NNI | Z-Score | p-Value | Spatial Distribution Pattern |
|---|---|---|---|---|---|---|---|
| Qinghai | 82 | 15.337 | 35.138 | 0.436 | −9.762 | 0.000 | clustered |
| Sichuan | 149 | 15.800 | 31.149 | 0.507 | −11.507 | 0.000 | clustered |
| Gansu | 81 | 15.041 | 43.396 | 0.347 | −11.250 | 0.000 | clustered |
| Ningxia | 19 | 12.020 | 23.453 | 0.513 | −4.065 | 0.000 | clustered |
| Upstream | 331 | 14.959 | 35.717 | 0.419 | −20.228 | 0.000 | clustered |
| Nei Monggol | 96 | 26.787 | 66.012 | 0.406 | −11.138 | 0.000 | clustered |
| Shaanxi | 79 | 12.909 | 25.358 | 0.509 | −8.348 | 0.000 | clustered |
| Shanxi | 179 | 5.045 | 15.644 | 0.323 | −17.340 | 0.000 | clustered |
| Midstream | 354 | 12.443 | 44.571 | 0.279 | −25.945 | 0.000 | clustered |
| Henan | 121 | 10.236 | 20.204 | 0.507 | −10.382 | 0.000 | clustered |
| Shandong | 180 | 4.678 | 17.786 | 0.263 | −18.915 | 0.000 | clustered |
| Downstream | 986 | 6.889 | 20.219 | 0.341 | −21.882 | 0.00 | clustered |
| Batch | Moran’s I | Expected Index | Variance | Z-Score | p-Value | Result |
|---|---|---|---|---|---|---|
| All | 0.391 | −0.009 | 0.001 | 12.574 | 0.000 | clustered |
| First | 0.134 | −0.009 | 0.001 | 4.598 | 0.000 | clustered |
| Second | 0.300 | −0.009 | 0.001 | 9.793 | 0.000 | clustered |
| Third | 0.218 | −0.009 | 0.009 | 7.561 | 0.000 | clustered |
| Fourth | 0.116 | −0.009 | 0.001 | 4.012 | 0.000 | clustered |
| Fifth | −0.009 | −0.009 | 0.001 | −0.004 | 0.997 | random |
| Evaluating Aspects | Specific Index | Explanation of the Index | Weight |
|---|---|---|---|
| Core resources | Q1: Number of national ICH | The total number of national ICH in each city | 0.118 |
| Q2: Category of national ICH | The total number of category of national ICH in each city | 0.063 | |
| Q3: Category advantage of national ICH | Q3 = D/2 + 3D/365 + E/2. C, D, and E is the total number of handicrafts, folkways, performances (Quyi, traditional dance, traditional drama and traditional music), respectively. | 0.142 | |
| Tangible carrier | Q4: Advantages of scenic spots | Q4 = 5N1 + 4N2. N1 and N2 is the total number of national 5A scenic spots and 4A scenic spots in each city, respectively. | 0.079 |
| Q5: Number of traditional settlements | Q5 = M1 + M2 + M3. M1, M2, and M3 is the total number of national famous historical and cultural towns, national famous historical and cultural villages, national traditional villages, respectively. | 0.259 | |
| External environment | Q6: Regional economic development | GDP per capita (unit: yuan) | 0.091 |
| Q7: Tourism development level | Tourism income (unit: million yuan) | 0.168 | |
| Q8: Traffic conditions | Q8 = 5T1 + 4T2 + 3T3 + 2T4 + T5. T1, T2, T3, T4, and T5 is the total number of air stations, railway stations, expressway, national highways, and provincial roads. | 0.080 |
| Grade | Number of National ICH | Category of National ICH | Category Advantages | Advantages of Scenic Spots | Number of Traditional Settlements | Regional Economic Development | Tourism Development Level | Traffic Conditions |
|---|---|---|---|---|---|---|---|---|
| 1 | 0–4 | 0–1 | 0–1.02 | 0–25 | 0–8 | 14,256–28,951 | 2.81–251.38 | 29–47 |
| 2 | 5–9 | 2–3 | 1.02–2.52 | 25–45 | 8–22 | 28,951–46,168 | 251.38–563 | 47–93 |
| 3 | 10–14 | 4–5 | 2.52–4.05 | 45–74 | 22–42 | 46,168–66,313 | 563–936.6 | 93–134 |
| 4 | 15–20 | 6–7 | 4.05–6.02 | 74–125 | 42–96 | 66,313–97,564.3 | 936.6–1955.9 | 134–224 |
| 5 | 21–32 | 8–10 | 6.02–10.50 | 125–197 | 96–202 | 97,564.3–173,069 | 1955.9–4650 | 224–371 |
Disclaimer/Publisher’s Note: The statements, opinions and data contained in all publications are solely those of the individual author(s) and contributor(s) and not of MDPI and/or the editor(s). MDPI and/or the editor(s) disclaim responsibility for any injury to people or property resulting from any ideas, methods, instructions or products referred to in the content. |
© 2023 by the authors. Licensee MDPI, Basel, Switzerland. This article is an open access article distributed under the terms and conditions of the Creative Commons Attribution (CC BY) license (https://creativecommons.org/licenses/by/4.0/).
Share and Cite
Chang, B.; Ding, X.; Xi, J.; Zhang, R.; Lv, X. Spatial-Temporal Distribution Pattern and Tourism Utilization Potential of Intangible Cultural Heritage Resources in the Yellow River Basin. Sustainability 2023, 15, 2611. https://doi.org/10.3390/su15032611
Chang B, Ding X, Xi J, Zhang R, Lv X. Spatial-Temporal Distribution Pattern and Tourism Utilization Potential of Intangible Cultural Heritage Resources in the Yellow River Basin. Sustainability. 2023; 15(3):2611. https://doi.org/10.3390/su15032611
Chicago/Turabian StyleChang, Bianrong, Xinjun Ding, Jianchao Xi, Ruiying Zhang, and Xianhong Lv. 2023. "Spatial-Temporal Distribution Pattern and Tourism Utilization Potential of Intangible Cultural Heritage Resources in the Yellow River Basin" Sustainability 15, no. 3: 2611. https://doi.org/10.3390/su15032611