Article

Supply Chains: Planning the Transportation of Animals among Facilities

by
Esteve Nadal-Roig
1,
Lluís Miquel Plà-Aragonès
1,2,* and
Víctor Manuel Albornoz
3
1
Department of Mathematics, Faculty of Law, Economics and Tourism, University of Lleida, 73 Jaume II, 25001 Lleida, Spain
2
Agrotecnio Center, 190 Rovira Roure, 25198 Lleida, Spain
3
Departamento de Industrias, Campus Santiago Vitacura, Universidad Técnica Federico Santa María, Av. Santa María 6400, Vitacura 7630000, Santiago, Chile
*
Author to whom correspondence should be addressed.
Sustainability 2023, 15(3), 2523; https://doi.org/10.3390/su15032523
Submission received: 31 October 2022 / Revised: 22 January 2023 / Accepted: 25 January 2023 / Published: 31 January 2023

Abstract

:
Pig supply chains conform differently depending on country; however, the industrial production of pig meat has led to an increasing specialization of agents taking part in the supply chain production. Nowadays, pigs are rarely produced in one single farm, the existence of specialized farms devoted to breeding, rearing, and fattening pigs being more common since this organization provides sanitary advantages against disease outbreaks. Management strategies such as batch management in sow and fattening farms add complexity to the production management. Pigs have to be transferred from facility to facility as they are growing and sent to the abattoir as soon as they reach commercial weight. All these stages involve either independent farmers or farmers integrated in some pig supply chain management organization operating with production contracts or cooperation agreements. This study presented the challenge of using a stochastic model for planning the transportation of animals among facilities in pig supply chains over time. The model provides an optimal schedule of transfers between farms, occupancy rate, and trucks involved. The integrality of several variables was relaxed, and further analysis was performed in view of inspecting the model behavior for achieving practical decision support. We demonstrated that we can achieve good enough results in few minutes and, so, practical use is feasible.

1. Introduction

The current study focused on planning the transportation of animals among facilities in pig supply chains (PSCs) and the positive effects data-driven management has on sustainable PSC management. A PSC involves all the processes from production of piglets in sow farms to the delivery of fattened pigs to the abattoir. A performant PSC delivers the daily demanded pigs at the lowest possible cost to the abattoir on time. The structure of the supply chain network (SCN) and the inventory management (occupancy of pig housing facilities) play a vital role in achieving the abovementioned objective [1,2]. During past decades, the PSC has greatly evolved in western countries and especially in Europe [3]. As a result, the profile of the typical farm is changing from a family-based, small-scale, and independent firm to one in which larger firms are more tightly aligned along the pig production and distribution processes and integrates their operations into a supply chain structure. Typically, in a PSC the production process is structured through three stages or phases encompassing different and multiple agents or farmers. This vertical integration of production from one phase to the following one involves coordinating procurement and production policies. However, given the number of farms involved, PSC managers have problems in generating optimal, coordinated policies. In particular, PSC managers face the problem of planning the transfer of animals among facilities to fulfil the abattoir’s demand.

1.1. Background of the Problem

Inventory management is a major problem for production planning in supply chain management according to [2], and in PSC it is tightly related to planning transfers of animals from one phase to the next one. Briefly, the first phase in PSCs focuses on producing piglets, the second phase focuses on rearing piglets, and the third and last phase focuses on fattening pigs and delivering them to the abattoir (see Figure 1). Piglets stay in all of these phases for a certain number of weeks in order to ensure the correct growth, weight, and health and welfare conditions. The common batch management implemented in sow farms is useful to plan farrows and weanings weekly, in view of providing a steady number of weaned piglets over time. Weaned piglets are transferred to rearing farms for a rearing period before being next transferred to a fattening farm. For each of these phases, a set of specialized farms are involved and ruled by the same company or cooperative [4], favoring collaboration between farms and with the abattoir [5]. From fattening farms, pigs are sent to the abattoir once they reach the commercial weight.
Each facility has its own characteristics such as capacity and location. Transportation between farms and coordination from different phases makes production planning more complex and difficult to manage for pig supply chain managers. The usual and extended procedures to plan transfers are long, weekly meetings at the headquarters of the PSC company. In these meetings, the PSC manager, transportation director, and those responsible for the farms at each phase discuss the transportation plan. That is, the inventory available at the end of each phase and susceptible to being transferred to the next phase, or to the abattoir for fattening farms. On the other hand, there is discussion about the room that reception farms have when operating under all-in-all-out batch management policies and imposing batch-sizes with minimal origins. The final transportation plan is agreed upon without paying attention to distances. Spreadsheets or inventory reports are the supporting evidence for decisions made in such meetings.
The batch management implemented in fattening and sow farms makes it difficult to foresee the impact on actual production planning and, at the same time, the capability to fulfil fattening facilities with pigs of the same origin to avoid disease propagation. Given the inventory of animals and the location of facilities available, digital support seems a feasible and useful method for the adoption of an optimization model to solve or mitigate these long meetings to plan and re-plan the transportation of animals among the facilities in a PSC.

1.2. Literature Review

Literature to support the decision making on the pig sector reveals that most papers have only considered individual farm operations and the farmers as the main decision-makers. However, the advances in pig production in the last decades evidence the growing importance of PSCs being represented by a vertical, integrated company or by a cooperative of producers as remarked in [4]. Authors in [6] stated that modern PSC management involves the coordination of sets of farm units at different phases. Revising the literature, Ref. [7] developed one of the first PSC models. It was a state-transition simulation model based on a flow of animals but intended for the analysis of the spread of Salmonella along the chain. Therefore, it was not suitable for other management purposes. Most modeling approaches are focused on just one PSC phase. Many of them aim at optimizing sow-herd management as pointed out in [3]. The replacement problem of sows is the most commonly addressed problem. Several shortcomings for the practical use of the proposed models are that they consider an infinite time horizon and the homogeneity of parameters over time, which makes their adoption difficult when model assumptions are not satisfied. Ref. [8] observed that all the models reported had been developed “for” rather than “with” the decision makers. Consequently, the potential interest in the development of such models was limited to researchers more than to practitioners. This situation represents an important challenge for new Operational Research proposals in agriculture as suggested in [9].
Some studies concerning the production planning of other phases of pig production such as fattening are also present in literature. For instance, the problem of delivering fattened pigs to the abattoir has been dealt by several authors. Ref. [10] considered the window of time for selling all the fattened pigs of one farm and different abattoirs acting as buyers with their own prices. Ref. [11] focused on delivering pigs to the abattoir in a two-phase model while [12] considered the effect of diet in grower–finisher pig herds. Ref. [13] proposed the optimization of feeding regimes and the shipping of pigs to the abattoir, adapting the model of [12] as the basis. However, none of these papers considered more than one farm or interactions between different farms. Ref. [14] considered constraints such as the minimum number of farrows or weaning per week, aiming at the coordination of a sow farm into a pork supply chain. Ref. [15] proposed a mixed integer linear programming (MILP) model to optimize the entire supply chain. The model was a production planning model based on a multiperiod MILP later extended by [16] to take into account transportation constraints and other modeling improvements related to herd-management policies. Ref. [6] formulated a bi-objective model for optimizing pig deliveries to the abattoir accounting for total revenue and CO2 emissions.
Similar production planning problems appear in other livestock species with similar supply chain organizations, such as broiler production [17,18]. Ref. [17] proposed a model for an integrated production planning model of broiler production, including the coordination of eggs for incubation, allocation of chicken flocks to farms, and collection of chickens for slaughtering. Ref. [18] dealt with a similar problem in identifying breeders, hatcheries, farms, and abattoirs as the main agents in the supply chain. Ref. [19] focused on the production planning problem of poultry farms that are represented by a two-level supply chain with production-time-dependent products, where the farms are the suppliers of an integrated manufacturing plant. They claimed the lack of integrated decisions in supply chain management and argued for the benefits of an integrated production plan, proposing MILP models complementing heuristics to solve complex problems.
Table 1 summarizes most of the references in the presented literature review, which mainly consider the transportation problem in pig supply chains. In the table, the key aspects included are the problem solving; the methodological approach used: bi-objective mixed-integer programming (BOP), mixed-integer linear programming (MIP), simulation (SIM), and two-stage stochastic programming (TSP); the source of the uncertainty; and the gaps that motivate the present research.
Thus, the aim of this work was to develop a heuristic algorithm of the two-stage stochastic model proposed by [20] and integrate planning decisions in the PSC for practical use by PSC managers with pork sales prices as the uncertain parameters. Given the presence of integer variables, it is expected to encounter problems in the resolution of the model for big instances, so computational experiments leading to a compromise between satisfactory solutions and solving times are presented. This empirical analysis is aimed at supporting practical short-term decisions such as the planning transportation of animals among facilities and inventory management.
The rest of the paper is organized as follows. In Section 2, we briefly describe the significant aspects of the stochastic model used in this paper to perform the empirical analysis, which is presented in Section 3, while we present the parameters and derived results in Section 4. We proceed with a discussion about the limitations of this study in Section 5. Finally, we outline conclusions and future work in Section 6.

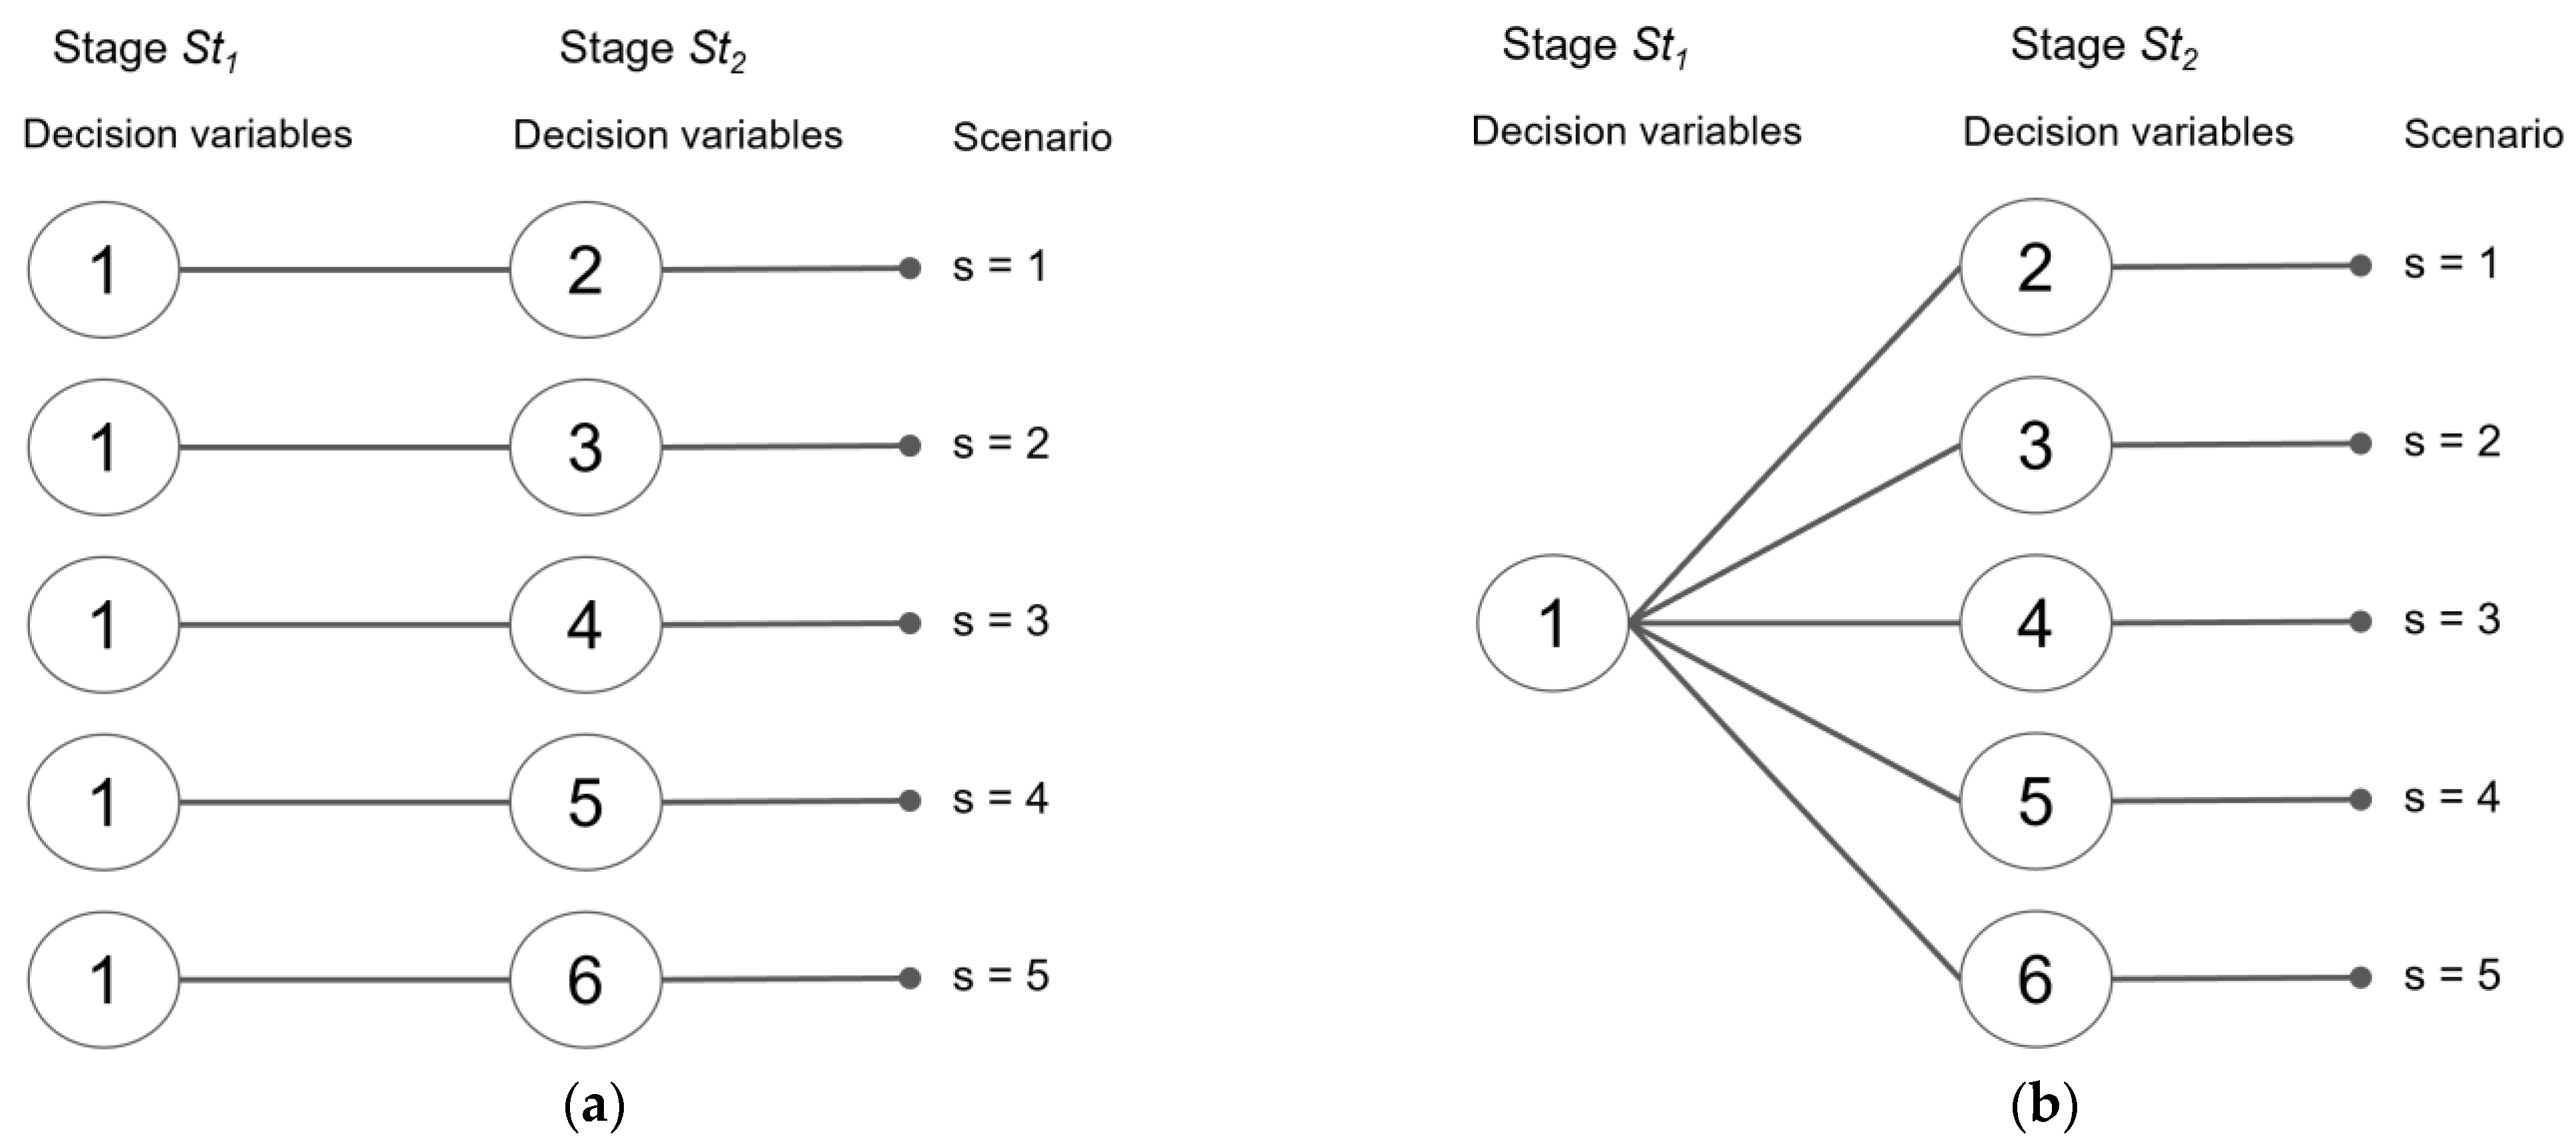
2. The Two-Stage Stochastic Model

2.1. The Deterministic Equivalent Model Formulation

Two-stage stochastic linear models provide a suitable framework for modeling decision problems under the uncertainty arising in several applications collected by [21]. To solve the two-stage stochastic problem numerically, it is assumed that uncertainty represented by the random vector ξ has a finite number of possible realizations, called scenarios (Figure 2) with respective probability. Therefore, the classical two-stage linear stochastic programming problems can be solved through the deterministic equivalent model formulated as follows:
min x n g x = c T x + ω = 1 Ω p ω Q x , ξ ω subject   to :   A x = b T ξ ω x + W ξ ω y = h ξ ω x , y 0
where x n is the first-stage decision variable vector, y m is the second-stage decision variable vector, ξ is a random vector with a known probability distribution, and Q x , ξ ω is the optimal value of the second-stage problem under scenario ω ∈ Ω, and probability pω. The two-stage stochastic linear model considered in this study is that presented by [20] and it is an extension of the deterministic linear model by [6]. The formulation follows the deterministic equivalent model (DEM) as proposed in [22] and also by [23]. In our approach, the uncertain parameters, ξ, are those related with future sale prices and fertility of sows.
The flexibility of these models is related to their multiperiod nature (Figure 2), i.e., besides the first-stage variables that represent decisions made in face of uncertainty, the model considers second-stage decisions, i.e., recourse actions, which can be taken once a specific realization of the random parameters is observed to react accordingly. Hence, the decisions at the first stage (St1 in Figure 2b) are the same for all scenarios (imposed by non-anticipativity constraints), while the remaining decision variables are dependent on the corresponding scenario, s ϵ S. In our case, decision variables represent the total weekly inventory of piglets age-ranked on all farms besides purchases of piglets in rearing and fattening farms allowed to react depending on scenario. Decisions regarding animals ending up a particular phase are of particular interest to determine the weekly number of transfers (trips origin and destination) of animals (piglets, pigs, and sows) between farms and deliveries (i.e., sales) to the abattoir. Second-stage decisions (St2 in Figure 2b) refer to the number of pigs sent to the abattoir and the need to rent additional farms to house all the production of sow farms plus additional purchases of piglets. Second-stage decisions modulate the overall production flow of the system to benefit from better prices.
In Table 2 we provide the notations used in formulating the deterministic model corresponding to one scenario (as represented in Figure 2a). All of the decision variables are integers (number of animals or number of trips) or binaries (renting or not a farm and modeling all-in-all-out management in fattening farms). The basic formulation of the two-stage stochastic optimization model is given in (1)–(10) where the index ω ∈ Ω represents variables and scenario-dependent parameters, such as the probability of each scenario represented by pω.
The objective of the model is to maximize the revenue, i.e., income minus cost (equivalent to minimize cost minus income, as presented), over the planning horizon. The objective function is divided into two parts related to the first stage (first summatory) and the second-stage scenario-dependent decision variables (second summatory representing each scenario, weighted by corresponding probability). The cost terms in (1) are the renting cost, the variable production cost, and the transportation cost while the income comes from sales to the abattoir of fattened pigs. Equation (2) fixes the capacity of facilities. Equations (3)–(5) apply for fattening farms operating under all-in-all-out batch management, representing all pigs housed at a time and delivered to the abattoir when reaching marketable weights. Once the fattening farm is empty, a new batch of pigs can be housed. Constraint (6) is the initial inventory and constraint (7) the flow conservation of animal flow over time within a facility (without considering loses). Constraints (8) and (9) represent the transfer of animals from one facility to another when changing of phase or sent to the abattoir while constraint (10) ensures that a number of piglets per sow per week are born in sow farms.
min h + R h + X h + + t , e C P t h + e I t h + e + ω p ω t , h , e C P t h e ω I t h e ω + t , e C T h , h N t e ω h , h t , h , e P t e ω I t h e ω
e E I t h e K h X h       t T , h H
I t h 1 Z 1 t h K h       t T , h F
e E F 1 I t h e Z 2 t h K h       t T , h F
Z 1 t h + Z 2 t h 1       t T , h F
I 0 h e = I N h e       e E , h H
I t e + 1 = I t 1 e       e E \ { e B , e R , e F } ,   t T \ { 1 }
I t h e   h N t e h , h KP h , h       t T , h , h H × H a ,   e e B , e R , e F
I t h e = h N t e h , h KP h , h       t T , h , h H × H a ,   e e B , e R , e F
I t b 1 = K b L S b t       t T , b B

2.2. Assumptions of the Model

The stochastic model as it is formulated makes several assumptions. Some of them are theoretically based and few others are operationally based in view of rendering simpler instances to test our approach:
  • The sizes of sow farms are constant and house the same number of sows, producing a steady number of weaned piglets depending on seasonal fertility.
  • The replacement rates of sows are constant, and this implies the weekly number of sows sent to the abattoir is the same.
  • The mortality of pigs is the same per phase and computed at the end of each phase. The survival rate is 1 by default.
  • The growth of animals over time is homogeneous among farms and exhibits equal conversion rate, feed intake, and growth rate.
  • Transportation cost is considered constant per km covered regardless of the speed and load.
  • The PSC includes only one abattoir where fattened pigs are delivered without capacity constraints.
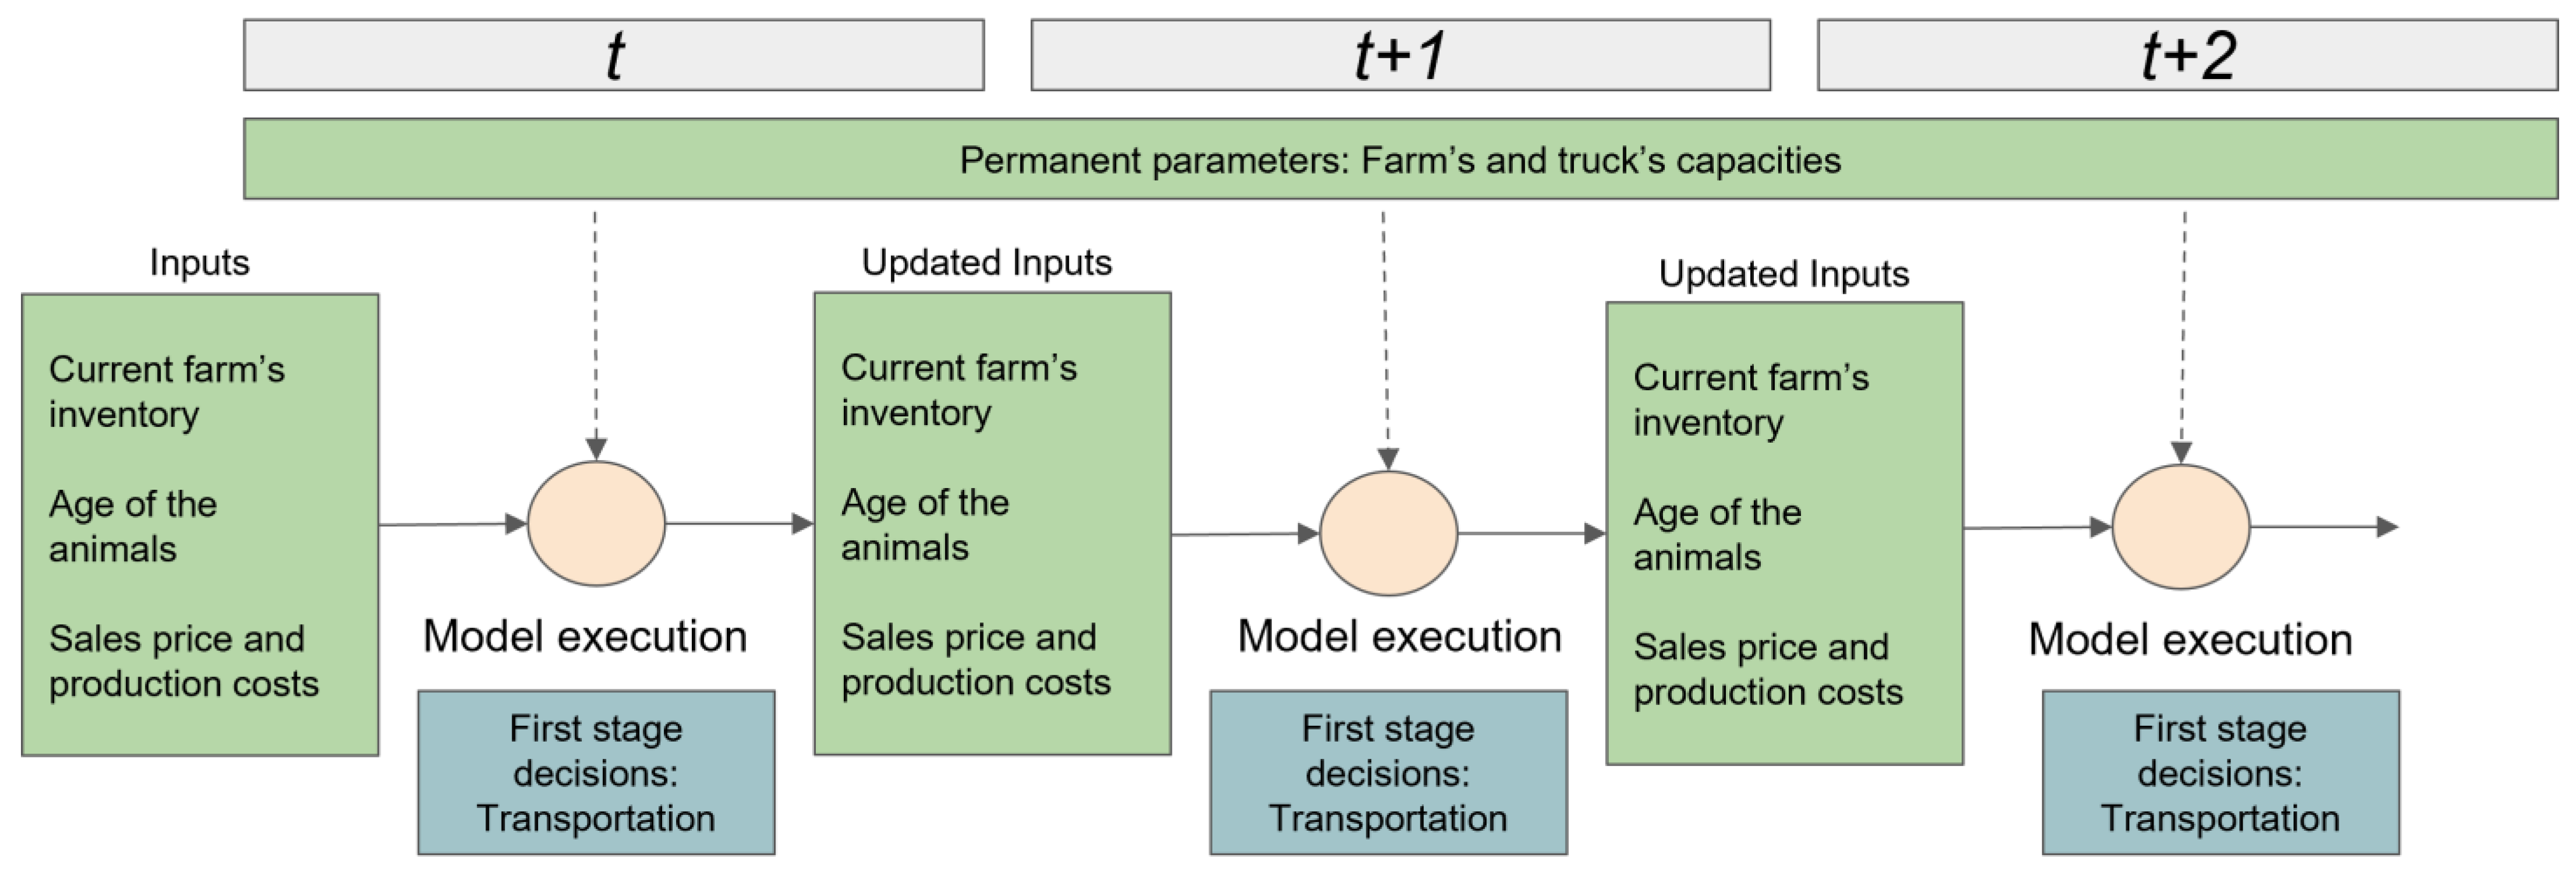
  • The solution from this model is intended to be applied in a rolling horizon manner. Thereby, only first-stage decisions for the current period are made. The model with updated information is solved again for the next decision period and so on.

3. Empirical Analysis

3.1. Data and Scenario Generation

The data used to perform the empirical analysis correspond to a typical company in the pork sector in Spain. In that this case, we considered 7 sow farms, 20 rearing farms, and 124 fattening farms. Pigs produced stayed 4 weeks in sow farms, 6 weeks in rearing farms, and a maximum of 18 weeks in fattening farms to complete the process. The marketing time window in fattening farms ranged from week 15 to 18 of the fattening period. The weekly cost per animals was 1.875 € for sows, 2.66 € for rearing pigs, and 4.832 € for fattening pigs. The averaged litter size at farrowing per sow per week was considered for simplicity. The expected number of piglets weaned was different depending on sow parity. Sows were culled and sent to the abattoir after 9 farrowings. Unitary transportation cost was fixed at 1 €/km over the entire production process, but farms having rearing facilities on the same farm did not require road transportation (i.e., transportation cost equals zero in transfers between these farms). A 52-week time horizon (one year) was considered. The first week corresponded to the first stage, allowing the following 51 weeks for the second stage. This partition was motivated because the operational decision regarding transfers of animals and deliveries to the abattoir was taken week-by-week. Therefore, the second stage represents the uncertainty of prices, availability of facilities, and number of animals to be transported affecting first-stage decisions.
As a preliminary study, the model was formulated with 12 scenarios with different sales prices to debug the model and assure the coherence of results by scenario. Scenario generation was based on the weekly sales prices in Mercolleida’s auction market in Lleida (Spain) from four years of 52 weeks taken from national statistics [24]. Figure 3 shows the real series of weekly sales prices (weeks 1–208). Seasonality in prices was observed, which tended to decrease at the end of each year in winter and increase at the middle of the year in summer. Two methods deal with seasonality: Holt–Winters [25] and ARIMA [26]. Ref. [27] compared these methods, concluding ARIMA is more effective when the sporadic demand data series structure become more complex. As this is not our case, the Hold–Winters method was used with the additive sub-method due to the seasonal variations being roughly constant (non-proportional) through the series. Therefore, Minitab Software was been used to generate a forecast using the Holt–Winters method [25]. After that, 12 scenarios were considered, increasing and decreasing the weekly base prices generated previously by 2%, 4%, 6%, 8%, 10%, and 12% respectively. Figure 3 shows the following two years of forecasted pork prices (weeks 209–312) and the set of scenarios plotted together.

3.2. Heuristic Algorithm and Computational Results

The model was implemented with the IBM ILOG OPL modeling language and solved using CPLEX v12.8 in a Pentium 12 CPUs at 2.1 GHz and 48 Gb RAM. Microsoft Excel was used for data storage for both the input and output parameters due to its user friendliness and flexibility when managing the data and the easy linkage to CPLEX offered by IBM ILOG.
Given the complexity of the problem, the execution of the model with all integer variables did not find the optimum after 48 h (see Table 3). To improve the computational performance, some changes on decision variables were analyzed. A first attempt was to reinforce the formulation of the model by restricting the deliveries of animals between certain farms depending on the distance, establishing a minimum batch of animals to be transferred and by fixing known routes for several deliveries between farms. For example, several trips between h and h* farms, i.e., Nte(h,h*), were set to zero, indicating forbidden paths. Afterwards, some computational experiments were performed to value the associated computational savings, such as relaxing the integral property of the decision variables representing animals and trips (i.e., trucks). Relaxing the integrality in inventory variables is sensible since the big numbers involve make the loss of precision insignificant. Table 3 shows the results obtained when solving models (1)–(10), changing only the integral character of decision variables Nte(h,h*) and Ithe. As can be observed, the amount of time was considerably reduced when a full relaxation was considered and this instance provided an upper bound for the two-stage stochastic optimization model as formulated in (1)–(10).
Taking into consideration the resolution time and working with continuous variables, some other experiments were carried out to simulate the model behavior depending on how the operational decisions, first-stage decisions, would be taken. PSC’s planning decisions are mainly related to transport and farm capacities. As mentioned, transportation planning decisions are generally taken on a weekly basis. Therefore, having one week in the first stage is enough to allow PSC managers to make these decisions. However, it is possible that transportation decisions in some companies were not made on a weekly basis or may require enlarging the temporal stability of first-stage decisions considering more weeks. Hence, in a second computational experiment we modified the number of weeks at the first stage of the model from one week until four weeks (1 month) but maintaining the 52 weeks in the total time horizon. Table 4 shows the results of these experiments, allowing us to compare different performance measures. The forecasted base price was used as a single parameter in the first stage. Price scenarios at the second stage were generated using the same procedure used as in the base experiment. It is remarked how the number of weeks at the first stage provokes an increase in the solving time. This is not so surprising as a temporary wider first stage involves more non-anticipativity constraints, rendering the model more complex to solve. However, regarding the benefit per pig, the first week was almost the same in all cases, with three and four weeks at the first stage and also the total benefit per pig being greater than with the shorter first-stage period.
Finally, a last computational experiment performed considered different time horizons. It is known that border conditions at the end of the time-horizon may affect the results in previous periods and jeopardize results if neglected. An increment in the time horizon increased the size of the model in terms of variables. The impact on first-stage decisions is also of practical interest and one week at the first stage was considered in all instances. The time horizon was ranged from 52 weeks (1 year) to 80 (more than 1.5 years) to explore both the impact on solving time and on performance indexes at the first stage, such as pigs sent to the abattoir, benefit achieved per pig at the first stage, total number of pigs sent to the abattoir during the entire time horizon, and the average benefit per pig. In Table 5 it is shown how computational time increases as time horizon does, in agreement with our expectations. Similarly, it happens with the total number of pigs sent to abattoir during all the time horizons. However, the benefit per pig observed at first stage did not change from a finite time horizon of 52 to 68. Surprisingly, this benefit improved with a longer finite time horizon, but this increment is explained by the trend in market prices as observed in Figure 3, with a positive trend in general. This is more clearly observed in the total benefit per pig reported in Table 5.

4. Discussion

The evolution of computers, besides a better attitude of the pig sector towards new decision support systems, allows researchers to propose integrated production models susceptible to being considered by PSC managers [4]. There has been an increasing use of emerging technologies within PSC management, driving decision making towards a data-driven decision system [28] while the sustainable development of PSC has been identified as a way to improve performance [29]. These data-driven decision models can easily alleviate problems such as planning and (re)scheduling animal transfers from farm to farm generating economic, social, and environmental benefits. Benefits are fundamental condition of economic development, but can also promote sustainable production [30]. Integrated planning and transportation optimization can improve economic efficiency, reducing CO2 emission and increasing employees’ welfare by automatizing routine tasks.
Beyond modeling issues, an additional concern related to complex models for practical purpose is the computational time required to obtain a timely solution. In particular, computational time can be easily neglected for tactical or strategic decisions while it is a critical aspect for operational decisions. Moreover, when for practical purposes there is a need of exploring different alternatives and running different instances, reasonable computational times are mandatory. This study focused on an empirical analysis of an integrated production planning model intended for practical use in planning transportation of animals among PSC facilities. Results presented in previous section support the hypothesis that complex optimization models can help to PSC managers when planning transportation of animals among facilities. The different analyses performed demonstrated that the significant improvement on the global computational performance of the model did not strongly affect the quality of the solution, since the benefits per pig observed at first stage did not vary very much. First-stage decision variables related to how many animals to transfer from one facility to another or sent to the abattoir in the first week were rather stable over experiments. Therefore, this paper should be a stimulus for pig companies or cooperatives to adopt stochastic models for planning the transportation of animals, not only reducing costs but also GHG emissions without affecting the production process. The capability of facing contingencies and quick replanning is also an important quality. The model would only require updating the changing parameters and re-running the model to obtain an updated planning method in a rolling horizon framework (Figure 4).
There is also flexibility when tackling other practical aspects of the PSC operation. As mentioned, decisions are generally taken on a weekly basis and it is weekly that it is expected the model be run after updating the parameters, mainly the inventory of animals per facility and market prices. Therefore, having one week in the first stage is enough to allow PSC managers to take these decisions, exhibiting a lower solving time. However, it is possible that operational decisions in some companies are not taken on a weekly basis or may require enlarging the stability of first stage decisions. The modification of the model would be small and feasible.
There literature is extensive in discussing why DSS or similar decision tools and technologies are hardly adopted in agriculture, while amazingly, the lack of information, inadequacy of the management, and information inaccuracies are significant issues in PSC [28]. We can argue that there is not a problem of good models, but there may be a problem in the way they are delivered to end-users. Two decades ago, Ref. [31] already advocated for the neat research orientation of the decision support tools proposed to farmers. Another problem is the user interface and operability of the software developed to host these kinds of sophisticated models. Interfaces must be intuitive and easy to use and self-explainable [4]. No need of mathematical knowledge for using such systems should be required. They should also include auto-checking of results to detect failures in model assumptions or bad input parameters in view of preventing misunderstandings with end-users. A last problem to consider regarding the usability of such tools is the integrability into exiting tools used by farmers or PSC managers. This integrability may suppose a correct maintenance of the database involving an updated inventory of animals on farm and the location of facilities, but also market prices, forecasts, and trucks at disposal. Other papers dealing with two-stage stochastic models in other supply chains facing similar questions [32,33].

5. Study Limitations

Several aspects must be considered as limitations of the presented study. The authors recognize the study has some limitations that can be grouped in two aspects: assumptions in the formulation of the stochastic model and the case study itself being limited to a real Spanish company.
The formulation of the stochastic model relies on a number of scenarios representing the uncertainty on prices. The scenario generation may affect the outcome of the model, but it can give an idea of the impact on pig production over time and the corrective actions that the model adopts to react against uncertainty in sale prices.
On the other hand, the Spanish company relates to the number of farms considered at each phase and the initial inventory. Distances and capacities of farms would affect the optimal result. The biggest concern would be related to the size of the problem depending on the number of farms owned by the company. This size impacts the number of variables and constraints; therefore, solving time could be prohibitive and force alternative approximated methods. For instance, metaheuristics and simheuristics have been proven to be useful in solving large optimization problems [34]. Similar problems were detected by authors in the broiler production [17,18] and the proposed the use of heuristics to reach satisfactory solutions near optimality.
Finally, sustainable aspects in this study are explicitly limited to the use of economic resources and implicitly to the reduction of CO2 emissions by optimizing transportation. It is recognized specialized farms in PSCs are more sustainable [35] and promote pig welfare. However, at the same time there are adversarial effects as they consume more resources and has higher nitrogen leakage. The coverage can be improved including explicitly GHG-emission in the objective function requiring to specify the contribution to sustainability of each PSC actor [35].

6. Conclusions

A two-stage stochastic linear model was formulated and solved, representing an average PSC company in Spain. The biggest concern was how to achieve a reasonable computational solving time for practical purposes due to the size of the model and the large number of integer variables. Instances of the model intended to analyze computational performance and economic outcome for practical purposes were solved successfully. Relaxing the integrality of most decision variables resulted in better solving times with similar economic outputs, allowing pig managers to improve transportation planning. Uncertainty in sales prices was used to generate different scenarios to be taken into account by first-stage decisions. Though relaxing the number of trips is questionable, but fixing the integer and the number of trucks at the first stage and relaxing the integrality of these variables at the second stage seems reasonable to obtain a more accurate transportation cost. Furthermore, the analysis of the first stage of one week is preferred over a first stage of more weeks. More weeks at the first stage do not affect operational decisions nor do optimal policies but negatively impact the execution time. From our results, a planning time horizon of one year (52 weeks) produced enough good first-stage decisions that had to be updated in a rolling time horizon week-by-week.
The explicit inclusion of additional objectives such as GHG emissions should be considered in future research. Likely, approximate methods such as metaheuristics could be interesting and even necessary to solve bigger instances.

Author Contributions

Conceptualization, V.M.A. and L.M.P.-A.; methodology, E.N.-R. and L.M.P.-A.; software, E.N.-R.; validation, V.M.A. and L.M.P.-A.; formal analysis, E.N.-R. and L.M.P.-A.; investigation, E.N.-R. and L.M.P.-A.; resources, L.M.P.-A.; data curation, E.N.-R.; writing—original draft preparation, L.M.P.-A.; writing—review and editing, E.N.-R. and V.M.A.; visualization, L.M.P.-A.; supervision, L.M.P.-A.; project administration, E.N.-R.; funding acquisition, V.M.A. and L.M.P.-A. All authors have read and agreed to the published version of the manuscript.

Funding

The authors wish to acknowledge the CYTED program for supporting the thematic network BigDSS-Agro (P515RT0123). Víctor Manuel Albornoz and Lluís Miquel Plà-Aragonès also wish to acknowledge Universidad Técnica Federico Santa Maria (Grant MEC USM 2018). Lluís Miquel Plà-Aragonès wish to acknowledge the support of the partial funding from Spanish Ministry of Science and Innovation project AI4Pork: TED2021-130829B-I00.

Institutional Review Board Statement

Not applicable.

Informed Consent Statement

Not applicable.

Data Availability Statement

Not applicable.

Acknowledgments

We thank the three anonymous journal reviewers and the guest-editor, Riccardo Accorsi, for helpful comments on an earlier draft.

Conflicts of Interest

The authors declare no conflict of interest.

References

  1. Patidar, R.; Agrawal, S. Restructuring the Indian agro-fresh food supply chain network: A mathematical model formulation. Clean Technol. Env. Policy 2020, 22, 2053–2077. [Google Scholar] [CrossRef]
  2. Utama, D.M.; Santoso, I.; Hendrawan, Y.; Dania, W.A.P. Integrated procurement-production inventory model in supply chain: A systematic review. Oper. Res. Perspect. 2022, 9, 100221. [Google Scholar] [CrossRef]
  3. Rodríguez, S.V.; Faulin, J.; Plà, L.M. New opportunities of Operations Research to improve pork supply chain efficiency. Ann. Oper. Res. 2014, 219, 5–23. [Google Scholar] [CrossRef]
  4. Plà-Aragonès, L.M. The Evolution of DSS in the Pig Industry and Future Perspectives. In EURO Working Group on DSS; Integrated Series in Information Systems; Papathanasiou, J., Zaraté, P., de Sousa, F.J., Eds.; Springer: Cham, Switzerland, 2021; pp. 229–323. [Google Scholar] [CrossRef]
  5. van der Heijden, A.; Cramer, J.M. Change agents and sustainable supply chain collaboration: A longitudinal study in the Dutch pig farming sector from a sensemaking perspective. J. Clean. Prod. 2017, 166, 967–987. [Google Scholar] [CrossRef]
  6. Nadal-Roig, E.; Pagès-Bernaus, A.; Plà-Aragonès, L.M. Bi-objective optimization model based on profit and CO2 emissions for pig deliveries to the abattoir. Sustainability 2018, 10, 1782. [Google Scholar] [CrossRef] [Green Version]
  7. van der Gaag, M.A.; Vos, F.; Saatkamp, H.W.; van Boven, M.; van Beek, P.; Huirne, R.B.M. A state-transition simulation model for the spread of Salmonella in the pork supply chain. Eur. J. Oper. Res. 2004, 156, 782–798. [Google Scholar] [CrossRef]
  8. Beynon, M.; Rasmequan, S.; Russ, S. A new paradigm for computer-based decision support. Decis. Support Syst. 2002, 33, 127–142. [Google Scholar] [CrossRef]
  9. Plà, L.M.; Sandars, D.L.; Higgins, A.J. A perspective on operational research prospects for agriculture. J. Oper. Res. Soc. 2014, 65, 1078–1089. [Google Scholar] [CrossRef]
  10. Ohlmann, J.; Jones, P. A integer programming model for optimal pork marketing. Ann. Oper. Res. 2011, 190, 271–287. [Google Scholar] [CrossRef]
  11. Khamjan, S.; Piewthongngam, K.; Pathumnakul, S. Pig procurement plan considering pig growth and size distribution. Comput. Ind. Eng. 2013, 64, 886–894. [Google Scholar] [CrossRef]
  12. Cadero, A.; Aubry, A.; Dourmad, J.; Salaun, Y.; Garcia-Launay, F. Towards a decision support tool with an individual-based model of a pig fattening unit. Comput. Electron. Agric. 2018, 147, 44–50. [Google Scholar] [CrossRef]
  13. Davoudkhani, M.; Mahé, F.; Dourmad, J.; Gohin, A.; Darrigrand, E.; Garcia-Launay, F. Economic optimization of feeding and shipping strategies in pig-fattening using an individual-based model. Agric. Syst. 2020, 184, 102899. [Google Scholar] [CrossRef]
  14. Rodríguez, S.V.; Albornoz, V.M.; Plà, L.M. A two-stage stochastic programming model for scheduling replacements in sow farms. TOP 2009, 17, 171–189. [Google Scholar] [CrossRef]
  15. Plà, L.M.; Romero, D. Planning Modern Intensive Livestock Production: The Case of the Spanish Pig Sector; International Workshop in OR: La Havana, Cuba, 2008. [Google Scholar]
  16. Nadal-Roig, E.; Plà-Aragonès, L.M.; Alonso-Ayuso, A. Production planning of supply chains in the pig industry. Comput. Electron. Agric. 2019, 161, 72–78. [Google Scholar] [CrossRef]
  17. Brevik, E.; Lauen, A.Ø.; Rolke, M.C.B.; Fagerholt, K.; Hansen, J.R. Optimisation of the broiler production supply chain. Int. J. Prod. Res. 2020, 58, 5218–5237. [Google Scholar] [CrossRef]
  18. Solano-Blanco, A.; González, J.E.; Gómez-Rueda, L.O.; Vargas-Sánchez, J.J.; Medaglia, A.L. Integrated planning decisions in the broiler chicken supply chain. Int. Trans. Oper. Res. 2020; early view. [Google Scholar] [CrossRef]
  19. Han, J.-H.; Lee, J.-Y.; Jeong, B. Two-Level Supply Chain with Production-Time-Dependent Products. Appl. Sci. 2021, 11, 9687. [Google Scholar] [CrossRef]
  20. Nadal-Roig, E.; Plà-Aragonès, L.M.; Pagès-Bernaus, A.; Albornoz, V.M. A two-stage stochastic model for pig production planning in vertically integrated production systems. Comput. Electron. Agric. 2020, 176, 2020105615. [Google Scholar] [CrossRef]
  21. Wallace, S.; Ziemba, W.T. Applications of Stochastic Programming; MPS-SIAM Series in Optimization; Society for Industrial Mathematics: Philadelphia, PA, USA, 2005. [Google Scholar]
  22. Birge, J.R.; Louveaux, F.V. Introduction to Stochastic Programming, 2nd ed.; Springer: Berlin/Heidelberg, Germany, 2011. [Google Scholar]
  23. Escudero, L.F.; Kamesam, P.V.; King, A.J.; Wets, R. Production planning via scenario modeling. Ann. Oper. Res. 1993, 43, 311–355. [Google Scholar] [CrossRef]
  24. Mercolleida. Reference Price in the Market Lleida (Spain). 2022. Available online: https://www.mercolleida.com/es/la-lonja-last (accessed on 16 January 2023).
  25. Winters, P. Forecasting sales by exponentially weighted moving averages. Manag. Sci. 1960, 6, 324–342. [Google Scholar] [CrossRef]
  26. Box, G.E.P.; Jenkins, G.M. Time Series Analysis: Forecasting and Control; Holden-Day Series in Time Series Analysis; Revised edition; Holden-Day: San Francisco, CA, USA, 1976. [Google Scholar]
  27. Gamberini, R.; Lolli, F.; Rimini, B.; Sgarbossa, F. Forecasting of sporadic demand patterns with seasonality and trend components: An empirical optimization between Holt-Winters and (S) ARIMA methods. Math. Probl. Eng. 2010, 2, 579010. [Google Scholar] [CrossRef]
  28. Kamble, S.S.; Gunasekaran, A.; Gawankar, S.A. Achieving sustainable performance in a data-driven agriculture supply chain: A review for research and applications. Int. J. Prod. Econ. 2020, 219, 179–194. [Google Scholar] [CrossRef]
  29. Chardine-Baumann, E.; Botta-Genoulaz, V. A framework for sustainable performance assessment of supply chain management practices. Comput. Ind. Eng. 2014, 76, 138–147. [Google Scholar] [CrossRef]
  30. Tseng, M.L.; Wu, K.J.; Lim, M.K.; Wong, W.P. Data-driven sustainable supply chain management performance: A hierarchical structure assessment under uncertainties. J. Clean. Prod. 2019, 227, 760–771. [Google Scholar] [CrossRef]
  31. Kamp, J.A.L.M. Knowledge based systems: From research to practical application: Pitfalls and critical success factors. Comput. Electron. Agric. 1999, 22, 243–250. [Google Scholar] [CrossRef]
  32. Wan, N.; Li, L.; Wu, X.; Fan, J. Coordination of a fresh agricultural product supply chain with option contract under cost and loss disruptions. PLoS ONE 2021, 16, e0252960. [Google Scholar] [CrossRef]
  33. Kungwalsong, K.; Cheng, C.-Y.; Yuangyai, C.; Janjarassuk, U. Two-Stage Stochastic Program for Supply Chain Network Design Under Facility Disruptions. Sustainability 2021, 13, 2596. [Google Scholar] [CrossRef]
  34. Juan, A.A.; Keenan, P.; Martí, R.; Jeong, A. A review of the role of heuristics in stochastic optimization: From metaheuristics to learnheuristics. Ann. Oper. Res. 2021, 320, 831–861. [Google Scholar] [CrossRef]
  35. Kruger, S.D.; Zanin, A.; Durán, O.; Afonso, P. Performance Measurement Model for Sustainability Assessment of the Swine Supply Chain. Sustainability 2022, 14, 9926. [Google Scholar] [CrossRef]
Figure 1. Flow of animals over PSC facilities (Farm #) showing the need for transportation between phases.
Sustainability 15 02523 g001
Figure 2. The multiperiod nature of a two-stage stochastic linear programming model. Scenario representation of the first and second stages (a) and the effect of non-anticipativity constraints (b).
Sustainability 15 02523 g002
Figure 3. Weekly sale price in Euros per kg of liveweight (weeks 1–208) and generation of different scenarios of sales’ price (weeks 209–312).
Sustainability 15 02523 g003
Figure 4. Intended use of the model in a rolling time horizon.
Sustainability 15 02523 g004
Table 1. Summary of the literature review most related to the present research.
ReferenceProblemApproachUncertaintyThe Gap
[17]Production planning of a broiler supply chainMIP-Does not consider uncertainty
[12]Flow of animals in the PSCSIMLive weight, mortality, loss and feed conversion rate, Number of shipments per batchDoes not optimize the transportation problem. Focused on a fattening farm
[13]Feeding and transportation to the abattoirBOPPig growth performance profileFocused on a fattening farm
[19]Production planning of a broiler supply chainMIP-Does not consider uncertainty
[11]Transportation to the abattoirMIP-Does not consider uncertainty
[6]Transportation to the abattoirBOP-Does not consider uncertainty
[16]Production planning of a PSCMIP-Does not consider uncertainty
[20]Production planning of a PSCTSPSales pricesDoes not propose a heuristic for solving the TSP model
this manuscriptTransportation planning of a PSCTSPSales pricesDoes propose a heuristic for solving the TSP model
[10]Transportation to the abattoirMIP-Does not consider uncertainty. Focused on a fattening farm
[14]Flow of animals in a sow farmTSPLitter size, mortality, and fertility ratesDoes not optimize the transportation problem. Focused on a sow farm
[18]Production planning of a broiler supply chainMIP-Does not consider uncertainty
[7]Flow of animals in the PSCSIMSpread of a pathogenDoes not optimize the transportation problem
Table 2. Notation of the deterministic model per scenario.
Indexes and Sets
t ∈ TFinite time planning horizon (in weeks), t = 1, …, |T|
h ∈ HFarms belonging the PSC, h = 1, …, |H|. H = B∪R∪F: Disjoint partition of farms in three phases (sites), being B the set of sow farms, R the set of rearing farms and F the set of fattening farms
e ∈ EGrowing period in weeks, e = 1, …, |E|, where E = EB∪ER∪EF disjoint partition of the productive cycle, i.e., weeks spend by pigs in different facilities.
Parameters
INheInitial inventory of pigs of age e in the farm h ∈ H
KhHousing capacity of facilities for h ∈ H.
LSbtLitter size at farrowing in the b ∈ B sow farm per week t ∈ T.
CPtheUnitary production cost on farm h, per week t ∈ T and stage e ∈ E per piglet.
CT(h,h*)Transportation cost from farm h to another farm or to the abattoir, h* ∈ H∪{a}
KP(h,h*)Truck capacity (# of animals) transported from farm h to another farm or to the abattoir, h* ∈ H∪{a}
PteExpected pork value of pigs at week t and fattening week e.
R(h+)Cost of renting a farm not owned by the company
Decision Variables
Ithe + Inventory of piglets of age e ∈ E at week t on the farm h.
Nte(h,h*) + Number of trips from farm h to another farm or to the abattoir, h* ∈ H∪{a} of pigs at age e, week t.
Xh+ 0 , 1 Binary variable for renting a farm not owned by the company
Z1th 0 , 1 Binary variable for batch control. Z1th = 1 if farm h ∈ F is not empty at week e and Z1th = 0 otherwise
Z2th 0 , 1 Binary variable for batch control. Z2th = 1 if farm h ∈ F is not empty at week e and Z2th = 0 otherwise
Table 3. Computational and solution results comparing decision variable relaxation.
All Decision Variables, IntegerTrucks as Continuous
Nte(h,h*) +
Animals as Continuous
Ithe +
All Continuous
# Integer Variables4,862,0811,674,4003,187,681--
# Continuous Variables--3,187,6811,674,4004,862,081
Constraints4,072,2384,072,2384,072,2384,072,238
Solving time>48 h>48 h>48 h1502 s.
Table 4. Model’s behavior depending on the number of weeks in first stage.
# Weeks in the First Stage/Second Stage
1/512/503/494/48
Solving time (s)150224077.98711,563
First Stage (# variables)943118,78128,13137,481
Second Stage (# variables)6,199,1316,077,5815,956,0315,834,481
# Pigs sent 1st week22,84034,82918,23218,232
Benefit per pig 1st week (€)111105.23112.48112.48
# Pigs sent 1st stage22,84065,54876,33679,268
Benefit per pig 1st stage (€)111109.49108.84113.33
Total # Pigs sent321,491356,621358,430339,598
Total Benefit per pig (€)108.61109.25109,59109,72
Table 5. The model’s behavior depending on the number of weeks in the total problem.
Time Horizon (# Weeks)
5256606468727680
Solving time (s)15022035264161396281661949824422
Pigs sent 1st stage (#)22,84022,84022,84022,84022,84018,23018,23018,230
Benefit per pig (€)111.0111.0111.0111.0111.0114.2114.2114.2
Total # Pigs sent (thousands)321345369391415448493519
Benefit per pig (€)108.6108.3109.0110.6112.0114.6117.0119.2
Disclaimer/Publisher’s Note: The statements, opinions and data contained in all publications are solely those of the individual author(s) and contributor(s) and not of MDPI and/or the editor(s). MDPI and/or the editor(s) disclaim responsibility for any injury to people or property resulting from any ideas, methods, instructions or products referred to in the content.

