Article

Research on the Distribution Characteristics of the Bulking Coefficient in the Strike Direction of the Longwall Goaf Filled with Slurry

1
School of Energy Engineering, Xi’an University of Science and Technology, Xi’an 710054, China
2
Henan Key Laboratory for Green and Efficient Mining & Comprehensive Utilization of Mineral Resources, Henan Polytechnic University, Jiaozuo 454000, China
3
Shaanxi Province Key Laboratory of Coal Mine Water Disaster Prevention and Control Technology, Xi’an 710077, China
4
China Coal Energy Research Institute Co., Ltd., Xi’an 710054, China
*
Author to whom correspondence should be addressed.
Sustainability 2023, 15(3), 2508; https://doi.org/10.3390/su15032508
Submission received: 4 January 2023 / Revised: 18 January 2023 / Accepted: 23 January 2023 / Published: 31 January 2023

Abstract

:
Coal gangue slurry filling is an important technical means for harmless and large-scale disposal of gangue under low-interference conditions, and is one of the most important ways to achieve green mining, which is in line with the national concept of green development. This paper systematically expounds the technical background and scientific connotations of the birth of slurry filling, clarifies the key technology and process principles of slurry filling, and constructs the lag distance and optimization method of slurry filling based on the bulking coefficient. In order to explore the distribution law of the bulking coefficient of the overburden broken zone in the mining process, UDEC numerical simulation and similar simulations were used to analyze the movement law of a coal seam roof and the distribution characteristics of the bulking coefficient. The results show that with the evolution of the spatial structure of the overlying strata of the goaf, the subsidence of the coal seam roof decreases from the bottom to the top, and finally becomes stable. In the advancing direction of the working face, the bulking coefficient decreases continuously, and shows certain zoning characteristics. With the mining, it moves forward periodically with dynamic changes. In the strike direction, it can be divided into three areas: the natural accumulation area, the load-affected area and the gradual compaction area. Finally, the lag distance of slurry filling is determined to be 60 m, and the effect of adjacent grouting filling is good in the field test.

1. Introduction

In the process of coal resource development and utilization, a large number of solid wastes of coal gangue are produced. According to the statistics of the 13th Five-Year Plan of Coal Industry Development, the annual discharge of coal gangue in China has reached 759 million tons [1,2,3]. There are a series of eco-environmental problems, such as air pollution, groundwater pollution and soil pollution, produced during the process of waste rock discharge [4,5,6]. In order to realize the sustainable development of coal mining, slurry filling technology, as an effective technical approach for the green disposal of waste rock, has little impact on the original production system of the mine and can realize parallel mining and filling operations, and has been applied in many large mines in China [7]. The distance between slurry filling and coal face lag is the key parameter of this technology, and different lag distances will directly affect the filling effect and filling quantity [8,9]. However, the spatial distribution characteristics of mining overburden voids are the key factor to determine the lag distance of slurry filling, playing a decisive role in slurry filling quantity, and so the spatial distribution is an important parameter of slurry filling design [10,11,12,13]. At present, domestic and foreign scholars have conducted a lot of research on mining overburden void space. Wang Yutao [14,15,16,17,18] built a three-dimensional spatial dynamic distribution model of voids and permeability in the goaf based on the theory of the conservation of mining space, and obtained the distribution maps of voids and permeability in different spatial positions and different mining end times; Liang Bing [19,20,21,22,23,24], etc., studied the distribution law of stress change and bulking coefficient of caving rock mass in the goaf of Shendong mining area, analyzed the structural characteristics of overburden “two zones”, and divided the stress and bulking coefficient of caving rock mass in the goaf. Liu Yiyang [25,26,27,28] and others put forward a chain arch structure inclined to compound force, analyzed the characteristics of the chain arch under the influence of area length effect, and obtained the distribution characteristics of the crack field and void ratio of an “O”-shaped ring. The above research mainly focuses on the spatial distribution of the void space and permeability under the condition of goaf water storage. The research area in these studies is mainly the whole area of the fractured zone and caving zone, and the research object is mostly the old goaf after mining. There is little research on the trend distribution characteristics of void space in the caving zone in the mining face.
Based on this, this paper takes the lag distance of slurry filling as the research object, analyzes the roof movement and the variation law of the bulking coefficient in the mining process of the working face by using the method of numerical simulation and similar simulation, and establishes the lag distance optimization method based on the bulking coefficient, which provides a theoretical basis for the determination of the lag distance of slurry filling.

2. Principle of Slurry Filling Technology

2.1. Technical Background of the Birth of Slurry Filling

Coal gangue underground filling has been developed for decades in China, and in different periods, different underground filling methods [29,30,31] have been used according to different requirements, such as solid filling in the working face, paste filling in the working face, grouting filling in the overburdened separation layer and slurry filling in the goaf.
Before the 1980s, coal gangue in China was mostly disposed in the form of on-site stacking. Underground filling theories and technical systems of coal gangue had not yet been established, and only some mines tried to stack coal gangue in abandoned roadways to reduce the transportation volume.
From the 1980s to the end of the 1990s, aiming at addressing the problem of surface subsidence after coal seam mining, China carried out the experiment of separated layer grouting filling in Laohutai Coal Mine, Fushun, followed by the application of “three-under” mining in eastern mining areas such as Datun, Xinwen, Yanzhou and Zaozhuang, and gradually established the basic theory and technical system of separated layer grouting filling in overlying strata [32].
At the beginning of the 21st century, aiming to solve the “three-under” mining problem of coal seams in the central mining area, China began to study the underground treatment technology of solid filling, formulating a solid filling technology system, which was applied in the central and eastern mining areas such as Hebei, Kailuan, Shandong and Shanxi. In view of the layered mining problem of thick coal seams, paste filling technology was introduced in Taiping Coal Mine in 2006, and it was gradually applied in “three-under” mining, taking into account the disposal of coal gangue [32,33].
After 2010, in order to meet the demand for the green and low-interference disposal of coal gangue in high-yield and high-efficiency mines in the western Mengshan area, China started the research into and exploration of goaf slurry filling technology, and gradually carried out industrial tests in Huangling No. 2 coal mine and Dahaize coal mine [7,31]. The development process of coal gangue underground filling is shown in Figure 1.

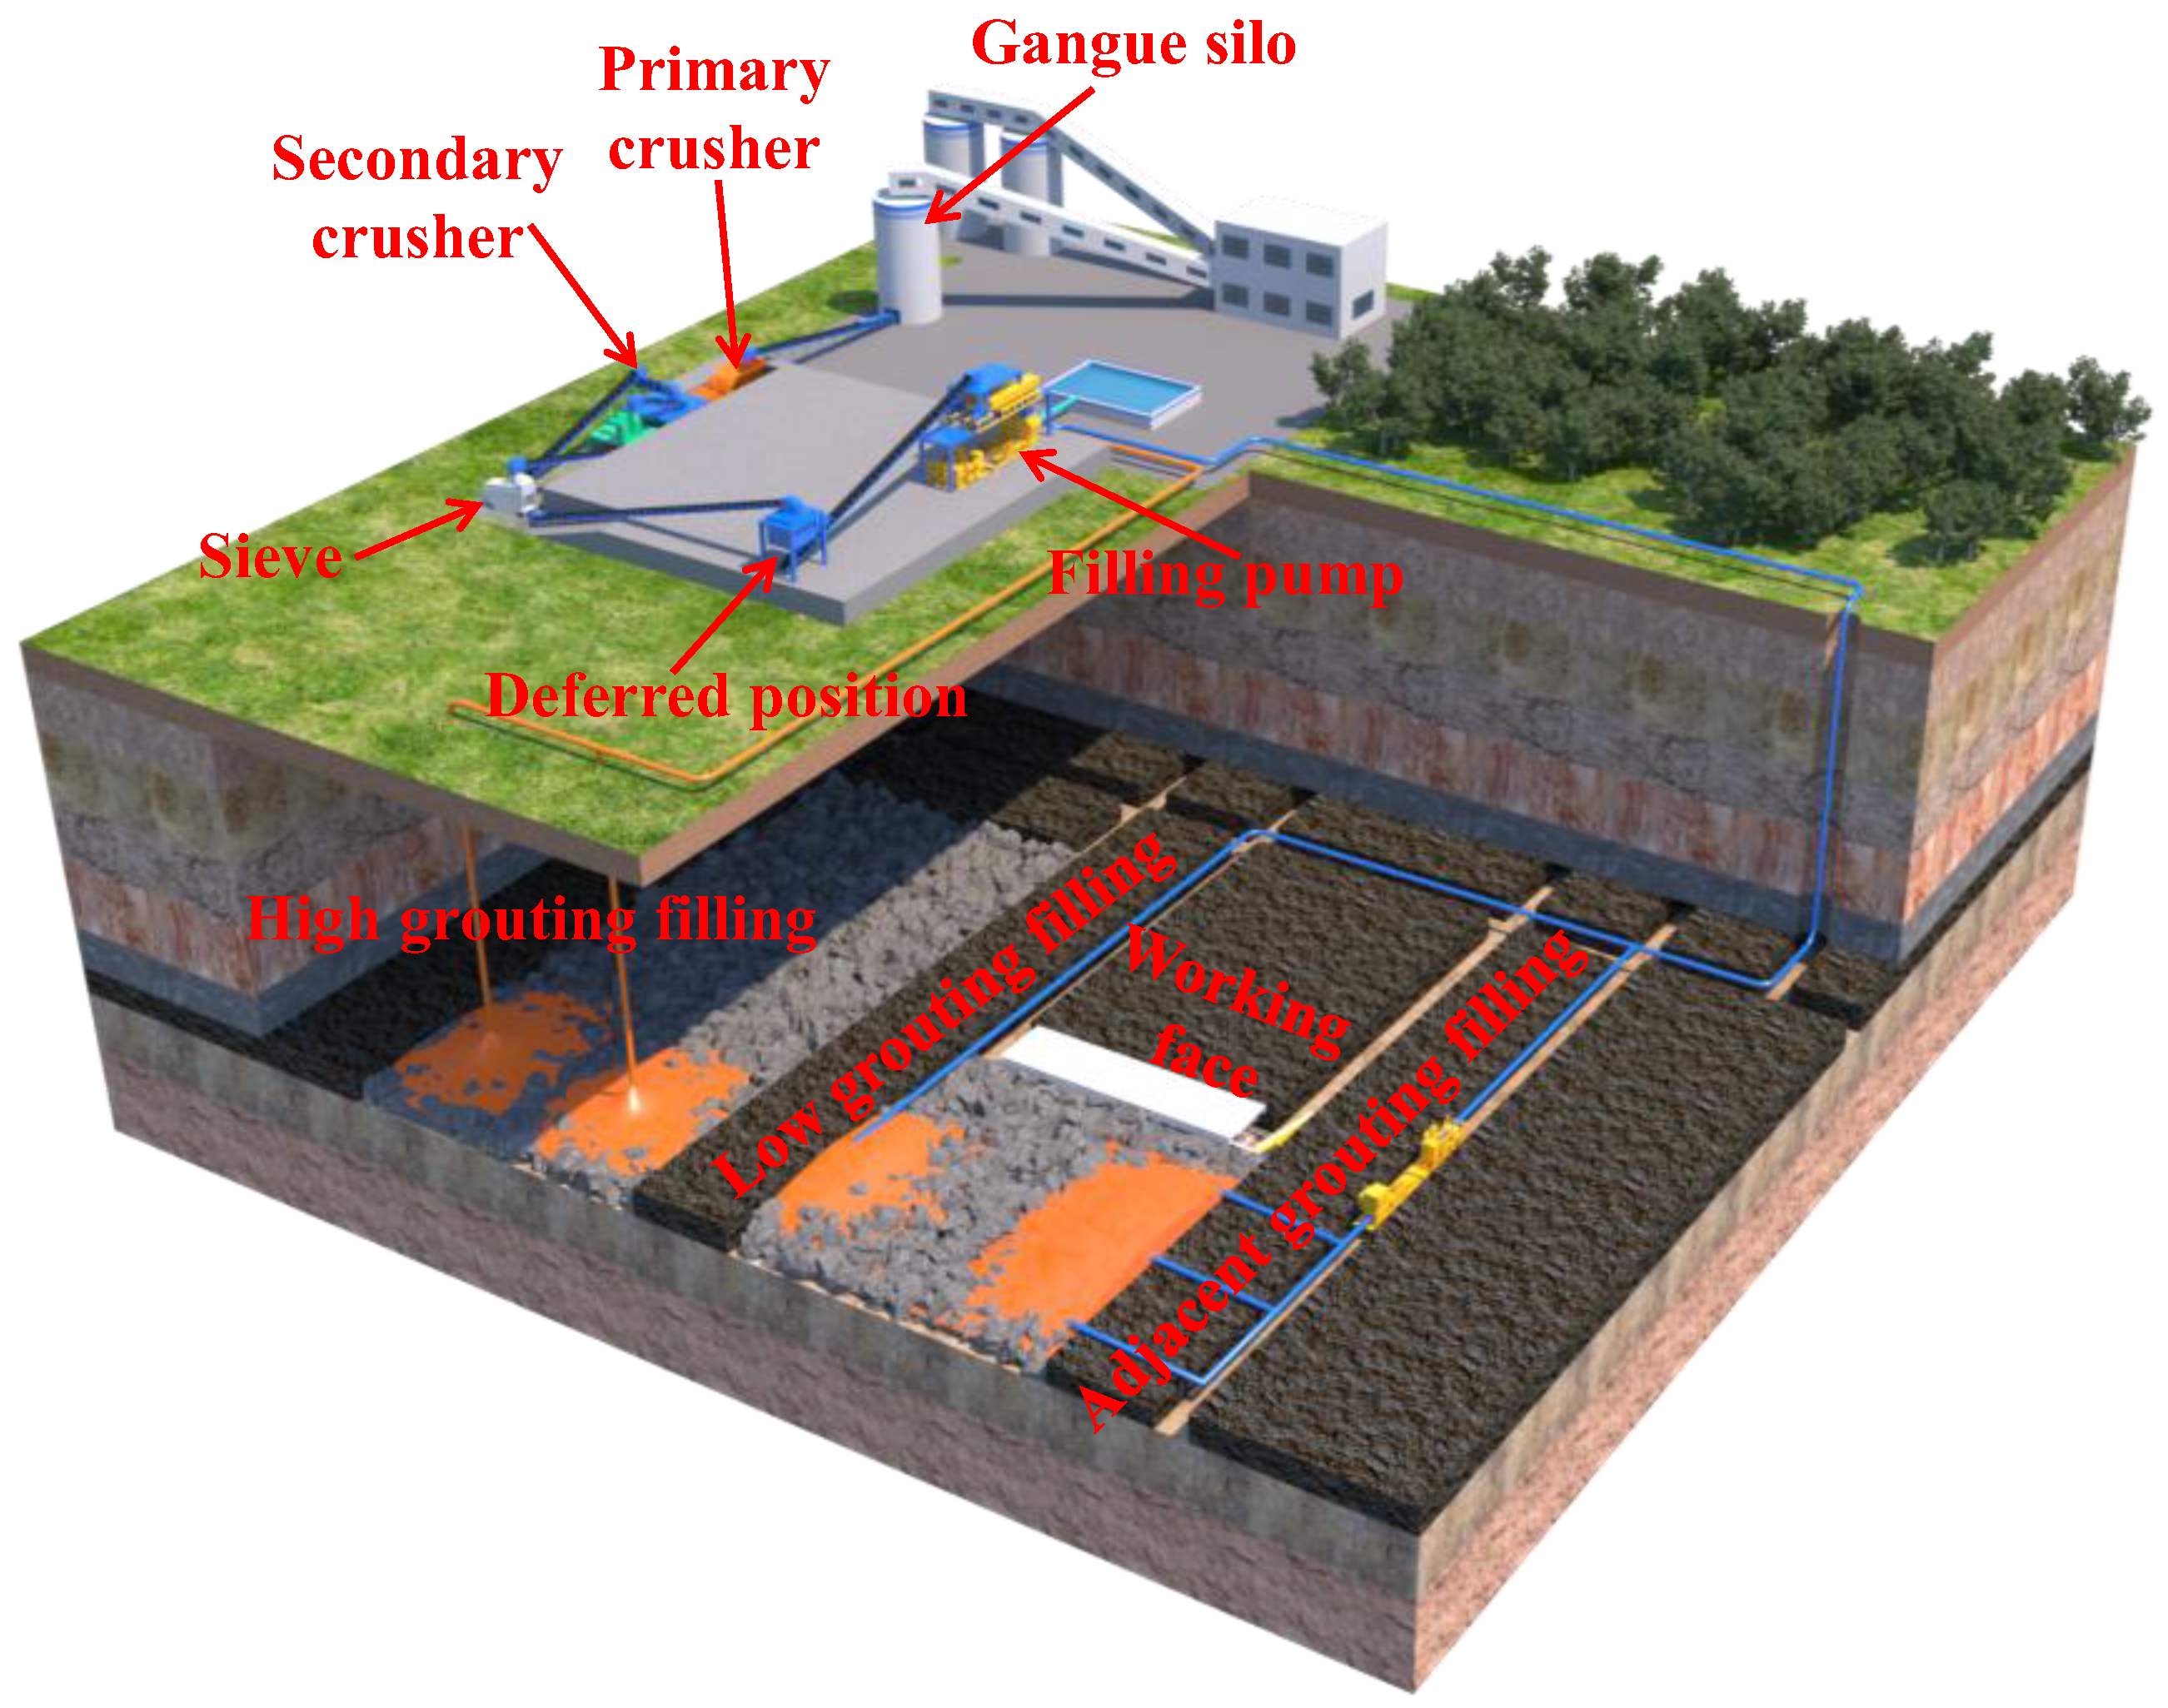
2.2. Principles and Methods of Slurry Filling Technology

Slurry pipeline filling technology refers to making coal-based solid waste produced in the production process of coal mines or power plants into powder with a certain particle size by crushing, grinding and other technical means, and mixing it with water according to a specific proportion to prepare slurry. The slurry is transported to the filling position through long-distance pipeline transportation, and the residual space after stope collapse is used for filling. The main technical means of filling include high grouting filling, adjacent grouting filling and low grouting filling, and the technical schematic diagram of these processes is shown in Figure 2.
High grouting filling refers to the construction of a vertical space slurry filling channel in the lower area of the mining overburden fracture zone. The means of realization can be divided into a ground high-level grouting borehole, an underground high-level grouting roadway, a kilometer borehole, an upper coal seam grouting borehole, etc.
Adjacent grouting filling refers to the arrangement of adjacent grouting and filling holes in the upper area of the collapse zone to build a slurry filling channel at the same level in the inclined space. The main means of implementation involves drilling upward from the adjacent working face roadway or the adjacent main roadway to the upper area of the collapse zone.
Low grouting filling refers to arranging grouting pipes at the lower part of the collapse zone to build a filling channel. The main means of implementation involves hanging pipes and filling the roadway in the working face.
Each technical means has its own applicable conditions and technical advantages. In practical engineering, the above technical means can be combined and matched according to specific conditions to form the optimal filling mode. This technology has little impact on the original production system, and can realize parallel mining and filling. The transportation mode of filling materials is efficient and fast, and the filling process can realize intelligent control. It is an effective technical method for the green disposal of waste rock.

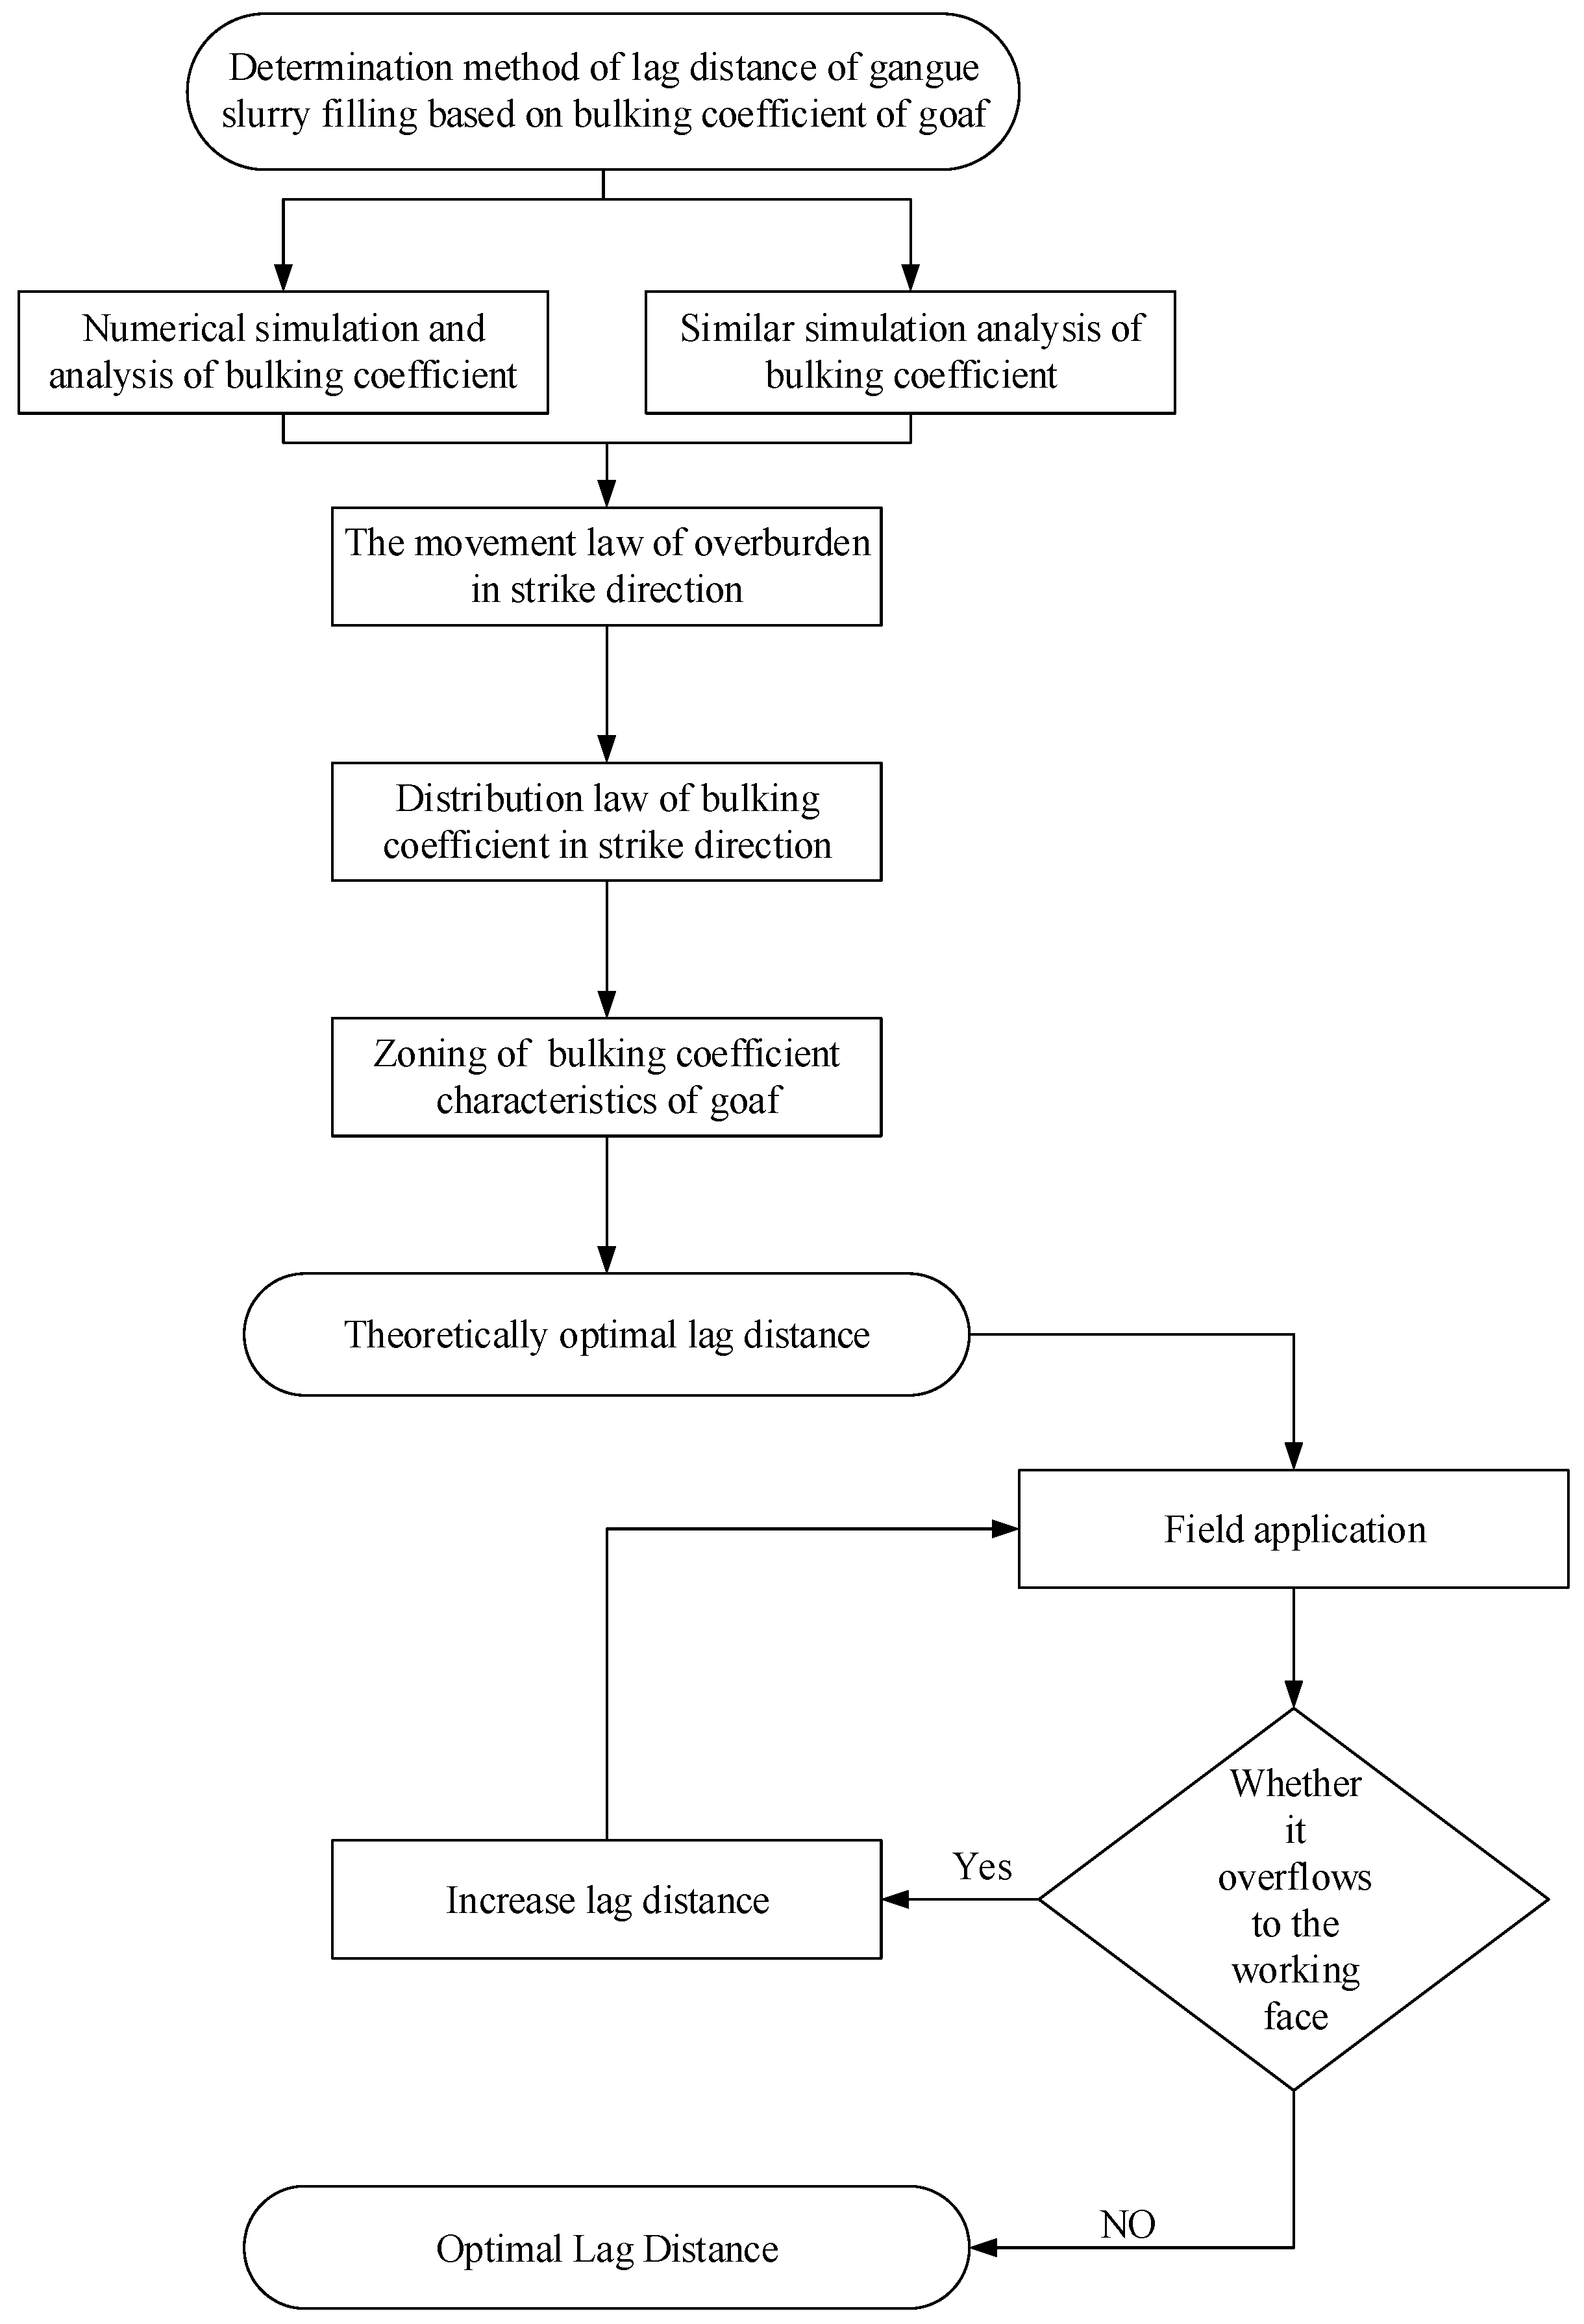
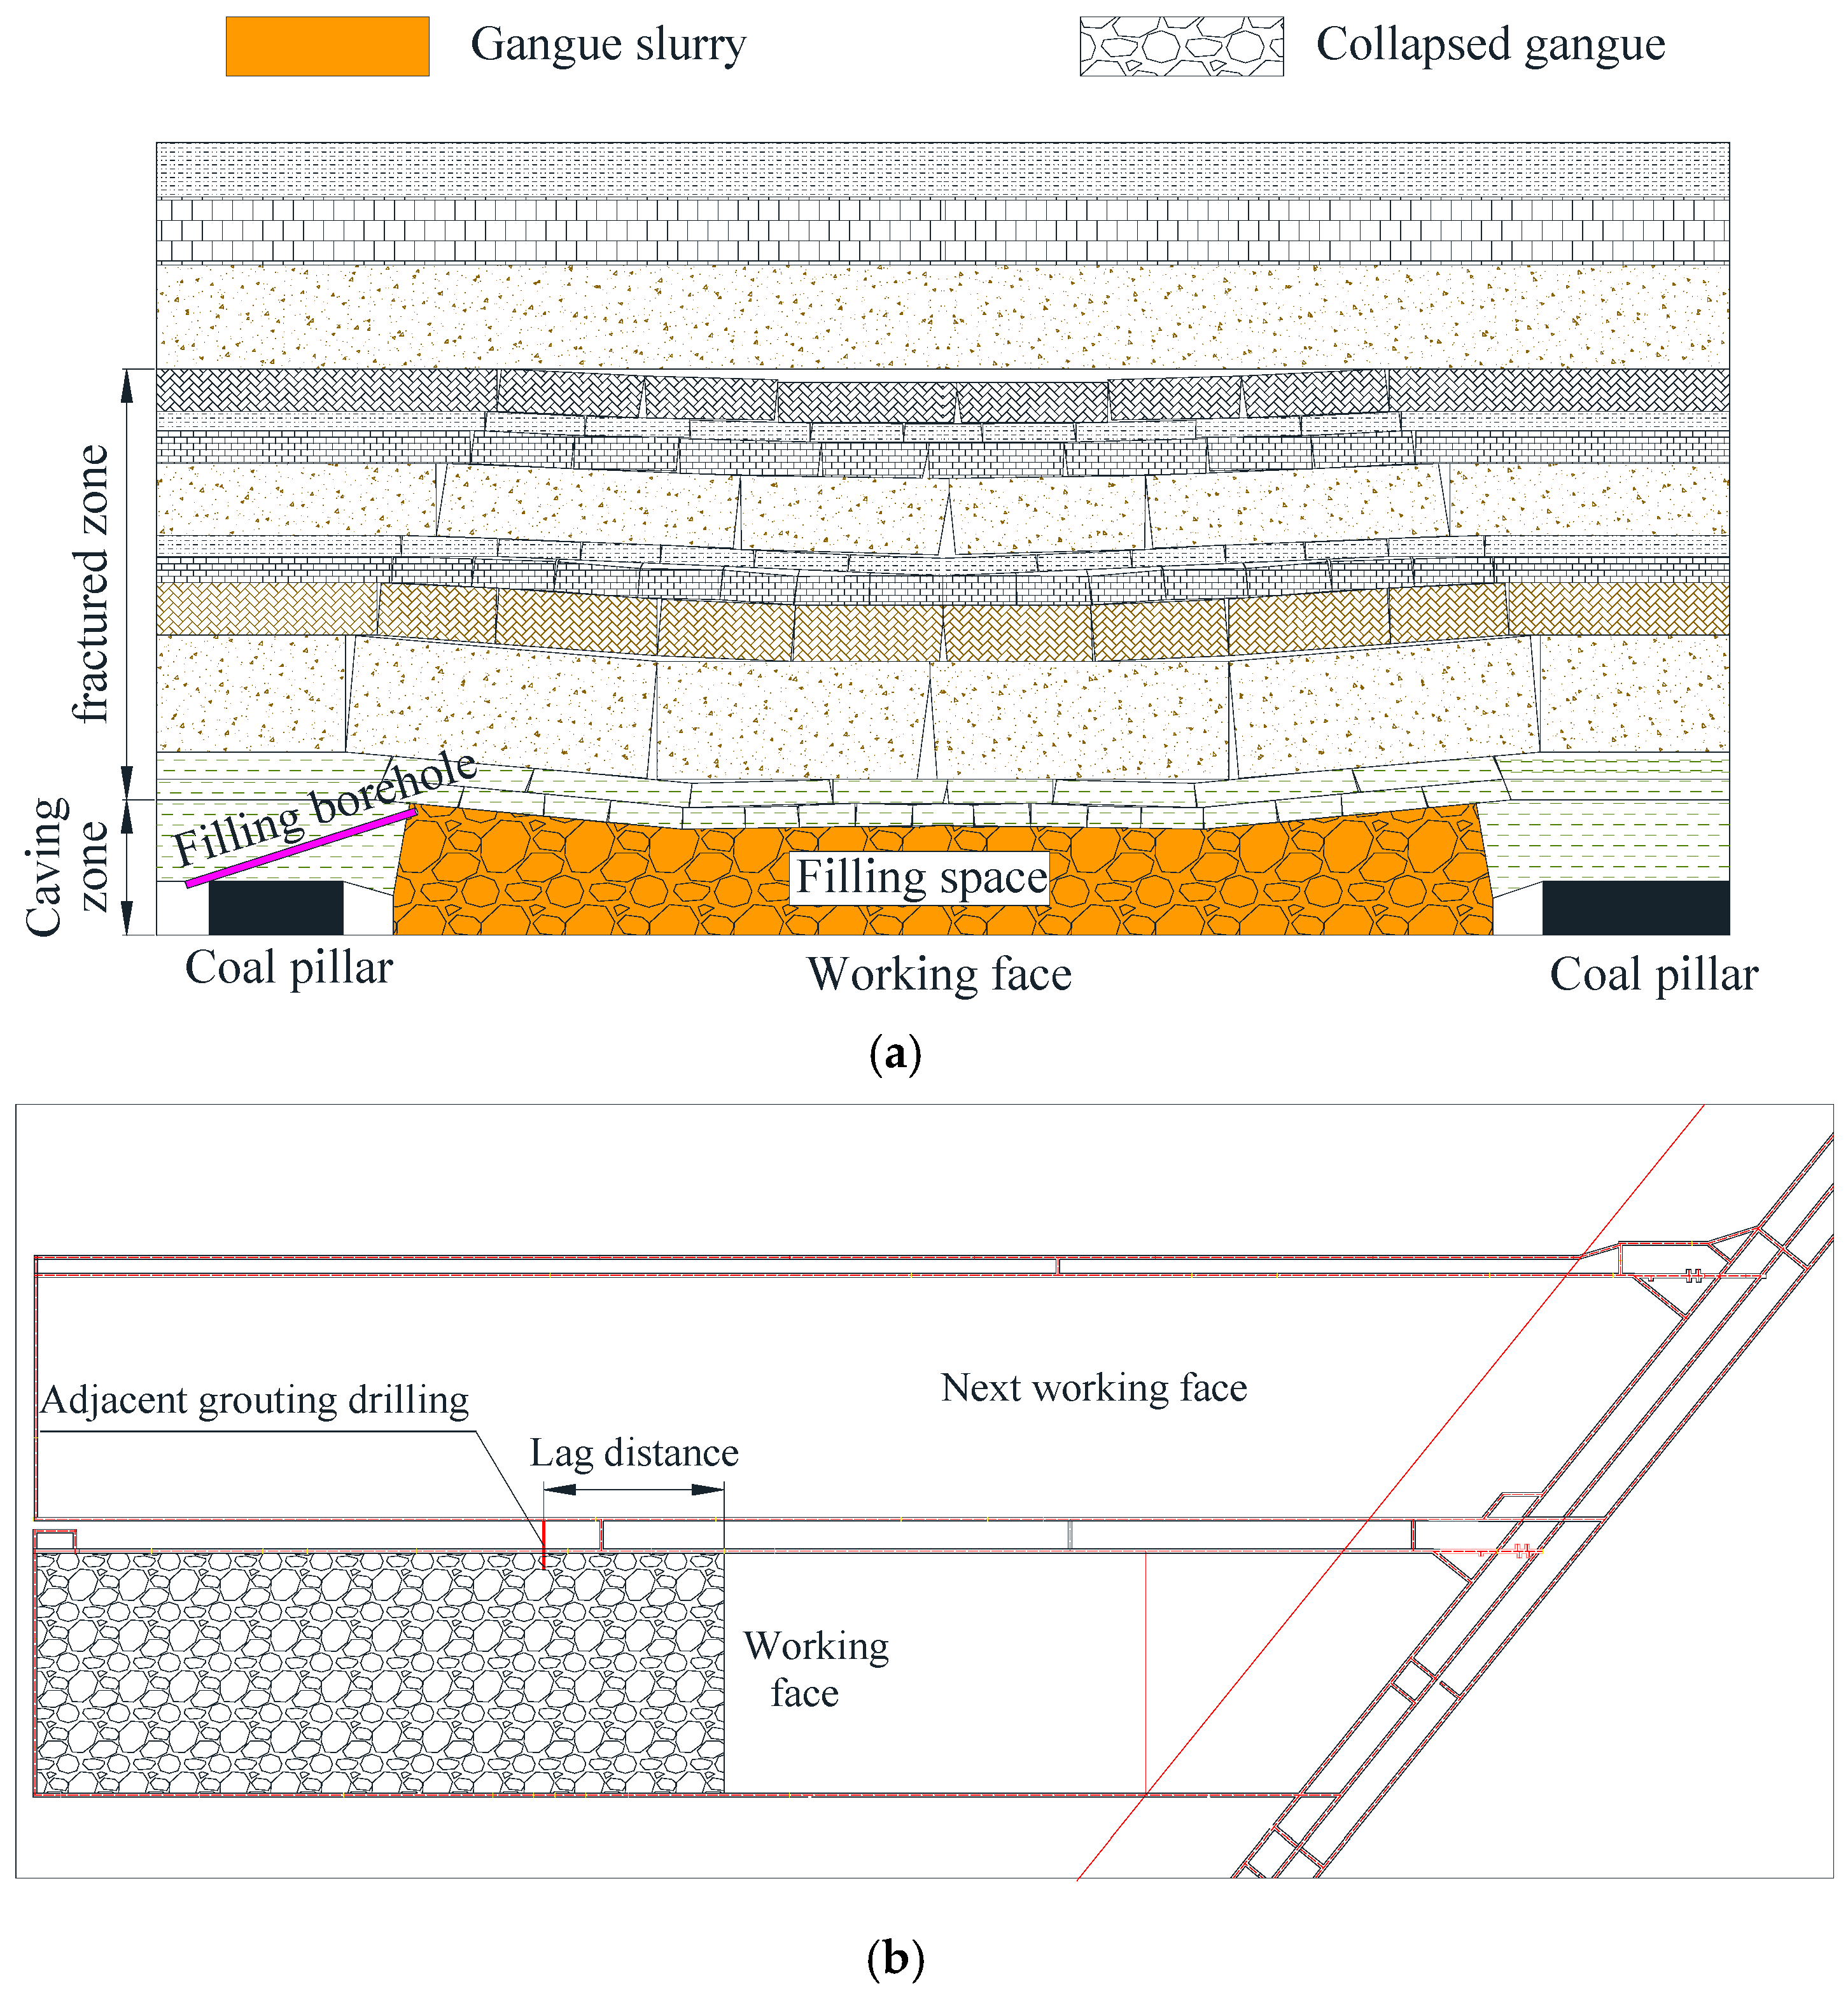
2.3. Slurry Filling Lag Distance and Optimization Method

Different slurry filling methods, such as high-level grouting filling, adjacent grouting filling and low-level grouting filling, are used to fill the coal mining face with lag. The distance between the filling position and the coal mining face at the beginning of filling is called the lag distance. Its purpose is to ensure the relative independence of coal mining and filling, realize real parallel mining and filling, and improve the mining efficiency of the filling face. Different lag distances will directly affect the filling effect and filling quantity. A larger lag distance is more beneficial to the spatial independence of filling and coal mining operations, and will not influence cross operations. However, with the increase in lag distance, the compression degree of the gangue in the goaf also increased, and the difficulty of grouting rises, which will affect the grouting filling effect. However, the spatial distribution characteristics of the mining overburden void are the key factors determining the lag distance of slurry filling. Therefore, a method to determine the lag distance of gangue slurry filling based on the bulking coefficient of the goaf is proposed, as shown in Figure 3.

3. General Situation of the Project

The raw coal production capacity of a coal mine in Shaanxi province is 10 Mt/a, and the total amount of waste rock is about 0.85 Mt/a every year, among which the amount of pure waste rock generated from the bottom of the underground working face and tunneling in the cavern is about 200,000 t/a. In order to promote the ecological protection and high-quality development of the Yellow River Basin, and to avoid the environmental pollution caused by the ground discharge of gangue, the coal washing plant of the mine is equipped with a gangue power plant. The washed gangue can be directly utilized by the gangue power plant with low calorific value, and the underground-excavated gangue is mainly treated by slurry filling. The capacity of the industrial experimental system in the early stage of panel 3 is designed to be 118,000 t/a, and the capacity of the filling system in the later stage of panel 2 is designed to be 200,000 t/a, which is popularized and applied in the mode of panel replication.
Based on the specific mining geological conditions of the coal mine, the filling method is adjacent grouting filling, and the slurry filling of the goaf in the lagging mining face is realized by drilling upward from the roadway construction in the adjacent working face to the upper area of the caving zone, as shown in Figure 4.
In the process of mining the face, the overburden of the stope is constantly deformed and destroyed, which leads to the continuous compaction of waste rock in the goaf and the continuous change in the filling space. Reasonable determination of the filling hole position becomes one of the key factors to determine the filling amount of a single hole. Therefore, it is an effective means of reasonably determining the lag distance of adjacent grouting holes and increasing the filling amount of single hole by making clear the distribution characteristics of overburden failure and void space in the stope.

4. Numerical Simulation Analysis of Bulking Coefficient Characteristics of Overburden in Stope

4.1. Model Establishment

Combined with the geological conditions of the No. 301 working face in a coal mine in Shaanxi, the numerical model of overburden failure in the stope was established. To eliminate the stress boundary effect, the model size was determined to be 450 m × 200 m (length × height). A uniform load of 7.5 MPa was applied to the upper boundary of the model as the self-weight stress of the overlying strata, while horizontal constraints were applied to the left and right boundaries, and the vertical displacement was not constrained. The vertical displacement and horizontal displacement at the bottom of the model were both limited to 0. An elastic–plastic constitutive model was adopted for numerical calculation, and the yield criterion was the Moore–Coulomb yield criterion. Physical and mechanical parameters of coal strata in the numerical calculation model are shown in Table 1.

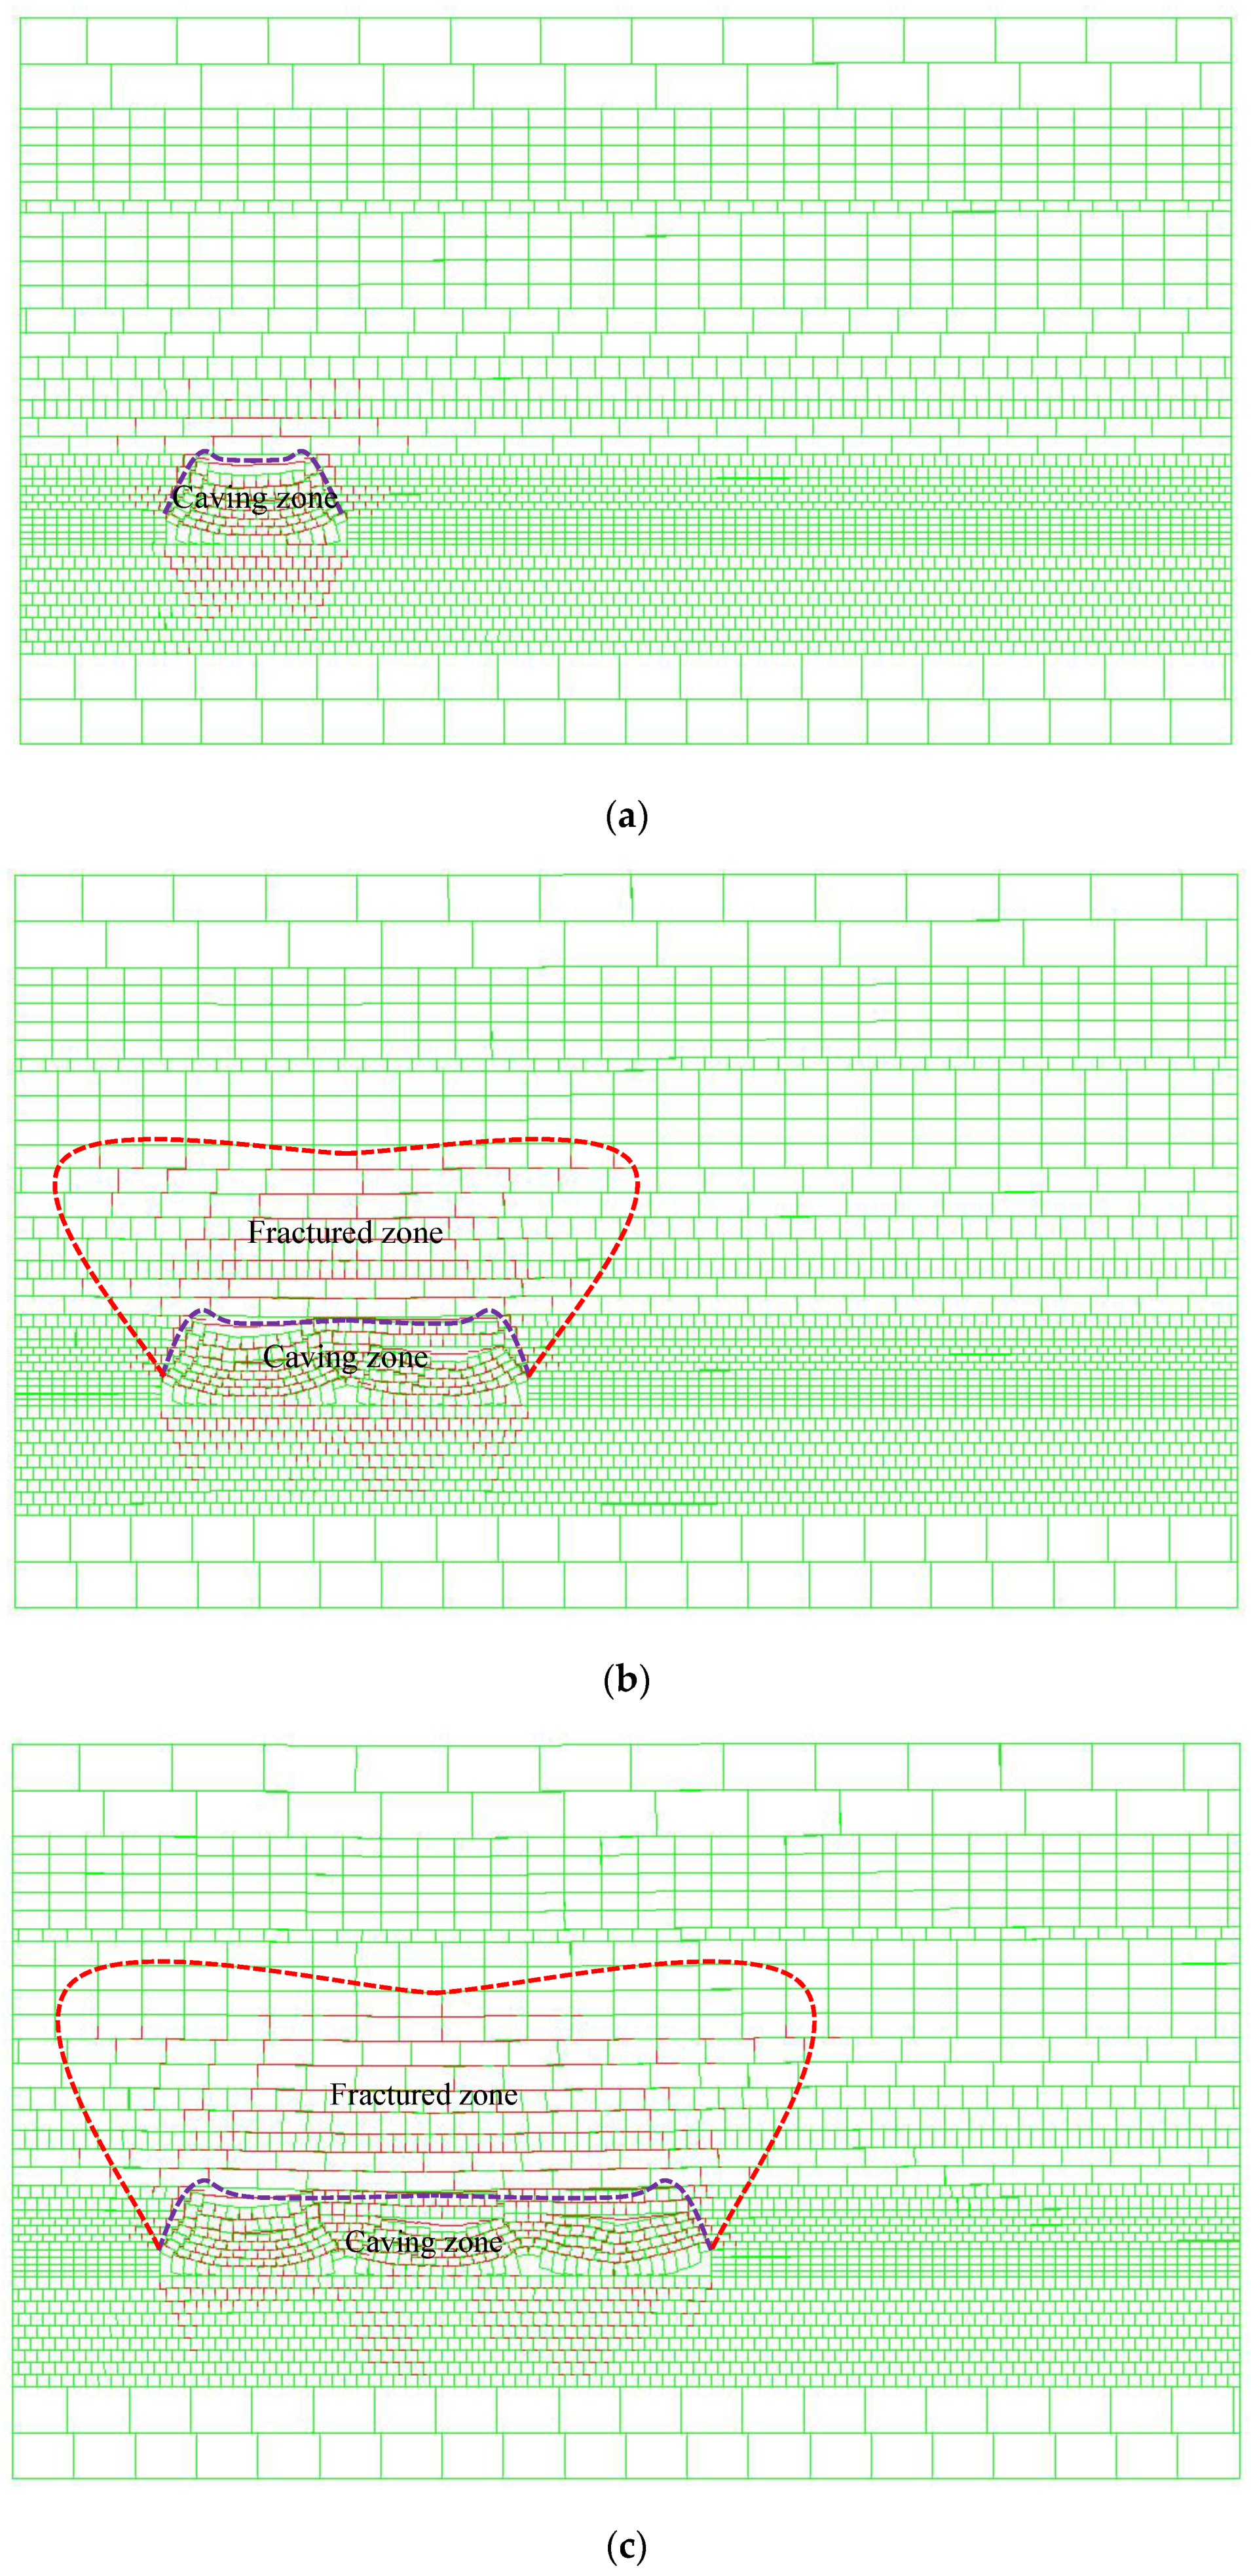
4.2. Analysis of Caving Characteristics

Figure 5 presents overburden caving and fissure development in the stope when the working face advances over different distances.
As can be seen from the figure:
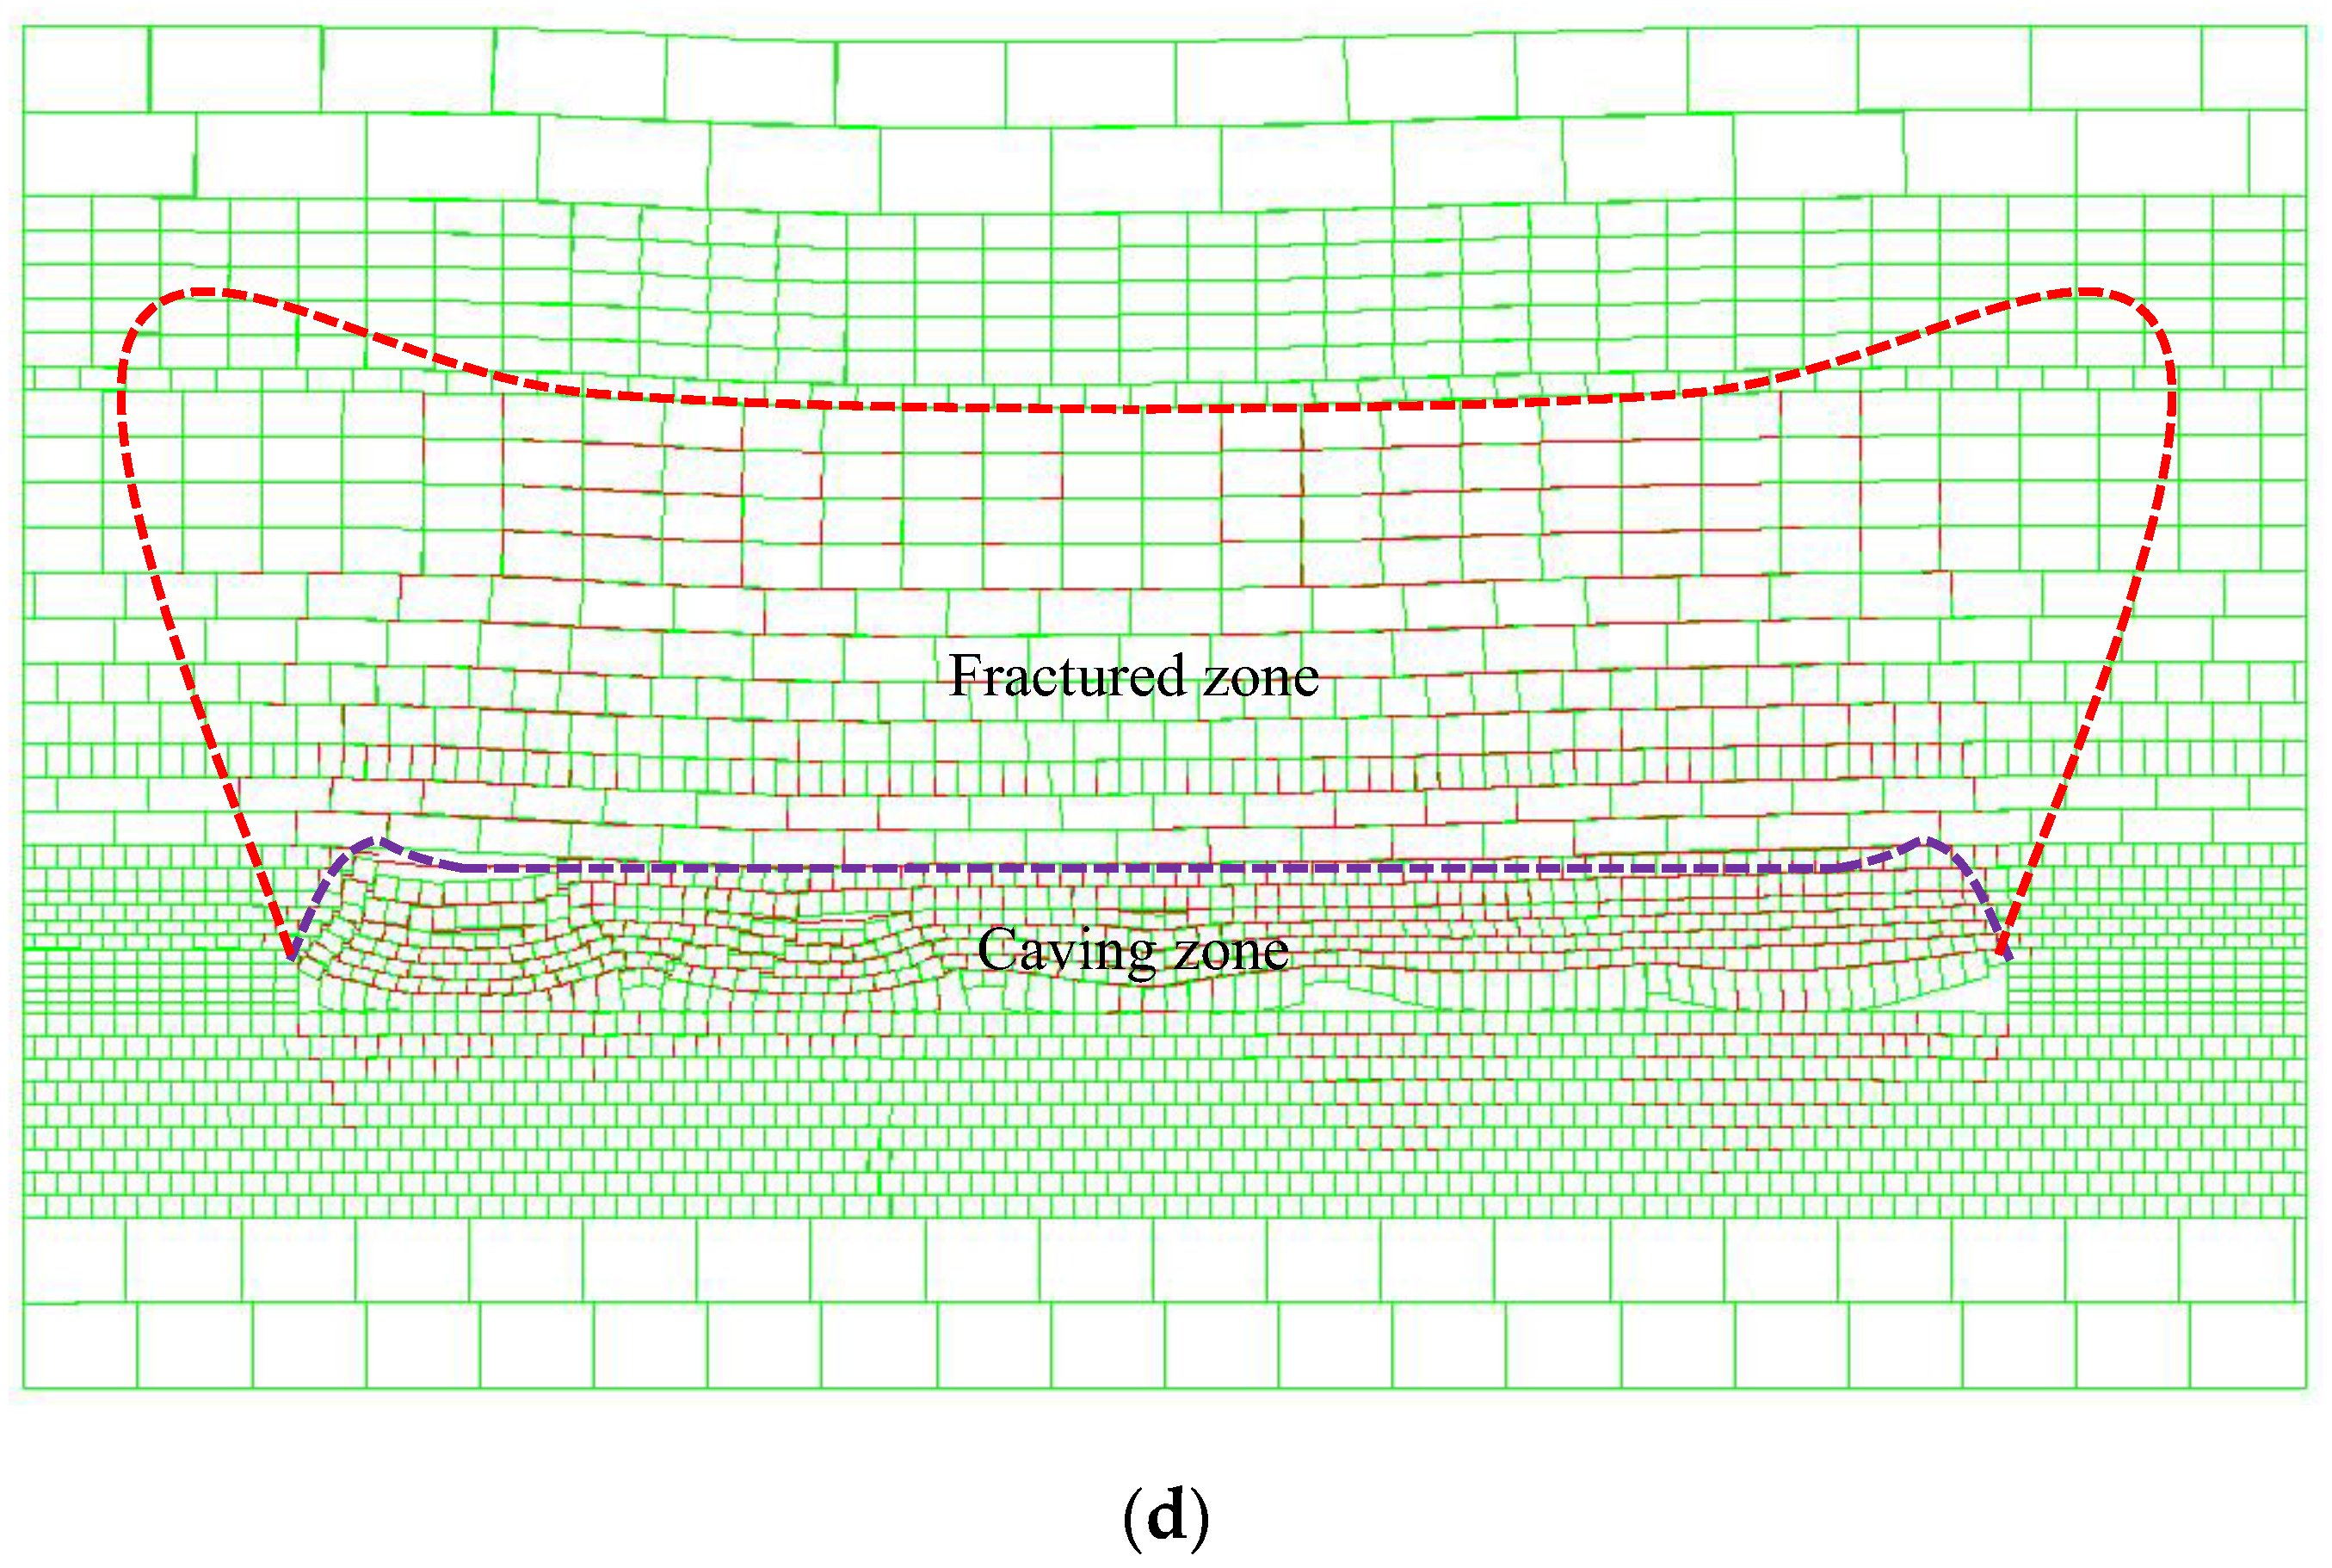
  • After the coal seam is mined, the basic roof and overlying strata move, which further leads to the collapse of the strata and forms the collapse zone. The overlying strata move upward and continue to transmit to form the delamination cracks and vertical fracture cracks, and the delamination cracks occur between the strata. With the advancing of the working face, the height of the caving zone is basically stable at about 15~18 m. The height of the fracture zone increases first and then stabilizes, and the broken fracture is formed by the fracture of the rock stratum. With the advancing of the working face, it continues to increase in the extension direction, and the height increases first and then stabilizes.
  • The location of the working face and the location of the open cut are affected by the hinge function and load transfer function of the roof rock, and the roof rock below is not completely compacted, showing a natural accumulation state, with a large amount of void space, which can be used as the space for slurry filling, and it is about one periodic weighting step away from the working face. However, with the advancing of the working face periodically, the hinge characteristics of overlying rock and the load transfer characteristics change, and the rock blocks below are constantly compacted, resulting in the phenomenon of decreasing void space. The length period from the area to the working face is about two to three periodic weighting steps.

4.3. Analysis of Roof Displacement and Bulking Coefficient Characteristics

In order to further analyze the distribution of roof displacement and the characteristics of the goaf bulking coefficient, the roof displacement data of different strata when the working face advances 300 m are derived, as shown in Figure 6.
The state in which the caved rock mass volume in the goaf is significantly larger than that before caving is called dilatability, which is usually expressed by the bulking coefficient
k = V V
where k is the bulking coefficient of caved rock, V′ is the volume of caved rock mass, and V is the volume of pre-caving rock mass.
It can be seen from the working face mining simulation test results that the displacement of overlying rock is mainly in the form of vertical subsidence, and the volume change is mainly along the vertical direction. Therefore, the bulking coefficient of caved rock mass in the goaf can be approximately replaced by the vertical bulking coefficient of rock mass—that is, the distance ratio before and after mining between two adjacent measuring points in the vertical direction of the model:
k k c = h n ~ n + 1 h n ~ n + 1
where kc is the vertical bulking coefficient of caving rock mass, h n ~ n + 1 is the distance between two adjacent measuring points before mining, and h n ~ n + 1 is the distance between two adjacent measuring points after mining.
According to the displacement data of each stratum, the bulking coefficient from different heights to the coal floor can be obtained, as shown in Figure 7.
As can be seen from the figure:
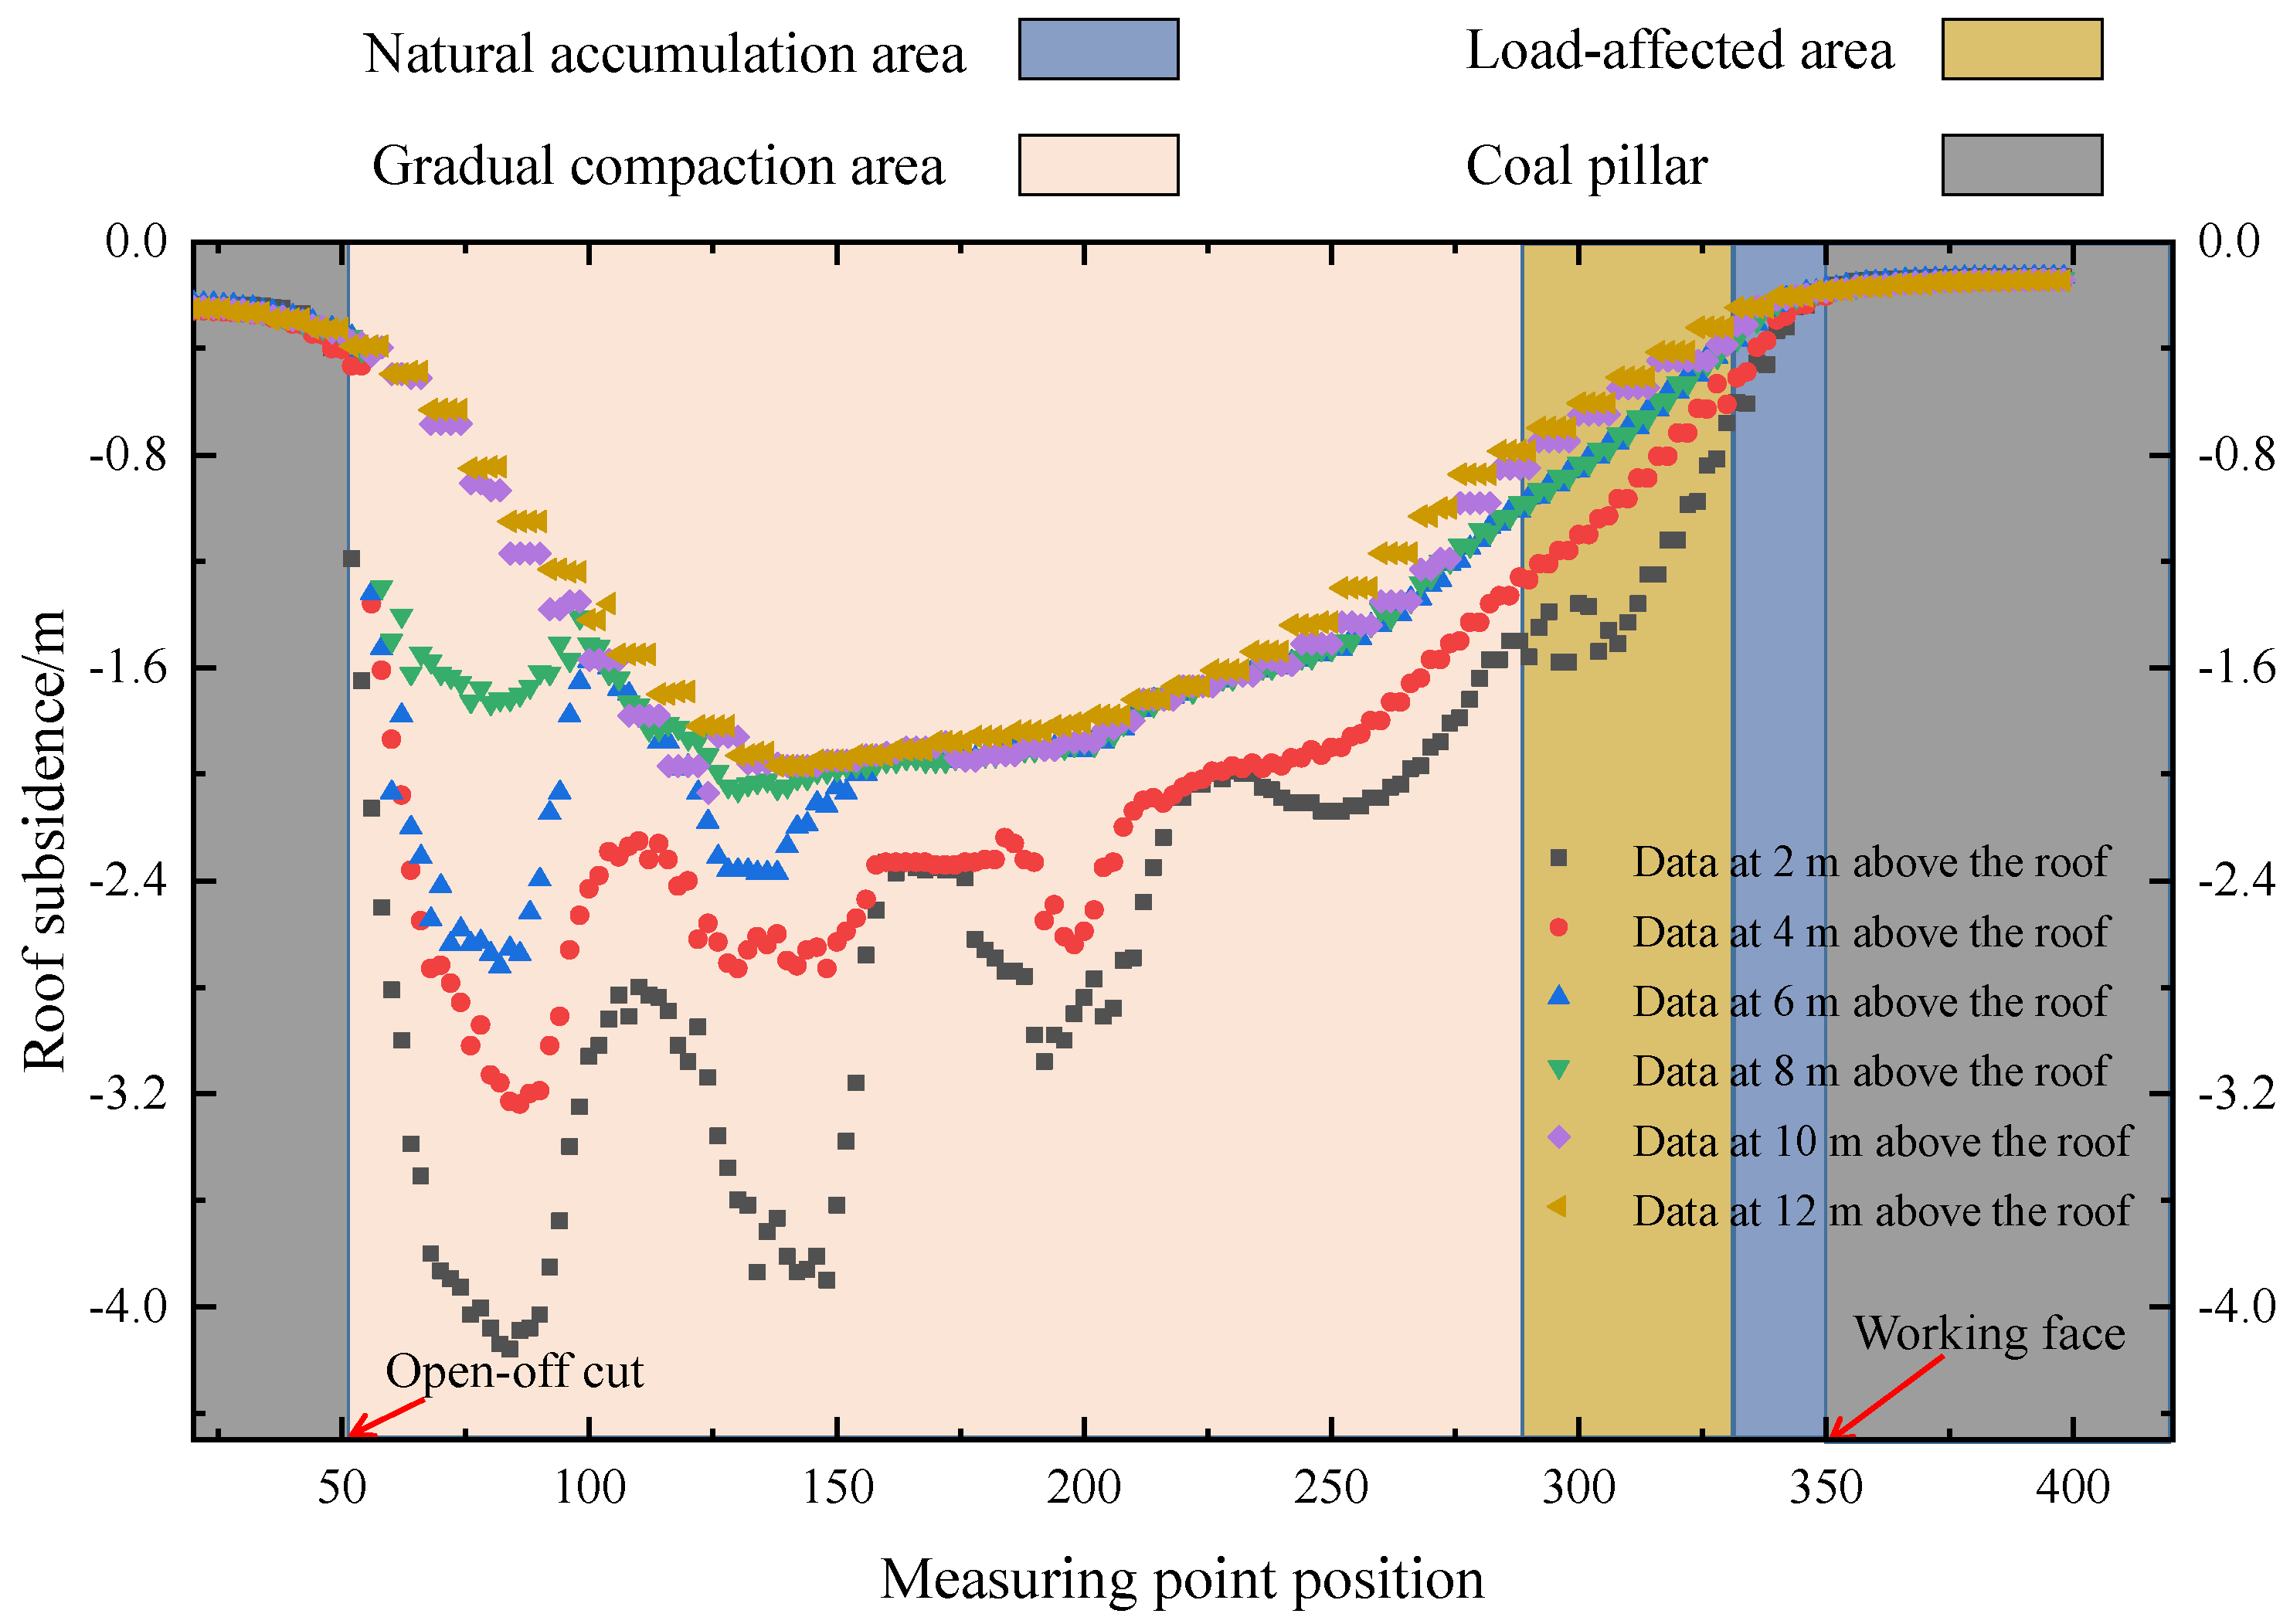
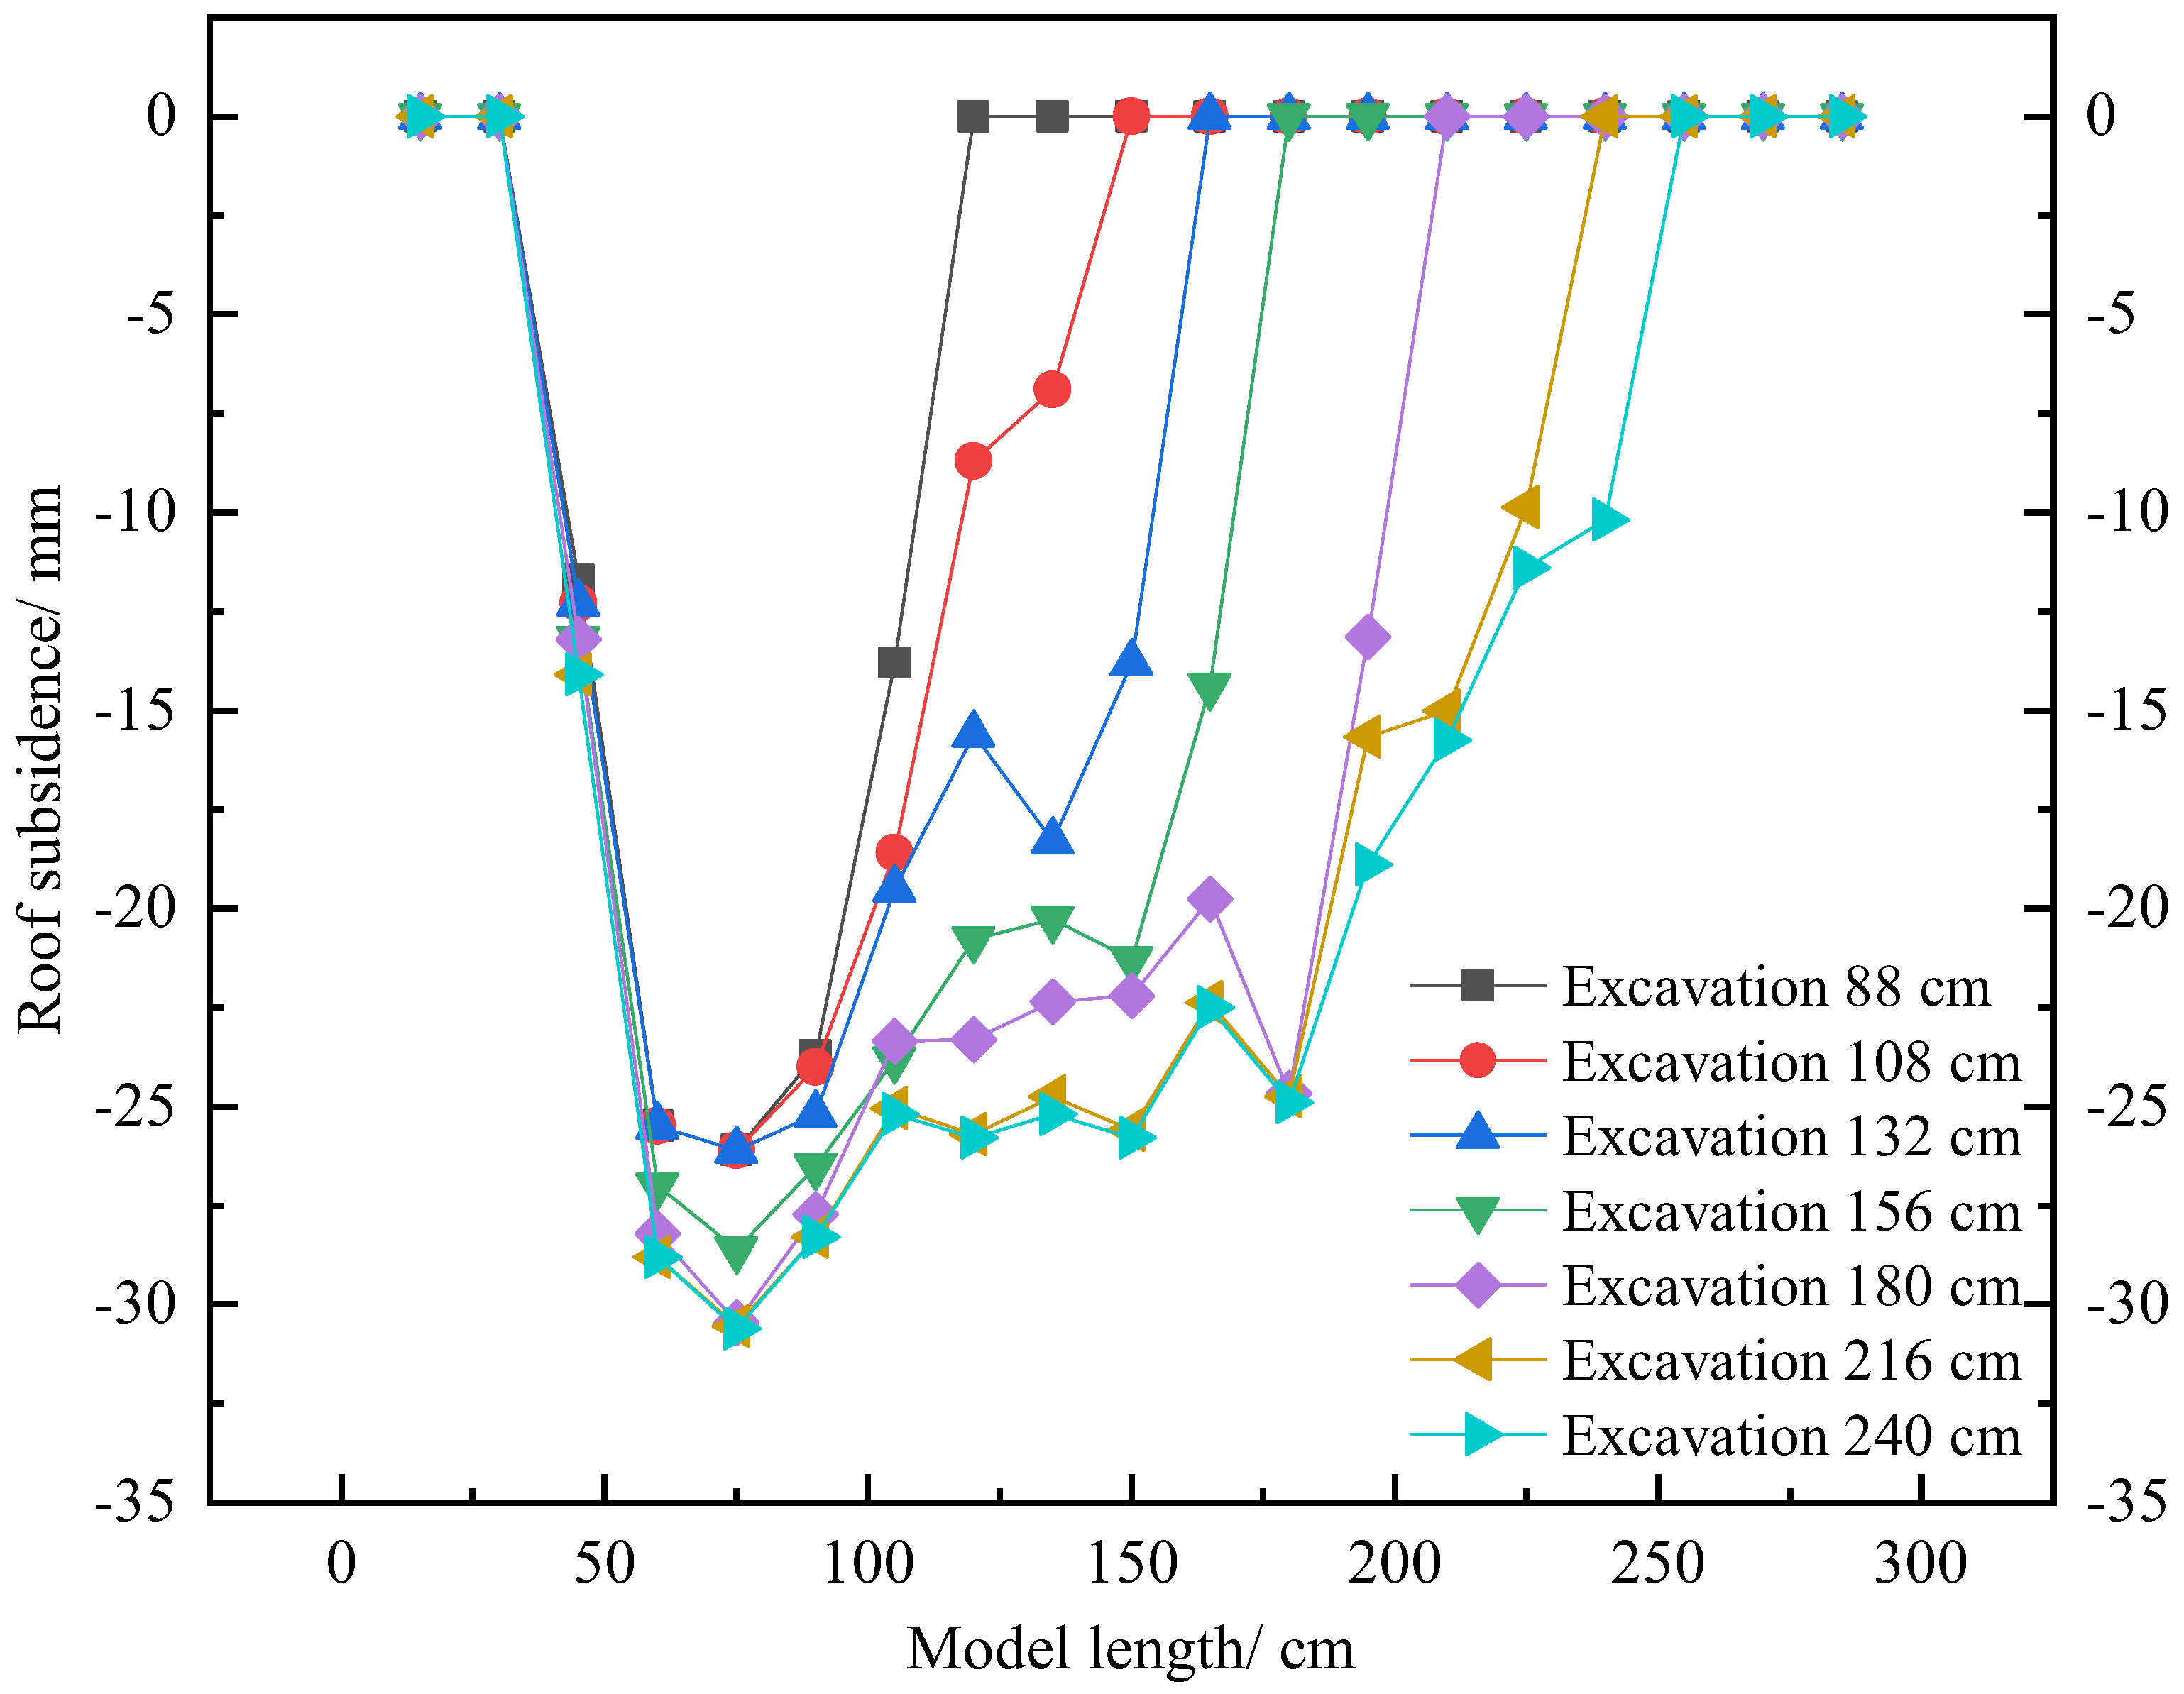
  • The subsidence of the roof above the coal seam is 2.0 m > 4.0 m > 6.0 m > 8.0 m > 10.0 m > 12.0 m. This is because after the coal seam is mined, the roof strata collapse from bottom to top, and gradually weaken during the upward transmission of overlying strata. Layers and gaps will appear between the strata and between rock blocks. This phenomenon is also the realization feature of rock fragmentation, which further leads to the gradual decrease in the subsidence of the upper strata, which becomes stable.
  • In the advancing direction of the working face, the displacement of the roof near the working face is significantly smaller than that far from the working face. This is due to the change in the load transmission and hinge relation of the rear rock stratum during the periodic advancing process of the working face, which leads to the continuous compaction of the gangue in the rear goaf, the continuous reduction in the crushing bulking coefficient, and further leads to the increase in the roof displacement.
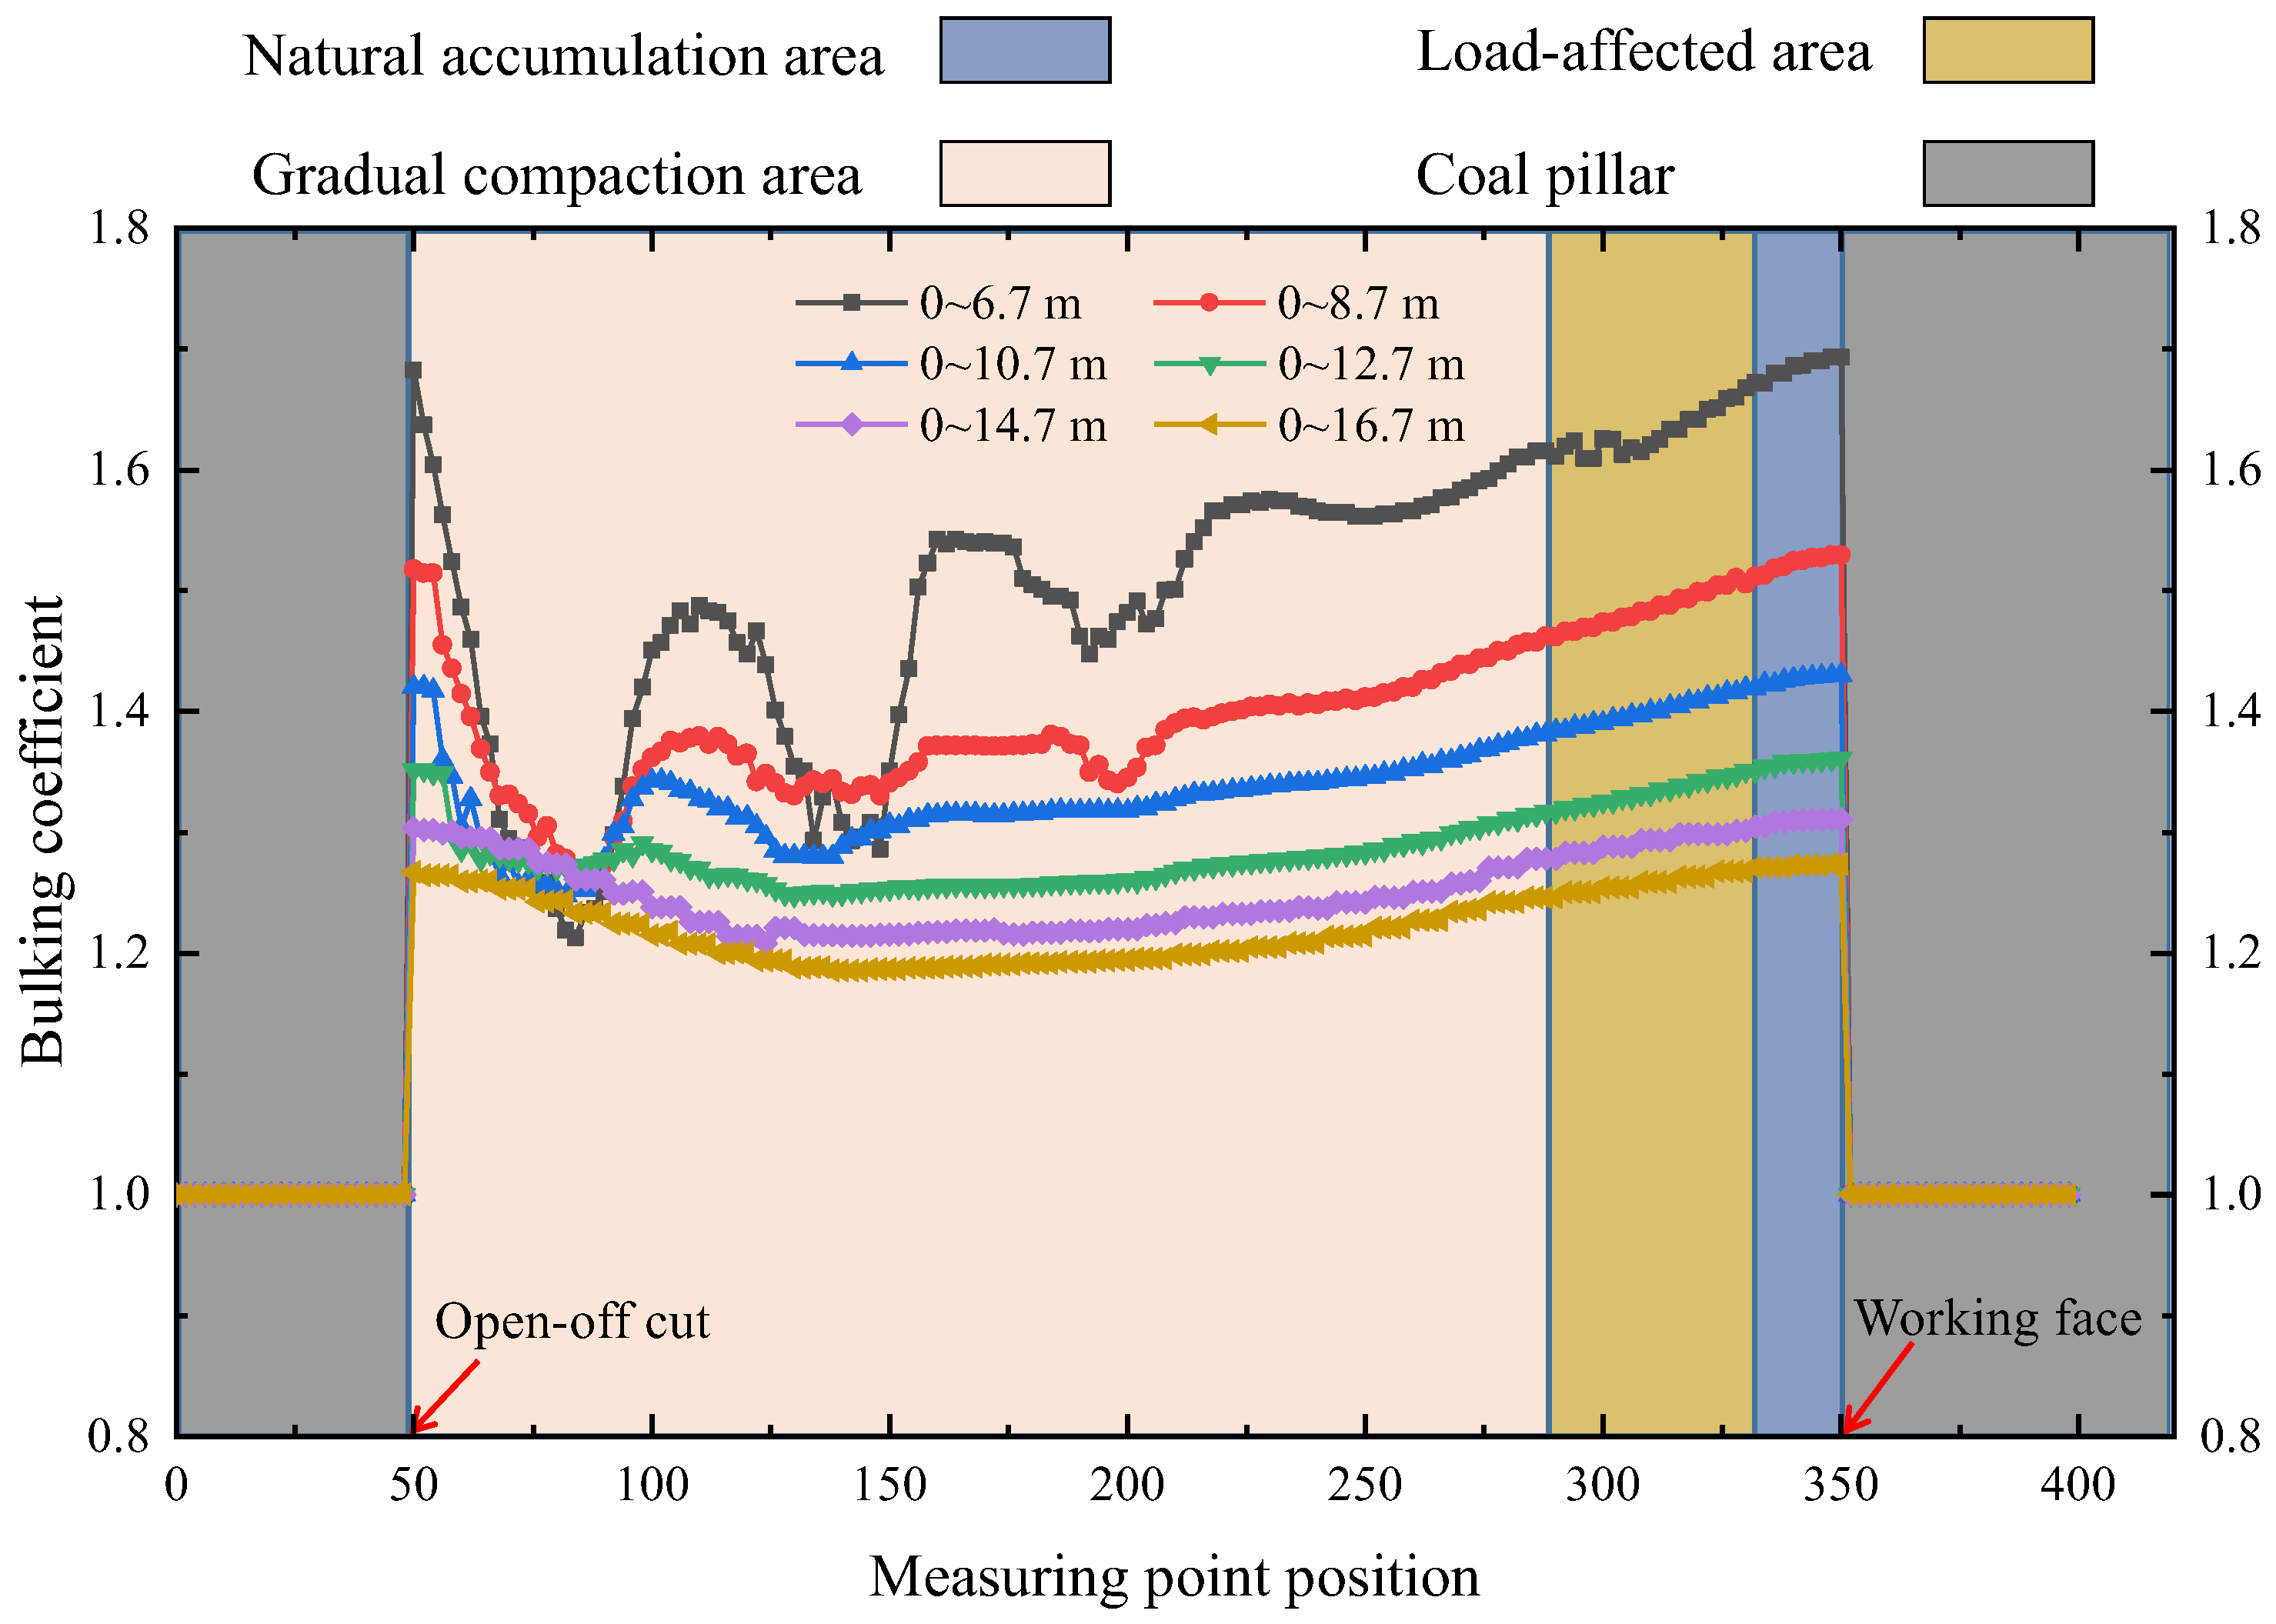
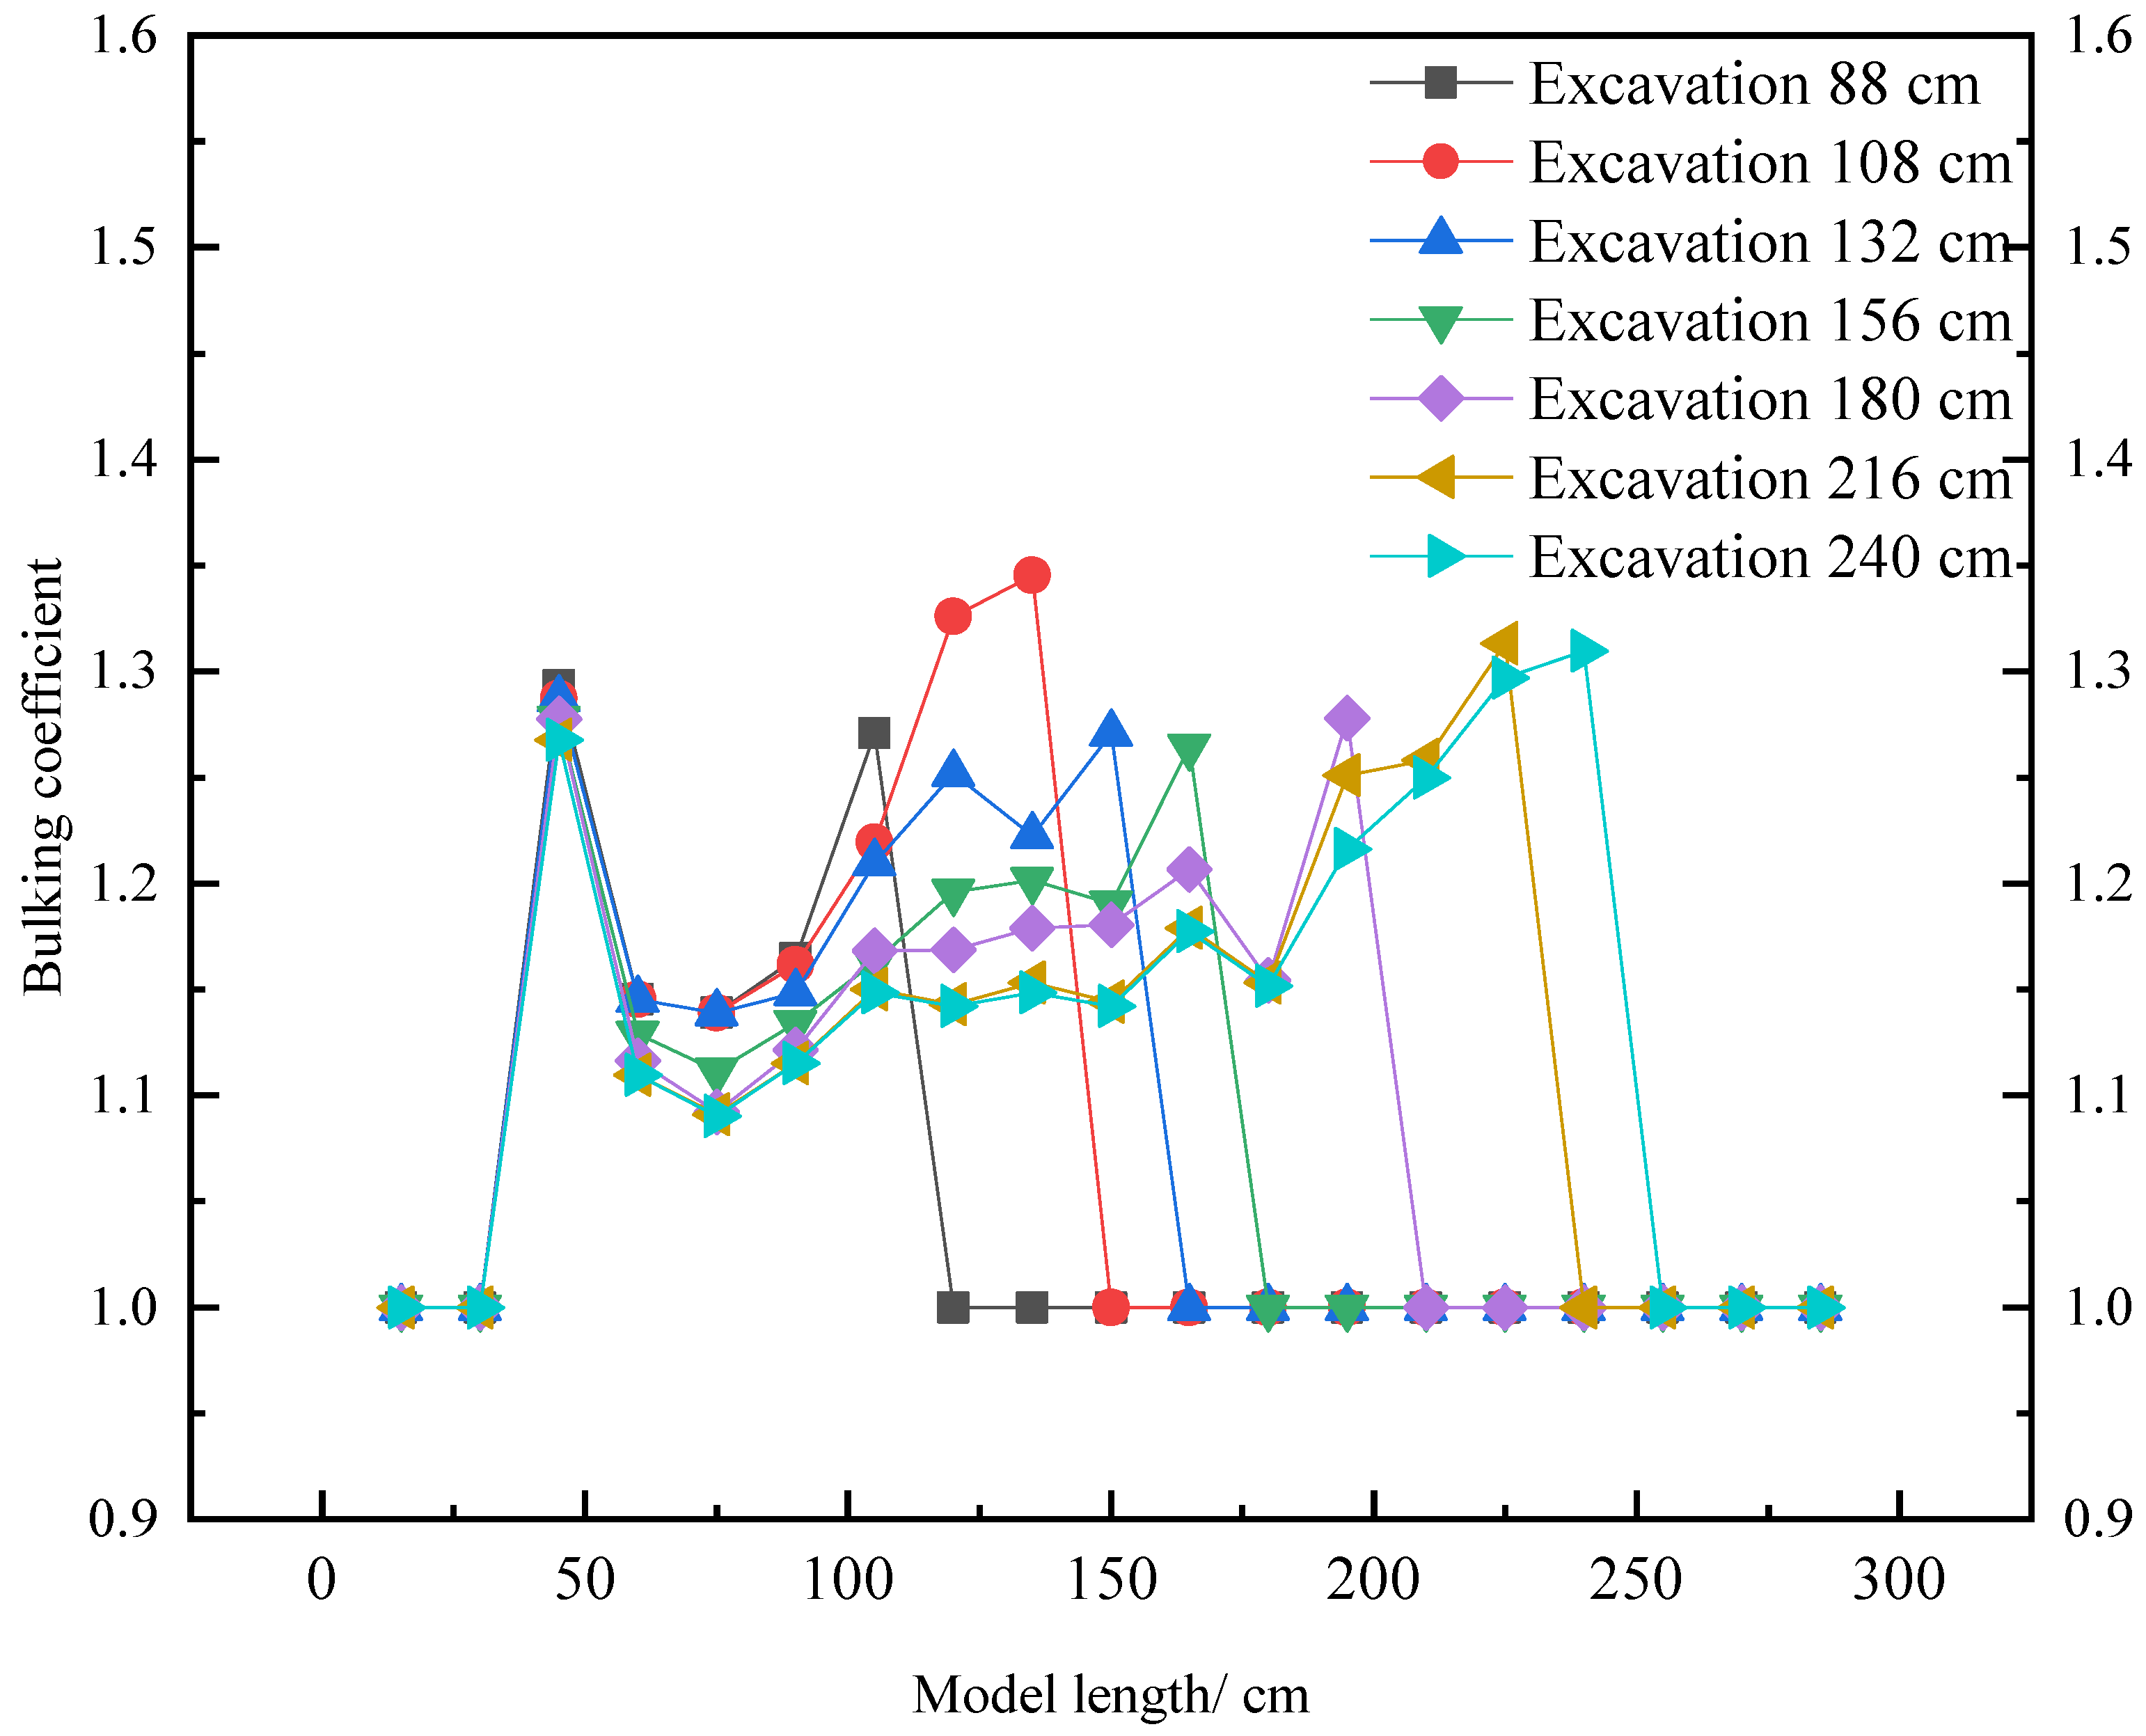
  • In the vertical direction of the same area of the stope, with the increase in the height range, the value of the bulking coefficient decreases continuously, and the decreasing range decreases continuously. This is because, in the vertical direction, the rock stratum near the coal floor breaks most violently, and the pores between the rocks are the largest, which leads to a higher bulking coefficient. Therefore, the average bulking coefficient in the vertical direction will decrease continuously.
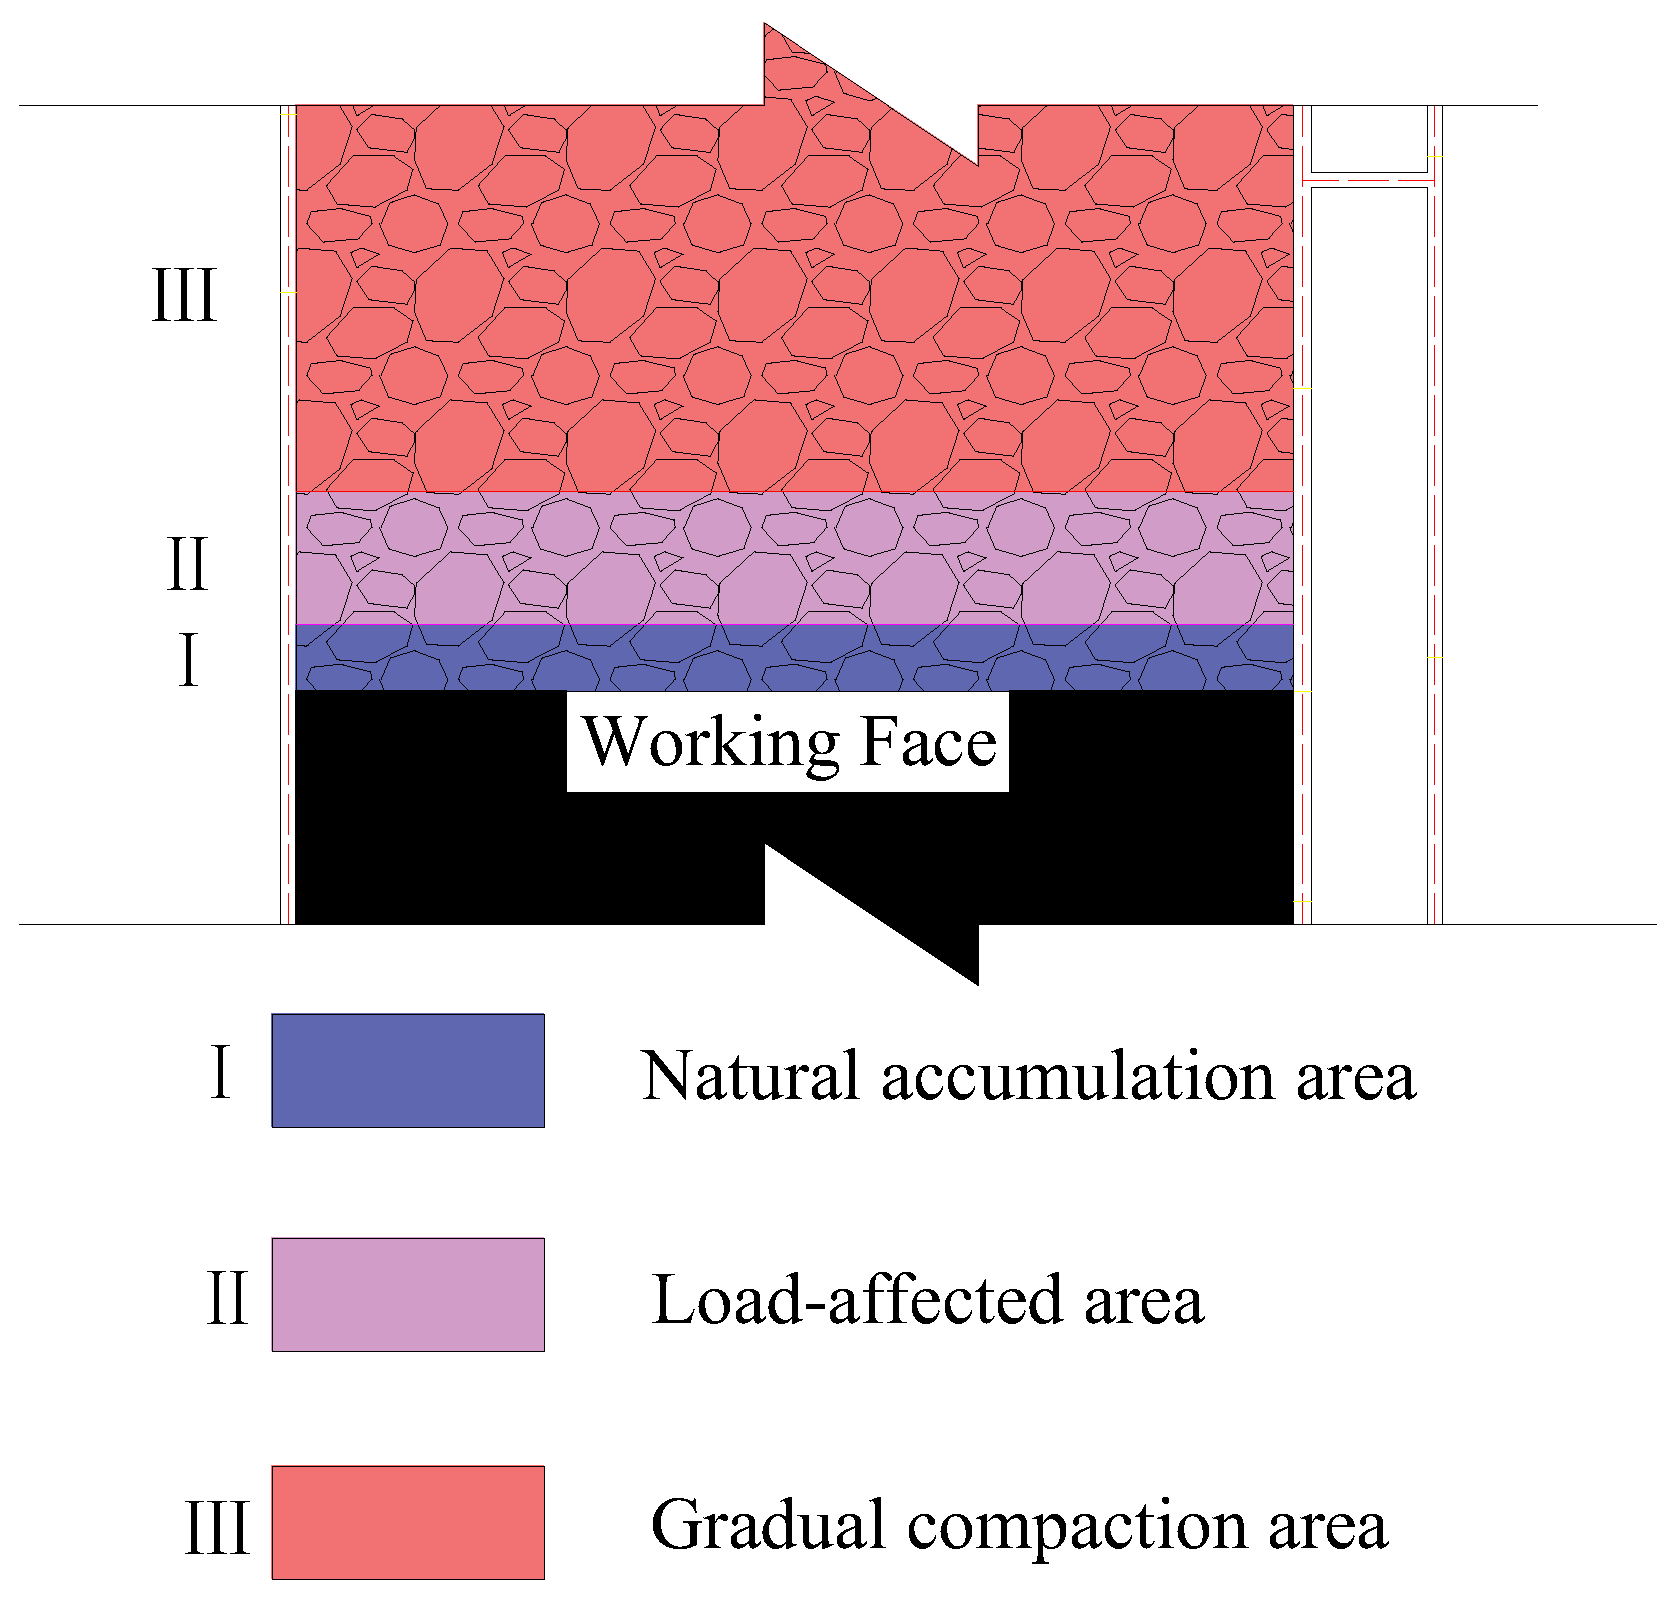
  • In the advancing direction of the working face, with the increase in the length from the working face, the bulking coefficient decreases continuously, and presents certain zoning characteristics, especially in the range of 0~6.7 m in the height direction. It can be divided into three areas, namely the natural accumulation area, the load-affected area and the gradually compacted area. According to the distribution characteristics of the crushing bulking coefficient, the natural accumulation area moves forward periodically with the advancing of the working face, and its length is about one weighting step, while the crushing bulking coefficient within the caving zone is about 1.3. The length of the affected zone is about two to three weighting steps, and the bulking coefficient in the caving zone is about 1.25. The rear area is the compacted area, and the bulking coefficient is about 1.2, and the residual bulking coefficient is 1.15 as the working face continues to advance.

5. Similarity Simulation Analysis of Overburden Breaking and Bulking Coefficient Characteristics in Stope

5.1. Experimental Design

5.1.1. Similarity Criterion

The similarity conditions include geometric similarity, constitutive similarity of the deformation and failure process of mining rock and soil mass, the similarity of single-value conditions, and similarity criteria determined by dimensionless parameters [34].
These similarity conditions are determined by the physical and mechanical parameters, geometric size, unit weight, movement time, movement speed, gravity acceleration, properties of rock and soil layer (strength, elastic modulus E, cohesion c, internal friction angle φ, etc.) and force, which are related to the deformation and failure process of rock mass.
According to the occurrence conditions of the overburden in the area and the size parameters of the laboratory model frame, the plane stress model is determined for this physical simulation experiment. The geometric similarity ratio of the model is 1:120, and therefore:
Geometric similarity condition:
α 1 = l m l p = 1 120
Gravity similarity condition:
α γ = γ m γ p = 2 3
Similarity conditions for gravitational acceleration:
α g = g m g p = 1 1
Time similarity condition:
α t = t m t p = α 1 = 1 11.4
Velocity similarity condition:
α v = v m v p = α l = 0.0913
Displacement similarity condition:
α s = α 1 = 1 120
Similarity conditions for strength, elastic modulus and bond force:
α R = α E = α C = α 1 α γ = 1 195
Internal friction angle similarity conditions:
α ϕ = R m R p = 1 1
Force similarity condition:
α f = f m f p = α g α γ α l 3 = 0.385 × 10 6
According to the occurrence conditions of overburdened rock in this area and the size parameters of the laboratory model frame, the plane stress model is adopted in this physical simulation experiment, and the geometric size of the model is 3.0 m × 1.5 m, as shown in Figure 8. The geometric similarity ratio of the model is 1:120; the gravity similarity ratio is 1:1.5; the time similarity ratio is 1:11.4; and the speed similarity ratio is 1:10.95.

5.1.2. Scheme of Similar Materials

The physical and mechanical parameters of similar materials were calculated according to the physical and mechanical properties and strength similarity ratio of each rock layer in the geological column chart.
The calculation method is:
[ R C ] m = α R · [ R C ] P ;   [ R t ] m = α R · [ R t ] P
According to the calculated physical and mechanical parameters of similar materials, the material that is close to them is found in the ratio table as similar material to this rock formation. At the same time, similar materials are established according to the determined proportion, and a strength test is conducted for strength verification [35,36].
The proportioning experiment is the basis of similar material simulation, which needs to be repeated. Because of the different sources of raw materials, there are differences in performance, and the actual strength of the selected similar materials may be different from the value in the ratio table. If there is any error, it is necessary to adjust the ratio of material composition to ensure that similar materials meet the requirements of mechanical similarity.
The similar materials selected for the model mainly include river sand, gypsum, white powder, etc. Mica powder is evenly sprinkled as the weak surface of the layer during the laying of the model. The proportion of each rock stratum is determined according to the similarity theory and strength test results.
The specific matching scheme of similar materials is shown in Table 2.

5.1.3. Experimental Process

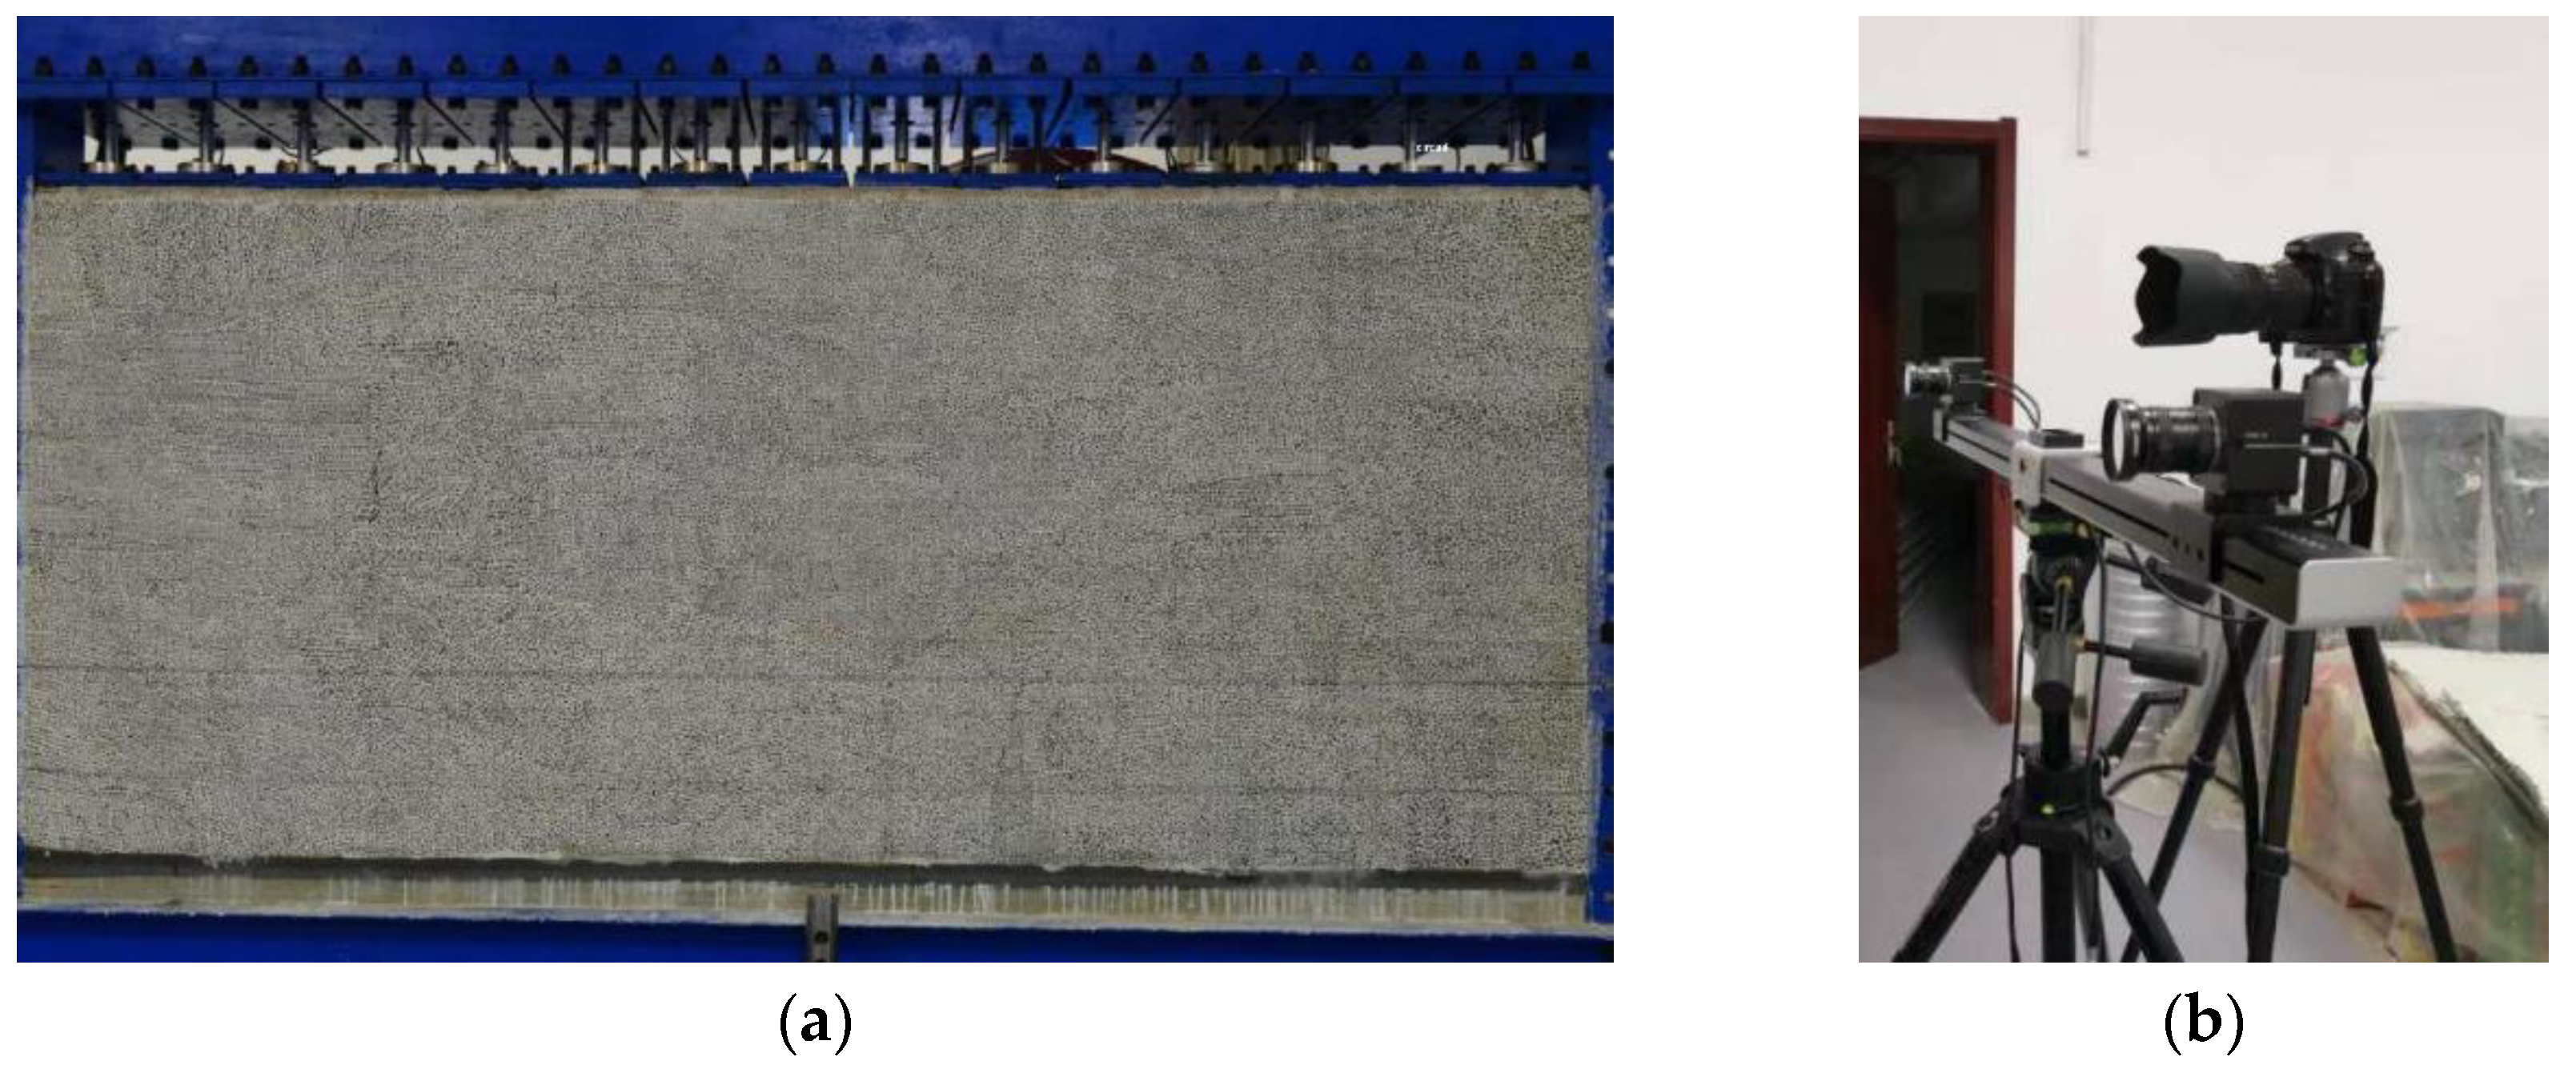
  • A physical simulation experiment simulated the overlying strata thickness of the coal seam (175 m), the total depth of the coal seam (622 m), and the remaining 447 m. After stress conversion, the uniform applied force was loaded at the top of the model through the top loading device. The loading system was divided into: a cylinder loading system, a tilt adjustment system, a hydraulic control system and an intelligent operating system.
  • Considering the influence of the model boundary effect, a boundary protection coal pillar of at least 25 cm was set on the left and right sides of the model.
  • The excavation was carried out from the left side of the model to the right side, with each excavation of 2 cm and the length of the model being 250 cm (with the actual working face length being 300 m).
  • After the excavation was completed, we analyzed the monitoring data.

5.2. Analysis of Failure Characteristics of Mining Overburden

Five typical stages in the excavation process of similar model were selected to analyze the failure characteristics of mining overburden, as shown in Figure 9.
It can be seen from the figure that the failure characteristics of mining overburden are as follows:
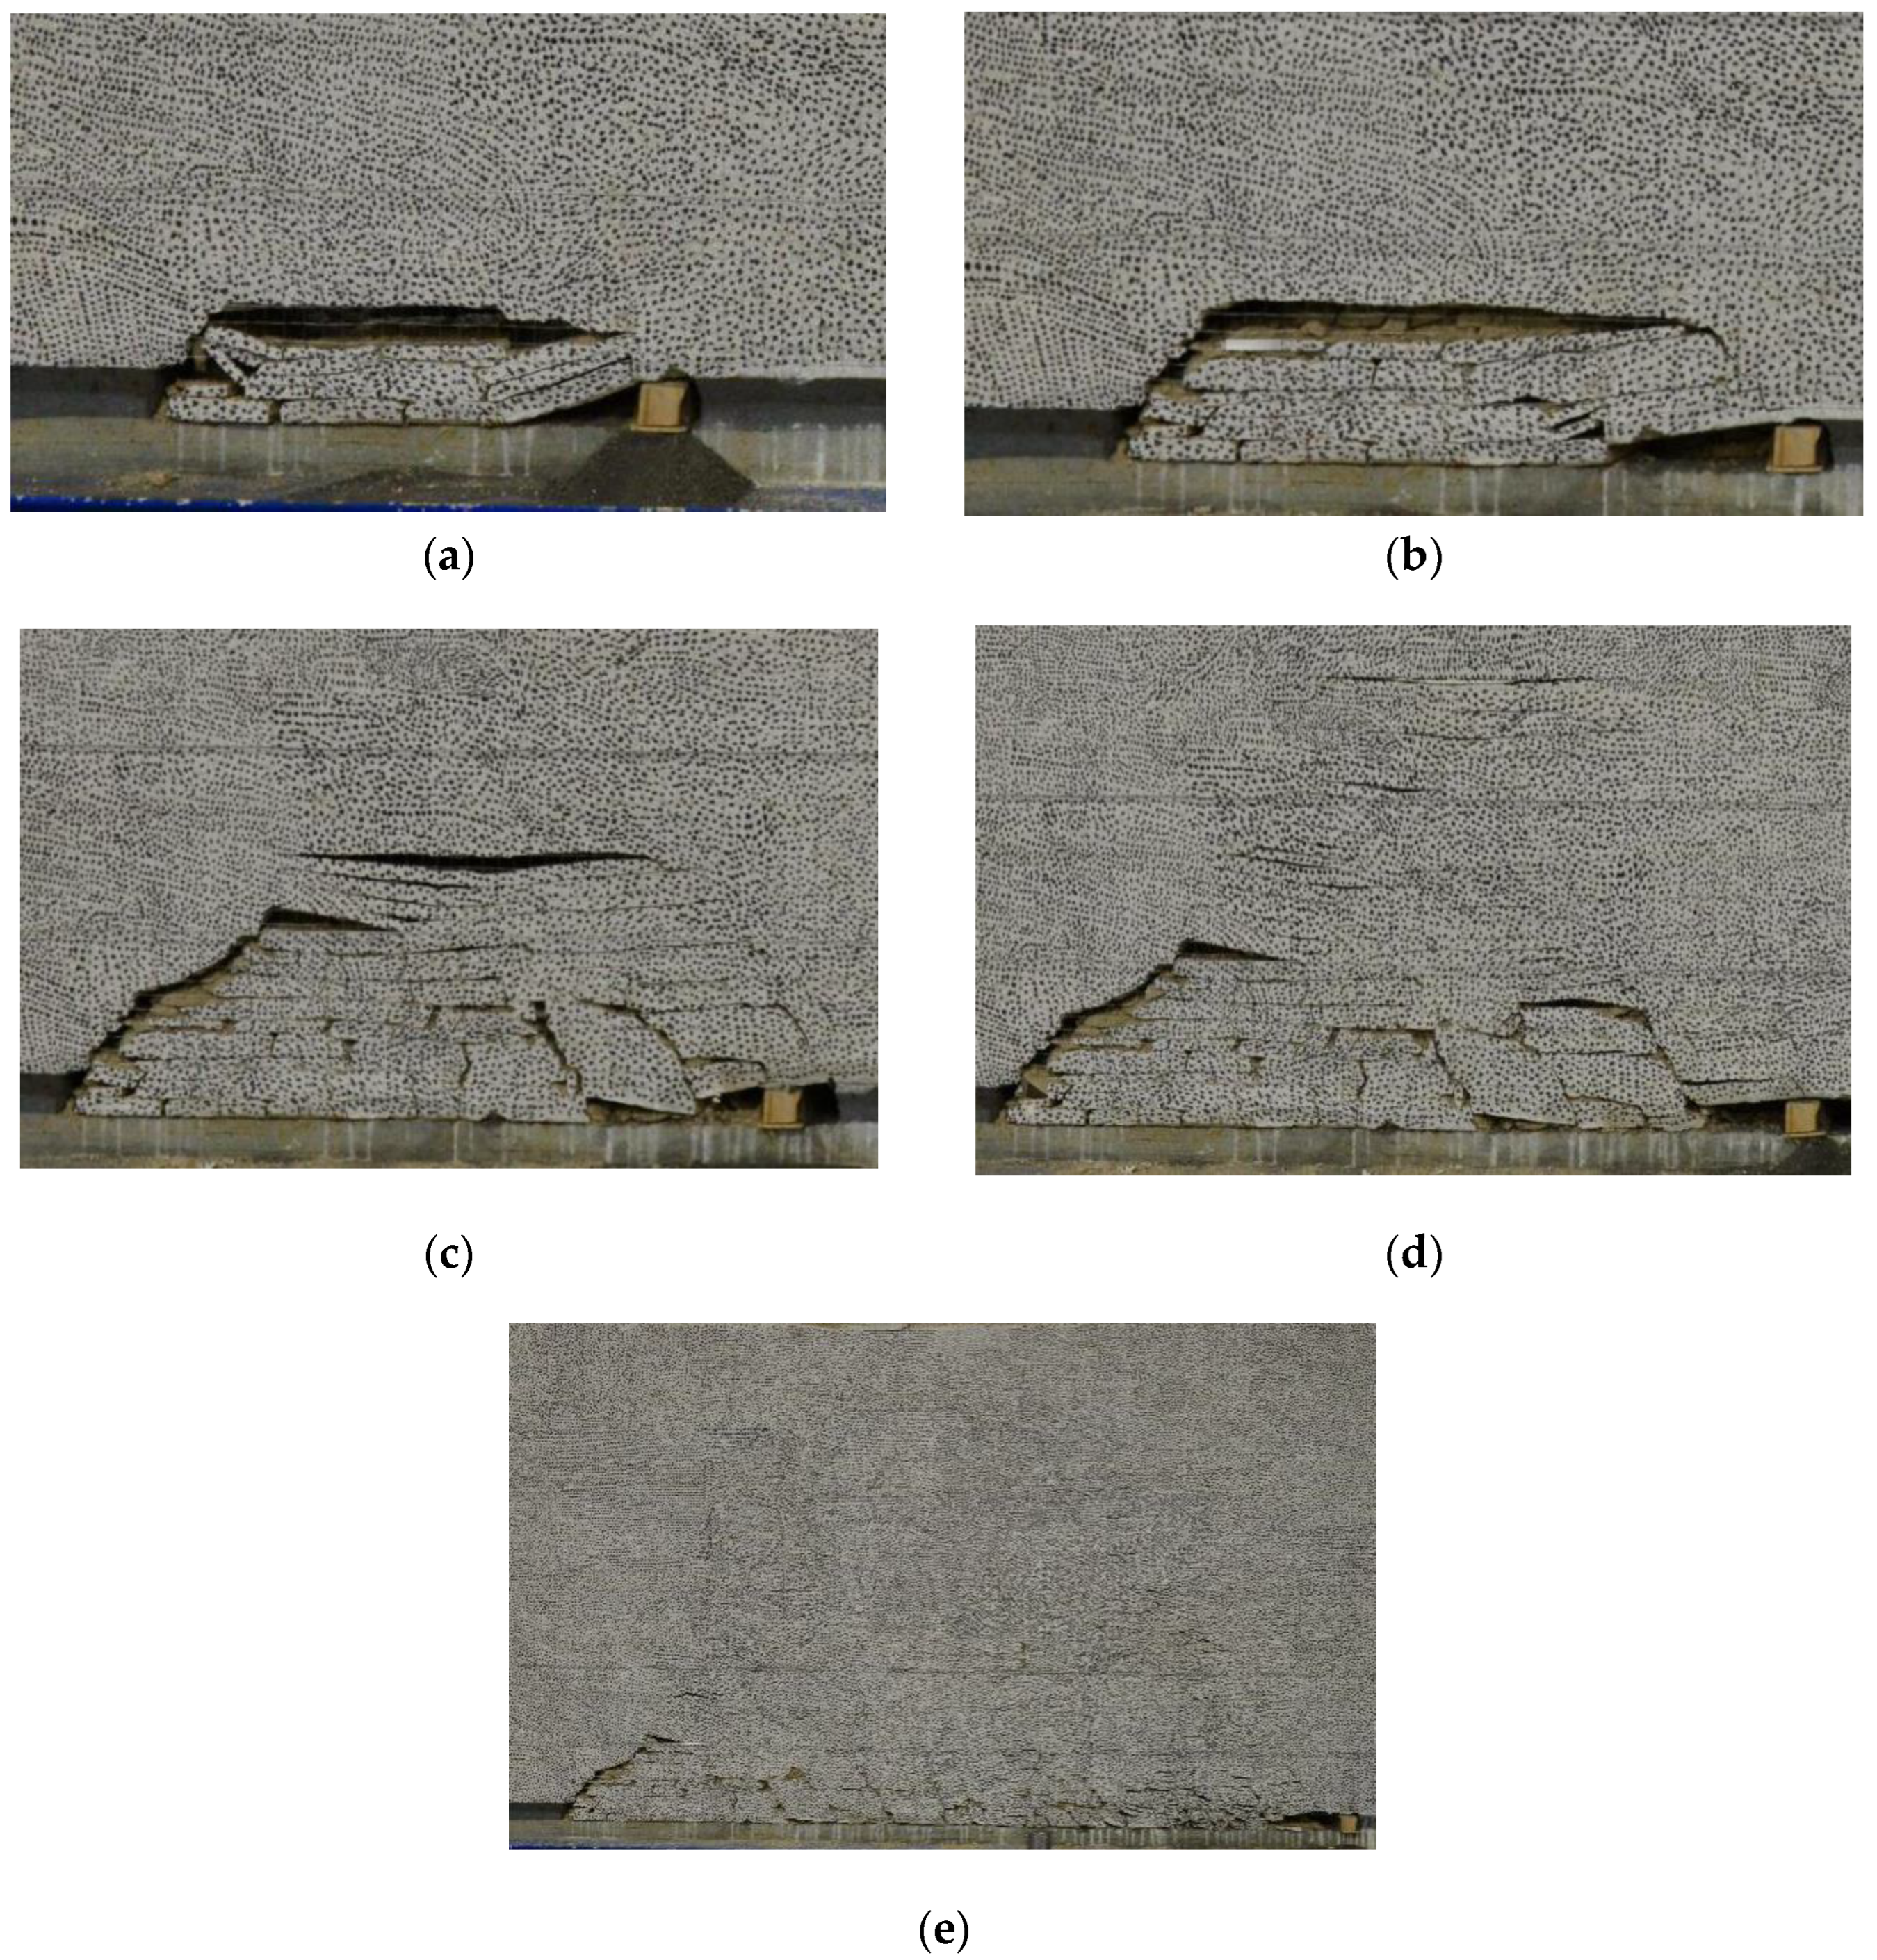
  • When the working face advances 30 cm (36.0 m), the basic roof collapses in a large area, and the collapsed rock mass does not form a regular hinged structure, which is the first weighting of the basic roof. The caving height is 12.6 cm (10.5 m), the fracture zone height is 19 cm (22.8 m), the first weighting step is 36.0 m, the caving angle at the main roof cut is 65, and the caving angle at the coal wall is 55.
  • When the working face advances 46 cm (55.2 m), the basic roof collapses for the first time, with a caving step of 16 cm (19.2 m), a caving height of 11.4 cm (13.66 m), and a maximum separation distance of 2.6 cm (3.12 m). Micro-cracks appear in the upper strata, and obvious articulated structures are formed in the roof strata.
  • When the working face advances 62 cm (74.4 m), the basic roof collapses in the second cycle, with a caving step of 16 cm (19.2 m), a caving height of 16.5 cm (19.8 m) and a maximum separation distance of 2.6 cm (3.12 m).
  • When the working face is pushed 80 cm, it basically collapses in the third cycle, with the caving step distance of 18 cm (21.6 m) and the maximum caving height of 15.83 cm (19.0 m), and the maximum caving position is located obliquely above the working face. As the working face keeps pushing the rock strata to move, some separation layers close again, and the caving height is basically stable at 15 cm (18.0 m).
  • As the working face continues to advance, the overlying strata in the mining face are more clearly divided, and the rock mass under the fracture zone is highly broken and articulated, which has the basic conditions for slurry filling.

5.3. Analysis of Roof Displacement and Bulking Coefficient Characteristics

According to the above analysis, with the continuous advancement of the working face, the rock stratum moves continuously, and some separated layers are re closed, and the caving height is basically stable at 15 cm (18.0 m). The siltstone with a thickness of 16.8 m at 18.0 m above the coal seam is taken as the monitoring object. When the working face is mined to 88 cm, 108 cm, 132 cm, 156 cm, 180 cm, 216 cm and 240 cm, respectively, the corresponding subsidence curves of roof rock are shown in Figure 10, and the bulking coefficient curves are shown in Figure 11.
It can be seen from the figure that, according to the test data of the crushing bulking coefficient of different excavation times, it can be found that with the evolution of the spatial structure of the overlying strata in the goaf, the three zones of the caving zone show dynamic changes, and the natural accumulation zone moves forward periodically with the advancing of the working face. Because of the differential compaction degree of the goaf, the gangue forms three transverse zones in the caving zone space of the goaf, which can be divided into the natural accumulation zone, the load-affected zone and the gradually compacted zone according to the distance from the working face.
According to the distribution law of the crushing bulking coefficient, the natural accumulation area is distributed near the mining face, and its length is about one weighting step, with the largest crushing bulking coefficient. The load area is located behind the natural accumulation area, which changes with the evolution of the large spatial structure, and its length is about two to three weighting steps. The gradually compacted area is located behind the load-affected area, and in the gradually compacted area, the bulking coefficient decreases with the distance from the working face.

6. Strike Zoning of Goaf and Optimization Effect of Lag Distance

6.1. Goaf Strike Zoning Based on Bulking Coefficient

The caving zone of goaf is the key area of slurry filling research, and the space between rocks in this area is large, which can be used as then slurry filling space. By analyzing the results of numerical simulation and similar simulation tests, the division of the working face in the strike direction is obtained, as shown in Figure 12.
Among them, Area I (natural accumulation area) is 0~20 m behind the working face, Area II (load-affected area) is 20~70 m behind the working face, and Area III (gradual compaction area) is 70 m behind the working face. According to the previous analysis results, the bulking coefficient in area I and area II is about 1.25~1.4, and it gradually decreases after entering area III.

6.2. Lag Distance Optimization Effect

According to the distribution law of the bulking coefficient, the grouting difficulty in Area I (natural accumulation area) is the lowest, but it is only 0~20 m away from the working face. According to the previous construction experience, it is easy for slurry to overflow to the working face. Therefore, in order to ensure the single-hole filling amount of adjacent grouting holes and reduce the amount of drilling construction, grouting should be started when adjacent grouting holes are located in area II as far as possible, and the void space in goaf should be fully utilized. Therefore, a lag distance of 40 m was determined at first, and the field application was carried out according to this parameter. However, the slurry overflowed during the filling process, and continuous grouting could not be realized.
Therefore, according to the lag distance optimization method, we increased the lag distance to 60 m, and then carried out field application. There was no slurry overflow in the filling process, and the flow rate in the filling process was stable. The overall effect of adjacent grouting filling is good, as shown in Figure 13.

7. Conclusions

  • This paper systematically examines various gangue filling technologies and their development history, and expounds the technical background and scientific connotations of slurry filling. The definition of the lag distance of slurry filling and the importance of reasonably determining this parameter for ensuring the filling effect are clarified, and the determination method of the lag distance of gangue slurry based on the dilapidation of goaf is established.
  • After the coal seam is mined out, the roof subsidence gradually decreases from bottom to top, and finally becomes stable. Because the roof rock stratum collapses, and the overburden movement gradually weakens in the process of upward transmission, there will be separation layers and gaps between rock strata and between rock blocks, and the bulking coefficient of rock strata will lead to the continuous reduction in the subsidence of the upper rock strata.
  • The distribution law of the crushing bulking coefficient is in the advancing direction of the working face. With the increase in the distance from the working face, the bulking coefficient decreases continuously, and presents certain zoning characteristics, especially in the range of 0~6.7 m in the height direction. It can be divided into three areas, namely the natural accumulation area, the load-affected area and the gradual compaction area.
  • Based on the comprehensive numerical simulation and similar simulation results, the natural accumulation area is 0~20 m behind the working face, the load-affected area is 20~70 m behind the working face, and the gradual compaction area is 70 m behind the working face. Combined with the field application, the lagging distance is determined to be 60 m, and the grouting and filling effect at the adjacent site is good.

Author Contributions

Conceptualization, W.G. and K.G.; Methodology, T.S.; Software, F.Q.; Validation, W.G. and K.G.; Formal analysis, T.S.; Investigation, W.L. and P.X.; Resources, W.L.; Data curation, W.L.; Writing—original draft preparation, T.S.; Writing—review and editing, T.S.; Visualization, physical similarity simulation experiment, W.G. and K.G. All authors have read and agreed to the published version of the manuscript.

Funding

This research was funded by the National Natural Science Foundation of China (No. 52174127, 51974226), the Key Research and Development Program of Shaanxi (No. 2023-YBGY-318), the Youth Innovation Team of Shaanxi University, the Research Fund of Henan Key Laboratory for Green and Efficient Mining & Comprehensive Utilization of Mineral Resources (Henan Polytechnic University, No. KCF202001) and the Research Fund of Shaanxi Key Laboratory of Coal Mine Water Disaster Prevention and Control Technology (No. 2020SKMS02).

Data Availability Statement

Relevant data are listed in the paper.

Conflicts of Interest

The authors declare no conflict of interest.

References

  1. Zhang, J.; Ju, Y.; Zhang, Q.; Ju, F.; Xiao, X.; Zhang, W.; Zhou, N.; Li, M. Low ecological environment damage technology and method in coal mines. J. Min. Strata Contr. Eng. 2019, 1, 13515. [Google Scholar]
  2. Fan, Y.; Lu, Z.; Cheng, J.; Zhou, Z. Major ecological and environmental problems and the ecological reconstruction technologies of the coal mining areas in China. Acta Ecol. Sin. 2003, 23, 2144–2152. [Google Scholar]
  3. He, Y.; Ye, X.; Wang, Z. Consideration on the 13th Five Year Plan of Coal Industry. Coal Econ. Res. 2015, 35, 6–8. [Google Scholar]
  4. SONG, T. Study on Geochemical Characteristics and Heavy Metal Element Migration of Coal Gangue Backfilling Material; China University of Mining and Technology: Beijing, China, 2019. [Google Scholar]
  5. Song, T.; Huang, Y.; Zhang, J.; Li, J. Numerical simulation on migration effects of heavy metal elements in coal gangue backfilling body caused by the lithology of coal seam floor. J. China Coal Soc. 2018, 43, 1983–1989. [Google Scholar]
  6. Yang, D.L.; Li, J.M.; Huang, Y.L.; Gao, H.; Qiao, M. Research on Migration Law of Mn in Mudstone Floor in the Goaf under Coupling Conditions of Seepage and Stress. Pol. J. Environ. Stud. 2019, 29, 939–950. [Google Scholar] [CrossRef]
  7. Zhu, L.; Song, T.; Gu, W. Research and Application on Pipeline Backfill Technology of SlurryComprsing Coal-based Solid Waste. Coal Technol. 2021, 40, 47–51. [Google Scholar]
  8. Cun, Z.; Bo, L.; Ziyu, S. Breakage mechanism and pore evolution characteristics of gangue materials under compression. Acta Geotech. 2022, 17, 4823–4835. [Google Scholar] [CrossRef]
  9. Zhang, C.; Zhao, Y.; Bai, Q. 3D DEM method for compaction and breakage characteristics simulation of broken rock mass in goaf. Acta Geotech. 2022, 17, 2765–2781. [Google Scholar] [CrossRef]
  10. Hao, L.; Zhang, B.; Bai, H.; Wu, J.; Meng, Q.; Ning, X. Surface Water Resource Protection in a Mining Process under Varying Strata Thickness—A Case Study of Buliangou Coal Mine, China. Sustainability 2018, 10, 4634. [Google Scholar]
  11. Teng, H.; Xu, J.; Xuan, D.; Wang, B. Surface subsidence characteristics of grout injection into overburden: Case study of Yuandian No. 2 coalmine, China. Environ. Earth Sci. 2016, 75, 530. [Google Scholar] [CrossRef]
  12. Xuan, D.; Xu, J. Longwall surface subsidence control by technology of isolated overburden grout injection. Int. J. Min. Sci. Technol. 2017, 27, 813–818. [Google Scholar] [CrossRef]
  13. Zhu, L.; Xu, J.; Ju, J.; Zhu, W.; Xu, J. The effects of the rotational speed of voussoir beam structures formed by key strata on the ground pressure of stopes. Int. J. Rock Mech. Min. 2018, 108, 67–79. [Google Scholar]
  14. Wang, Y. Three-dimensional spatial dynamic distribution model on porosity and permeability characteristics of porous media in goaf. J. Safety Sci. Technol. 2020, 16, 40–46. [Google Scholar]
  15. Wang, S.; Wang, D.; Cao, K.; Pi, Z. Distribution law of 3D fracture field of goaf and overlying strata. J. Cent. South. Univ. 2014, 45, 833–839. [Google Scholar]
  16. Wojtecki, U.; Goda, I.; Mendecki, M.J. The influence of distant coal seam edges on seismic hazard during longwall mining. J. Seismol. 2021, 25, 283–299. [Google Scholar] [CrossRef]
  17. Deng, Q.W.; Liu, X.H.; Lu, C.; Lin, Q.Z.; Yu, M.G. Numerical Simulation of Spontaneous Oxidation Zone Distribution in Goaf under Gas Stereo Drainage. Procedia Eng. 2013, 52, 72–78. [Google Scholar] [CrossRef] [Green Version]
  18. Zhang, C.; Bai, Q.; Zhu, C. A methodology for determining the size distribution of broken rock masses in longwall mining goaf. Geomech. Geophys. Geo. 2022, 8, 1–14. [Google Scholar] [CrossRef]
  19. Liang, B.; Wang, B.; Jiang, L.; Li, G.; Li, C. Broken expand properties of caving rock in shallow buried goaf. J. China Univ. Min. Technol. 2016, 45, 475–482. [Google Scholar]
  20. Jiao, Y.; Zhu, J.; Geng, Y.; Liang, Q.; Sun, X. Study on 3D distribution of porosity of overburden”horizontal three-zones”in goaf. Saf. Coal Mines 2021, 52, 159–165. [Google Scholar]
  21. Sun, J. Effect of Mining Pore Thickness in Longwall Goaf. Saf. Coal Mines 2019, 50, 49–53. [Google Scholar]
  22. Zheng, D.F.; Wang, B.D. Evaluation method for regulation and storage capacity of underground reservoir. J. Hydraul. Eng. 2004, 35, 56–62. [Google Scholar]
  23. Wang, B.F.; Liang, B.; Wang, J.G.; Sun, K.; Sun, W.; Chi, H. Experiment study on rock bulking of coal mine underground reservoir. Rock Soil Mech. 2018, 39, 4086–4092. [Google Scholar]
  24. Zhang, C.; Jia, S.; Bai, Q.; Zhang, H.; Chen, Y.; Jiao, Y. CFD-DEM Coupled Simulation of Broken Rock Mass Movement During Water Seepage in an Underground Goaf Reservoir. Mine Water Environ. 2021, 40, 1048–1060. [Google Scholar] [CrossRef]
  25. Liu, Y.; Shi, G.; Zhang, G.; Li, Z.; Song, X. Study on effect of working face length on overburden caving form and force chain arch characteristics. Saf. Coal Mines 2021, 52, 242–249. [Google Scholar]
  26. Pang, Y.; Li, Q.; Cao, G.; Zhou, B. Analysis and calculation method of underground reservoir water storage space composition. J. China Coal Soc. 2019, 44, 557–566. [Google Scholar]
  27. Bai, D.Y.; Ju, J.F.; Xu, J.L.; Li, J. Stability analysis of mine underground reservoir artificial dam in Lijiahao Mine. J. China Coal Soc. 2017, 42, 1839–1845. [Google Scholar]
  28. Xia, X.; Huang, Q. Study on the dynamic height of caved zone based on porosity. J. Min. Saf. Eng. 2014, 31, 102–107. [Google Scholar]
  29. Xu, J. Research and progress of coal mine green mining in 20 years. Coal. Sci. Technol. 2020, 48, 1–15. [Google Scholar]
  30. Yang, S.; Bai, Y.; Li, J. Comprehensive analysis onpresent status of mine backfill mining and prospects. Coal Eng. 2013, 45, 4–6. [Google Scholar]
  31. Zhu, L.; Pan, H.; Gu, W.; Zhao, M.; Zhang, X.; Xu, K. Experimental study on flow and diffusion law of gangue filling slurryin caving zone. J. China Coal Soc. 2021, 46, 629–638. [Google Scholar]
  32. Zhu, W.; Xu, J.; Lai, W.; Wang, Z. Research of isolated section-grouting technology for overburden bed separation space to reduce subsidence. J. China Coal Soc. 2007, 458–462. [Google Scholar]
  33. Zhou, H.; Hou, C.; Sun, X. Solid Waste Paste Filling for None-Village-Relocation Coal Mining. J. China Univ. Min. Technol. 2004, 05, 30–34+53. [Google Scholar]
  34. Yan, L. Study on mine pressure with similar physical model. Min. Saf. Environ. Prot. 2009, 36, 20–22+34+91. [Google Scholar]
  35. Lin, Y. Experimental Rock Mechanics—Simulation Study; Coal Industry Press: Beijing, China, 1984. [Google Scholar]
  36. Hai-Feng, L.; Kai, Z.; Jin-Long, Y.; Wnga, A. A study on the optimal selection of similar materials for the physical simulation experiment based on rock mineral components. Eng. Fail. Anal. 2022, 140, 106607. [Google Scholar] [CrossRef]
Figure 1. Development process of underground filling with coal gangue.
Sustainability 15 02508 g001
Figure 2. Schematic diagram of slurry filling technology.
Sustainability 15 02508 g002
Figure 3. Determination method of lag distance of gangue slurry filling.
Sustainability 15 02508 g003
Figure 4. Schematic diagram of adjacent grouting filling technology: (a) profile; (b) plan.
Sustainability 15 02508 g004
Figure 5. Failure characteristics of stope overburden during the advancing of the working face; (a) working face advancing 60 m; (b) working face advancing 120 m; (c) working face advancing 180 m; (d) working face advancing 300 m.
Sustainability 15 02508 g005aSustainability 15 02508 g005b
Figure 6. Displacement curve of the roof in different layers.
Sustainability 15 02508 g006
Figure 7. Bulking coefficient at different heights.
Sustainability 15 02508 g007
Figure 8. Similar simulation experiment equipment: (a) physical model; (b) XTDIC three-dimensional strain measurement system.
Sustainability 15 02508 g008
Figure 9. Excavation process of similar model. (a) Large area collapse of direct roof; (b) first periodic pressure; (c) the second periodic pressure; (d) the third periodic pressure; (e) mining is completed.
Sustainability 15 02508 g009
Figure 10. Displacement curve of coal seam roof.
Sustainability 15 02508 g010
Figure 11. Bulking coefficient of different excavation times.
Sustainability 15 02508 g011
Figure 12. Zoning of slurry filling space in strike direction.
Sustainability 15 02508 g012
Figure 13. Adjacent grouting filling site. (a) Underground filling station; (b) filling pipeline pressure; (c) filling drilling hole.
Sustainability 15 02508 g013
Table 1. Physical and mechanical parameters of coal and rock strata in the numerical calculation model.
Rock StratumBulk Modulus/GPaShear Modulus/GPaDensity/g/cm3Cohesive Strength/MPaTensile Strength/MPaInternal Friction Angle/°
Medium grained sandstone5.915.812.663.151.6837.2
Fine grained sandstone 17.873.632.553.891.7536.9
siltstone6.465.892.514.872.1737.5
Fine grained sandstone 26.894.752.633.652.1937.1
coal2.351.421.332.991.1036.2
Mudstone 13.642.102.363.201.5034.8
Mudstone 22.231.192.452.811.3233.1
Fine grained sandstone 35.354.892.554.762.1837.5
Table 2. Proportioning scheme of similar materials at 1:120.
NumberLithologyThicknessBuried DepthModel ThicknessPaving ThicknessMaterial NumberMaterial/kg
Total WeightRiver SandGypsumWhite Powder
16mudstone13.5460.8511.251.5 (7)/0.5846108.00 86.40 8.64 12.96
15Fine
sandstone
10.2471.058.51.5 (5)74681.60 57.12 9.79 14.69
14Sandy mudstone11.75482.89.791.5 (6)85593.98 75.19 9.40 9.40
13Medium grained sandstone53.1535.944.251.5 (29)937424.80 382.32 12.74 29.74
12mudstone16.7552.613.911.5 (9)846133.54 106.83 10.68 16.02
11Fine
sandstone
6.2558.85.161.6 (3)74649.54 34.68 5.94 8.92
10Siltstone4.25633.51.6 (2)82833.60 26.88 1.34 5.38
9Fine
sandstone
85716.671.5 (4)74664.03 44.82 7.68 11.53
8mudstone10.5581.58.751.6 (5)84684.00 67.20 6.72 10.08
7Fine
sandstone
4.4585.93.671.6 (2)74635.23 24.66 4.23 6.34
6Siltstone2.3588.21.91.9 (1)82818.24 14.59 0.73 2.92
5Fine
sandstone
7.2595.461.4 (4)73757.60 40.32 5.18 12.10
4Siltstone16.8612.2141.5 (9)828134.40 107.52 5.38 21.50
3Fine
sandstone
2.7614.92.251.0 (2)74621.60 15.12 2.59 3.89
2coal seam4.7619.63.91.5 (2)/0.520:1:537.44 28.80 1.44 7.20
1Carbonaceous mudstone2.46222284619.20 15.36 1.54 2.30
Remarks: (1) The density of river sand is 1.6 g/cm3, and the density of coal is 1.5 g/cm3;.
Disclaimer/Publisher’s Note: The statements, opinions and data contained in all publications are solely those of the individual author(s) and contributor(s) and not of MDPI and/or the editor(s). MDPI and/or the editor(s) disclaim responsibility for any injury to people or property resulting from any ideas, methods, instructions or products referred to in the content.

